Water in the terrestrial planet-forming zone of the PDS 70 disk
keywords:
Protoplanetary disks, Planet formation, Infrared spectroscopyTerrestrial and sub-Neptune planets are expected to form in the inner (AU) regions of protoplanetary disks.[1] Water plays a key role in their formation,[2, 3, 4] although it is yet unclear whether water molecules are formed in-situ or transported from the outer disk.[5, 6] So far Spitzer Space Telescope observations have only provided water luminosity upper limits for dust-depleted inner disks,[7] similar to PDS 70, the first system with direct confirmation of protoplanet presence.[8, 9] Here we report JWST observations of PDS 70, a benchmark target to search for water in a disk hosting a large (AU) planet-carved gap separating an inner and outer disk.[10, 11] Our findings show water in the inner disk of PDS 70. This implies that potential terrestrial planets forming therein have access to a water reservoir. The column densities of water vapour suggest in-situ formation via a reaction sequence involving O, H2, and/or OH, and survival through water self-shielding.[5] This is also supported by the presence of CO2 emission, another molecule sensitive to UV photodissociation. Dust shielding, and replenishment of both gas and small dust from the outer disk, may also play a role in sustaining the water reservoir.[12] Our observations also reveal a strong variability of the mid-infrared spectral energy distribution, pointing to a change of inner disk geometry.
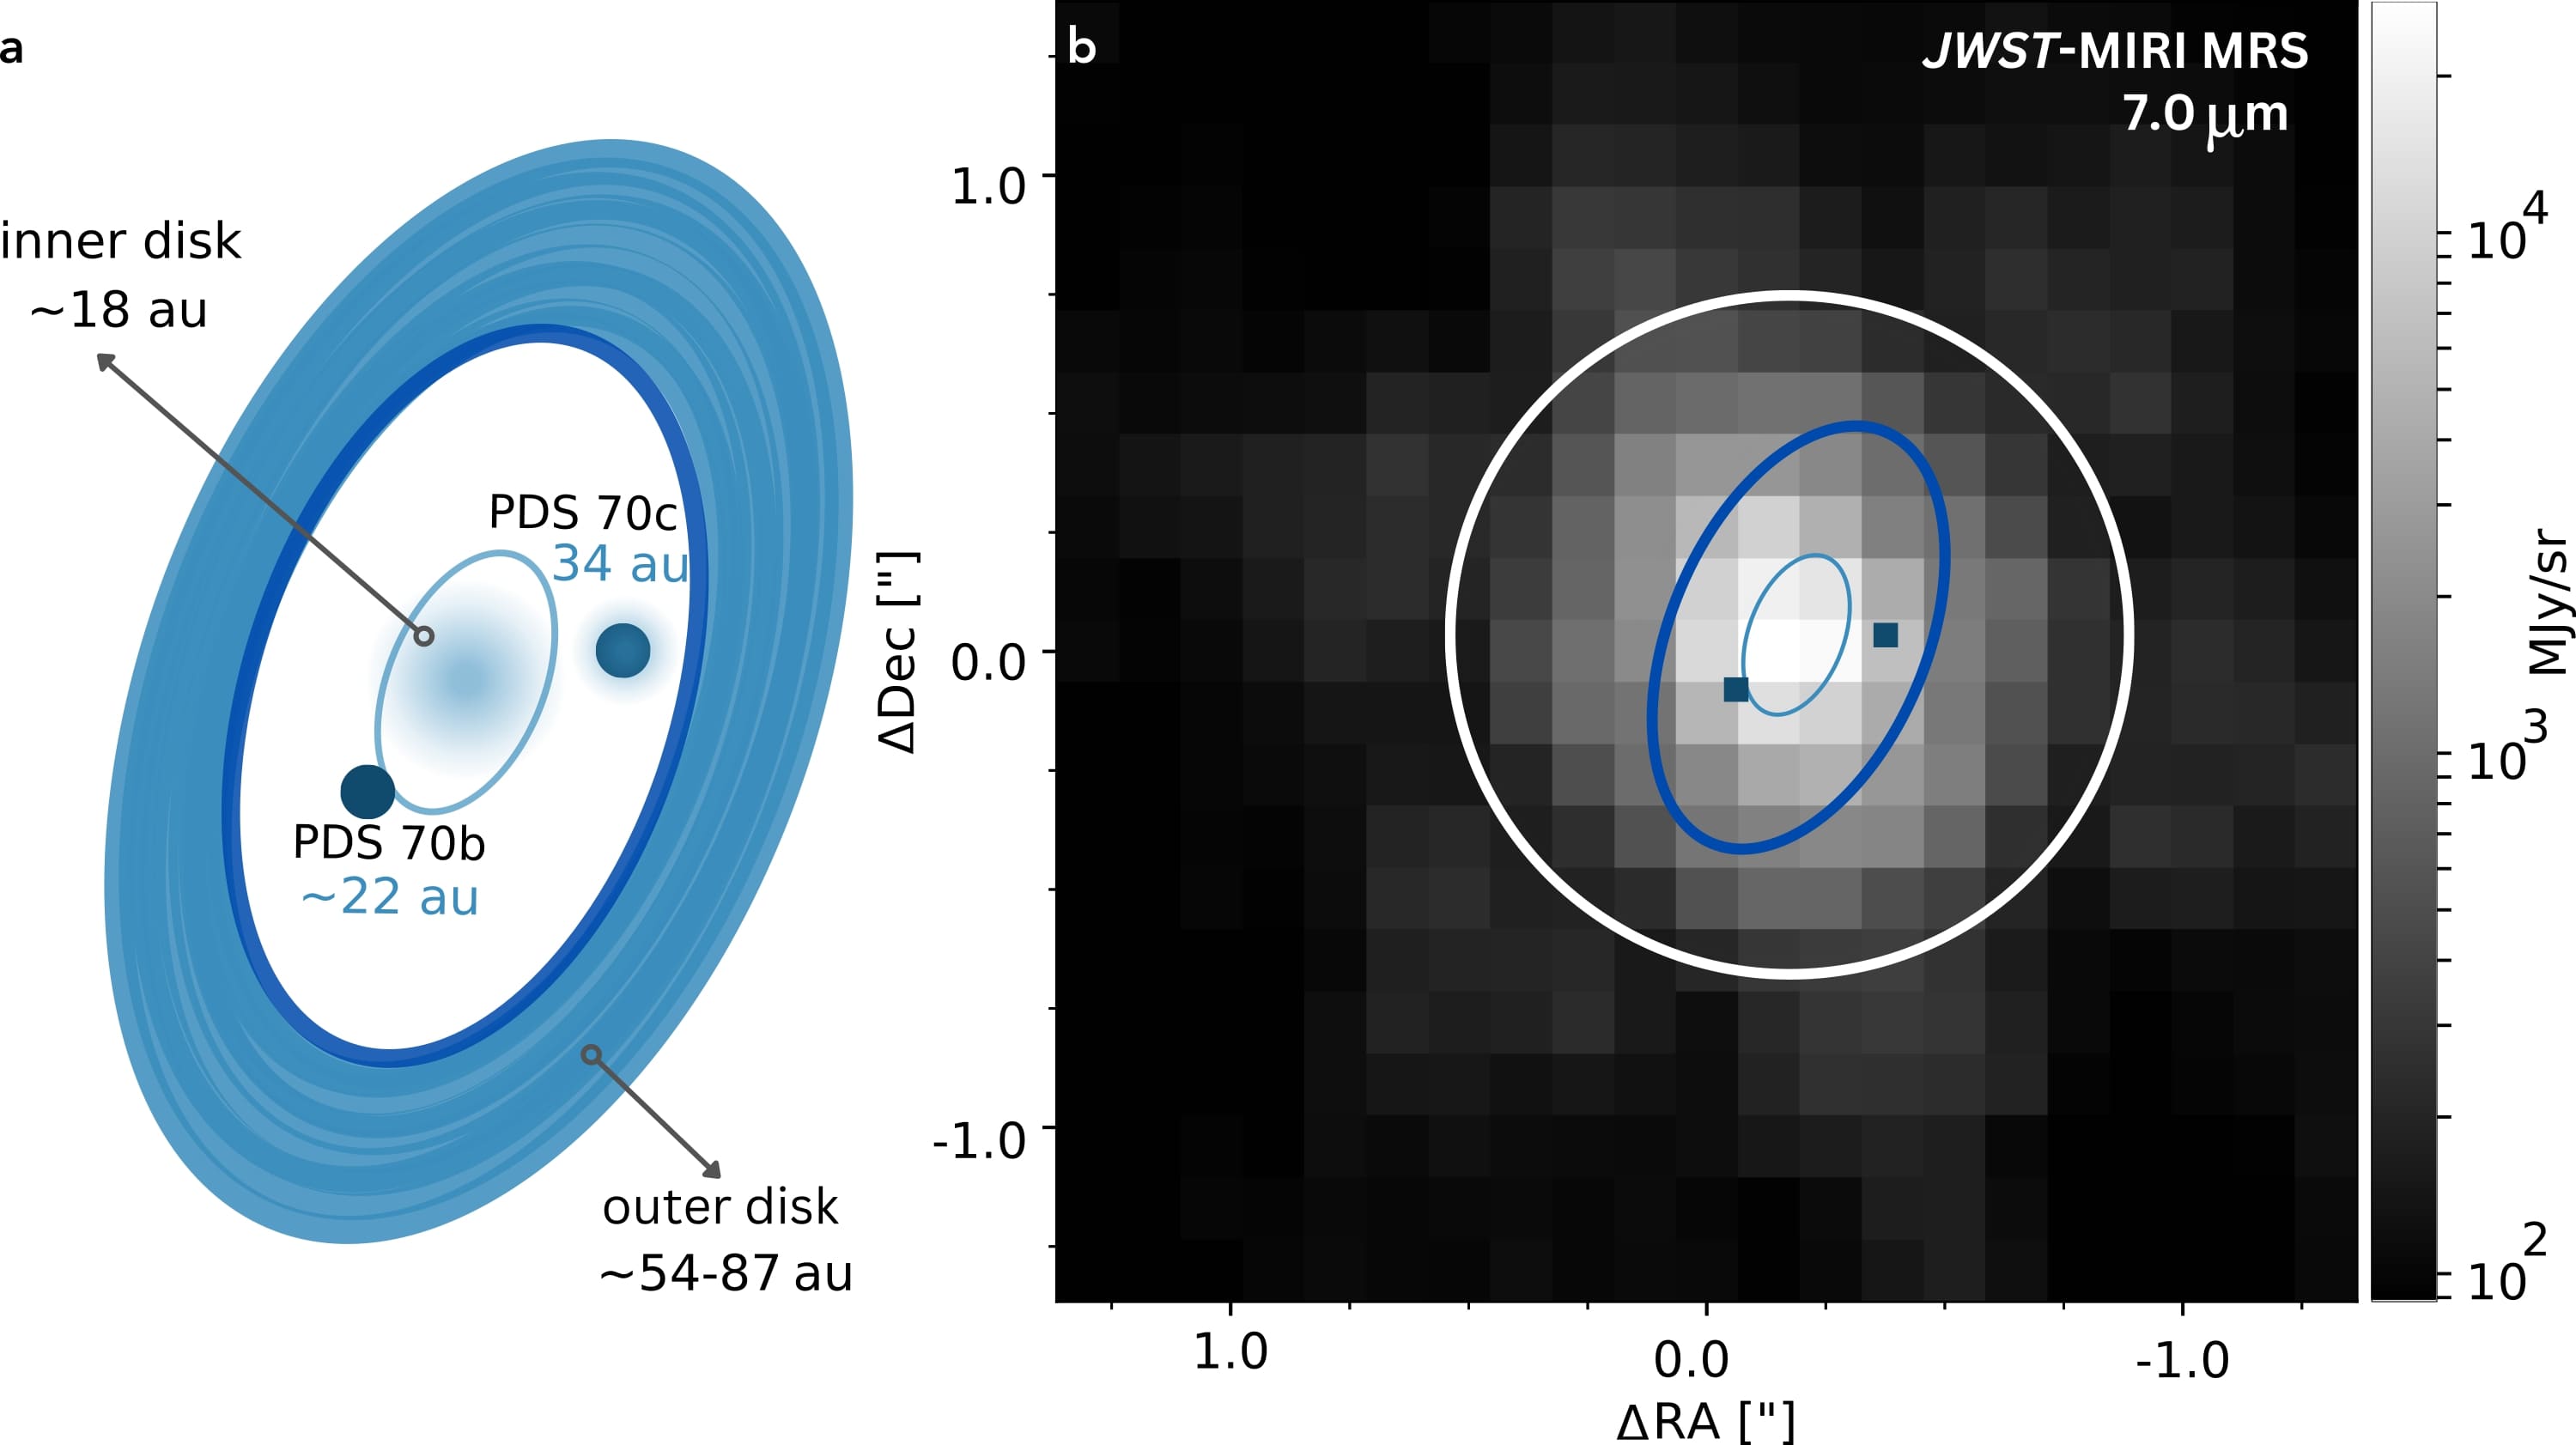
Observations of PDS 70 were taken with the JWST Mid-InfraRed Instrument (MIRI)[13, 14] Medium Resolution Spectrometer[15] (MRS; spectral resolving power ) as part of the guaranteed time MIRI mid-INfrared Disk Survey (MINDS; see Methods and Extended Data Fig. 1). The complete spectrum of PDS 70 shows several distinct traits (Fig. 1), which stands out with respect to other T Tauri disks.[16, 17]
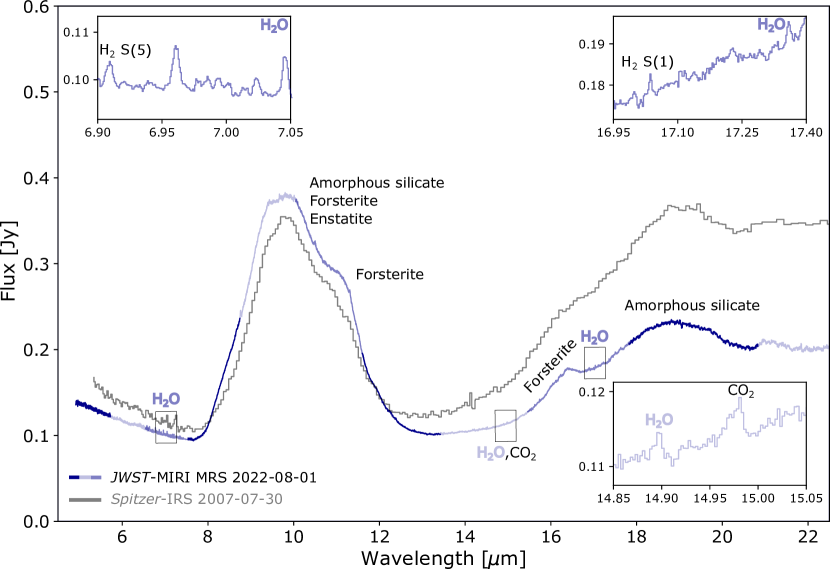
A significant flux offset - up to a factor of 1.5 at wavelengths m - is found between the MIRI and the archival Spitzer InfraRed Spectrograph (IRS) low-resolution () spectra recorded with 15 years and one day time difference. This discrepancy is too large to be explained by calibration uncertainties; the absolute uncertainty for both IRS and MIRI is for the m range.[18] Similarly, the difference in aperture size of the two spectrographs cannot account for such an offset. Hence, with the current MIRI data reduction, time variability is the most likely explanation for the observed flux differences.
Variability in the mid-IR observed with Spitzer-IRS has been mainly attributed to short-wavelength stellar irradiation or to dynamical changes in the inner disk geometry due to the presence of planets.[19, 20] In the case of PDS 70, stellar irradiation is excluded as it would cause an overall increase or decrease in flux contrary to what is observed with the Wide-field Infrared Survey Explorer (WISE) time-series observations (Extended Data Fig. 6). PDS 70 is known to be in a late stage of accretion - with an estimated waning accretion rate[21, 22] of yr-1 making it unlikely to explain the significant flux difference. Changes in the scale height of the inner disk wall emitting at shorter wavelengths (m) can be responsible for shadowing the disk material located further out, resulting in less emission at wavelengths beyond m (also referred to as "seesaw-like" variability[19]). However, for PDS 70 a complete seesaw-like profile is not observed as there is no corresponding increase in flux at the shorter wavelengths. Time variability is also supported by the aforementioned WISE observations which indicate that such variability occurs on short timescales (yr) and that it may indeed be attributed to occulting material located close to the star (AU).
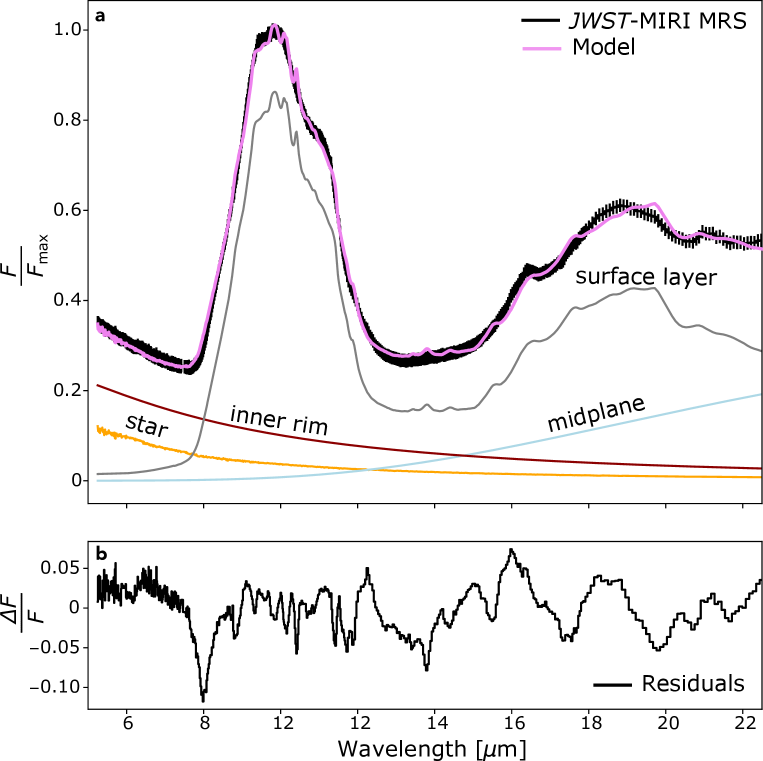
The MIRI spectrum of PDS 70 clearly shows the presence of silicate dust grains that have undergone significant thermal processing (Fig. 1). We attribute the crystalline dust features to enstatite at 9.40m and forsterite at 11.30m and 16.40m. The observed dust continuum is well reproduced with a three-component disk model, with a K surface layer accounting for the bulk of the observed emission (Fig. 2).
The MIRI spectrum also reveals a wealth of water lines, particularly in the 7 m spectral window (Fig. 3). This indicates the presence of a water reservoir in the terrestrial region of a disk already hosting two or more protoplanets. As such, it also provides important clues to theories on the origin of water during terrestrial planet formation in the solar system.[23, 24] We focus on the ro-vibrational transitions of the bending mode of para- and ortho-water in the 7 m region where the brightest lines are observed and contamination by the stellar atmosphere is negligible (Extended Data Fig. 3). This includes strong water blends dominated by lines with upper energy levels K. Weaker lines are also detected at the 1 mJy level, some of them corresponding to more excited levels up to K.
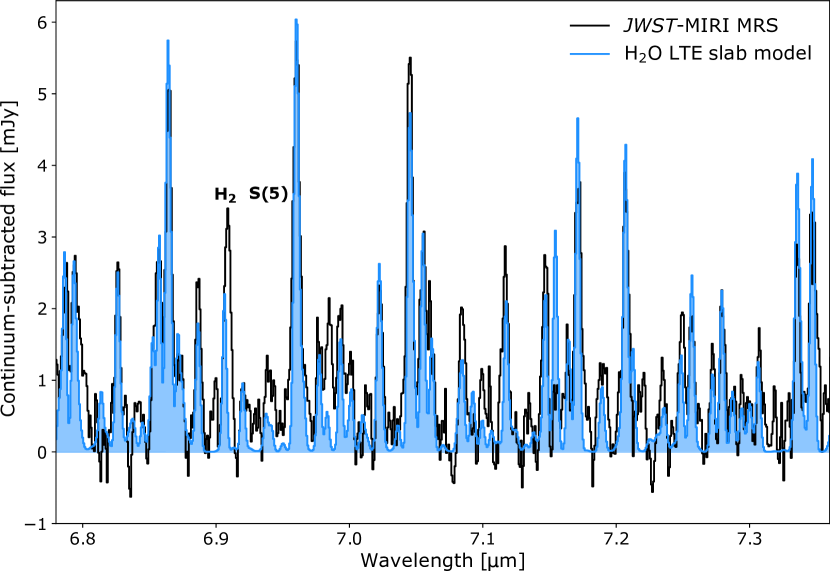
Further insight into the origin of water emission is obtained from zero-dimensional slab modeling which also has been used to interpret Spitzer spectroscopic data.[25] The synthetic spectrum of water is calculated from a plane-parallel slab model, where the level populations are in Local Thermodynamic Equilibrium (LTE) at a single excitation temperature . The other fitting parameters are the line-of-sight column density within an effective emitting area given by its radius , and the intrinsic line broadening assumed to be km/s.[25] Note that does not need to correspond to a disk radius, but could also represent an annulus with the same area or an emission spot breaking the axisymmetry. The best-fit model is then obtained by minimizing the reduced between measured and model line fluxes over the individual spectral window around each H2O line (Extended Data Fig. 4).
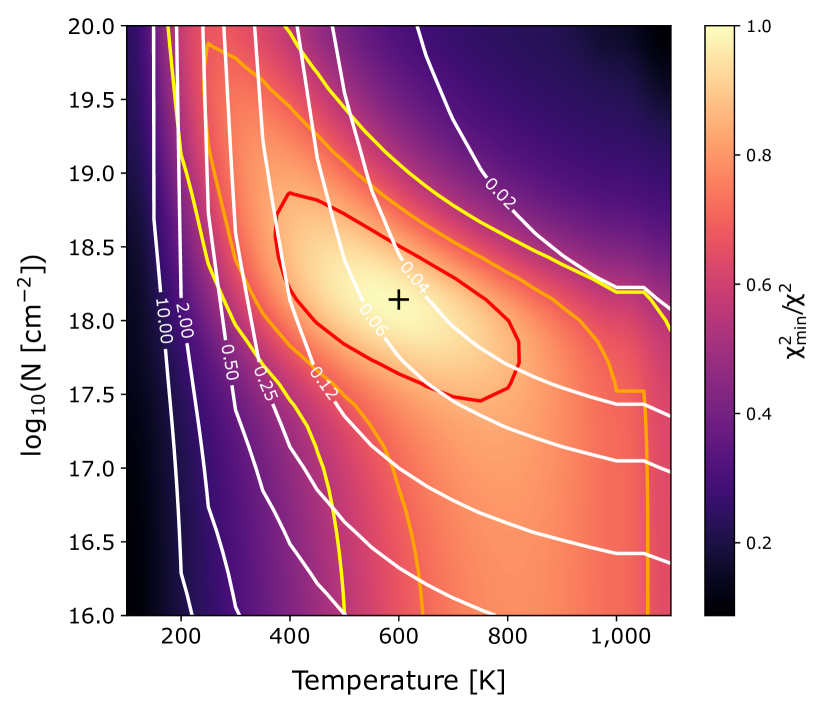
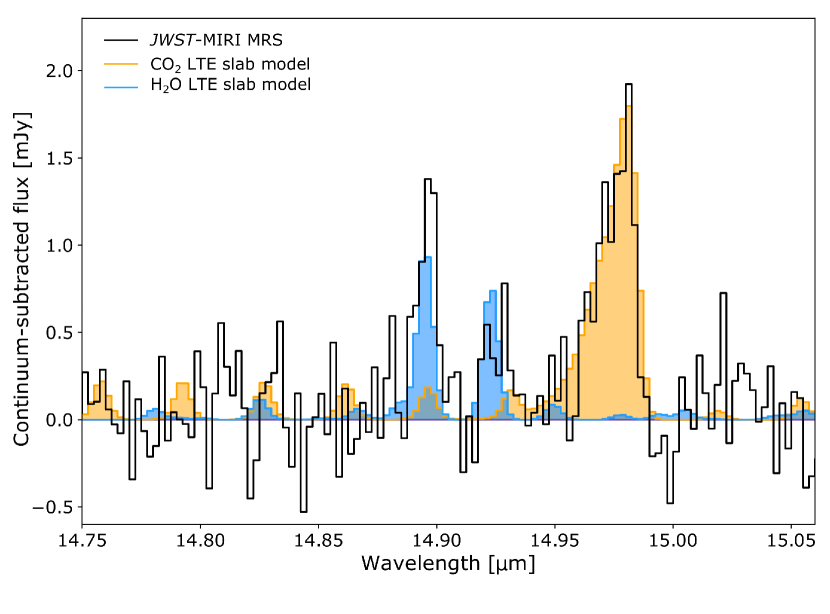
The observed H2O spectrum in the 6.787.36 m spectral region is best fitted with a slab of gas at K, with an emitting area of radius AU, and a column density of cm-2. The temperature is mostly determined by the ratio between lines of different , for example, the series of lines in the 7.3m region. The column density is set by the ratio between the weaker lines and indicates that the brightest lines are optically thick. The emitting area is constrained by matching the fluxes of the optically thick lines, and points toward a compact emission region. This is further supported by the fact that the detected lines are broad (m); if the line broadening is caused by the gas kinematics, the FWHM of the line would be about km/s, corresponding to a Keplerian radius of 0.1 AU, consistent with the emitting area deduced from our fit after correction for disk inclination .[11] Interestingly, we find that our best-fit LTE model of the water emission in the 7m region reproduces reasonably well water rotational lines at 15m, suggesting that all water emission in the MIRI spectral range originates from inside AU under LTE conditions (Extended Data Fig. 5).
Besides water in the 7m, 15m, and 17m regions, other species have been identified whose analysis is postponed to a future study. CO2: The fundamental Q-branch of CO2 corresponding to the bending mode is detected at 14.96 m (Extended Data Fig. 5). Interestingly, the width of this feature is sensitive to the temperature and indicates cooler gas of K in the optically thin regime. H2: The pure rotational molecular hydrogen H2 and H2 lines are detected at 6.91m and 17 m (Fig. 1). We note that the H2 , , and lines coincide with the broad silicate emission feature and thus establishing their presence needs to await an in-depth analysis of this dust feature.
Spitzer-IRS observations detected water in 50% of dust-rich inner disks around T Tauri stars [26], but obtained only upper limits for disks with large inner dust gaps or cavities defined by a mid-IR spectral index > 0.9, where is the slope of the spectrum between 13 and 30 m (Fig. 4).[7] The detection of water vapour in the PDS 70 MIRI spectrum demonstrates that PDS 70 has maintained to some degree the physical and chemical conditions of dust-rich inner disks in its terrestrial planet-forming zone despite the presence of a remarkably large gap (see ‘Origin of water in PDS 70’ in Methods). Our LTE slab model only provides a first quantitative analysis of the H2O emission. Non-LTE effects could lead to sub-thermal line emission which would make our estimated emitting area a lower limit. In T Tauri disks with strong radial temperature gradients, the water lines are expected to originate from different regions of the disk depending on their upper energy level and Einstein- coefficients.[27] Detailed modelling using a realistic disk structure and including non-LTE effects such as IR radiative pumping is needed in the future to further constrain the distribution of H2O across the inner disk. However, this first analysis already proofs that the inner disk of PDS 70 is rich in water and the inferred slab model parameters are roughly consistent with a detailed thermo-chemical model [28] (Portilla-Revelo, priv. communication, 2023).
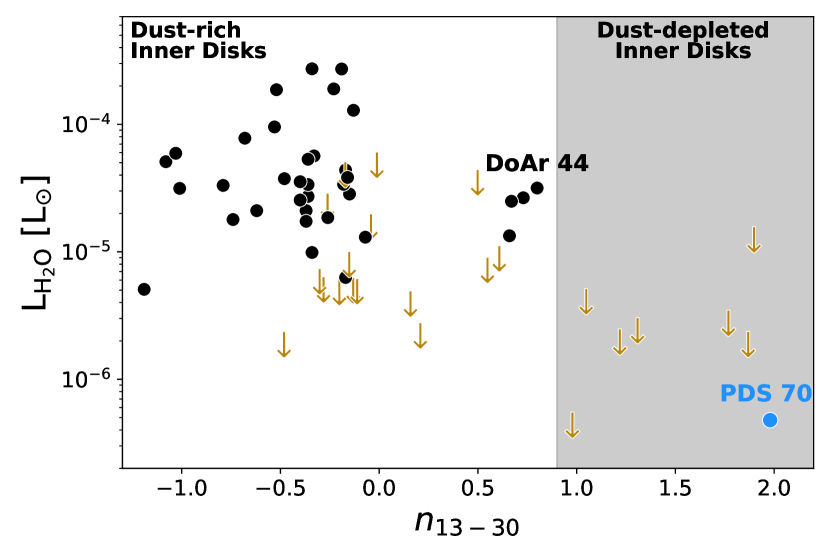
The luminosity of the 17 m water lines is two orders of magnitude weaker for PDS 70 than DoAr 44.[29, 7] DoAr 44 is a system with similar properties to PDS 70, but characterized by (Fig. 4). This result points to a colder water reservoir in PDS 70, and is consistent with the lower luminosity and lower accretion rate of PDS 70.[30, 21] This work opens a new window on the origin of water in protoplanetary disks by showing that MIRI-MRS can now detect very weak (mJy) water lines in the innermost regions of disks with large gaps, and hence that the presence of water in the terrestrial planet-forming zone of dust-depleted inner disks is not as rare as previously thought.
Methods
PDS 70 system. PDS 70 (V1032 Cen) is a K7-type star in the Upper Centaurus-Lupus subgroup (d=113.40.5 pc [36]) in a late stage of accretion[22] with an estimated age of 5.41.0 Myr.[37] The disk around PDS 70[38, 39, 40] hosts two actively accreting protoplanets: PDS 70 b and PDS 70 c which reside in a AU-annular gap between an inner and outer disk.[8, 9] The presence of an inner dusty disk in the PDS 70 system has been inferred from both near-IR scattered light and ALMA images.[10, 11, 12] The 855 m dust continuum emission from the innermost disk regions is confined within the orbit of PDS 70 b (AU; Extended Data Fig. 1), putting an upper limit to the inner disk radial extent of 18 AU.[12] A population of small dust grains may be responsible for the observed inner disk emission although the current dust mass estimates could support the simultaneous presence of small and large dust grains.[41]
Observations and data reduction. The PDS 70 disk (CD-40-8434) was observed with MIRI[13, 14] on 1 August 2022 as part of the Guaranteed Time Observation (GTO) programme 1282 (PI: Th. Henning) with number 66. The disk was observed in FASTR1 readout mode with a 4-point dither pattern in the negative direction for a total on-source exposure time of 4,132 s. The Medium Resolution Spectroscopy (MRS)[15] mode was used, which has four Integral Field Units (IFUs). Each IFU (referred to as channel) covers a different wavelength range and splits the field of view into spatial slices. Calibration and processing of IFU observations produces 3-dimensional spectral cubes. The latter are used to extract a final spectrum covering the MIRI 4.922.5 m range and is a composite of the four IFUs: channel 1 (4.97.65 m; 3400), channel 2 (7.5111.71 m; 3000), channel 3 (11.5518.02 m; 2400), and channel 4 (17.7122.5 m; 1600). Each channel is in turn composed by three sub-bands: SHORT (A), MEDIUM (B), and LONG (C) leading to a total of twelve wavelength bands.
We processed the PDS 70 data using a hybrid data reduction pipeline made from the combination of the JWST Science Calibration pipeline[42] (v1.8.4) stages 1 to 3, with dedicated routines based on the Vortex Image Processing (VIP) package[43, 44] for bad pixel correction, background subtraction and removal of spikes affecting the final spectrum. Specifically, data reduction proceeded as follow: (i) the class Detector1 of the JWST pipeline was used to process uncalibrated raw data files using Calibration Reference Data System (CRDS) context jwst_1019.pmap and default parameters; (ii) apart from pixels flagged in the Data Quality (DQ) extension, we identified additional bad pixels with both an iterative sigma clipping algorithm and through a cross-shaped match filter, and corrected them using a 2D Gaussian kernel; (iii) Spec2 was then used with default parameters, but the background subtraction was skipped, and dedicated reference files[45] for photometric and fringe flat calibrations were adopted; (iv) as no dedicated background observation was taken, we leveraged the four-point dither pattern to obtain a first guess on the background map, then refined it using a median-filter which both smoothed the background estimate and removed residual star signals from it; (v) Spec3 was then run with default parameters, apart from the master_background and outlier_detection steps which were turned off, in the latter case to avoid spurious spectral features resulting from under-sampling of the Point Spread Function (PSF); (vi) we recentered the spectral cubes by applying the shifts maximizing the cross-correlation between cube frames, and found the location of the PSF centroid with a 2D Gaussian fit on the median image of each aligned cube; (vii) spectra were then extracted with aperture photometry in -FWHM apertures centered on the centroid location (with the FWHM equal to 1.22 with the telescope diameter equal to 6.5 m), corrected for both aperture size using correction factors[18], and spikes affecting individual spaxels included in the aperture; (viii) spectra were finally corrected for residual fringes at the spectrum level and the bands were stitched together based on the level of the shorter wavelength bands (these rescaling factors were systematically within 3% of the photometric solution). Spurious data reduction artefacts were masked at 5.12m, 5.90m, 7.45m, 7.50m. The uncertainty associated to each photometric measurement considers both Poisson and background noise, combined in quadrature. The former is an output from the JWST pipeline, while for the latter we propagated our background estimate obtained in step (iv) through Spec3, and considered the standard deviation of the fluxes inferred in independent -FWHM apertures as a proxy for the background noise uncertainty. The final relative uncertainties range from 0.1% to 1.1% with respect to the continuum at the shortest and longest wavelengths considered in this work (4.9 and 22.5m, respectively).
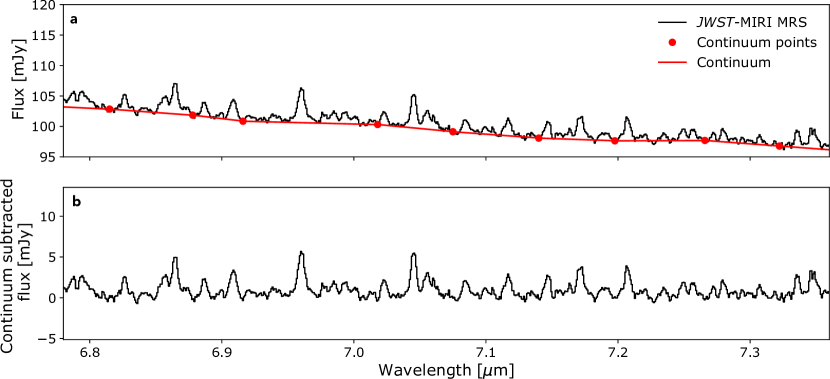
Local continuum fit. Extended Data Fig. 2 shows the local baseline fit for the 7 m region. The continuum level is determined by selecting line-free regions and adopting a cubic spline interpolation (scipy.interpolate.interp1d). This continuum is then subtracted from the original data to produce the spectrum shown in Fig. 3.
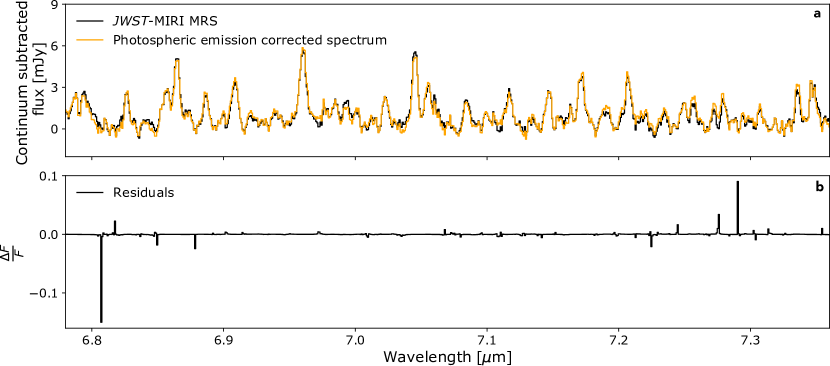
Correction for the photospheric emission. The observed near-IR colour index, (2MASS), indicates a small colour excess, which could be due to either interstellar extinction or a true excess in the band, or a combination of the two. By assuming that the brightness in the band is essentially due to photospheric emission we can, by using a model atmosphere kindly provided by P. Hausschildt (personal communication, 2023), extrapolate the contribution into the mid-IR spectral region. The parameters used for the model atmosphere of the PDS 70 K7-star are an effective temperature K, surface gravity log, and solar metallicity. At m the photospheric contribution amounts to 56 mJy, i.e., 44% of the observed flux density. At longer wavelengths, in the m region where the water emission is detected, the photosphere amounts to one-third of the observed flux density and the subtraction of the photospheric contribution just marginally alters the continuum-subtracted spectrum (Extended Data Fig. 3).
Slab models fits. The molecular lines are analysed using a slab approach that takes into account optical depth effects. The level populations are assumed to be in Local Thermodynamical Equilibrium (LTE) and the line profile function to be Gaussian with a full-width half maximum of km s-1 (km/s).[25] The line emission is assumed to originate from a slab of gas with a temperature and a line of sight column density of . Under these assumptions and neglecting mutual line opacity overlap, the frequency-integrated intensity of a line is computed as follows:
| (1) |
where is the Planck function, is the rest wavelength of the line, and is the optical depth at the line center , with:
| (2) |
In this equation, and denote the level population of the lower and upper states, and and their respective statistical weights, and the spontaneous downward rate of the transition. The line intensity is then converted into integrated flux assuming an effective emitting area of and a distance to the source as:
| (3) |
We note that neglecting mutual line overlap for H2O when calculating the line intensity is a valid approximation for N(H2O)cm-2 and significantly reduces the computational time.[46] Finally, the spectrum is convolved and sampled in the same way as the observed spectrum[47] and all lines are then summed to prepare a total synthetic spectrum. The molecular data, i.e., line positions, Einstein coefficients and statistical weights stem from a previous work.[48]
Fitting procedure for H2O vapour lines. The LTE slab model described above is then used to fit the H2O lines in the 6.787.36m region following a method. First, an extended grid of models is computed varying the total column density from to cm-2 in steps of 0.17 in log10-space and the temperature from 1001400 K in steps of 50 K. We further assume an ortho-to-para ratio of 3. For each set of free parameters (), a synthetic spectrum is calculated at the spectral resolving power and rebinned to the spectral sampling of the observed spectrum using the slabspec python code.[49] The adopted spectral resolution is lower that the nominal MIRI-MRS spectral resolution in channel 1;[15] it was selected to account for the observed line broadening. This spectrum is further used to compute the value on a spectral channel basis. Specific spectral windows are chosen to avoid contamination by other gas features. This includes all spectral channels falling within 0.02 m ( km/s) of any hydrogen recombination lines and a 0.01 m wide spectral window at the position of the (5) line of H2 at 6.91 m. In order to mitigate the errors induced by the continuum subtraction procedure, we also include only spectral elements falling within 0.004 m of a water line. For each value of (, ), the is then minimized by varying the emitting size . The resulting map is shown in Extended Data Fig. 4 together with the best fit emitting radius. The confidence intervals are estimated following a previous work[50] and using a representative noise level of mJy. We note that due to the large number of lines in this crowded region, there is little space to determine the noise on the continuum. Therefore, we estimate the noise level between m and m to avoid contamination by H2O and hydrogen lines.
Origin of water in PDS 70. At the typical densities of inner disk regions (cm-3) the chemistry can rapidly reach steady-state conditions and water vapour can form from a simple reaction sequence involving O, H2, and OH. Water and OH absorb efficiently in the UV (i.e., water and OH shielding), ensuring the survival of water molecules even in regions of reduced dust opacity.[5] This mechanism by itself is able to account for the column densities of water vapour detected in this work and is supported by the presence of CO2 emission. Small grains in the inner disk provide additional UV shielding. One question that naturally arises is whether the water vapour in PDS 70 originated prior to the formation of the giant protoplanets within the gap or whether there is a continuous supply of gas from the outer to the inner disk regions. ALMA high spatial resolution CO observations reveal the presence of gas inside the gap.[11, 51] Observations and models find the gap to be gas depleted[11] (2-3 orders of magnitude assuming an surface density profile) and dust depleted[52], but not empty. One possibility could be that a population of water-containing dust particles is able to filter through the orbits of PDS 70 b and PDS 70 c, enriching the inner disk reservoir.[12] Experimental evidence suggests that water chemically bound to complex silicates can be preserved to temperatures up to K[53, 54] and thus survive in the regions probed by our observations inside the water snowline. We note that some degree of dust filtering is expected with gas replenishment, as small dust particles can couple to the gas. Therefore a replenishment of both gas and dust from the outer disk to sustain the water reservoir and hence PDS 70’s accretion rate is possible.
Fitting procedure for the dust continuum. The m dust continuum is analysed using a two-layer disk model for the dust emission.[55] This model was successfully applied to Spitzer-IRS spectra of planet forming disks;[56] we follow the same modeling approach here. We rebin the spectrum by averaging 15 spectral points and assign errors to the rebinned spectral points assuming a normal error distribution with equal weights for each individual spectral element. The stellar photospheric emission is represented by a stellar atmosphere model fitted to optical and near-infrared photometry. The disk model has three spectral components: (1) a hot inner disk , (2) an optically thick mid-plane disk layer , and (3) an optically thin warm disk surface layer . The dust grains representing the disk components are assumed to have power-law temperature distributions, and each is characterized by a minimum and a maximum temperature . The disk surface layer is assumed to consist of a number of dust species with different chemical compositions, and with a fixed number of grain sizes , all emitting at the same temperatures. The total disk flux can then be written as:
| (4) |
where
| (5) |
and Bν() is the Planck function, is the power law exponent for the temperature gradient in the disk surface layer, are the opacities in cm2g-1 of dust species with grain size , is the distance to the star, and Di,j are normalization factors.[55] We use three grain compositions (with SiO2, SiO3, and SiO4 stochiometry)[57, 58, 59, 60, 61] and both amorphous and crystalline lattice structures to capture the rich spectral structure evident in the MIRI data. The choice of this set of compositions is based on previous analyses,[56] that showed that this set of materials is able to capture most spectral variations in planet-forming disks observed with Spitzer-IRS. We use either 2 or 3 grain sizes (i.e., m, m, m) for each of the dust species. In total the model has 23 fitting parameters. We use the MultiNest Bayesian fitting algorithm[62] and the PyMultiNest package[63] to find the best-fit parameters. The resulting fit and the separate spectral components (star, inner rim, midplane, surface layer) are shown in Fig. 2.
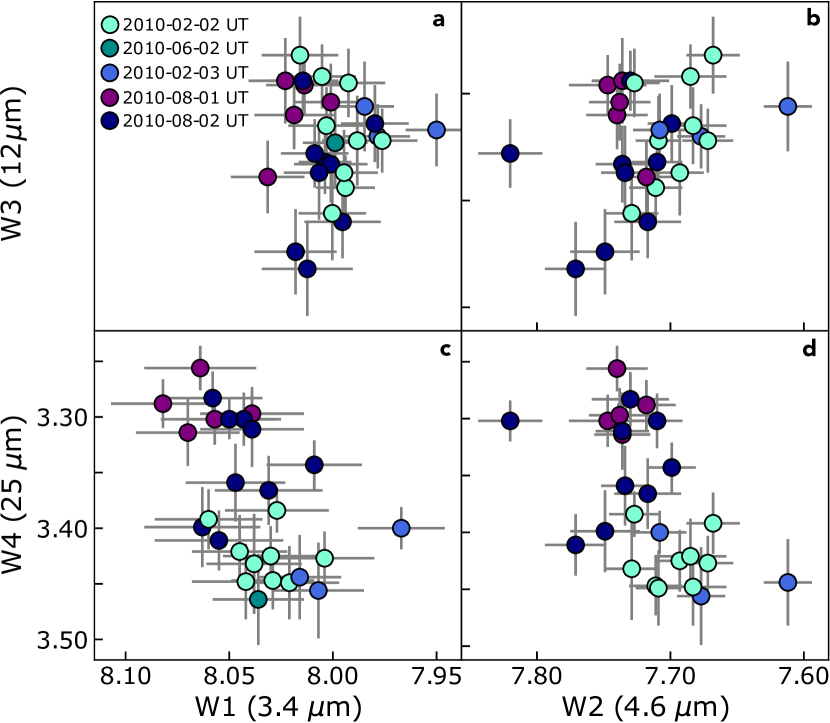
WISE Time-series observations. Extended Data Fig. 6 reports WISE Time-series observations of PDS 70. Observations were executed on 2-3 February and 6 February 2010, and on August 1-2, 2010. We note that the source is highly variable and that WISE 4 (W4; m) is anticorrelated with WISE 1 (W1; m) and WISE 2 (W2; m). Such variability may be "seesaw"-like[19], where changes in the scale height of the inner disk wall shadow the disk material located further out. However, a complete "seesaw" profile is not observed, as at wavelengths shortwards of 8m the MIRI spectrum lies above the IRS spectrum (Fig. 1). This is not surprising as the wavelength of the "pivot" point (i.e., the wavelength at which a shift in emission is observed) is dependent on the location of the occulting material with respect to the star, the stellar luminosity and the inclination of the system, with highly inclined systems showing a more complete "seesaw" than more face-on systems such as PDS 70 ([11]). Interestingly, WISE 3 (W3; m) is not anticorrelated with WISE 1 and WISE 2 due to the dominant 10m silicate band which indeed shows a minor offset compared to the longer wavelengths. It indicates that the material contributing to the 10m emission is not shadowed. This behaviour is seen if the emission arises from warmer dust closer to the star than the occulting material, or further above the disk midplane.
We also note that the difference in aperture size of Spitzer-IRS and MIRI-MRS cannot explain the observed variability. The Spitzer-IRS low-resolution spectrograph has a slit width of 3.6′′ for wavelengths shortwards of 14m and 10.2′′ for wavelengths longwards of 14 m. While the maximum aperture of Spitzer-IRS at longer wavelengths is larger than that of MIRI-MRS, this is not the case for the shorter wavelengths where the slit widths are similar for both observatories ( vs ). However, a flux offset is also observed in this spectral region. Additionally, in the case that the long wavelength excess would arise from an extended component, a jump in flux level at 14 m - where the aperture size changes - would be present in the IRS data, but it is absent.
Data Availability
The original data analysed in this work are part of the Guaranteed Time Observation (GTO) program 1282 (PI: Th. Henning) with number 66 and will become public on 2 August 2023 on the MAST database (https://mast.stsci.edu). The portion of the spectrum presented in Fig. 3 is available on Zenodo at https://zenodo.org/record/7991022. The spectroscopic data for water can be downloaded from the HITRAN database (https://hitran.org). The Spitzer-IRS spectrum plotted in Fig. 1 is part of the Spitzer-IRS GTO program 40679 (PI: G. Rieke). The spectrum was extracted and calibrated using private codes[64, 56] and is available on Zenodo at https://zenodo.org/record/7991022. The optical constants of the dust species considered in the fitting procedure for the dust continuum can be downloaded from the HJPDOC database (https://www2.mpia-hd.mpg.de/HJPDOC).
Code Availability
The slab model used in this work is a private code developed by B.T. and collaborators. It can be obtained from B.T. upon request. The synthetic spectra presented in this work can be reproduced using the slabspec code, which can be found at https://doi.org/10.5281/zenodo.4037306. The fitting procedure for the dust continuum uses the publicly available MultiNest Bayesian fitting algorithm (https://github.com/JohannesBuchner/MultiNest) and the PyMultiNest package (https://github.com/JohannesBuchner/PyMultiNest). Figures were made with Matplotlib version 3.5.1. under the Matplotlib license at https://matplotlib.org/.
Acknowledgements
The MINDS team would like to thank the entire MIRI European and US instrument team. Support from STScI is also appreciated. The following National and International Funding Agencies funded and supported the MIRI development: NASA; ESA; Belgian Science Policy Office (BELSPO); Centre Nationale d’Etudes Spatiales (CNES); Danish National Space Centre; Deutsches Zentrum fur Lüft- und Raumfahrt (DLR); Enterprise Ireland; Ministerio De Economiá y Competividad; Netherlands Research School for Astronomy (NOVA); Netherlands Organisation for Scientific Research (NWO); Science and Technology Facilities Council; Swiss Space Office; Swedish National Space Agency; and UK Space Agency. G.P. would like to thank B. Bitsch and E. Gaidos for fruitful discussions and P. Hausschildt for kindly providing the model atmosphere. V.C. and O.A. acknowledge funding from the Belgian F.R.S.-FNRS. Th.H., R.F. and K.S. acknowledge support from the European Research Council under the Horizon 2020 Framework Program via the ERC Advanced Grant Origins 83 24 28. B.T. is a Laureate of the Paris Region fellowship program, which is supported by the Ile-de-France Region and has received funding under the Horizon 2020 innovation framework program and Marie Sklodowska-Curie grant agreement No. 945298. B.T. acknowledges support from the Programme National ‘Physique et Chimie du Milieu Interstellaire’ (PCMI) of CNRS/INSU with INC/INP cofunded by CNES. D.G. would like to thank the Research Foundation Flanders for co-financing the present research (grant number V435622N). D.G. and I.A. thank the European Space Agency (ESA) and the Belgian Federal Science Policy Office (BELSPO) for their support in the framework of the PRODEX Programme. I.K., A.M.A., and E.v.D. acknowledge support from grant TOP-1614.001.751 from the Dutch Research Council (NWO). I.K. and J.K. acknowledge funding from H2020-MSCA-ITN-2019, grant no. 860470 (CHAMELEON). E.F.v.D. acknowledges support from the ERC grant 101019751 MOLDISK and the Danish National Research Foundation through the Center of Excellence “InterCat” (DNRF150). T.P.R acknowledges support from ERC grant 743029 EASY. D.B. has been funded by Spanish MCIN/AEI/10.13039/501100011033 grants PID2019-107061GB-C61 and No. MDM-2017-0737. A.C.G. has been supported by PRIN-INAF MAIN-STREAM 2017 “Protoplanetary disks seen through the eyes of new generation instruments” and from PRIN-INAF 2019 “Spectroscopically tracing the disk dispersal evolution (STRADE)”. D.R.L. acknowledges support from Science Foundation Ireland (grant number 21/PATH-S/9339). L.C. acknowledges support by grant PIB2021-127718NB-I00, from the Spanish Ministry of Science and Innovation/State Agency of Research MCIN/AEI/10.13039/501100011033.
Author contributions
G.P. and V.C. performed the data reduction, supported by D.G., M.S., I.A., and J.B. G.P., I.K., V.C., B.T., L.B.F.M.W., G.O. and Th.H. wrote the manuscript. G.P., B.T. and S.L.G. did the line analysis. L.B.F.M.W. carried out the dust continuum analysis. G.O. performed the correction for photospheric emission. J.B. performed the reduction of the Spitzer dataset. Th.H. and I.K. planned and co-led the MINDS guaranteed time program. All authors participated in either the development and testing of the MIRI instrument and its data reduction, in the discussion of the results, and/or commented on the manuscript.
Competing Interests
The authors declare no competing financial interests.
Correspondence
Correspondence and requests for materials should be addressed to G. Perotti.
1 Extended Data
References
- [1] Mulders, G. D., Pascucci, I., Apai, D. & Ciesla, F. J. The Exoplanet Population Observation Simulator. I. The Inner Edges of Planetary Systems. \JournalTitleAJ 156, 24 (2018).
- [2] Ciesla, F. J. & Cuzzi, J. N. The evolution of the water distribution in a viscous protoplanetary disk. \JournalTitleIcarus 181, 178–204 (2006).
- [3] Eistrup, C. & Henning, T. Chemical evolution in ices on drifting, planet-forming pebbles. \JournalTitleA&A 667, A60 (2022).
- [4] Krijt, S. et al. Chemical Habitability: Supply and Retention of Life’s Essential Elements During Planet Formation. Preprint at https://arxiv.org/abs/2203.10056 (2022).
- [5] Bethell, T. & Bergin, E. Formation and Survival of Water Vapor in the Terrestrial Planet-Forming Region. \JournalTitleScience 326, 142-153 (2009).
- [6] Glassgold, A. E. et al. Formation of Water in the Warm Atmospheres of Protoplanetary Disks. \JournalTitleApJ 701, 1675-1677 (2009).
- [7] Banzatti, A. et al. Hints for Icy Pebble Migration Feeding an Oxygen-rich Chemistry in the Inner Planet-forming Region of Disks. \JournalTitleApJ 903, 124 (2020).
- [8] Keppler, M. et al. Discovery of a planetary-mass companion within the gap of the transition disk around PDS 70. \JournalTitleA&A 617, A44 (2018).
- [9] Haffert, S. Y. et al. Two accreting protoplanets around the young star PDS 70. \JournalTitleNature Astronomy 3, 749–754 (2019).
- [10] Long, Z. C. et al. Differences in the Gas and Dust Distribution in the Transitional Disk of a Sun-like Young Star, PDS 70. \JournalTitleA&A 858, 112 (2018).
- [11] Keppler, M. et al. Highly structured disk around the planet host PDS 70 revealed by high-angular resolution observations with ALMA. \JournalTitleA&A 625, A118 (2019).
- [12] Benisty, M. et al. A Circumplanetary Disk around PDS70c. \JournalTitleApJ 916, L2 (2021).
- [13] Rieke, G. H. et al. The Mid-Infrared Instrument for the James Webb Space Telescope, I: Introduction. \JournalTitlePubl. Astron. Soc. Pac. 127, 584 (2015).
- [14] Wright, G. S. et al. The Mid-Infrared Instrument for the James Webb Space Telescope, II: Design and Build. \JournalTitlePASP 127, 595 (2015).
- [15] Wells, M. et al. The Mid-Infrared Instrument for the James Webb Space Telescope, VI: The Medium Resolution Spectrometer. \JournalTitlePASP 127, 646 (2015).
- [16] Kessler-Silacci, J. et al. c2d Spitzer IRS Spectra of Disks around T Tauri Stars. I. Silicate Emission and Grain Growth. \JournalTitleApJ 639, 275-291 (2006).
- [17] Furlan, E. et al. A Survey and Analysis of Spitzer Infrared Spectrograph Spectra of T Tauri Stars in Taurus. \JournalTitleApJ 165, 568-605 (2006).
- [18] Argyriou, I. et al. JWST MIRI flight performance: The Medium-Resolution Spectrometer. \JournalTitleA&A Preprint at https://arxiv.org/abs/2303.13469 (2023).
- [19] Muzerolle, J. et al. Evidence for Dynamical Changes in a Transitional Protoplanetary Disk with Mid-Infrared Variability. \JournalTitleApJ 704, L15-L19 (2009).
- [20] Espaillat, C. et al. A Spitzer IRS Study of Infrared Variability in Transitional and Pre-transitional Disks Around T Tauri Stars. \JournalTitleApJ 728, 49 (2011).
- [21] Manara, C. F., et al. Constraining disk evolution prescriptions of planet population synthesis models with observed disk masses and accretion rates. \JournalTitleA&A 631, L2 (2019).
- [22] Skinner, S. L. & Audard, M. HST UV Spectroscopy of the Planet-hosting T Tauri Star PDS 70. \JournalTitleApJ 938, 134 (2022).
- [23] Stimpfl, H. & et al. An ångström-sized window on the origin of water in the inner solar system: Atomistic simulation of adsorption of water on olivine. \JournalTitleJ. Cryst. Growth 294, 83-95 (2006).
- [24] Genda, H. & Ikoma, M. Origin of the ocean on the Earth: Early evolution of water D/H in a hydrogen-rich atmosphere. \JournalTitleIcarus 194, 42-52 (2008).
- [25] Salyk, C. et al. A Spitzer Survey of Mid-infrared Molecular Emission from Protoplanetary Disks. II. Correlations and Local Thermal Equilibrium Models. \JournalTitleApJ 731, 130 (2011).
- [26] Pontoppidan, K. M. et al. A Spitzer Survey of Mid-infrared Molecular Emission from Protoplanetary Disks. I. Detection Rates. \JournalTitleApJ 720, 887–903 (2010).
- [27] Blevins, S. M. et al. Measurements of Water Surface Snow Lines in Classical Protoplanetary Disks. \JournalTitleApJ 818, 22 (2016).
- [28] Portilla-Revelo, B. et al. Constraining the gas distribution in the PDS 70 disk as a method to assess the effect of planet-disk interactions. \JournalTitleA&A Preprint at https://arxiv.org/abs/2306.16850 (2023).
- [29] Salyk, C. et al. Detection of Water Vapor in the Terrestrial Planet Forming Region of a Transition Disk. \JournalTitleApJ 810, L24 (2015).
- [30] Manara, C. F. et al. Gas content of transitional disks: a VLT/X-Shooter study of accretion and winds. \JournalTitleA&A 568, A18 (2014).
- [31] Oliveira, I., et al. A Spitzer Survey of Protoplanetary Disk Dust in the Young Serpens Cloud: How do Dust Characteristics Evolve with Time?. \JournalTitleApJ 714, 778-798 (2010).
- [32] Brown, J. M. et al. Cold Disks: Spitzer Spectroscopy of Disks around Young Stars with Large Gaps. \JournalTitleApJ 664, L107-L110 (2007).
- [33] Furlan, E. et al. Disk Evolution in the Three Nearby Star-forming Regions of Taurus, Chamaeleon, and Ophiuchus. \JournalTitleApJ 703, 1964-1983 (2009).
- [34] Banzatti, A. et al. The kinematics and excitation of infrared water vapor emission from planet-forming disks: results from spectrally-resolved surveys and guidelines for JWST spectra. \JournalTitleAJ 165, 72 (2023).
- [35] Bouvier, J. et al. Investigating the magnetospheric accretion process in the young pre-transitional disk system DoAr 44 (V2062 Oph). A multiwavelength interferometric, spectropolarimetric, and photometric observing campaign. \JournalTitleA&A 643, A99 (2020).
- [36] Gaia Collaboration et al. Gaia Data Release 2. Summary of the contents and survey properties. \JournalTitleA&A 616, A1 (2018).
- [37] Müller, A. et al. Orbital and atmospheric characterization of the planet within the gap of the PDS 70 transition disk. \JournalTitleA&A 617, L2 (2018).
- [38] Gregorio-Hetem, J. & Hetem, A. Classification of a selected sample of weak T Tauri stars. \JournalTitleMNRAS 336, 197–206 (2002).
- [39] Metchev, S. A., Hillenbrand, L. A. & Meyer, M. R. Ten Micron Observations of Nearby Young Stars. \JournalTitleApJ 600, 435–450 (2004).
- [40] Riaud, P. et al. Coronagraphic imaging of three weak-line T Tauri stars: evidence of planetary formation around PDS 70. \JournalTitleA&A 458, 317–325 (2006).
- [41] Dong, R. et al. The Structure of Pre-transitional Protoplanetary Disks. I. Radiative Transfer Modeling of the Disk+Cavity in the PDS 70 System. \JournalTitleApJ 760, 111 (2012).
- [42] Bushouse, H. et al. JWST Calibration Pipeline. \JournalTitleZenodo. https://doi.org/10.5281/zenodo.4037306, (2022).
- [43] Gomez Gonzalez, C. A. et al. VIP: Vortex Image Processing Package for High-contrast Direct Imaging. \JournalTitleAJ 154, 7 (2017).
- [44] Christiaens, V. et al. VIP: A Python package for high-contrast imaging. \JournalTitleJ. Open Source Softw. 8, 4774 (2023).
- [45] Gasman, D. et al. JWST MIRI/MRS in-flight absolute flux calibration and tailored fringe correction for unresolved sources. \JournalTitleA&A 673, A102 (2023).
- [46] Tabone, B. et al. A rich hydrocarbon chemistry and high C to O ratio in the inner disk around a very low-mass star. \JournalTitleNat. Astron. https://doi.org/10.1038/s41550-023-01965-3, (2023).
- [47] Labiano, A. et al. Wavelength calibration and resolving power of the JWST MIRI Medium Resolution Spectrometer. \JournalTitleA&A 656, A57 (2021).
- [48] Tennyson, J. et al. Experimental Energy Levels of the Water Molecule. \JournalTitleA&A 30, 735-831 (2001).
- [49] Salyk, C. slabspec: Python code for producing LTE slab model molecular spectra. \JournalTitleZenodo. https://doi.org/10.5281/zenodo.4037306, (2020).
- [50] Grant, S. L. et al. MINDS. The Detection of 13CO2 with JWST-MIRI Indicates Abundant CO2 in a Protoplanetary Disk. \JournalTitleApJ 947, L6 (2023).
- [51] Facchini, S. et al. The Chemical Inventory of the Planet-hosting Disk PDS 70. \JournalTitleAJ 162, 99 (2021).
- [52] Portilla-Revelo, B. et al. Self-consistent modelling of the dust component in protoplanetary and circumplanetary disks: the case of PDS 70. \JournalTitleA&A 658, A89 (2022).
- [53] Zhuravlev, L. T. The surface chemistry of amorphous silica. Zhuravlev model. \JournalTitleColloids Surf. A Physicochem. Eng. Asp. 173, 1-38 (2000).
- [54] Stevenson, C. M. & Novak, S. W. Obsidian hydration dating by infrared spectroscopy: method and calibration. \JournalTitleJ. Archaeol. Sci. 38, 171 (2011).
- [55] Juhász, A. et al. Do We Really Know the Dust? Systematics and Uncertainties of the Mid-Infrared Spectral Analysis Methods. \JournalTitleApJ 695, 1024-1041, (2009).
- [56] Juhász, A. et al. Dust Evolution in Protoplanetary Disks Around Herbig Ae/Be Stars—the Spitzer View. \JournalTitleApJ 721, 431-455 (2010).
- [57] Jäger, C. et al. Steps toward interstellar silicate mineralogy. VII. Spectral properties and crystallization behaviour of magnesium silicates produced by the sol-gel method. \JournalTitleA&A 408, 193-204 (2003).
- [58] Dorschner, J. et al. Steps toward interstellar silicate mineralogy. II. Study of Mg-Fe-silicate glasses of variable composition. \JournalTitleA&A 300, 503 (1995).
- [59] Sogawa, H. et al. Infrared reflection spectra of forsterite crystal. \JournalTitleA&A 451, 357-361 (2006).
- [60] Jäger, C. and Mutschke, H. and Henning, Th. Optical properties of carbonaceous dust analogues. \JournalTitleA&A 332, 291-299 (332).
- [61] Henning, T. and Mutschke, H. Low-temperature infrared properties of cosmic dust analogues. \JournalTitleA&A 327, 743-754 (1997).
- [62] Feroz, F. & Hobson, M. P. Multimodal nested sampling: an efficient and robust alternative to Markov Chain Monte Carlo methods for astronomical data analyses. \JournalTitleMNRAS 384, 449-463 (2008).
- [63] Buchner, J. et al. X-ray spectral modelling of the AGN obscuring region in the CDFS: Bayesian model selection and catalogue. \JournalTitleA&A 564, A125 (2014).
- [64] Bouwman, J. et al. The Formation and Evolution of Planetary Systems: Grain Growth and Chemical Processing of Dust in T Tauri Systems. \JournalTitleApJ 683, 479-498 (2008).