ESG Reputation Risk Matters: An Event Study Based on Social Media Data ††thanks: This research was funded by Innovate UK project No: 10021201, which funds a consortium led by Kennedys Law LLP and includes Kennedys IQ Limited, University College London, H/Advisors, University of Manchester, and RiskCovered
Abstract
We investigate the response of shareholders to Environmental, Social, and Governance-related reputational risk (ESG-risk), focusing exclusively on the impact of social media. Using a dataset of 114 million tweets about firms listed on the S&P100 index between 2016 and 2022, we extract conversations discussing ESG matters. In an event study design, we define events as unusual spikes in message posting activity linked to ESG-risk, and we then examine the corresponding changes in the returns of related assets. By focusing on social media, we gain insight into public opinion and investor sentiment, an aspect not captured through ESG controversies news alone. To the best of our knowledge, our approach is the first to distinctly separate the reputational impact on social media from the physical costs associated with negative ESG controversy news. Our results show that the occurrence of an ESG-risk event leads to a statistically significant average reduction of 0.29% in abnormal returns. Furthermore, our study suggests this effect is predominantly driven by Social and Governance categories, along with the \sayEnvironmental Opportunities subcategory. Our research highlights the considerable impact of social media on financial markets, particularly in shaping shareholders’ perception of ESG reputation. We formulate several policy implications based on our findings.
Keywords: ESG, ESG-Risk, Lexicon, Dictionary, Social media, Event study
1 Introduction
Social media substantially influences corporate perceptions, particularly regarding ESG performance. With the growing interest of investors in ESG factors, it is important to understand the response of shareholders to ESG-related reputation risk (ESG-risk) on platforms like Twitter. However, the existing literature does not provide analyses of this issue. Our study targets this gap, investigating the reaction of shareholders to ESG-risk events through the lens of social media.
The recent development in the ESG landscape has been largely driven by narratives that highlight instances of corporate greed, environmental catastrophes, climate change concerns, and social injustices. Such stories have fuelled the momentum of the ESG movement and triggered demands for increased regulatory action. Consequently, regulators have promoted transparency and completeness in corporate sustainability reporting through policies such as the 2014 Non-Financial Reporting Directive (NFRD) (European Union, 2014; Cicchiello et al., 2022). This has led to a growing trend towards ESG reporting and disclosure, with more firms communicating their efforts in relation to sustainability through various channels such as sustainability reports, television, and social media.
Public discussions on a firm’s ESG matters serves to build a consistent ESG reputation, which can lead to higher financial performance. This process cultivates stakeholder trust and overall brand image to improve market position and investor appeal (Bénabou and Tirole, 2010). In essence, this perspective suggests that well-governed firms can effectively \saydo well by doing good by implementing transparent communication of explicit ESG practices, while avoiding any contradictory behavior (Bénabou and Tirole, 2010; Edmans, 2011; Ferrell et al., 2016; Dyck et al., 2019; Zhang and Wong, 2022).
A large corpus of research has examined the response of financial markets to the disclosure of negative and positive ESG events (Capelle-Blancard et al., 2021). This includes studies on accidents (Bowen et al., 1983; Hill and Schneeweis, 1983; Borenstein and Zimmerman, 1988), regulation (Gilley et al., 2000; Jacobs et al., 2010; Karpoff and Lott Jr, 1993), and corporate social responsibility related events (Flammer, 2013; Krüger, 2015; Capelle-Blancard and Petit, 2019; Farber and Hallock, 2009). They find that shareholders sanction negative ESG events and slightly reward positive ones. However, those prior studies focus exclusively on ESG news release and fail to adequately separate the ESG-related reputational effects from the physical costs or profits associated with these events. Indeed, ESG news typically relate to controversies or court decisions involving fees and penalties, which ultimately translate into direct financial costs for the concerned firms. However, it does not reflects public’s perception of these companies’ ESG performance. To the best of our knowledge, we are the first to fill this gap by examining shareholders’ responses to ESG-risk events using an unexplored venue: social media.
Social media has become an increasingly popular way for investors to gather information. It has transformed how accounting information is prepared and disclosed (Saxton, 2012), and it offers a form of authenticity, transparency, immediacy, participation, connectedness, and accountability over traditional disclosure media (Postman, 2009). Overall, it provides real-time data and captures a broad range of opinions and perspectives from various stakeholders. In an ESG context, this makes it an efficient tool to capture ESG-related communications and assess ESG reputation. While prior research has explored the use of social media for event studies, there have been no specific focus on examining ESG-risk. An example of related work is Renault (2017), who used abnormal social media activity to conduct an event study, but the focus was on identifying stock promoters and fraudulent activities.
The present study assesses shareholders’ response to ESG-risk events. Specifically, we analyze tweets about firms listed on the S&P 100 index, collected between 2016 and 2022. From this sample, we extract negative ESG tweets that were not related to specific ESG news or financial announcements, and we define periods of abnormal posting activity about ESG matters as indicators of ESG-risk events. Subsequently, using an event study, we investigate the associated changes in abnormal returns. Our analysis makes several significant contributions. First, we develop and provide the first extended ESG lexicon based on social media analyses.111Baier et al. (2020), building on the prior work of Dimson et al. (2015), proposed an ESG dictionary derived from the textual analysis of 10-K reports from 25 largest firms quoted on the S&P100. However, these existing dictionaries may not be ideally suited for performing textual analyses of ESG-related content on social media platforms. Second, we propose a novel method to disentangle ESG-related reputational effects from the physical costs associated with ESG events. Finally, we assess shareholders’ response to ESG-risk events, revealing a statistically significant decrease in abnormal returns associated to ESG-risk events. In addition, we find that this effect is more specifically driven by ESG-risks related to Social and Governance categories and events about \sayEnvironmental Opportunities. Hence, our results provide evidence of the substantial influence of social media on financial markets, particularly regarding shareholders perception on ESG matters. This study suggests critical policy adjustments, advocating for increased ESG oversight on social media, improved awareness for investors on ESG-risk, and the incorporation of ESG factors in investment strategies to mitigate risk.
2 Data
Our research draws from three data sources: financial, social media, and news data. We collected data for the 100 largest U.S. firms listed on the S&P 100 index for the period from January 2016 to January 2022.222Although the S&P 100 technically includes 101 stocks due to dual stock classes for one constituent firm, we omitted the duplicate in our study. Financial data, i.e. stock price information, is obtained from the daily stock files provided by the Center for Research in Security Prices (CRSP).
We extract social media data via the Twitter Academic Research Application Programming Interface (API) using Python. We use the cashtag333’Cashtags’ are a portmanteau of ’cash’ and ’hashtag’, composed of a dollar sign and a stock ticker to refer to a particular stock. For instance, $AAPL is used for Apple. and the Twitter accounts of each firm to collect relevant tweets. Overall, we have extracted 114 million tweets, corresponding to an average of 1.2 million tweets per firm.
We download ESG controversy news from Refinitiv Eikon, which amounted to 5,390 news headlines for our sample, averaging 54 controversy news items per firm for the period from 2016 to 2022. Additionally, we obtain Earnings Release (ER) dates from Refinitiv’s Institutional Brokers’ Estimate System (I/B/E/S) dataset, which provided a total of 3,952 dates for the same period.
3 Methodology
3.1 Textual Analysis
We distinguish ESG and non-ESG related conversation by constructing an ESG lexicon on the three main ESG topics and divided it into 10 categories inspired by MSCI reports, as reported in Table LABEL:tab2:lexico. Consequently, a single tweet can be associated with more than one category or subcategory.
We classify each message’s sentiment using the lexicon by Renault (2017). Then, we construct a daily sentiment score by averaging all the day’s message sentiment scores. If the sentiment index is negative (positive) at time , the event is classified as \saynegative (\saypositive).444To address the challenge of identifying negative/positive tweets amid linguistic and contextual subtleties, we apply a 0.05 threshold for classification. This conservative approach categorizes ambiguous or weak sentiment indices as negative. Despite its subjectivity, our analysis maintains robust results across multiple threshold selections around zero.
Then, we identify an ESG reputation event as a sudden increase in tweet activity at a particular time . We use the ESD identifier (Rosner, 1983) for outlier detection to identify spikes in the volume of messages that contain at least one of the keywords related to the ESG topic. The ESD identifier calculates a score for each data point, based on its deviation from the mean and the standard deviation of the data. Data points with a value higher than a certain threshold are considered outliers.
In particular, an event at day is identified if . Where is the sample average and is the sample standard deviation.555 is the sample average and is the sample standard deviation. where, is the sample size and is the observation of the sample . is the sensitivity threshold set to .666It is common to set in the ESD identifier because, in normally-distributed data, it is rare to observe a value that deviates more than two standard deviations from the mean (about 4.5%). Regardless of the probability distribution, when the variance is defined, the Chebyshev’s inequality guarantees that such a probability is smaller than 1/4. As a robustness test, we consider . The results remained qualitatively similar. Given the dynamic nature of tweeting behaviors, we account for the non-stationarity of message volume via a 250-day moving window (Tumarkin and Whitelaw, 2001; Leung and Ton, 2015). To reduce noise and minor variations, we filter out all events contributing less than 5% of the total number of messages for a particular firm on a given day, and exclude events with less than 10 tweets (Tumarkin and Whitelaw, 2001; Sabherwal et al., 2011; Leung and Ton, 2015).777The results remained qualitatively similar when we tried different filtering parameters such as a minimum number of tweets of 20. Furthermore, we adopt a closing-to-closing approach to account for the regular operational hours of stock exchanges,888We consider all messages sent between 4 p.m. on day and 4 p.m. on day as relevant to day . This method aligns with the U.S. stock market’s standard trading hours, which include the Nasdaq Stock Market (Nasdaq) and the New York Stock Exchange (NYSE) and run from 9:30 a.m. to 4 p.m., except on stock market holidays. and enforce a minimum gap of 5 trading days between two events to avoid overlapping.999If two or more individual outliers fall into our window of interest, they are combined into one single event, where the event is set as being the first outlier in the event window.
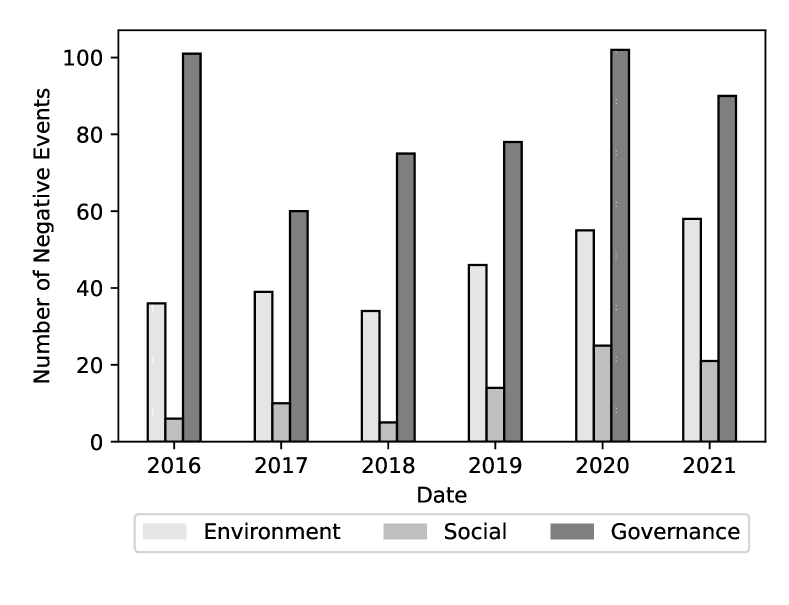
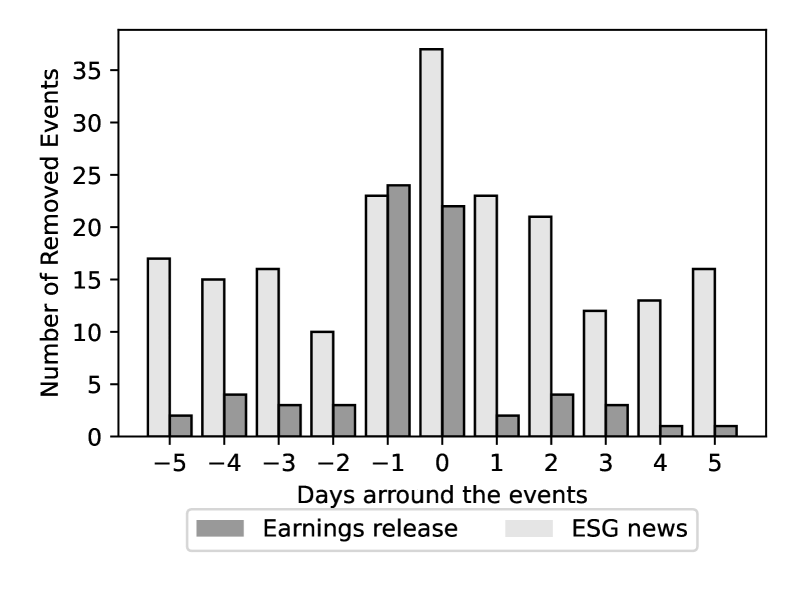
To account for the potential endogeneity of social media events to financial markets or firms’ activities, we exclude events falling within a days window surrounding earnings releases and ESG controversy news. This process allows us to focus on negative ESG messages unrelated to specific ESG or financial events, capturing the reputational dimension of ESG-risk effectively. Figure 1 (a) shows the number of events in the sample consisting of 665 ESG-risk events, 253 Environmental-risk, 79 Social-risk, and 495 Governance-risk. Interestingly, we find that the volume of Governance-risk is more substantial. Figure 1 (b) gives an overview of the distribution of the number of days separating the detected events and the removed event. In this figure, the height of each bar corresponds to the number of events that have been removed, and this is displayed in relation to their distance from news or earnings release dates. The figure shows that a significant amount of financial and ESG news is discussed around ESG-risk events.
3.2 Event study
In line with previous research in the economic literature, we employ a market model to estimate the abnormal returns of firms surrounding the disclosure of ESG-risk events. We estimate the abnormal returns as follows:
where represents the abnormal return of firm at time . and denote the stock returns and market portfolio returns at time , respectively. The S&500 index is the benchmark for the market portfolio. Following Ahern (2017) and Perdichizzi and Reghezza (2023), the estimation window for the market model is set at 120 trading days [-122;-2]. As robustness, we consider an alternative estimation window of 90 trading days to control for potential parameter instability. We determine the standardized average abnormal () and standardized cumulative abnormal returns () for a 2-day [-1;0] and 3-day [-1;1] event windows using the formulas:
and
Where, is the standardized average abnormal returns at time , computed as the average of the , i.e. the standardized abnormal return, for each individual firm i on day . are computed as average sum of daily standardized abnormal returns from day to around the event day . We follow Boehmer et al. (1991) standardized cross‐sectional test to compute the t-value.
4 Results
This section assesses shareholders’ response to several types of ESG-risk events. Figure 2 shows the overall firms’ in the wake of ESG-risk events. The null hypothesis asserts that is equal to zero during the event day or period; any significant deviation from random returns implies that events affect a firm’s stock prices. Those results indicate a significant negative reaction for ESG-risk events.
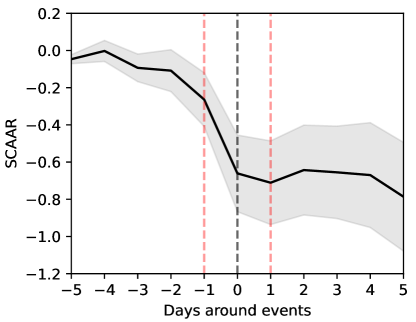
The figure show the firms’ in the wake of ESG-risk events.
The dotted lines represent the event window of interest.
Table 1 examines this effect on an event window of days which is less subject to capture confounding events. In particular, columns (1) and (2) examine the on an event window of and days, respectively. Columns (3) to (5) examine the from to .
The first line presenting the results for the overall ESG-risk events, confirm that shareholders’ penalise firms affected by negative ESG communication on social media. Over and days around ESG-risk events, firms stock price decrease on average by 0.29% to 0.25%, respectively. This results is also significant on days and . On the day of the event, ESG-risk events cause a decrease in firm’s stock price by 0.29%. All results are significant at the 1% threshold, confirming that negative ESG reputation influences shareholders’ perceptions and that ESG-risks are sanctioned.
At the desegregated level, we find that only social- and governance-risk events are penalized by shareholders. Over days around the event, social-risk and governance-risk events reduce firms stock price by -0.36% and -0.33% respectively. Results remain qualitatively similar from columns (2) to (4). Conversely, Environmental-risk events do not exhibit significant effects. Those results suggest that shareholders are more sensitive to negative reputation on non-environmental matters.
| n | ||||||
|---|---|---|---|---|---|---|
| ESG | -0.289∗∗∗ | -0.246∗∗∗ | -0.117∗∗∗ | -0.292∗∗∗ | -0.018 | 665 |
| (-5.265) | (-4.628) | (-2.749) | (-4.540) | (-0.416) | ||
| Environment | 0.001 | -0.022 | 0.067 | -0.066 | -0.038 | 253 |
| (0.010) | (-0.292) | (1.120) | (-0.907) | (-0.578) | ||
| Social | -0.355∗∗∗ | -0.275∗∗ | -0.236∗∗∗ | -0.266∗∗ | 0.026 | 79 |
| (-3.186) | (-2.600) | (-2.765) | (-2.180) | (0.199) | ||
| Governance | -0.325∗∗∗ | -0.247∗∗∗ | -0.104∗ | -0.356∗∗∗ | 0.033 | 495 |
| (-4.810) | (-3.773) | (-1.961) | (-4.400) | (0.657) |
| The table displays the shareholder response following ESG-risk events. The sample includes firms in the S&P100 index between 2016 and 2022. Column (1) and (2) report the and the which are the standardized cumulative average abnormal returns in percentage from one day before to the ESG-risk events, and from one day before to one day after the ESG-risk events, respectively. Column (3) to (5) report the which are the standardized average abnormal returns in percentage from one day before to one day after the ESG-risk events, respectively. Column 6 report the n number of events analyzed. ESG refers to the overall sample of ESG-risk events. Environment, Social and Governance are sub-samples based on ESG-risk events typology. Table LABEL:tab2:lexico provides more details on the typology of ESG-risk events. The table reports results using an estimating window of 120 days. All results include robust standard errors. Boehmer et al. (1991) t-values appear in parentheses. |
Delving into our initial findings, Table 2 examines a series of ESG sub-topics. Results suggest that some sub-topics discussed on social media have more effect on financial markets.
Despite the overall lack of impact for the global Environment category, we observe a significant negative effect on firms’ value within the \sayEnvironmental Opportunities-risk subtopic. Over an event window of days, negative discussions on social media regarding this event class reduce by 0.34% stock prices. Column (2) and (4), suggest that the effect remains significant on an event window of days and more specifically on the event day . Furthermore, the absence of effect regarding discussions related to other environmental matters suggests that ESG reputational announcements, i.e. without physical impact, do not alter shareholders perception. Future research should examine if some sectors are not more exposed to some specific ESG-risks.
Regarding Social-risk sub-topics, \sayProduct Liability-risk events appear to lead shareholders negative response. Over a days event window, \sayProduct liability-risk events reduce firms stock prices by 0.32%. Results remain qualitatively similar and significant at 10% in Column (2) and (4). \sayStakeholder Opposition-risk events exhibit negative abnormal returns over days event windows. The result is significant at 10%. Specifications regarding results are not-significant but consistently negative. Regarding other events type, the lower sample size seem to partially affect the consistency of the results.101010This issue is contingent to the very significant data cleaning that we have conducted using filtering. \sayHuman capital-risk events are negatively related to abnormal returns but results are only significant at 10% in column (3). \saySocial Opportunities-risk only cover 5 events which do not permit to draw meaningful conclusions.111111We choose to present these results as we believe the frequency of these topics on social media is compelling in itself and offers valuable insights for future research.
Regarding Governance-risk sub-topics, \sayCorporate Governance-risk events yields robust results. Over a days event window, stock prices reduce by 0.33%. From Column (2) to (4), results remain similar and exhibit a stronger market reaction on the event day . However, \sayCorporate Behavior-risk do not exhibit a consistent effect.
Table A1 presents the robustness test using an estimation window of 90 days to control for potential parameter instability. Results remain qualitatively similar.
| n | ||||||
|---|---|---|---|---|---|---|
| Environment | ||||||
| Climate Change | 0.059 | 0.056 | 0.021 | 0.062 | 0.015 | 88 |
| (0.633) | (0.578) | (0.253) | (0.615) | (0.138) | ||
| Natural Capital | 0.011 | -0.007 | 0.051 | -0.036 | -0.027 | 79 |
| (0.077) | (-0.051) | (0.404) | (-0.292) | (-0.241) | ||
| Pollution and Waste | 0.009 | -0.012 | 0.143 | -0.129 | -0.033 | 91 |
| (0.083) | (-0.113) | (1.211) | (-1.061) | (-0.288) | ||
| Environmental Opportunities | -0.337∗∗ | -0.333∗∗ | -0.143 | -0.334∗∗ | -0.100 | 53 |
| (-2.521) | (-2.157) | (-1.202) | (-2.177) | (-0.508) | ||
| Social | ||||||
| Human Capital | -0.231 | -0.311 | -0.284∗ | -0.042 | -0.213 | 17 |
| (-1.135) | (-1.574) | (-1.799) | (-0.174) | (-1.619) | ||
| Product Liability | -0.322∗∗ | -0.275∗ | -0.164 | -0.291∗ | -0.022 | 31 |
| (-2.321) | (-1.907) | (-1.187) | (-1.937) | (-0.098) | ||
| Stakeholder Opposition | -0.282 | -0.380∗ | -0.154 | -0.244 | -0.260 | 24 |
| (-1.676) | (-1.954) | (-1.200) | (-1.371) | (-0.998) | ||
| Social Opportunities | 0.496∗ | 0.410 | 0.223 | 0.479 | 0.009 | 5 |
| (2.401) | (1.642) | (1.834) | (1.787) | (0.024) | ||
| Governance | ||||||
| Corporate Governance | -0.334∗∗∗ | -0.248∗∗∗ | -0.109∗∗ | -0.363∗∗∗ | 0.043 | 465 |
| (-4.876) | (-3.717) | (-1.971) | (-4.497) | (0.839) | ||
| Corporate Behavior | -0.114 | -0.122 | -0.326∗ | 0.165 | -0.051 | 33 |
| (-0.594) | (-0.665) | (-1.702) | (0.919) | (-0.255) |
| The table displays the shareholder response following Environmental-, Social- and Governance-risk events sub-topics. The sample includes firms in the S&P100 index between 2016 and 2022. Column (1) and (2) report the and the which are the standardized cumulative average abnormal returns in percentage from one day before to the ESG-risk events, and from one day before to one day after the ESG-risk events, respectively. Column (3) to (5) report the which are the standardized average abnormal returns in percentage from one day before to one day after the ESG-risk events, respectively. Column 6 report the n number of events analyzed. Environment, Social and Governance sub-topics are based on ESG-risk events typology. Table LABEL:tab2:lexico provides more details on the typology of ESG-risk events. Abnormal returns are assessed using an estimating window of 120 days. All results include robust standard errors. Boehmer et al. (1991) t-values appear in parentheses. . |
5 Conclusion
To the best of our knowledge, this study is the first to examine how shareholders respond to ESG related reputational risk events and how social media shapes their perception on the matter. By focusing solely on social media, we distinguish the financial consequences associated with ESG events from the reputational impacts influenced by public opinion on ESG matters. On the event date of an ESG-risk event, we observe a statistically significant decrease of approximately 0.29% in abnormal returns. Furthermore, this effect is stronger for Social and Governance-related risks, specifically \sayProduct Liability, \sayStakeholder Opposition, and \sayCorporate Governance. Environmental-risk events don’t have a significant impact on stock prices, unless they are about \sayEnvironmental Opportunities. This suggests shareholders may focus more on the tangible costs of environmental incidents than purely reputational aspects. Hence, our findings underline the powerful role of social media in financial markets, primarily in influencing how shareholders perceive a firm’s ESG reputation.
This study offers several important policy recommendations. Firstly, it highlights the role of both policy makers and firms in strengthening the monitoring of ESG controversies on social media platforms. Secondly, The study also advocates for the integration of ESG factors into investment strategies to mitigate potential ESG-risk exposure. Finally, it underscores the need to amplify investor awareness regarding ESG-risks and opportunities.
Future research could explore sectorial and geographical variations. Indeed, certain sectors may have higher exposure to specific ESG risks, and examining these differences could enhance our understanding of ESG reputation’s impact on shareholder perception. Additionally, geographical specificities could offer further insights into this relationship. Lastly, while our current work concentrates on the effects of negative ESG events, it would be valuable to balance this perspective by investigating the potential benefits of positive ESG reputation.
References
- Ahern (2017) Ahern, K. R. (2017). Information networks: Evidence from illegal insider trading tips. Journal of Financial Economics 125(1), 26–47.
- Baier et al. (2020) Baier, P., M. Berninger, and F. Kiesel (2020). Environmental, social and governance reporting in annual reports: A textual analysis. Financial Markets, Institutions & Instruments 29(3), 93–118.
- Bénabou and Tirole (2010) Bénabou, R. and J. Tirole (2010). Individual and corporate social responsibility. Economica 77(305), 1–19.
- Boehmer et al. (1991) Boehmer, E., J. Masumeci, and A. B. Poulsen (1991). Event-study methodology under conditions of event-induced variance. Journal of financial economics 30(2), 253–272.
- Borenstein and Zimmerman (1988) Borenstein, S. and M. B. Zimmerman (1988). Market incentives for safe commercial airline operation. The American Economic Review, 913–935.
- Bowen et al. (1983) Bowen, R. M., R. P. Castanias, and L. A. Daley (1983). Intra-industry effects of the accident at three mile island. Journal of Financial and Quantitative Analysis 18(1), 87–111.
- Capelle-Blancard et al. (2021) Capelle-Blancard, G., A. Desroziers, and B. Scholtens (2021). Shareholders and the environment: a review of four decades of academic research. Environmental Research Letters 16(12), 123005.
- Capelle-Blancard and Petit (2019) Capelle-Blancard, G. and A. Petit (2019). Every little helps? ESG news and stock market reaction. Journal of Business Ethics 157, 543–565.
- Cicchiello et al. (2022) Cicchiello, A. F., F. Marrazza, and S. Perdichizzi (2022). Non-financial disclosure regulation and environmental, social, and governance (esg) performance: The case of eu and us firms. Corporate Social Responsibility and Environmental Management.
- Dimson et al. (2015) Dimson, E., O. Karakaş, and X. Li (2015). Active ownership. The Review of Financial Studies 28(12), 3225–3268.
- Dyck et al. (2019) Dyck, A., K. V. Lins, L. Roth, and H. F. Wagner (2019). Do institutional investors drive corporate social responsibility? international evidence. Journal of financial economics 131(3), 693–714.
- Edmans (2011) Edmans, A. (2011). Does the stock market fully value intangibles? employee satisfaction and equity prices. Journal of Financial economics 101(3), 621–640.
- European Union (2014) European Union, . (2014). Directive as regards disclosure of non-financial and diversity information by certain large undertakings and groups, 2014/95/eu.
- Farber and Hallock (2009) Farber, H. S. and K. F. Hallock (2009). The changing relationship between job loss announcements and stock prices: 1970–1999. Labour Economics 16(1), 1–11.
- Ferrell et al. (2016) Ferrell, A., H. Liang, and L. Renneboog (2016). Socially responsible firms. Journal of financial economics 122(3), 585–606.
- Flammer (2013) Flammer, C. (2013). Corporate social responsibility and shareholder reaction: The environmental awareness of investors. Academy of Management journal 56(3), 758–781.
- Gilley et al. (2000) Gilley, K. M., D. L. Worrell, W. N. Davidson III, and A. El-Jelly (2000). Corporate environmental initiatives and anticipated firm performance: the differential effects of process-driven versus product-driven greening initiatives. Journal of management 26(6), 1199–1216.
- Hill and Schneeweis (1983) Hill, J. and T. Schneeweis (1983). The effect of three mile island on electric utility stock prices: A note. The Journal of Finance 38(4), 1285–1292.
- Jacobs et al. (2010) Jacobs, B. W., V. R. Singhal, and R. Subramanian (2010). An empirical investigation of environmental performance and the market value of the firm. Journal of Operations Management 28(5), 430–441.
- Karpoff and Lott Jr (1993) Karpoff, J. M. and J. R. Lott Jr (1993). The reputational penalty firms bear from committing criminal fraud. The Journal of Law and Economics 36(2), 757–802.
- Krüger (2015) Krüger, P. (2015). Corporate goodness and shareholder wealth. Journal of financial economics 115(2), 304–329.
- Leung and Ton (2015) Leung, H. and T. Ton (2015). The impact of internet stock message boards on cross-sectional returns of small-capitalization stocks. Journal of Banking & Finance 55, 37–55.
- Perdichizzi and Reghezza (2023) Perdichizzi, S. and A. Reghezza (2023). Non-significant in life but significant in death: Spillover effects to euro area banks from the svb fallout. Economics Letters, 111231.
- Postman (2009) Postman, J. (2009). SocialCorp: Social media goes corporate. Peachpit Press.
- Renault (2017) Renault, T. (2017). Market manipulation and suspicious stock recommendations on social media. Available at SSRN 3010850.
- Rosner (1983) Rosner, B. (1983). Percentage points for a generalized esd many-outlier procedure. Technometrics 25(2), 165–172.
- Sabherwal et al. (2011) Sabherwal, S., S. K. Sarkar, and Y. Zhang (2011). Do internet stock message boards influence trading? evidence from heavily discussed stocks with no fundamental news. Journal of Business Finance & Accounting 38(9-10), 1209–1237.
- Saxton (2012) Saxton, G. D. (2012). New media and external accounting information: A critical review. Australian Accounting Review 22(3), 286–302.
- Tumarkin and Whitelaw (2001) Tumarkin, R. and R. F. Whitelaw (2001). News or noise? internet postings and stock prices. Financial Analysts Journal 57(3), 41–51.
- Zhang and Wong (2022) Zhang, Q. and J. B. Wong (2022). ESG reputational risks and board monitoring committees. Finance Research Letters 50, 103325.
Appendix
| n | ||||||
| ESG | -0.286∗∗∗ | -0.244∗∗∗ | -0.109∗∗ | -0.296∗∗∗ | -0.018 | 665 |
| (-5.047) | (-4.395) | (-2.549) | (-4.468) | (-0.415) | ||
| Environment | 0.005 | -0.015 | 0.072 | -0.066 | -0.032 | 253 |
| (0.062) | (-0.197) | (1.170) | (-0.884) | (-0.484) | ||
| Social | -0.352∗∗∗ | -0.274∗∗ | -0.236∗∗∗ | -0.262∗∗ | 0.023 | 79 |
| (-3.228) | (-2.58) | (-2.849) | (-2.156) | (0.181) | ||
| Governance | -0.332∗∗∗ | -0.255∗∗∗ | -0.101∗ | -0.369∗∗∗ | 0.027 | 495 |
| (-4.761) | (-3.767) | (-1.921) | (-4.435) | (0.548) | ||
| Environment | ||||||
| Climate Change | 0.077 | 0.083 | 0.036 | 0.073 | 0.036 | 88 |
| (0.813) | (0.816) | (0.419) | (0.724) | (0.329) | ||
| Natural Capital | 0.006 | 0.001 | 0.053 | -0.045 | -0.006 | 79 |
| (0.039) | (0.009) | (0.412) | (-0.357) | (-0.052) | ||
| Pollution and Waste | -0.010 | -0.031 | 0.143 | -0.158 | -0.040 | 91 |
| (-0.087) | (-0.299) | (1.189) | (-1.285) | (-0.341) | ||
| Environmental Opportunities | -0.329∗∗ | -0.321∗∗ | -0.146 | -0.319∗∗ | -0.090 | 53 |
| (-2.338) | (-2.064) | (-1.173) | (-2.021) | (-0.466) | ||
| Social | ||||||
| Human Capital | -0.273 | -0.389∗ | -0.334∗∗ | -0.052 | -0.287∗ | 17 |
| (-1.331) | (-1.967) | (-2.367) | (-0.202) | (-2.07) | ||
| Product Liability | -0.304∗∗ | -0.252∗ | -0.131 | -0.299∗ | -0.007 | 31 |
| (-2.241) | (-1.697) | (-1.005) | (-1.928) | (-0.029) | ||
| Stakeholder Opposition | -0.299 | -0.423∗∗ | -0.169 | -0.254 | -0.31 | 24 |
| (-1.846) | (-2.281) | (-1.437) | (-1.396) | (-1.149) | ||
| Social Opportunities | 0.536∗ | 0.457 | 0.236 | 0.521 | 0.034 | 5 |
| (2.617) | (1.822) | (1.930) | (1.944) | (0.094) | ||
| Governance | ||||||
| Corporate Governance | -0.339∗∗∗ | -0.255∗∗∗ | -0.103∗ | -0.377∗∗∗ | 0.039 | 465 |
| (-4.765) | (-3.653) | (-1.880) | (-4.495) | (0.751) | ||
| Corporate Behavior | -0.095 | -0.101 | -0.302 | 0.168 | -0.040 | 33 |
| (-0.513) | (-0.549) | (-1.63) | (0.975) | (-0.205) |
| The table displays the shareholder response following Environmental-, Social- and Governance-risk events sub-topics. The sample includes firms in the S&P100 index between 2016 and 2022. Column (1) and (2) report the and the which are the standardized cumulative average abnormal returns in percentage from one day before to the ESG-risk events, and from one day before to one day after the ESG-risk events, respectively. Column (3) to (5) report the which are the standardized average abnormal returns in percentage from one day before to one day after the ESG-risk events, respectively. Column 6 report the n number of events analyzed. Environment, Social and Governance sub-topics are based on ESG-risk events typology. Table LABEL:tab2:lexico provides more details on the typology of ESG-risk events. Abnormal returns are assessed using an estimating window of 120 days. All results include robust standard errors. Boehmer et al. (1991) t-values appear in parentheses. . |
| Topic/Subtopic | Keywords | ||||||||||
|---|---|---|---|---|---|---|---|---|---|---|---|
| ENVIRONMENT | |||||||||||
| Climate Change | |||||||||||
| Carbon Emissions |
|
||||||||||
|
|
||||||||||
|
|
||||||||||
|
|
||||||||||
| Environmental Opportunities | |||||||||||
|
|
||||||||||
|
|
||||||||||
|
|
||||||||||
| Natural Capital | |||||||||||
|
|
||||||||||
|
|
||||||||||
| Water Stress |
|
||||||||||
| Pollution & Waste | |||||||||||
| Electronic Waste | electronic waste-electronic recycling | ||||||||||
|
|
||||||||||
|
|
||||||||||
| SOCIAL | |||||||||||
| Human Capital | |||||||||||
|
|
||||||||||
|
|
||||||||||
|
|
||||||||||
| Product Liability | |||||||||||
| Chemical Safety |
|
||||||||||
|
|
||||||||||
|
|
||||||||||
|
|
||||||||||
|
|
||||||||||
| Responsible Invest. |
|
||||||||||
| Social Opportunities | |||||||||||
| Access to Finance |
|
||||||||||
|
|
||||||||||
|
|
||||||||||
| Stakeholder Opposition | |||||||||||
|
community relations-public relations-stakeholder-local community | ||||||||||
|
|
||||||||||
| GOVERNANCE | |||||||||||
| Corporate Behavior | |||||||||||
| Business Ethics |
|
||||||||||
| Tax transparency | corporate tax-fiscal | ||||||||||
| Corporate Governance | |||||||||||
| Accounting |
|
||||||||||
| Board |
|
||||||||||
|
|
||||||||||
| Pay |
|
||||||||||