Properties of pedestrians walking in line without density constraint
Abstract
This article deals with the study of pedestrian behaviour in one-dimensional traffic situations. We asked participants to walk either in a straight line with a fast or slow leader, or to form a circle, without ever forcing the conditions of density. While the observed density results from individual decisions in the line case, both density and velocity have to be collectively chosen in the case of circle formation. In the latter case, interestingly, one finds that the resulting velocity is very stable among realizations, as if collective decision was playing the role of an average. In the line experiment, though participants could choose comfortable headways, they rather stick to short headways requiring a faster adaption - a fact that could come from a “social pressure from behind”. For flows close to the jamming transition, the same operating point is chosen as in previous experiments where it was not velocity but density that was imposed. All these results show that the walking values preferred by humans in following tasks depend on more factors than previously considered.
I Introduction
Empirical studies and experiments on pedestrian dynamics are crucial in order to discover the main principles that guide humans in forming locomotion trajectories while performing interactions. They are also important to understand the impact of certain factors on these tasks, such as physiological, psychological or physical factors [1]. Finally, experiments are an essential step in the development and calibration of simulation models that can reproduce and predict the behaviour of pedestrians - and eventually crowds. This has important applications in architecture, urban design, safety and crowd management.
In practice, pedestrians move in a two-dimensional world, and they can adjust their trajectory by changing either the direction of their velocity or its modulus (speed), according to a strategy that can be quite complex to determine [2]. When carrying out experiments to decipher movement strategies, it can be interesting to limit the observations to a simpler situation, namely a one-dimensional (1D) pedestrian flow in which pedestrians follow each other along a curve without being allowed to pass each other. This basic situation makes it possible to understand in particular how people establish relationships between speed and distance within a fixed pair of predecessor/follower. The situation is easy to reproduce in different experiments, making it possible to compare the behaviour of different groups of pedestrians or to study the effect of external factors.
It is also worth noting that in practice, many 1D flows occur in everyday environments. This may be due to geometric constraints in narrow passageways or when queuing is required. Therefore, the study of 1D flows is also important for the design of public facilities where they are likely to occur, since the relationship between speed and distance will determine, for example, the capacity of corridors or exits, as well as evacuation times. 1D flows can also occur spontaneously, for example between bidirectional flows in corridors, through the formation of lanes, and models based on the 1D interaction between pairs of pedestrians following each other can serve as a basis for more complex situation modelling [3].
The literature reports a large number of empirical studies in which participants follow each other without overtaking [4, 5]. These papers have opened avenues for understanding the relationships between average density, interpersonal distance (also called headway) and speed. The propagation of emergent collective motion patterns, such as stop-and-go waves, has also been studied [6, 3]. Further studies have been devoted to understanding the effect of age on the properties of 1D flow in order to adapt fundamental diagrams (velocity-density relation) to specific populations such as the elderly [7, 8] or children [9]. The influence of environmental factors has also been investigated. Cao et al. studied the effect of limited visibility [10]. Different types of environments were considered that are typically found in transport infrastructure, such as staircases [11], ramps to access vessels [12], or highly constrained environments similar to airplane aisles [13]. More complex paths (e.g. turns) [14] were also considered. Even the sound environment, noise or music, can affect walking [15]. Yanagisiwa studied the influence of rhythm on the emergent properties of 1D flows [16], which opens up ways to improve evacuation capacity by playing music.
Social parameters [17] as well as cultural parameters [18, 19] were shown to have a measurable but small effect on 1D fundamental diagrams. Generally, experiments are specific to one country and its population [20]. Locomotion plays a much more dominant role. 1D flows are particularly well suited to study the relationships between step length and frequency at different distances, speeds or in different groups of people [21, 22, 23, 24, 25]. It has been shown that the stepping laws observed in line flows are significantly different from those for isolated individuals, and that collective dynamics can induce step coordination phenomena [21, 4].
A common feature of most of these previous works has been to constrain the density of pedestrians, or to control their headway, in order to observe its effect on other characteristics of the flow, whether global or local: global flow, individual speed, stepping activity, and so on. For example, in [6] it was possible to have controlled densities ranging from 0.31 to 1.86 ped/m.
In this paper we report on 1D flow experiments designed in such a way that the density is not prescribed a priori. Instead, the density results from the spontaneous behaviour of the participants. The situations we considered to achieve this lack of density constraint were as follows. In a first set of experiments, participants had to walk in a straight line and follow each other. Thus, their speed is constrained by their leader, but they are free to choose their distance from their predecessor, as it would be in a queuing system [26]. In a second experiment, we asked participants to form a circle with no indication of its radius. In both experiments, one might wonder what density is spontaneously chosen from the participant dynamics, and whether or not the resulting stationary flow follows the same fundamental diagram as in the case of density-constrained flows.
II The PEDINTERACT experiments
II.1 Experimental protocols
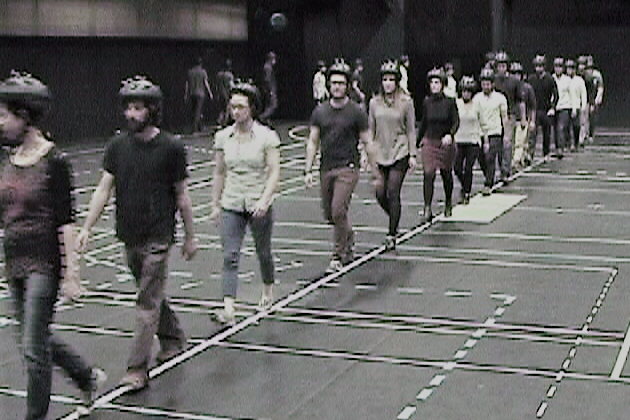
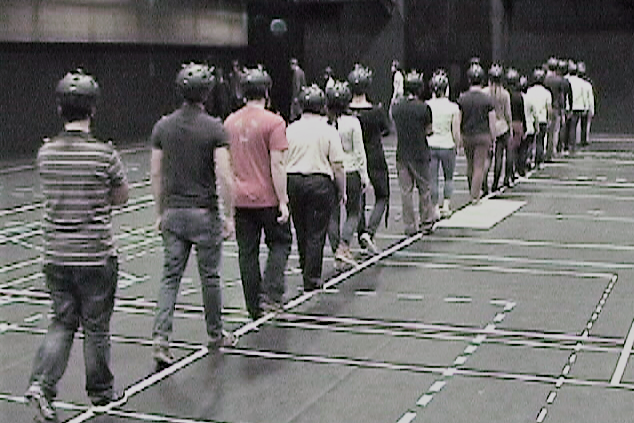
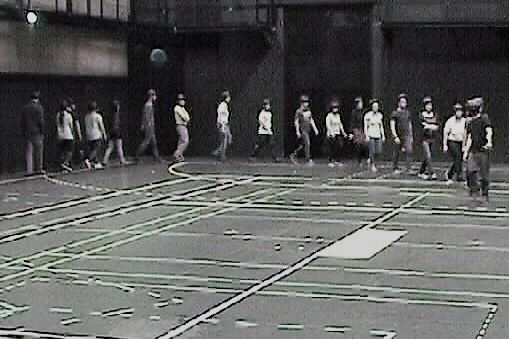
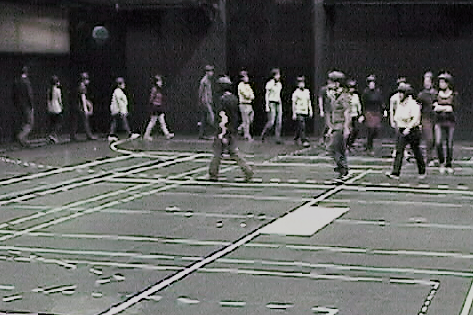
The general aim of the experiments carried out in the PEDINTERACT project was to study the spontaneous choices that pedestrians make in their walking when density or speed constraints are relaxed. More specifically, two types of experiments were carried out:
-
•
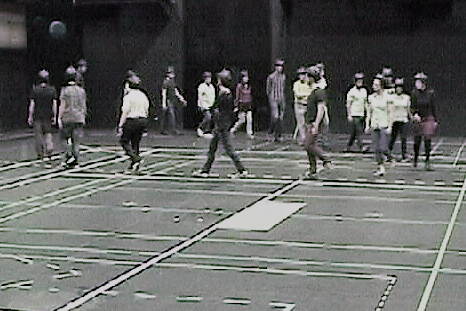
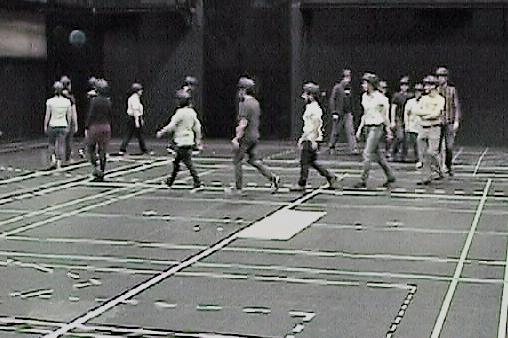
Line experiments: participants were asked to cross a room following a line drawn on the floor (see Fig. 1, top row). They were not allowed to pass each other. We studied two conditions, one in which the first participants had no further instructions on how to cross the room, called line-free, and one in which the first participant was asked to walk slowly, thus limiting the speed of all participants behind him, called line-slow.
-
•
Circle experiments: participants were asked to follow each other to form a closed circle (see Fig. 1, bottom row). They were not allowed to pass each other. Neither the radius nor the center was given.
What these two types of experiment have in common is the absence of control over the density of the participants, who are free to adjust locally the distance separating them from their predecessor, i.e. their headway. Density, whether global or local, is thus the sum of each participant’s contribution. Speed was also left uncontrolled, except in the line-slow experiment, where we forced participants to walk at a slow speed by asking the first participant to walk slowly. In all other cases, speed was a free parameter. Of course, since participants could not walk faster than their predecessor because they were asked not to overtake, the predecessor’s speed can be considered as an upper bound.
II.2 Experimental setting
| Experiment type | Number of trials | N. of participants |
|---|---|---|
| Circle | 6 | 18 |
| Line-free | 7 | 31 to 36 |
| Line-slow | 3 | 33 to 36 |
The experiments [27] were carried out in a large sports hall which is part of the Immermove platform of the M2S laboratory (Rennes-France). Two sets of experiments were performed on and of March 2016, with 36 adults participating each day. Our study complied with the Declaration of Helsinki and was approved by our local ethics committee (COERLE).
Each experimental protocol was carried out on both days - with different participants - and repeated several times to obtain some statistics. We call each repetition of an experiment a trial. Groups of up to 36 participants were involved in each trial of the line-free and line-slow experiments. Half groups of 18 participants were involved in each trial of the circle experiments. Table 1 shows the number of trials we ran for each type of experiment. Note that the order of participants in each trial was randomised, as was the composition of the sub-groups of 18 people for the circle experiment.
We collected the movement data using a Vicon system consisting of 26 cameras that tracked 4 reflective markers glued to the top of the head on a helmet worn by the participants. Markers were also placed on the shoulders of the participants.
II.2.1 Line experiments
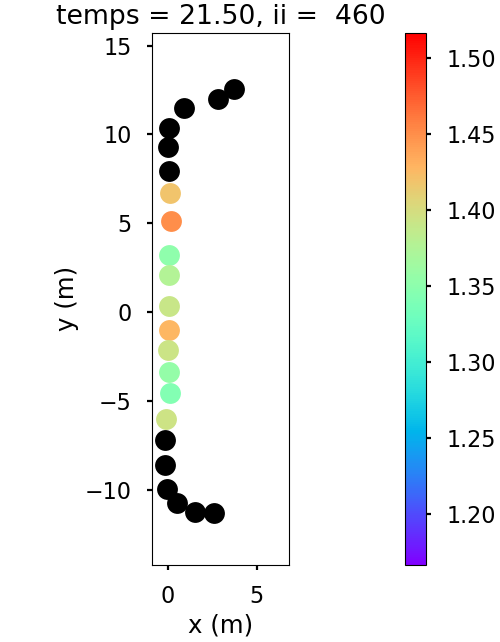
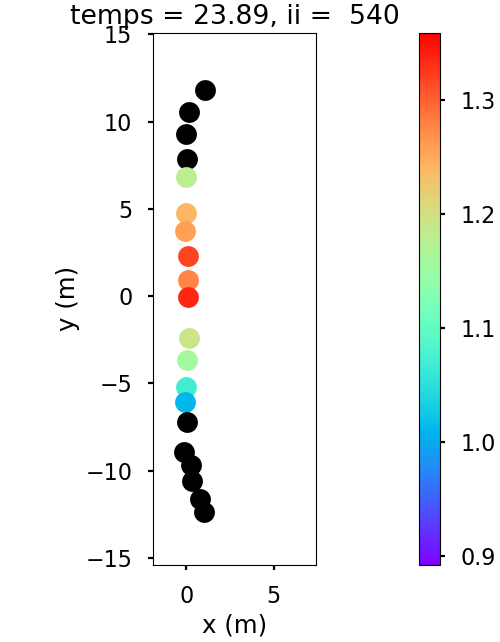
Fig. 1-top shows pictures of the line experiment, Fig. 2 gives a top view of the instantaneous positions of participants at given times. The line was approximately long, and one can see participants approaching the beginning of the line and leaving it, forming curved trajectories at extremities. In order to avoid boundary effects, we have retained for our analysis only the central part of the line, far from extremities (approximately the 14 central meters of the line). In Fig. 2 participants in (resp. outside) the measurement area are represented by colored (resp. black) disks. Plots of the whole set of trajectories for given realizations of the line-free and line-slow experiments can be found in Fig. 1 of Section II in Suppl. Mat.
While the number of participants was almost the same in all line experiments, the duration of the line-free experiments (from 45 to 60 seconds) was significantly shorter than that of the line-slow experiments (from 77 to 88 seconds), as expected.
II.2.2 Circle experiments
Fig. 1-bottom shows pictures of the early stages of a circle experiment, with the gradual formation of a circle. There was no indication given to the participants about the size of the circle to be formed.
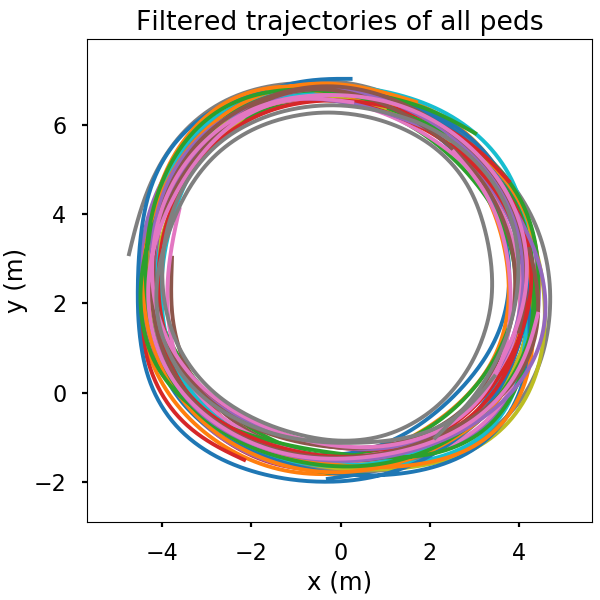
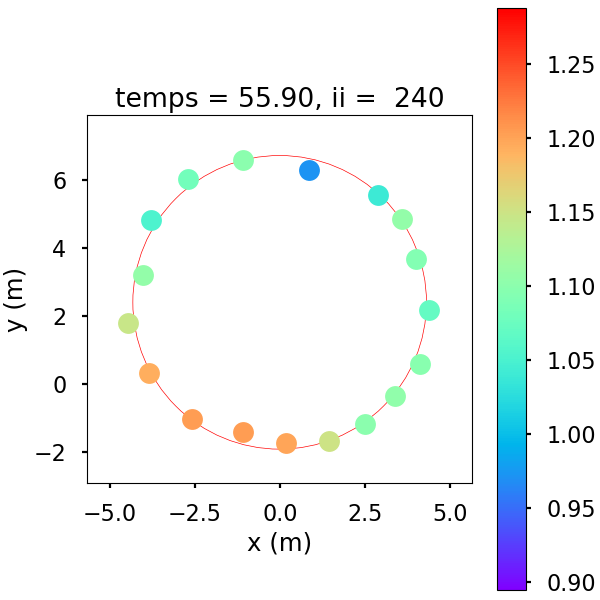
Once the circle is formed, Fig. 2 shows the participants’ trajectories for one given realization (plots for other realizations can be found in Section II of Suppl. Mat.), as well as the instantaneous positions of the participants at a given time with speed being colour coded.
It can be seen that the participants were able to complete the task correctly, forming a circle quite accurately - an observation that will be quantified later.
II.3 Postprocessing
The VICON software was used to reconstruct the 3D trajectory of each marker, and associate the markers with a given participant [28].
II.3.1 Head and shoulder positions
At each time frame, we reconstruct two independent positions for each participant. One is the average position of the head markers, the other is the average position of the shoulder markers.
Markers are sometimes occluded, especially those on the shoulders. When a head marker is occluded, the VICON software allows its position to be reconstructed from the position of the other head markers, provided that enough of them are visible. However, this is not always possible. We only keep the data if all the marker positions of one type (head or shoulder) are known (directly or from reconstruction).
Shoulder-based positions are more likely to be missing due to occlusion, but is a priori more accurate than the head position, as the head can move independently of the whole body, at least to some extent. A secondary aim of this paper is to estimate the discrepancy between the two types of measurements. Throughout the paper we will therefore investigate how much our results can vary depending on which part of the body is tracked.
II.3.2 Step filtering
Participants’ steps and sway induce some oscillations around the mean trajectory, which should be filtered out before, for example, estimating the distance between two participants. To make the data easier to handle, we have kept only 25 frames per second from the original 120 frames per second. We want to filter out steps with a period of about s (for two steps), i.e. with a frequency of in normalised units. To do this we used a 2nd order low pass Butterworth filter with a cut-off frequency of .
As explained above, trajectories can be interrupted from time to time due to occlusion. Applying the filter directly to short trajectories can cause strong boundary effects. Also, it is useless to filter out steps if the trajectory piece is too short compared to the step period. compared to the step period. To avoid this, we initially only kept trajectory segments longer than 4 seconds. Also, before applying the low-pass filter, we applied some reflections to the trajectory pieces as explained in Section I of Suppl. Mat.
III Spontaneous choice of headway and velocity in density-free 1D flows
At any time, it is possible to define the instantaneous speed of a given participant as the derivative of his filtered position. It is interesting to relate the norm of the instantaneous velocity (speed) to the instantaneous distance of the participant from his predecessor (headway) or to the instantaneous individual density defined as the inverse of the headway 111Some authors define the density from a headway which is the average of the distance with the predecessor and the follower [5]. Here, assuming that it is the distance ahead of the participant that predominantly determines his speed, we have chosen to consider only the headway ahead.. Section III in Suppl. Mat. shows the fundamental diagram for a particular realization of the circle experiment.
Also for the line experiment, although the speed of the participants is to a large extent dependent on the speed of the leader, some variations are still visible, as can be seen in Fig. 2. Similarly, fundamental diagrams under the form of 2d histograms can be obtained for each realization of the line experiment (see. Section III in Suppl. Mat. for an example).
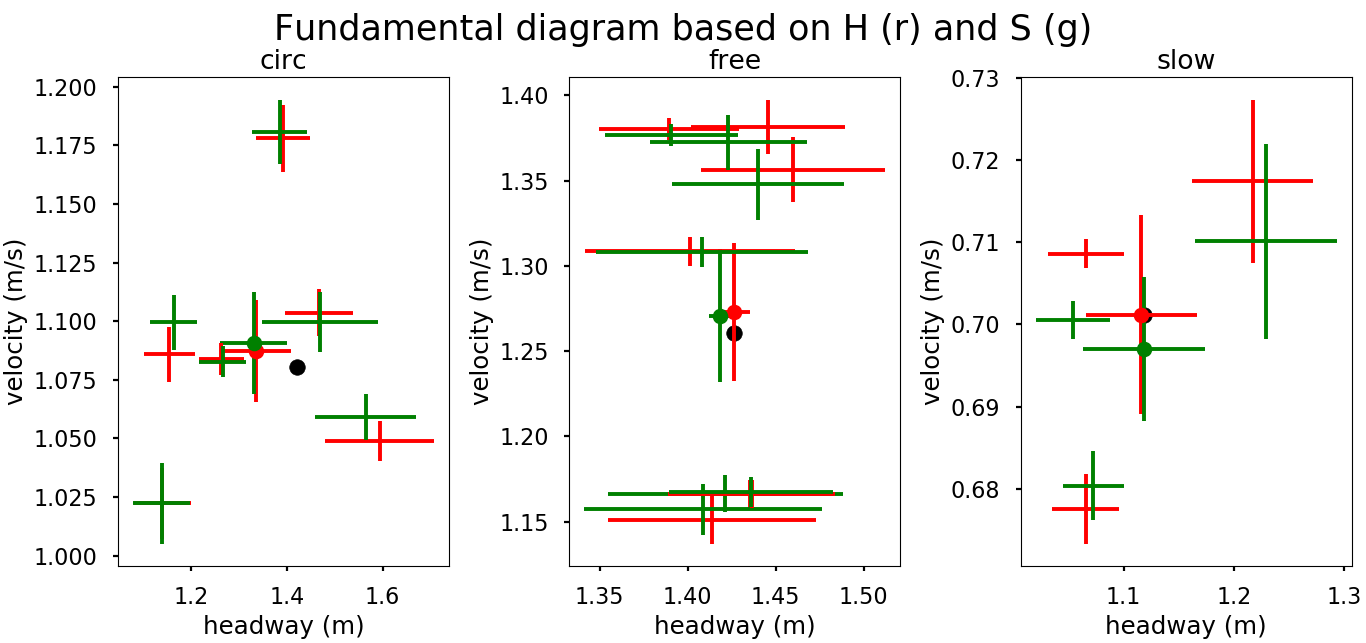
An average value and its associated SEM - Std Error of the Mean - is estimated from the (speed, headway) values of each experimental realization. All these values are reported on the Figures 4 for the different types of experiments. A second average is then taken over the realizations.
These measurements can be used as a benchmark to evaluate the differences between head and shoulder tracking. In fact, both types of tracking give quite similar results, although the discrepancy is greater for the slow line. Indeed, it is expected that swaying is more important when participants are forced to walk slowly, which could explain the difference.
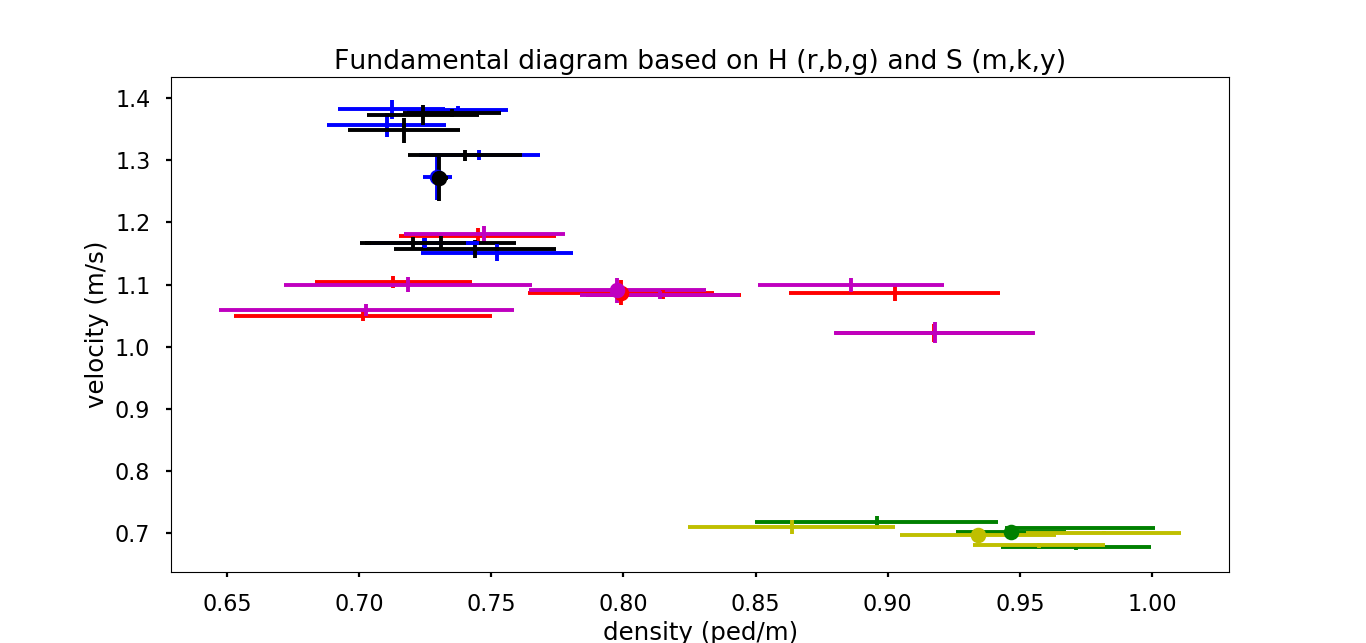
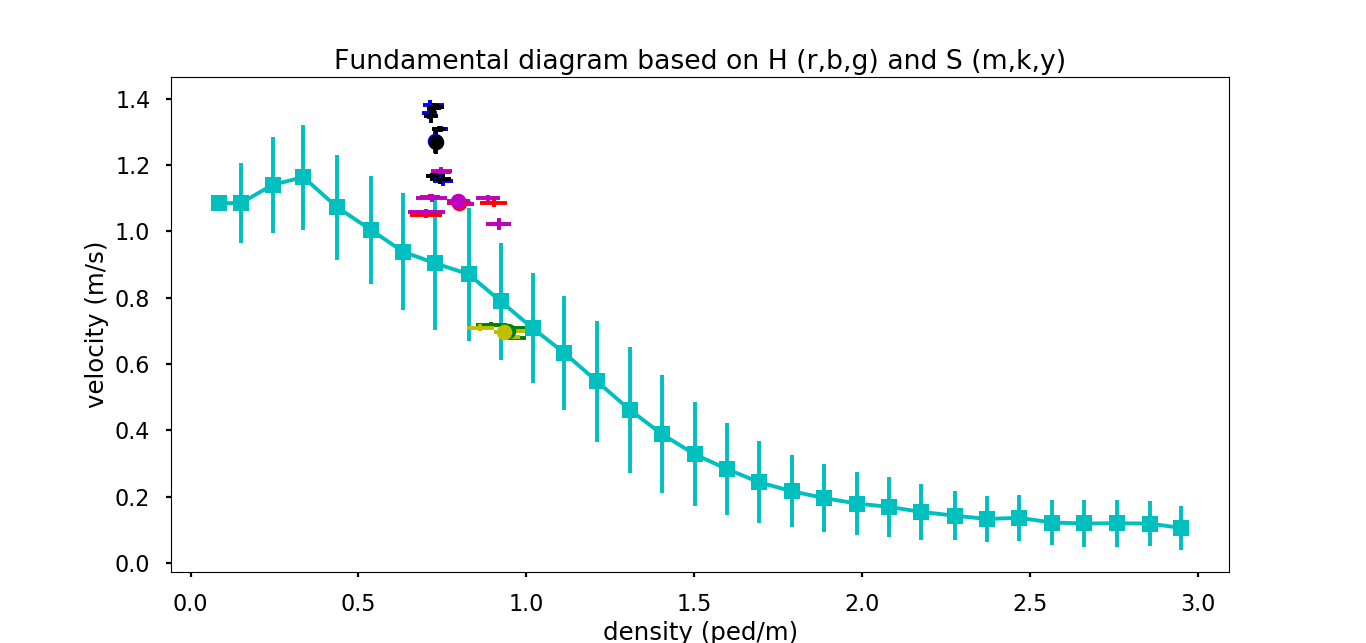
In order to make it easier to compare the results obtained for the different types of experiment, the same data as in Fig. 4 are collected in Fig. 5.
Let us first compare the results of the circular (red-magenta) and line-free (blue-black) experiments (Fig. 5-top). It is striking that the density is almost the same for all the line-free realizations (with varying speed), whereas for the circle experiment it is the opposite: the speed is almost the same for all realizations and the density varies.
Several hypotheses can be put forward to explain this difference. In both types of experiment, the participants were free to choose their heading (or local density) and their speed. In the circle, however, the periodic boundary conditions mean that all participants have the same average speed. The resulting speed is therefore the result of a tacit negotiation, which, like averaging, can lead to more stable values.
It could be argued that in the line-free experiment, people were also free to choose their speed, provided it was lower than that of their predecessor. However, in this case there is no possibility of visual negotiation, and one may wonder if the higher speeds observed are not due to a social pressure resulting from the fact that each participant knows that his own speed will limit the speed of all his followers.
The fact that we observe lower speeds in the circle case could be related to the fact that curved trajectories are more difficult to follow from a locomotion point of view than straight lines. However, lower speeds could also be due to the need to make a collective decision about the circle, hence some attentional demand which can slow down the whole movement. It should be noted, however, that the circle experiments in this paper of this paper yield higher speeds than those of [6] where participants had to walk along a wall.
Regarding the variability of density in the circle experiment, it appears that participants choose it very early in the formation of the circle, a fact that will be discussed further in section V. This may lead to more atypical density choices.
In the line-slow case, the speed is strongly constrained by the low speed of the leader. As a result, the speed is almost constant in all realizations. Note that the participants could have chosen to maintain some large and comfortable headways. However, this is not the case. If we compare with the fundamental diagram obtained in [6] along a fixed circular path, we find that the line-slow regime coincides with these older data. This is quite surprising as the decision process is quite different. In [6], the global density (and thus the average walking speed) is fixed, and participants can only collectively adjust their speed. Here it is the speed that is fixed (at least strongly upper bounded), and participants can choose their headways individually. The fact that the same result is obtained probably indicates that some automatic behaviour associated with walking in constrained flows. It may also be that in the line-slow experiment, although participants could choose arbitrarily large distances, there is again a social pressure from behind that prevents them from doing so.
It may also be this social pressure that leads to a fairly homogeneous choice of densities in the line-free case, rather than a shared preference for given distances, although we have no support for this hypothesis.
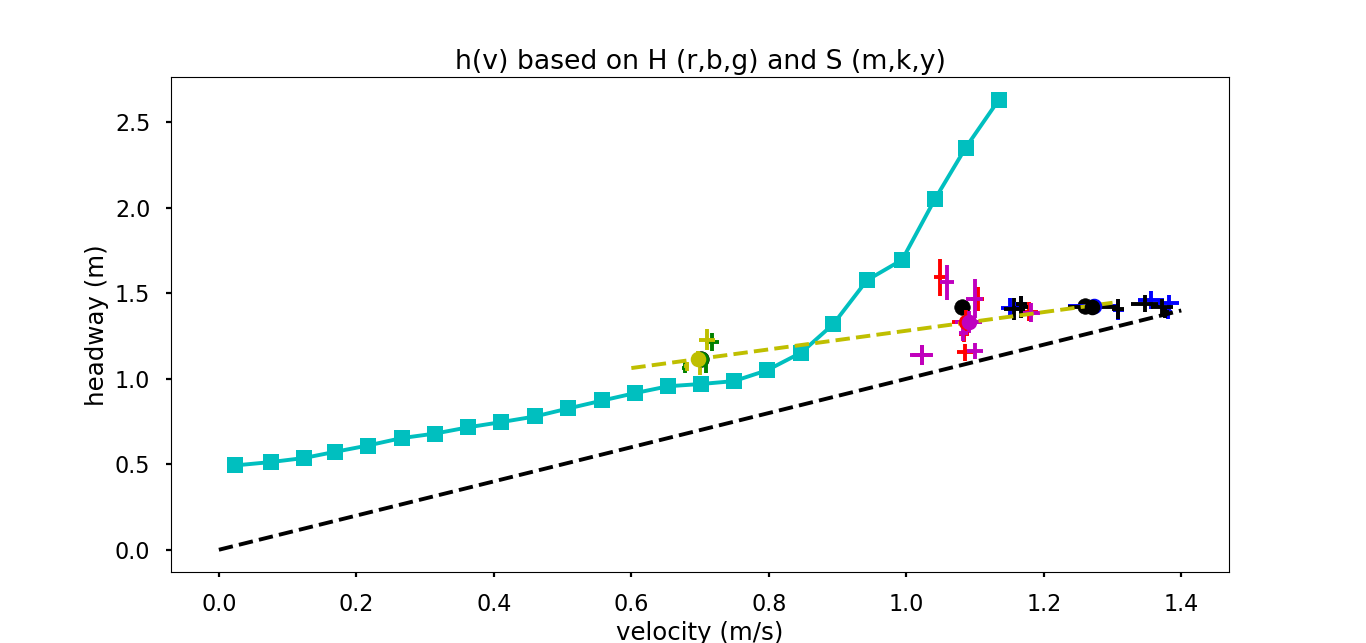
In [6] we found that the jamming transition also corresponds to a change in the typical time scales involved (slope of the curves in Fig. 6). This allowed us to distinguish a weakly constrained regime at intermediate densities and a strongly constrained regime at high densities (small headways).
Here it appears that although the constraints are relaxed in many ways, all experiments still fit to the high density regime (see the yellow dashed line and the low headway part of the cyan data in Fig. 6). The typical time associated with the yellow fit is , even smaller than the s found at high density in [6]. If we interpret this time as an adaptation time scale, this would mean that in the new experiments of the present paper, participants remain vigilant and stay on a fast adaptation branch, even though they would be free to choose a more relaxed pace and larger distances. One might wonder if this could be a sign of social pressure: participants have more freedom, but their decisions have collective effects, hence a higher level of attention.
We have also plotted on fig. 6 the curve with in and in . This curve gives the limit for a collision time of s if the predecessor would suddenly stop and its follower would keep its speed constant. In other words, for any point below this curve there would be a high risk of collision if the participant had a reaction time of s and if the driver was also able to stop immediately after being warned. We can see that although some data are very close to this line, they never cross it.
IV Wave propagation in line experiments
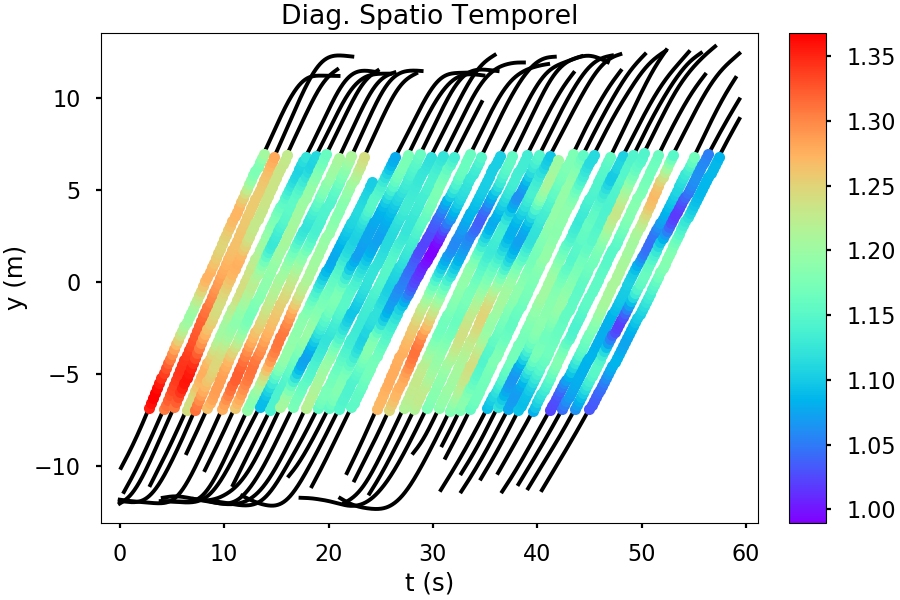
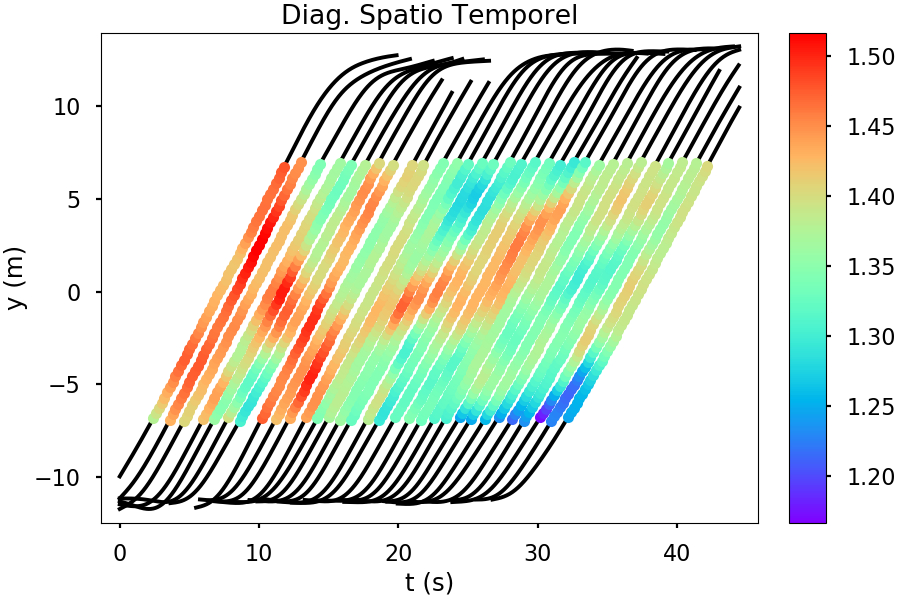
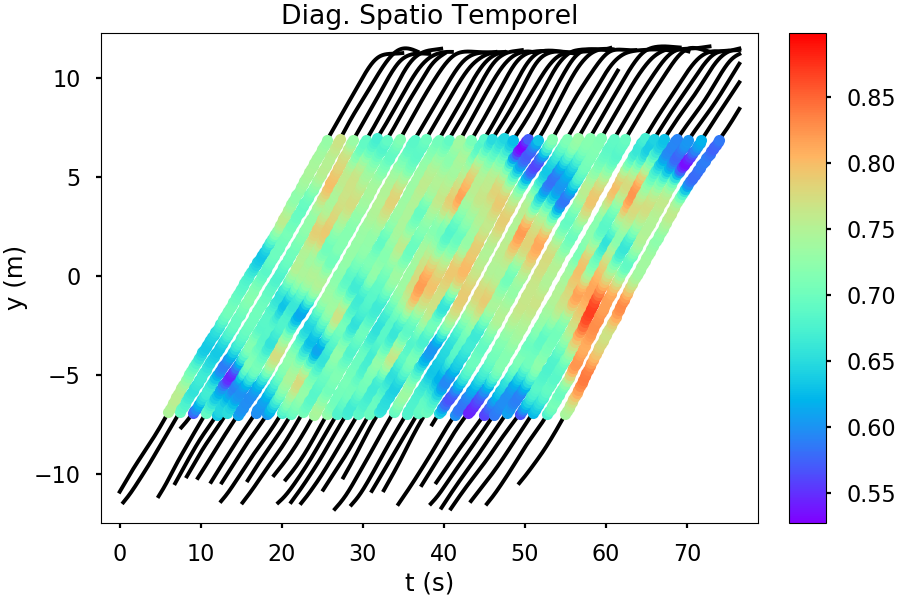
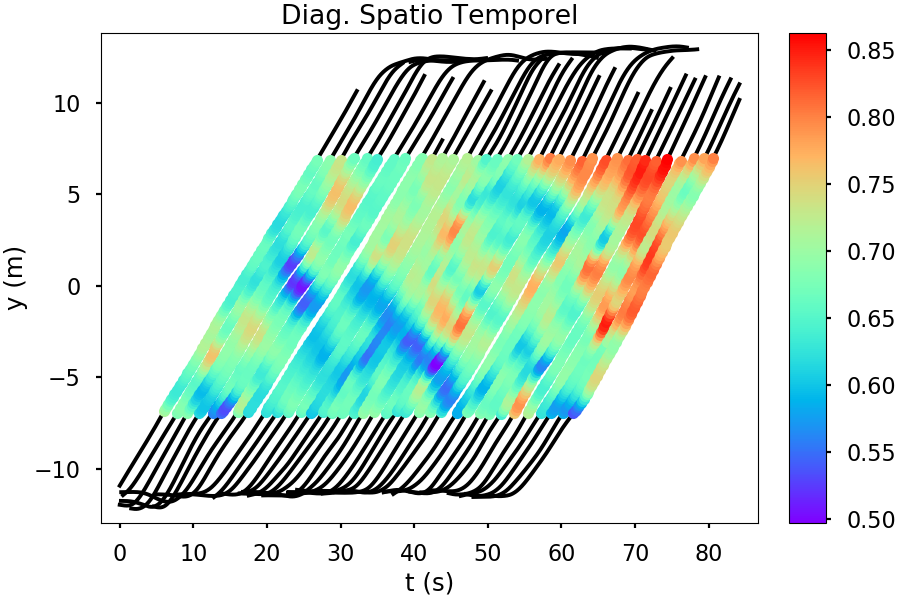
Spatio-temporal plots are useful tools to reveal global structures in the flow. Figures 7 and 8 show examples of such spatio-temporal plots for the free and slow line experiments. Individual trajectories are coloured according to the speed of the participants, revealing the propagation of velocity waves. All other spatio-temporal plots can be found in Section IV of the Suppl. Mat.
Comparing the figures for both types of line experiments shows that the direction of wave propagation is not the same in the free and slow cases. In the slow line case (Fig. 8), the waves propagate backwards, as is usually the case for the stop-and-go waves observed at higher densities [3, 30]. The same phenomenon of backward propagating stop-and-go waves is also observed for car traffic [31]. The important ingredient seems to be that participants are prevented from walking as fast as they would like by the presence of a slow-moving predecessor.
In contrast, in the free-line case (Fig. 7), although the signal is more noisy, the waves seem to propagate in the same direction as the participants. However, the speed of the waves is different from that of the participants.
Again, this is consistent with previous experiments performed at free flow densities in a circular corridor, where density/velocity anomalies were more or less advected with the flow, albeit at a slightly lower speed [32].
We have measured the velocity pair correlation function, defined as
| (1) |
for both line-free and line-slow experiments. The average is an average at position and time .
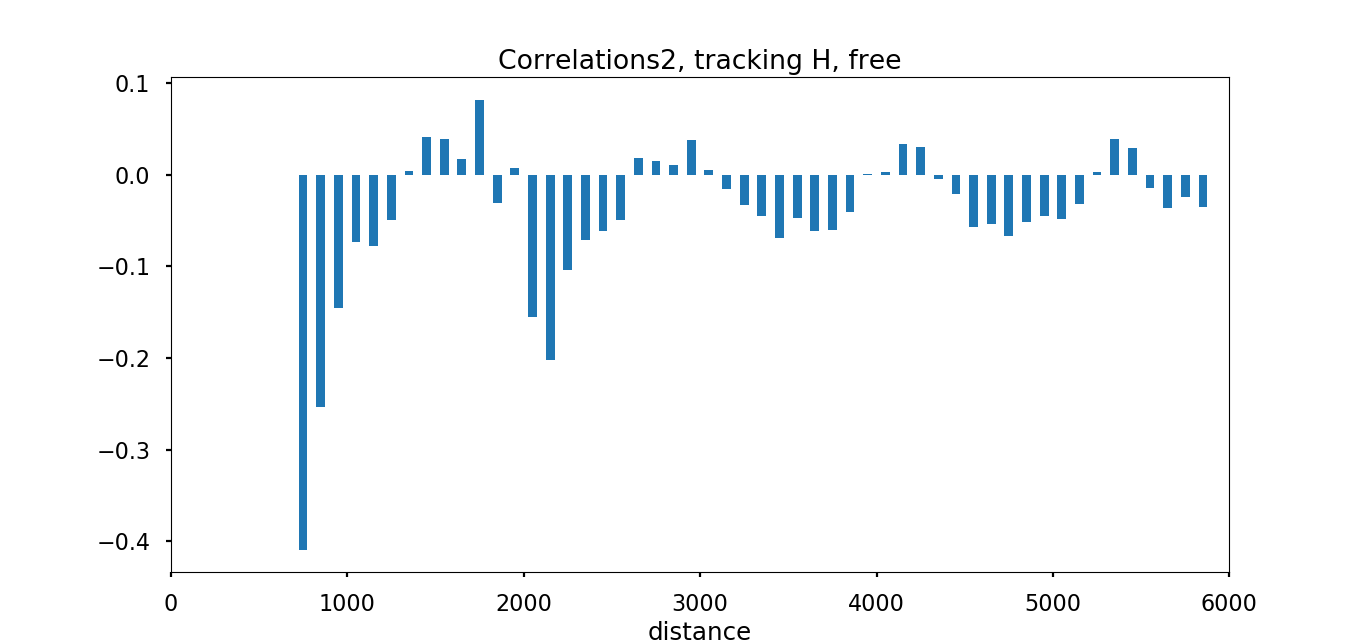
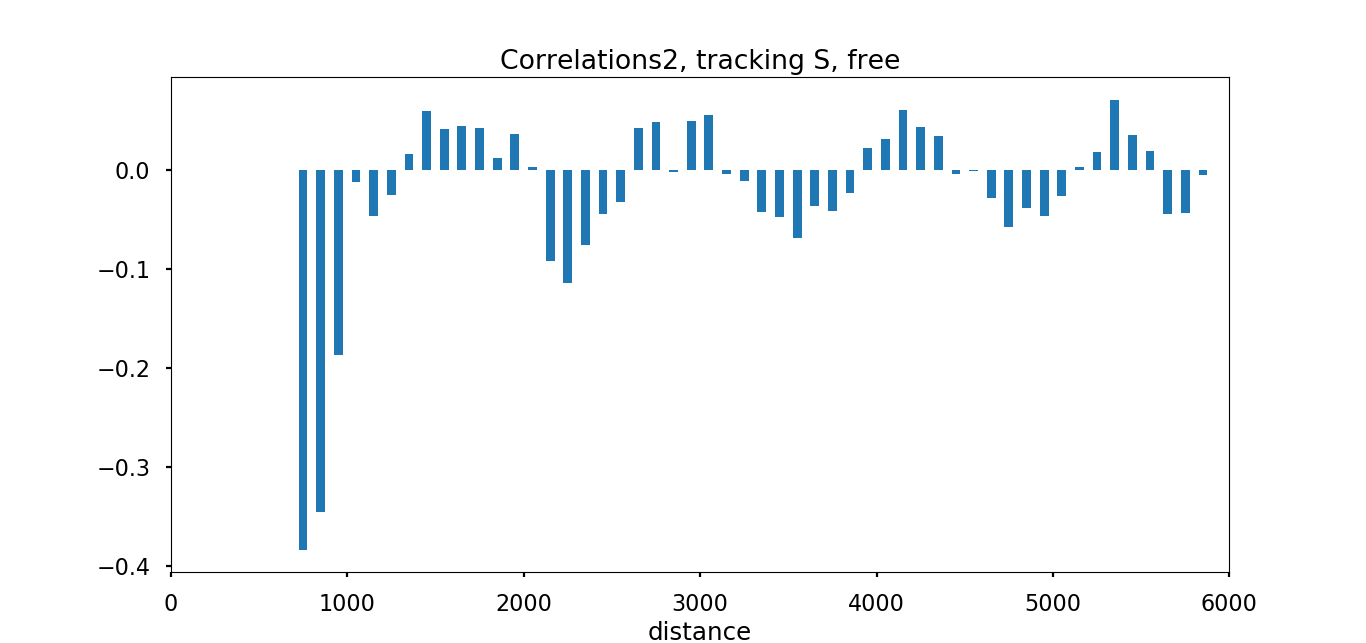
For the line-free case (Fig. 9-left), is negative at the shortest distances. There are several hypotheses to explain this. It could be that participants tend to slow down when they are close to others in order to maintain a minimum distance. Another hypothesis could be that there is a certain reaction time. However, it could also be that the anti-correlation is due to a swaying movement that produces a periodic variation in speed, with the following participants walking with an anti-phase synchronisation in the step cycle (indeed, some visual inspection of the videos seems to confirm that anti-synchronisation is not rare). A possible explanation for this out-of-phase synchronisation could be that favours visibility.
Interestingly, shows an oscillation as increases, with a wavelength of about meters. The signal is roughly the same whether the tracking is based on heads or shoulders.
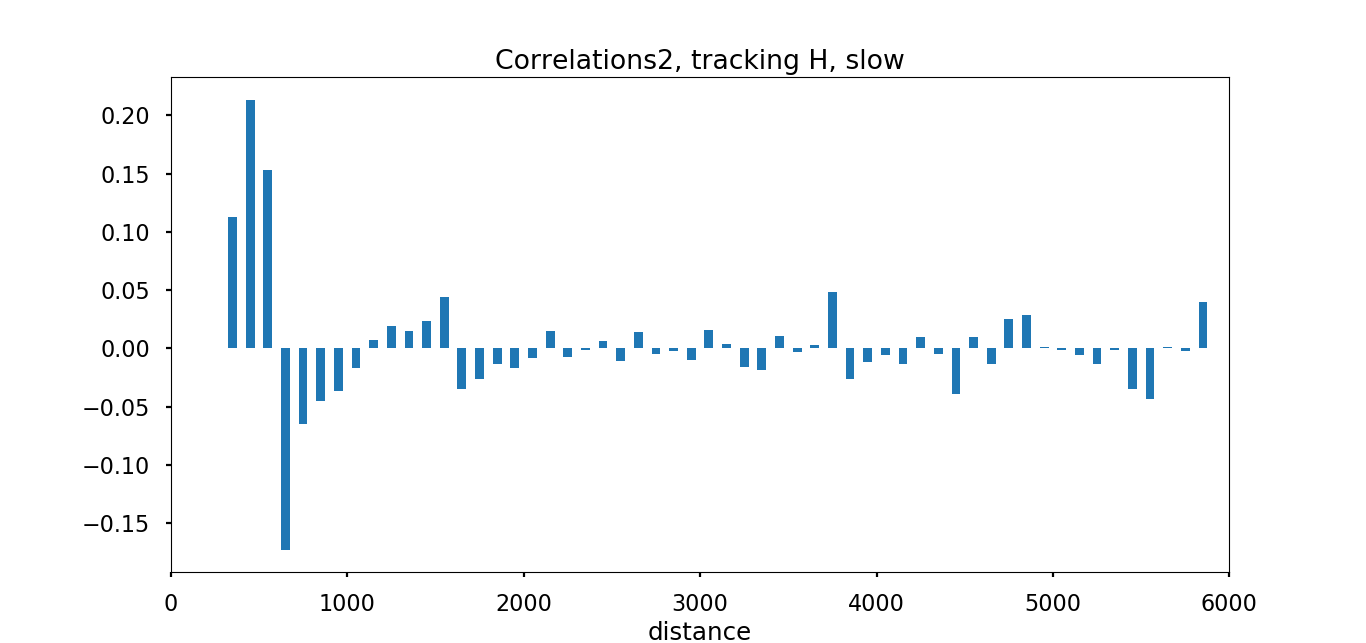
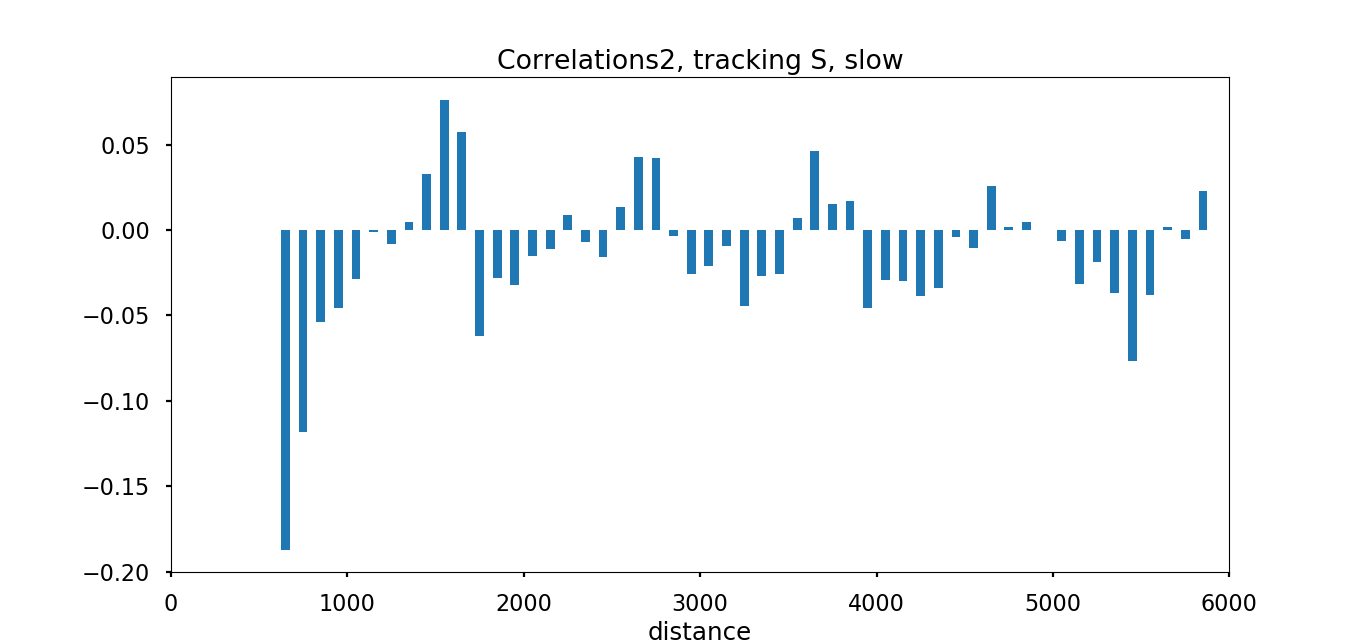
For the line-slow case (Fig. 9-right), it is only when shoulder tracking is used that clear oscillations appear over the whole range of distances. The wavelength is of the same order as in the line-free case, but slightly shorter: an estimate of 4 periods gives about 1.09 meters. It is noteworthy that this oscillation, which is rather weak in amplitude, is visible in both sets of experiments for free and slow leader speed, which are, of course, independent experimental realizations.
In the case of head tracking and slow leader, the oscillation signal rapidly becomes blurred. This may be due to the swaying that is known to occur when motion is impaired at high densities [21], which could be amplified by head movement. Then it is necessary to have a more robust marker of body position, such as the shoulders, in order to correctly track the participant’s position.
However, it should be noted that head tracking provides data for shorter distances than shoulder tracking. This may be because heads are easier to track in a dense configuration. Of course, care must be taken when using this part of the data, as there can be artefacts from head bending. Nevertheless, as far as this data can be trusted, it seems to indicate a positive speed correlation at very short distances. This is the case for distances between body centers of between and cm, some phenomena such as step synchronisation (or lock-step) could indeed occur, as observed in some other experiments [4, 21].
V Analysis of the circle experiments
Participants were asked to walk in a circle, but it was not obvious a priori how accurately they would perform this task. Figure 3 shows that the participants successfully completed the task. We can see that the shape of their trajectory is close to a circle with a diameter of about . Also, the characteristics of the formed circle seem to be quite constant over time.
We further quantified our visual impressions by considering the 6 realizations of the circle experiment and fitting a circle to the participants’ positions at each time step. We looked at the displacement of the center of the fitted circle, the variations in its radius, and the distance of each participant from the mean radius, as we will now explain.
For each experiment, we removed the transients at the beginning and at the end of each experiment and performed our analysis in the steady state. The steady-state duration for each of the 6 realizations of the experiments was: 71, 50, 25, 24, 24 and 10 seconds.
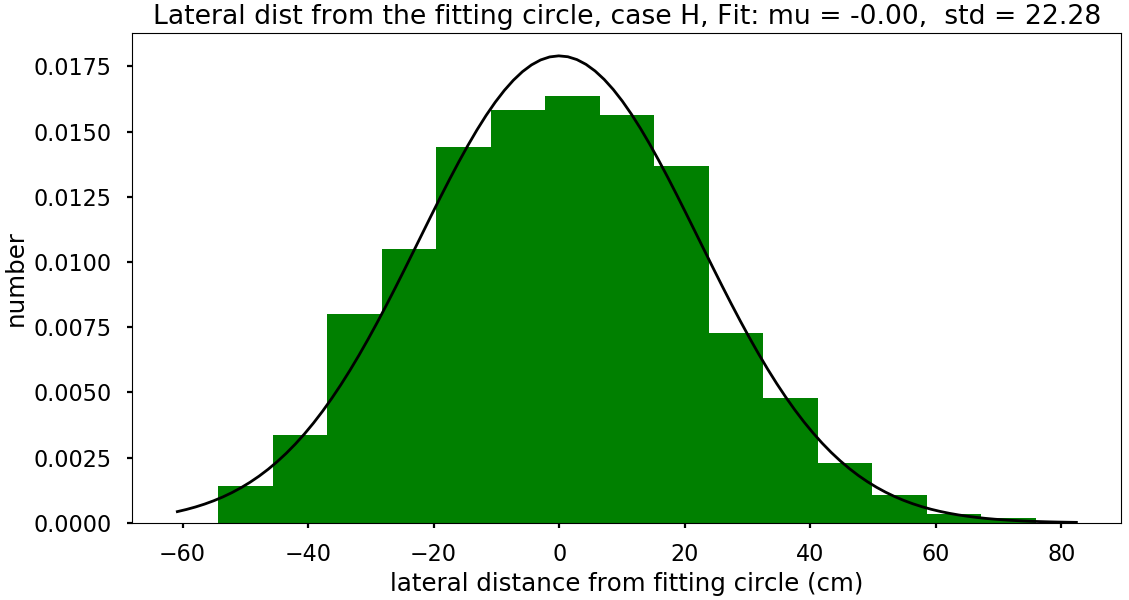
To quantify whether participants were able to form a circle, we measured the lateral distance of each participant from the participant from the matching circle at each point in time, and found that the distribution of these distances is typically Gaussian with a standard deviation of m (Fig. 10 shows the distribution for one of the realizations). This value can be compared with the average radius of the circle, which is meters. So we find that % of .
Assuming that the center of the circle follows a random walk, we have calculated its diffusion coefficient from the relation valid in 2 dimensions
| (2) |
where is the distance of the center from its initial position. The resulting diffusion coefficient is , which means that after a minute, the typical displacement of the center will be cm, or, in other words, of the radius.
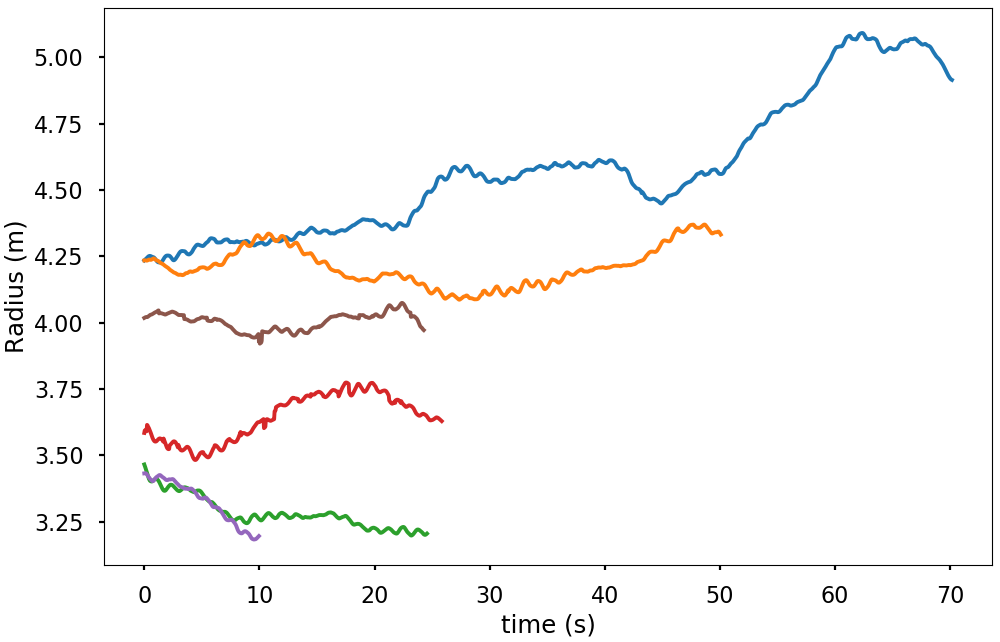
We have seen that participants are quite successful at forming circles. However, the radius of the circle can be quite different depending on the experiment, while it is quite stable in a given realization. So it seems that the state reached is not always exactly the same, but once chosen, participants stick to it as if it were the result of a collective decision.
It is therefore interesting to look more closely at how the circle is formed.
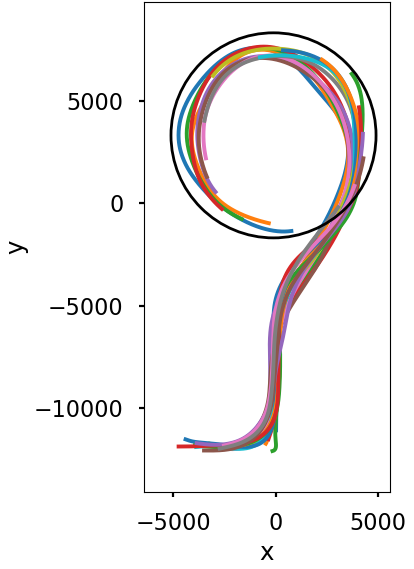
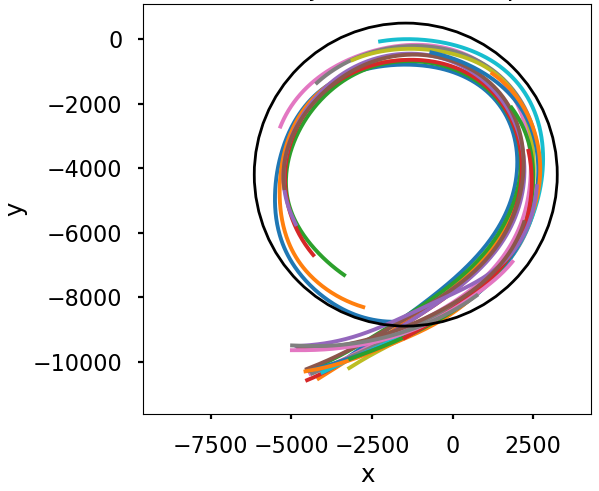
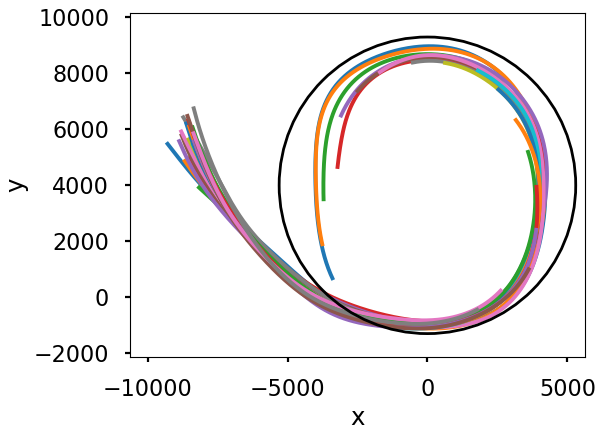
Fig. 12 shows the trajectories of all the participants during the formation of the circle. There is a remarkable overlap between them, which means on the one hand that the participants first form a line which they close by following each other, rather than coming from all directions, and on the other hand that the choice of the circle shape is anticipated long before the circle is completely closed.
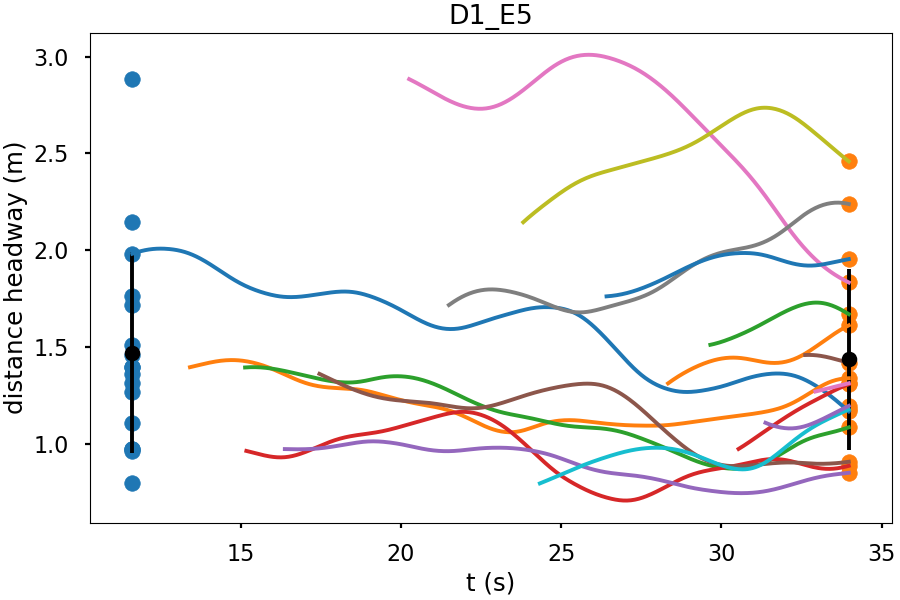
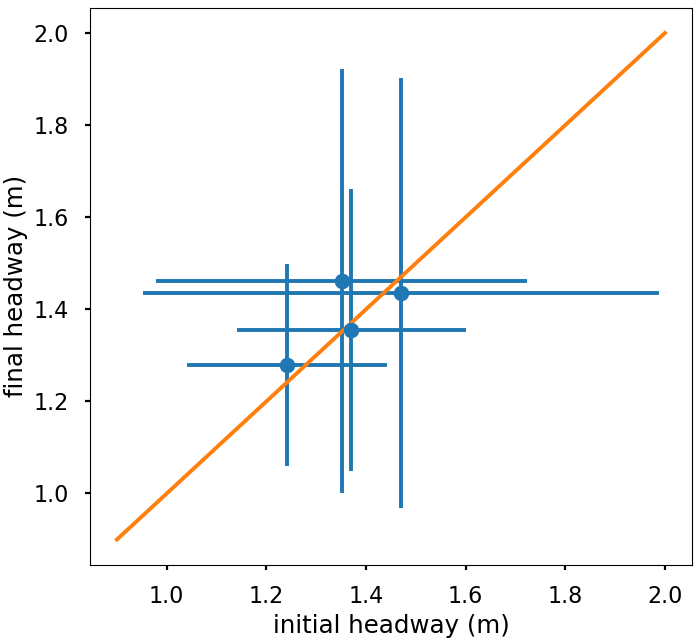
To quantify this, we graphically define by hand a circular area within which the circle is formed. In the remaining of the paper, we call this area “formation area” (limited by the black circle in Fig. 12). For each participant, the headway is measured, first, when he or she enters the formation area, and second, when the circle is finally formed (blue and orange dots in Fig. 13-top; see Section V of Suppl. Mat. for other realizations). Though there are fluctuations, still the interdistances are relatively stable during the circle formation process. This is confirmed by averaging the initial and final headways over all participants. Indeed, plotting final versus initial headways shows a good correlation (Fig. 13-bottom). The only point slightly off the diagonal corresponds to the unique realization where one of the participants still had a significant headway relaxation after the circle was closed.
In order for participants to make this early choice of headways, a visual negotiation probably takes place, which is supported by the observation that many participants turn their head towards the participants on the opposite side while walking.
VI Discussion and conclusion
This paper presents a series of experiments on one-dimensional pedestrian flows. In contrast to our previous experiments [6], here the flow is less constrained, either because the participants can choose their path ( circle experiments), or because the absence of a periodic boundary condition allows a free choice of headway. In both cases, the participants can determine, individually or collectively, their density. In addition, in the circle experiment, they can collectively choose their velocity. This degree of freedom is only partially available in the line experiment.
We have shown that participants are quite at ease with the task of forming a circle. Remarkably, this leads to a very stable choice of speed modulus, possibly because the necessary collective choice plays the same role as a kind of averaging.
In the line-free experiment, it is the density that is remarkably stable, while there is no constraint forcing participants to choose such short headways. Combined with fairly high speeds, this means that participants are keeping up with the fast adaptation branch that has only been observed at high densities in previous experiments. In fact, all the experiments in this paper align with this fast adaptation branch. One possible explanation is that participants feel more social pressure when they are responsible for their decisions. This could explain why they stick to behaviours that correspond to shorter adaptation times, even at lower densities. In contrast, in [6] the movement is more constrained (fixed density, fixed path), and participants are more passive. They may then favour more comfort by choosing a behaviour that allows a longer reaction time.
When the leader imposes a low upper limit on the speed (line-slow experiments), we found that the density is spontaneously increased to stay at the same to the same operating point as when the density was imposed and the velocity was left free as in [21]. We could therefore say that ”imposed velocity” or ”imposed density” commute in flows close to the jamming. It would be interesting to check whether this is still the case for even lower leader velocities.
Although walking in a line - curved or straight - may seem like a relatively simple task, the cognitive tasks associated with the remaining degrees of freedom have a direct influence on the flow and can lead to quite different behaviours, as the comparison with the more constrained flows of [6] reveals. It would be interesting to design new experiments to further disentangle the different effects of social pressure from behind, comfort, goal attainment, locomotor constraints, step synchronisation, etc.
Acknowledgements.
We acknowledge some preliminary analysis of the data by Aymeric Duigou-Majumdar with financial support from Labex PALM (ANR-10-LABX-0039-PALM) in the frame of ”Investissements d’Avenir”. C. A.-R. acknowledges travel support from the project GAMEPED funded by CNRS in the frame of the ”Défi S2C3”. Experiments were designed and organized by the PEDINTERACT partnership and realized at the laboratory M2S from Rennes 2. We are in particular grateful to Armel Crétual and Anthony Sorel for their help during the experiments. PEDINTERACT experiments were funded by the Inria SIMS associated team as well as the ANR PERCOLATION ANR-13-JS02-0008 project.References
- Haghani [2020] M. Haghani, Empirical methods in pedestrian, crowd and evacuation dynamics: Part i. experimental methods and emerging topics, Safety science 129, 104743 (2020).
- Ondrej et al. [2010] J. Ondrej, J. Pettré, A.-H. Olivier, and S. Donikian, A synthetic-vision based steering approach for crowd simulation, ACM Trans. Graphics 29 (2010).
- Lemercier et al. [2012] S. Lemercier, A. Jelic, R. Kulpa, J. Hua, J. Fehrenbach, P. Degond, C. Appert-Rolland, S. Donikian, and J. Pettré, Realistic following behaviors for crowd simulation, Computer Graphics Forum 31, 489 (2012).
- Seyfried et al. [2005] A. Seyfried, B. Steffen, W. Klingsch, and M. Boltes, The fundamental diagram of pedestrian movement revisited, J. Stat. Mech. , P10002 (2005).
- Seyfried et al. [2010] A. Seyfried, M. Boltes, J. Kahler, W. Klingsch, A. Portz, T. Rupprecht, A. Schadschneider, B. Steffen, and A. Winkens, Enhanced empirical data for the fundamental diagram and the flow through bottlenecks, in Pedestrian and evacuation dynamics 2008, edited by W. Klingsch, A. Schadschneider, and M. Schreckenberg (Springer-Verlag Berlin, 2010) pp. 145–156.
- Jelić et al. [2012a] A. Jelić, C. Appert-Rolland, S. Lemercier, and J. Pettré, Properties of pedestrians walking in line – fundamental diagrams, Phys. Rev. E 85, 036111 (2012a).
- Cao et al. [2016] S. Cao, J. Zhang, D. Salden, J. Ma, C. Shi, and R. Zhang, Pedestrian dynamics in single-file movement of crowd with different age compositions, Phys. Rev. E 94, 012312 (2016).
- Ren et al. [2019] X. Ren, J. Zhang, W. Song, and S. Cao, The fundamental diagrams of elderly pedestrian flow in straight corridors under different densities, Journal of Statistical Mechanics: Theory and Experiment 2019, 023403 (2019).
- Fang et al. [2019] Z. M. Fang, L. X. Jiang, X. L. Li, W. Qi, and L. Z. Chen, Experimental study on the movement characteristics of 5–6 years old chinese children when egressing from a pre-school building, Safety science 113, 264 (2019).
- Cao et al. [2019] S. Cao, P. Wang, M. Yao, and W. Song, Dynamic analysis of pedestrian movement in single-file experiment under limited visibility, Communications in Nonlinear Science and Numerical Simulation 69, 329 (2019).
- Chen et al. [2017] J. Chen, S. Lo, and J. Ma, Pedestrian ascent and descent fundamental diagram on stairway, Journal of Statistical Mechanics: Theory and Experiment 2017, 083403 (2017).
- Sun et al. [2018] J. Sun, S. Lu, S. Lo, J. Ma, and Q. Xie, Moving characteristics of single file passengers considering the effect of ship trim and heeling, Physica A: Statistical Mechanics and its Applications 490, 476 (2018).
- Huang et al. [2018] S. Huang, T. Zhang, S. Lo, S. Lu, and C. Li, Experimental study of individual and single-file pedestrian movement in narrow seat aisle, Physica A: Statistical Mechanics and its Applications 509, 1023 (2018).
- Shi et al. [2018] X. Shi, Z. Ye, N. Shiwakoti, and O. Grembek, A state-of-the-art review on empirical data collection for external governed pedestrians complex movement, Journal of Advanced Transportation 2018 (2018).
- Zeng et al. [2019] G. Zeng, A. Schadschneider, J. Zhang, S. Wei, W. Song, and R. Ba, Experimental study on the effect of background music on pedestrian movement at high density, Physics Letters A 383, 1011 (2019).
- Yanagisawa et al. [2012] D. Yanagisawa, A. Tomoeda, and K. Nishinari, Improvement of pedestrian flow by slow rhythm, Phys. Rev. E 85, 016111 (2012).
- Hu et al. [2021] Y. Hu, J. Zhang, W. Song, and N. W. Bode, Social groups barely change the speed-density relationship in unidirectional pedestrian flow, but affect operational behaviours, Safety science 139, 105259 (2021).
- Chattaraj et al. [2009] U. Chattaraj, A. Seyfried, and P. Chakroborty, Comparison of pedestrian fundamental diagram across cultures, Advances in Complex Systems 12, 393 (2009).
- Gulhare et al. [2018] S. Gulhare, A. Verma, and P. Chakroborty, Comparison of pedestrian data of single file movement collected from controlled pedestrian experiment and from field in mass religious gathering, Collective Dynamics 3, 1 (2018).
- Zhang and Huang [2022] Y. Zhang and X. Huang, A review of tunnel fire evacuation strategies and state-of-the-art research in china, Fire Technology , 1 (2022).
- Jelić et al. [2012b] A. Jelić, C. Appert-Rolland, S. Lemercier, and J. Pettré, Properties of pedestrians walking in line. ii. stepping behavior, Phys. Rev. E 86, 046111 (2012b).
- Zeng et al. [2018] G. Zeng, S. Cao, C. Liu, and W. Song, Experimental and modeling study on relation of pedestrian step length and frequency under different headways, Physica A: Statistical Mechanics and its Applications 500, 237 (2018).
- Cao et al. [2018] S. Cao, J. Zhang, W. Song, R. Zhang, et al., The stepping behavior analysis of pedestrians from different age groups via a single-file experiment, Journal of Statistical Mechanics: Theory and Experiment 2018, 033402 (2018).
- Ma et al. [2018] Y. Ma, Y. Y. Sun, E. W. M. Lee, and R. K. K. Yuen, Pedestrian stepping dynamics in single-file movement, Physical Review E 98, 062311 (2018).
- Ren et al. [2021] X. Ren, J. Zhang, and W. Song, Flows of walking and running pedestrians in a corridor through exits of different widths, Safety Science 133, 105040 (2021).
- Yanagisawa et al. [2013] D. Yanagisawa, Y. Suma, A. Tomoeda, A. Miura, K. Ohtsuka, and K. Nishinari, Walking-distance introduced queueing model for pedestrian queueing system: Theoretical analysis and experimental verification, Transportation research part C: emerging technologies 37, 238 (2013).
- Appert-Rolland et al. [2020] C. Appert-Rolland, J. Pettré, A.-H. Olivier, W. Warren, A. Duigou-Majumdar, E. Pinsard, and A. Nicolas, Experimental study of collective pedestrian dynamics, Collective Dynamics 5, 1 (2020).
- Lemercier et al. [2011] S. Lemercier, M. Moreau, M. Moussaïd, G. Theraulaz, S. Donikian, and J. Pettré, Reconstructing motion capture data for human crowd study, Lecture Notes in Computer Science 7060, 365 (2011).
- Note [1] Some authors define the density from a headway which is the average of the distance with the predecessor and the follower [5]. Here, assuming that it is the distance ahead of the participant that predominantly determines his speed, we have chosen to consider only the headway ahead.
- Fehrenbach et al. [2015] J. Fehrenbach, J. Narski, J. Hua, S. Lemercier, A. Jelić, C. Appert-Rolland, S. Donikian, J. Pettré, and P. Degond, Time-delayed follow-the-leader model for pedestrians walking in line, Networks and Heterogeneous Media 10, 579 (2015).
- Nakayama et al. [2016] A. Nakayama, M. Kikuchi, A. Shibata, Y. Sugiyama, S. i. Tadaki, and S. Yukawa, Quantitative explanation of circuit experiments and real traffic using the optimal velocity model, New J. Phys. 18, 043040 (2016).
- Motsch et al. [2018] S. Motsch, M. Moussaid, E. Guillot, M. Moreau, J. Pettré, G. Theraulaz, C. Appert-Rolland, and P. Degond, Modeling crowd dynamics through coarse-grained data analysis, Math. Biosci. Eng. 15, 1271 (2018).