The precursor of the critical transitions in majority vote model with the noise feedback from the vote layer
Abstract
In this paper, we investigate phase transitions in the Majority-Vote model coupled with noise layers of different structures. We examine the Square lattice and Random-regular networks, as well as their combinations, for both vote layers and noise layers. Our findings reveal the presence of independent third-order transitions in all cases and dependent third-order transitions when critical transitions occur. This suggests that dependent third-order transitions may serve as precursors to critical transitions in non-equilibrium systems. Furthermore, we observe that when the structure of vote layers is local, the coupling between the vote layer and the noise layer leads to the absence of critical phenomena.
I Introduction
Phase transitions exist widely in nature. From traditional materials to the biological flock, both of equilibrium and non-equilibrium transitions, particularly critical transitions, exhibit simmilar bahaviors within the same universality classes [1, 2]. The transition from a disordered configuration to an ordered state in social systems such as opinion formation, cultural dynamics, language dynamics has attracted much attention in recent years as well [3]. Near the critical point, the social systems exhibit a quick response to external disturb or the avalanche effect. Hence, predetermination of the critical points or the locations of the points should be of significance. Statistical physics has proven to be a very powerful framework to describe the phenomena, and can help us well understand the essence of the critical transitions.
Recently, Qi and Bachmann [4] generalized the microcanonical inflection-point analysis method to identify and locate independent and dependent phase transitions. This method has been applied to the study of Ising model, flexible polymers and Baxter-Wu models, and has proven to be very successful [5, 6]. The results of these studies reveal the major transitions and distinguish the details of the transition processes by signaling higher-order transitions. Moreover, they found that the dependent transitions which can only occur in co-existence with independent transitions of a lower order. It has proven useful as a foundation for a better understanding of general geometric properties of phase transitions [7, 8] as well. K. Sitarachu and M. Bachmann [9]studied the Ising model in square lattice and found that the average cluster size(ACS) (excluding isolated single spins) become extremal at about the temperature of the third-order dependent transition in the paramagnetic phase. This suggests that a collective preordering of spins occurs in this temperature region in the disordered phase as a precursor of the critical transition. In the ferromagnetic phase, the average number of isolated spins peaks(ISN) at the independent third-order transition temperature that was identified by microcanonical analysis. Here, the increased number of such “seeds” of disorder in the ferromagnetic phase enables the formation of critical clusters once the critical point is approached.
Can the two new order parameters (ACS and ISN) be applied to non-equilibrium complex systems to forecast the critical transitions? After S. Galam’s pioneer work [10, 11, 12] on opinion formation, lots of studies have emerged in this field. One well-known non-equilibrium model in this domain is the isotropic majority vote model. This model exhibits a continuous order-disorder phase transition and has demonstrated that non-equilibrium stochastic systems with up-down symmetry belong to the universality class of the equilibrium Ising model [13]. The vote models in complex networks [14, 15, 16, 17, 18, 19] have been investigated and many of them focus on the effects of underlying topologies, such as random graphs [20, 21], scale-free networks [22], small world networks [23, 24] and other complex networks [25, 26, 22, 27, 28]. The critical transition is observed in different kinds of networks but with varied critical noise and critical exponents [17].
However, all the works mentioned above ignored a very important fact that in real social systems, systems interact with their environment, mutually influencing each other. The noise parameter q which reflects the degree of a person’s rational is often heterogeneous. Modeling complex phenomena through multilayer networks is a natural choice. Of particular interest in the study of multilayer networks is the coevolution between different dynamical processes. Liu et. al. studied a non-equilibrium model known as majority vote model coupled with reaction-diffusion processes on a two-layer multiplex network [29]. Their coupling mechanism induces a continuous order–disorder phase transition on random regular graphs, although this critical phenomenon disappears on square lattices. It needs to be ascertained whether the occurrence of this critical transition depends on the network topology or the feedback mechanism.
We will compare the behaviors of the MV model with different type of noises: homogeneous one caused by external environment, another homogeneous one caused by the feedback from the vote dynamics and heterogeneous noise coupled with the vote layer. In Section II, we provide a brief description of the model and our methodology. The results are presented in Section III, followed by discussions. Section IV concludes the paper and outlines potential future directions.
II The model and the method
II.1 The model
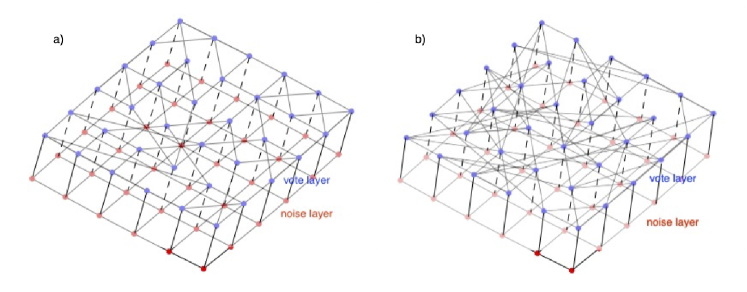
Our model is defined on a two-layer multiplex network, with each layer initially arranged in an square array. The structure of the network’s links is upon the specific network types employed. Square lattices (SL) and random regular networks (RRNs) are utilized in this work. To study the effect of the localization of the network on the phase transitions, we rewire the links of the RRN to enlarge the average shortest length [30] of the specific layer.The parameter is introduced to govern this localization effect. For rewiring, pairs of connected edges, denoted as and , are chosen at random. When the two edges are cross-rewired, giving rise to new connected edges, and . The Euclidean distances, denoted as , , and prior to the rewiring are calculated. Then the cost function is defined,
| (1) |
If , the change is always accepted. Otherwise, the rewiring is accepted only with probability
| (2) |
It’s important to note that the parameter significantly influences the average shortest length of the RRNs. A visual representation of our model can be found in Figure 1, illustrating that larger values of correspond to shorter average shortest lengths. By manipulating , we are able to construct both localized and non-localized network structures.
Consider a complex network in the upper layer, wherein each node is associated with a spin variable denoted as and the configuration of the system is denoted by . A given spin flips with probability if it agrees with the majority sign and flips with probability if it does not. The origin of the parameter could be attributed to various sources: it might emanate from the external environment, emerge as a feedback effect from the entire voting system, or result from feedback generated within the local cluster accompanied by diffusion on the noise layer. The subsequent paragraph will delve into elaborations on the latter two scenarios. The spin-flip probability is then defined by
| (3) |
where if and . The summation is over the neighborhood of the site and if site i and j are linked.
The noise parameter should reflects the degree of a person’s rational. It describes social tension that affects human behaviors. Liu et. al. [29] utilized a reaction-diffusion equation to describe the evolving of the noise in another layer of the multi-multiplex networks.
| (4) |
The parameter captures the rise in societal tension, resulting in a reduction of noise. The second term signifies the alleviation of societal tension due to the formation of collective structures within the voting layer. As clusters form, governmental interventions are prompted to mitigate societal tension and prevent further civil disturbances. Here, corresponds to the cluster size of site i in the voting layer, and represents the total number of nodes. The last term accounts for the diffusion of the noise within the noise layer. stands for the diffusion coefficient, and is Laplacian matrix, defined as where is the degree of the node .
If we consider the feedback without diffusion, all have the same value . The Eq. 4 can be derived to
| (5) |
where is the average of the spin and is the maximum cluster size. In the thermodynamic limit, the Eq. 5 goes into the mean-field regime.
The competing of the two mechanisms represented by the ratio , governs the trajectory of the system’s evolution, with a predetermined value of held constant. If noise parameters in the noise layer become too small, the formation of clusters in vote layer will tend to increase it. On the other hand, if noise parameters become too large, the cluster size will also be small and the constant decay will tend to decrease it. As a result of this delicate balance, a combination of constant decay and the influx of external noise passing through the noise layer clearly steers the system toward a non-equilibrium steady state.
II.2 The method
We carry out extensive Monte Carlo simulations on RRN and SL. The vote layer and the noise layer are not required to be the same. We investigate the different combinations: Both layers are RRNs or SL, or one is RRN and the other is SL. For the coupled evolving situation, we first update the configuration of vote layer and then update noise parameters in noise layer. Considering different time scales of the different dynamical processes, we update the spin configurations according to Eq. 3, then update noise parameters according to Eq. 4 or 5 after MC steps. Measured quantities in our simulations are the magnetization , mean value of noise , susceptibility and Binder cumulant at different ratio :
| (6) |
| (7) |
| (8) |
| (9) |
For the noise coming from external environment, standard MC simulations are carried out and is not calculated. The other quantities are obtained at different noise .
To obtain the critical exponents, we utilize finite-size scaling theory [31]. According to this theory, the thermodynamic properties obey the scaling forms, e.g.,
| (10) |
| (11) |
where , and are critical exponents that should obey the scaling relation at second-order phase transitions.
To determine the critical transition point accurately, the location of peaks in bulk quantities defines an effective transition ratio or noise that varies with the system size as
| (12) |
where is the inverse critical ratio at the thermodynamic limit and is a constant. Obviously, the value of is necessary to obtain the other critical exponents and the critical temperature at . We use the relation of the maximum of the derivatives of to obtain the exponent :
| (13) |
To detect the higher-order transitions, two extra parameters should be calculated during the simulations. They are ACS and ISN which give the signals of the dependent and independent third transitions, respectively. Sitarachu et. al define as the ACS containing more than a single spin in a given spin configuration
| (14) |
where labels the clusters with more than one spin, is the number of spins in cluster , and is the total number of clusters with more than one spin in . denotes the statistical average taken over - MCS.
exhibits a local minimum at the dependent third-order transition point for the Ising model. This transition takes place in the paramagnetic phase, in which the average cluster size decreases with increasing temperature. This decrease accelerates for temperatures below the dependent third-order transition point while slows down above the point. The unexpected minor change of monotony is an important signature of the catastrophic critical transition. The third-order independent transition occurs in the ferromagnetic phase. It reflects the emerging disorder and entropic variability. We use the single-spin cluster, i.e., an isolated single spin surrounded by nearest-neighbor spins with opposite orientation which suggested by Sitarachu et. al. The statistical average of the number of isolated spins per site shows a local maximum at the independent third-order transition point.
The positions of the two types of third-order transitions obtained by and are in agreement with the results of the microcanonical inflection point analysis in the Ising model.
III Results
III.1 Traditional critical transitions
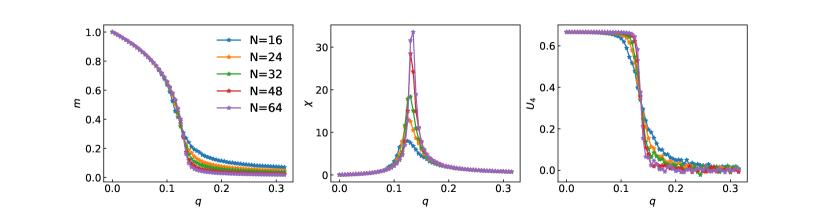
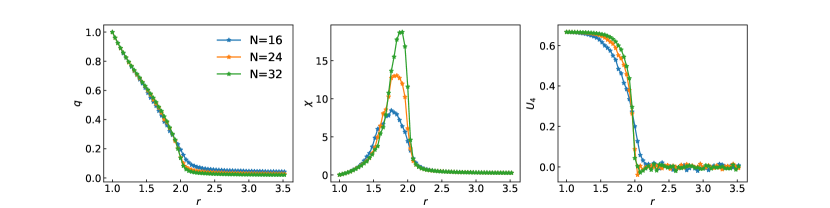
The typical data for bulk quantities in RRNs with external noise, as well as for coupled RRN for the vote layer and square lattice for noise layer with diffusion, are shown in figure 2 and 3 respectively. The curves of the Binder cumulants behave as normal second-phase transitions crossing at the fixed point.
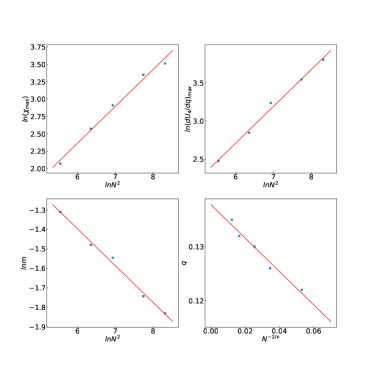
Applying the finite size analysis, we can obtain the critical exponents and critical noise or critical ratio . Figures 4 give the maximum of the corresponding quantities as a function of the lattice sizes for RRN. We plot the data of the log values and find excellent scaling behavior.
We then calculate the other cases: 1)the single-layer networks with homogeneous external noise, and 2)the single-layer networks with the noise feedback from the vote layer (The noise are generated via Eq. 5), and 3) the coupled RRNs for the vote layer(VL) and the noise layer(NL), and 4) the coupled RRN for the VL and the SL for the NL, and 5) the coupled RRN for the NL and the SL for the VL, and 6) the coupled SL for both layers (The noise are generated via Eq. 4 for the cases 3) to 6)). The results are consistent with the previous ones [13, 29] for the case 1) to 3). The critical transitions are found in the first three cases except the SL vote layer with noise feedback from the vote layer. We do not observe the signals of the critical transitions for the case 5) and 6). The results are in Table 1.
| or | ||||
|---|---|---|---|---|
| SL without feedback | ||||
| RRN without feedback | ||||
| SL with feedback only | ||||
| RRN with feedback only | ||||
| RRNs for both layers | ||||
| RRN for VL and SL for NL | ||||
| SL for VL and RRN for NL | ||||
| SL for both layers |
It is observed that if the noises come from feedback, the critical transitions could not arise in the square-lattice vote layer. If the vote layer is RRN, the critical transitions always appear, belonging to the same universality classes, no matter whether the feedback and diffusion in the noise layer exist or not.
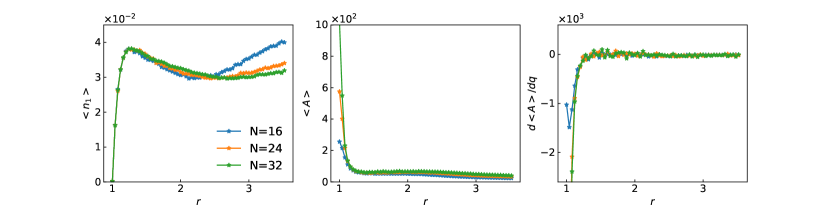
III.2 The signal of third-order transitions
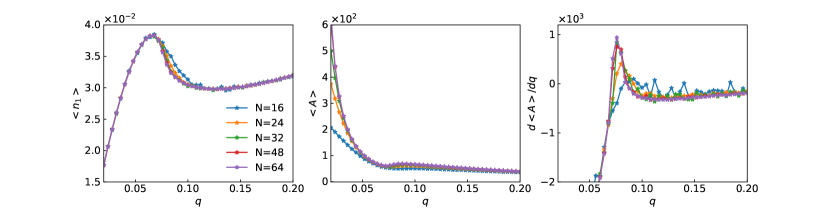
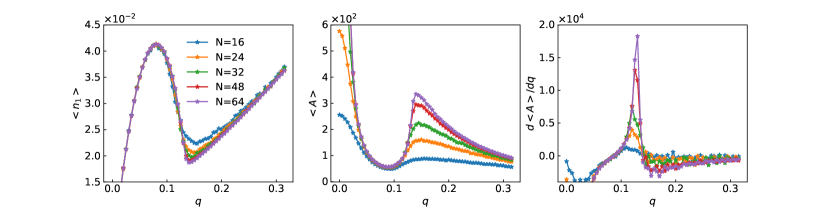
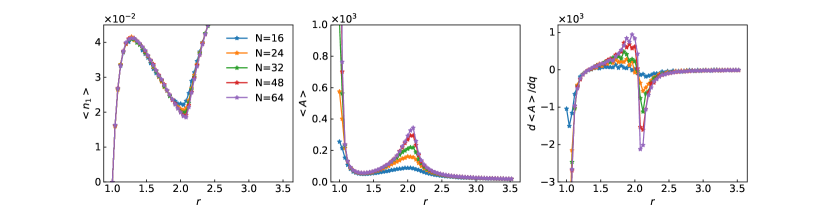
The new order parameter , and the derivations of are drawn in the figures 5 to 10 in different coupling networks. The curves of have local maximums which imply the independent third-order transitions. As or increases, some systems show critical phenomena. We can observe the region where rapidly decreases and rapidly increases in the curves of the figures 5 to 7. However, if the critical transitions do not occur in some systems, the decrease of the curves can be observed but they are not sharp, and the increases of cannot be observed in Fig. 9 and 10. While independent third-order transitions can be observed, even the systems do not show the critical transitions in Fig. 9 and Fig. 10. We can see from the pictures that the positions of the 3-order transitions do not depend on the size of the systems. Noise or the coupling is the decisive factor. Above the positions, the disorder of the systems emerges (but the systems do not get into the disorder phase through critical phase transitions).
The curves of the derivations of can give signals of the dependent 3-order transition which can only exist if the first- or second-order phase transition exists[4, 9]. The local minimums are observed in Fig. 5 to 8. This phenomenon is not obvious in the single-layer square lattice. The reason for this is the local interaction leads to the slow formations of the clusters, and the noise of the simulation has the evident impact on the statistics of the size of the cluster if the system size is small. The curves of when and in Fig. 5 and 6 show the distinct minimums. This behavior is observed in Ising model in square lattices as well. For the coupled RRNs for both layers and the coupled RRN for the vote layer and the square lattice for the noise layer, the minimums of the are distinct. And the positions locate near and above the critical transition points.
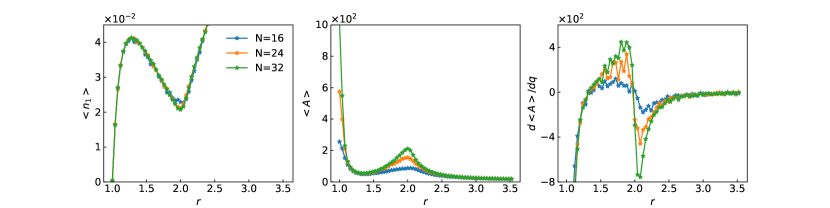

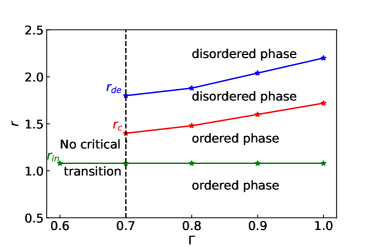
We then calculate the paratemetes , and on the localized RRN vote layers at . For the structure of the noise layer not to affect the critical behaviors of the model, we use the standard RRN to accelerate the simulations. The results are presented in Fig. 11. With the decrease of , the networks become more localized, and the transition points become lower. Especially, when , the signal of the dependent third-order transitions vanishes. Under such circumstances, the critical transition remains unobservable through conventional finite-size analysis.
The independent and dependent 3-order transition locate on both sides of the critical points, respectively. They provide us a way to formulate strategies to predict the near-critical area. If has the local minimum, the first- or second-order phase transitions will occur at . Meanwhile, the positions of the local maximums of determine the other boundary of the near-critical area. However, if does not have the local minimum, the system does not show a first- or second-order transition. only provides the information of the emerging disorder.
IV Summary
We have studied the transitional behaviors of the Majority-Vote models, beginning with an exploration of single-layer models involving external noise and noise feedback stemming from the voting clusters. We observe the critical behaviors and locate the critical points for cases involving homogeneous external noise. Upon considering the feedback mechanism, the identification of a critical transition becomes elusive within the framework of a square lattice. Furthermore, we delve into the analysis of distinct noise layer structures and the propagation of noise. Notably, when a regular square lattice or a localized RRN with is adopted for the voting layer, critical transitions do not occur. This observation suggests that feedback instigates the absence of behavior for systems characterized by local interactions.
However, amidst these dynamics, a consistent pattern emerges: the presence of independent 3-order phase transitions, emblematic of the emergence of disorder (below the critical point), persists across all scenarios that we investigated. In networks capable of supporting critical transitions, we identify dependent 3-order phase transitions. Worth noting is the parallel behavior between non-equilibrium models and their equilibrium counterparts. We can interpret these dependent transitions as precursors of critical transitions for discrete variable models, at the very least. By tracking changes in the sizes of consensus clusters, it becomes feasible to offer early warnings before critical phase transitions occur, facilitating timely intervention before catastrophic collective events unfold, all anchored in reliable empirical evidence.
This approach holds promise not only for anticipating critical phase transitions in discrete variable models but also for extending its potential to early warnings of critical states in other complex systems.
Acknowledgements.
We acknowledge the support of NSFC (NO. 71731002 and NO. 12304257) and the Natural Science Basic Research Program of Shaanxi (Program No. 2022JM-039)References
- Pathria and Beale [2011] R. Pathria and P. Beale, Statistical Mechanics 3rd edn (New York: Academic) (Elsevier, 2011).
- Vicsek and Zafeiris [2012] T. Vicsek and A. Zafeiris, Collective motion, Physics reports 517, 71 (2012).
- Castellano et al. [2009] C. Castellano, S. Fortunato, and V. Loreto, Statistical physics of social dynamics, Reviews of modern physics 81, 591 (2009).
- Qi and Bachmann [2018] K. Qi and M. Bachmann, Classification of phase transitions by microcanonical inflection-point analysis, Phys. Rev. Lett. 120, 180601 (2018).
- Qi et al. [2019] K. Qi, B. Liewehr, T. Koci, B. Pattanasiri, M. J. Williams, and M. Bachmann, Influence of bonded interactions on structural phases of flexible polymers, J. Chem. Phys. 150, 054904 (2019).
- Liu et al. [2022] W. Liu, F. Wang, P. Sun, and J. Wang, Pseudo-phase transitions of ising and baxter–wu models in two-dimensional finite-size lattices, Journal of Statistical Mechanics: Theory and Experiment 2022, 093206 (2022).
- Pettini et al. [2019] G. Pettini, M. Gori, R. Franzosi, C. Clementi, and M. Pettini, On the origin of phase transitions in the absence of symmetry-breaking, Physica A: Statistical Mechanics and its Applications 516, 376 (2019).
- Bel-Hadj-Aissa et al. [2020] G. Bel-Hadj-Aissa, M. Gori, V. Penna, G. Pettini, and R. Franzosi, Geometrical aspects in the analysis of microcanonical phase-transitions, Entropy 22, 380 (2020).
- Sitarachu and Bachmann [2022] K. Sitarachu and M. Bachmann, Evidence for additional third-order transitions in the two-dimensional ising model, Physical Review E 106, 014134 (2022).
- Galam [1986] S. Galam, Majority rule, hierarchical structures, and democratic totalitarianism: A statistical approach, Journal of Mathematical Psychology 30, 426 (1986).
- Galam and Moscovici [1991] S. Galam and S. Moscovici, Towards a theory of collective phenomena: Consensus and attitude changes in groups, European Journal of Social Psychology 21, 49 (1991).
- Galam [1997] S. Galam, Rational group decision making: A random field ising model at t= 0, Physica A: Statistical Mechanics and its Applications 238, 66 (1997).
- de Oliveira [1992] M. J. de Oliveira, Isotropic majority-vote model on a square lattice, Journal of Statistical Physics 66, 273 (1992).
- Lima et al. [2012] F. W. S. Lima, A. A. Moreira, and A. D. Araújo, Nonequilibrium model on apollonian networks, Physical Review E 86, 056109 (2012).
- Alves et al. [2021] G. Alves, T. Alves, F. Lima, and A. Macedo-Filho, Consensus formation on apollonian networks, Physica A: Statistical Mechanics and its Applications 561, 125267 (2021).
- Stone and McKay [2015] T. E. Stone and S. R. McKay, Majority-vote model on a dynamic small-world network, Physica A: Statistical Mechanics and its Applications 419, 437 (2015).
- Chen et al. [2015] H. Chen, C. Shen, G. He, H. Zhang, and Z. Hou, Critical noise of majority-vote model on complex networks, Physical Review E 91, 022816 (2015).
- Krawiecki [2018] A. Krawiecki, Spin-glass-like transition in the majority-vote model with anticonformists, The European Physical Journal B 91, 1 (2018).
- Choi and Goh [2019] J. Choi and K.-I. Goh, Majority-vote dynamics on multiplex networks with two layers, New Journal of Physics 21, 035005 (2019).
- Pereira and Moreira [2005] L. F. C. Pereira and F. G. B. Moreira, Majority-vote model on random graphs, Physical Review E 71, 016123 (2005).
- Lima et al. [2008] F. W. Lima, A. O. Sousa, and M. Sumuor, Majority-vote on directed erdős–rényi random graphs, Physica A: Statistical Mechanics and its Applications 387, 3503 (2008).
- Lima [2006] F. W. Lima, Majority-vote on directed barabasi–albert networks, International Journal of Modern Physics C 17, 1257 (2006).
- Campos et al. [2003] P. R. A. Campos, V. M. de Oliveira, and F. G. B. Moreira, Small-world effects in the majority-vote model, Physical Review E 67, 026104 (2003).
- Luz and Lima [2007] E. M. Luz and F. W. Lima, Majority-vote on directed small-world networks, International Journal of Modern Physics C 18, 1251 (2007).
- Santos et al. [2011] J. C. Santos, F. W. Lima, and K. Malarz, Majority-vote model on triangular, honeycomb and kagomé lattices, Physica A: Statistical Mechanics and its Applications 390, 359 (2011).
- Fronczak and Fronczak [2017] A. Fronczak and P. Fronczak, Exact solution of the isotropic majority-vote model on complete graphs, Physical Review E 96, 012304 (2017).
- Wu et al. [2010] Z.-X. Wu, P. Holme, et al., Majority-vote model on hyperbolic lattices, Physical Review E 81, 011133 (2010).
- Lima [2013] F. Lima, Majority-vote model on opinion-dependent network, International Journal of Modern Physics C 24, 1350066 (2013).
- Liu et al. [2019] J. Liu, Y. Fan, J. Zhang, and Z. Di, Coevolution of agent’s behavior and noise parameters in majority vote game on multilayer networks, New Journal of Physics 21, 015007 (2019).
- Schrauth et al. [2018] M. Schrauth, J. A. J. Richter, and J. S. E. Portela, Two-dimensional ising model on random lattices with constant coordination number, Physical Review E 97, 022144 (2018).
- Landau and Binder [2021] D. Landau and K. Binder, A guide to Monte Carlo simulations in statistical physics (Cambridge university press, 2021).
- Gross [2001] D. H. Gross, Microcanonical thermodynamics: phase transitions in” small” systems (World Scientific, 2001).
- Beale [1996] P. D. Beale, Exact distribution of energies in the two-dimensional ising model, Phys. Rev. Lett. 76, 78 (1996).
- Sitarachu et al. [2020] K. Sitarachu, R. Zia, and M. Bachmann, Exact microcanonical statistical analysis of transition behavior in ising chains and strips, J. Stat. Mech. 2020, 073204 (2020).
- Liggett et al. [1999] T. M. Liggett et al., Stochastic interacting systems: contact, voter and exclusion processes, Vol. 324 (springer science & Business Media, 1999).
- Krapivsky and Redner [2003] P. L. Krapivsky and S. Redner, Dynamics of majority rule in two-state interacting spin systems, Physical Review Letters 90, 238701 (2003).
- Sznajd-Weron [2005] K. Sznajd-Weron, Sznajd model and its applications, arXiv preprint physics/0503239 (2005).
- Sznajd-Weron [2002] K. Sznajd-Weron, Controlling simple dynamics by a disagreement function, Physical Review E 66, 046131 (2002).
- Sznajd-Weron [2004] K. Sznajd-Weron, Dynamical model of ising spins, Physical Review E 70, 037104 (2004).
- Sastre and Henkel [2016] F. Sastre and M. Henkel, Antiferromagnetic majority voter model on square and honeycomb lattices, Physica A: Statistical Mechanics and its Applications 444, 897 (2016).
- Calvelli et al. [2019] M. Calvelli, N. Crokidakis, and T. J. Penna, Phase transitions and universality in the sznajd model with anticonformity, Physica A: Statistical Mechanics and its Applications 513, 518 (2019).
- Muslim et al. [2020] R. Muslim, R. Anugraha, S. Sholihun, and M. F. Rosyid, Phase transition of the sznajd model with anticonformity for two different agent configurations, International Journal of Modern Physics C 31, 2050052 (2020).
- Dorogovtsev et al. [2008] S. N. Dorogovtsev, A. V. Goltsev, and J. F. F. Mendes, Critical phenomena in complex networks, Reviews of Modern Physics 80, 1275 (2008).
- de Araújo et al. [2018] J. M. de Araújo, C. I. Sampaio Filho, and F. G. Moreira, Noise induced phase transition in the s-state block voter model, Physica A: Statistical Mechanics and its Applications 508, 642 (2018).