Adaptive hypergraphs and the characteristic scale of higher-order contagions using generalized approximate master equations
Abstract
People organize in groups and contagions spread across them. A simple process, but complex to model due to dynamical correlations within groups and between groups. Groups can also change as agents join and leave them to avoid infection. To study the characteristic levels of group activity required to best model dynamics and for agents to adapt, we develop master equations for adaptive hypergraphs, finding bistability and regimes of detrimental, beneficial, and optimal rewiring, at odds with adaptation on networks. Our study paves the way for higher-order adaptation and self-organized hypergraphs.
Due to network effects, network neighbors are very different from random members of a population and often from each other. Any variance in heterogeneity implies that sampling a random connection is different from sampling a random node, which is the statistical bias behind the friendship paradox where “your friends have more friends than you do.” Accurate descriptions of dynamics on networks therefore relies on capturing important heterogeneities in how dynamical processes see a networked population. Because of their connectivity or degree, not all nodes in the network follow the same dynamics, and neither do all nodes of the same degree because of their different neighborhoods. The same is true in networks with groups. “Your friends are parts of more groups than you are,” but the state of group neighbors are also more correlated than expected at random. Ignoring these effects can lead to erroneous conclusions about how networks support dynamics, since degree heterogeneity [1] and dynamical correlations [2, 3] both shape critical behaviors.
To capture these effects, mathematical models often rely on approximate master equations (AME) meant to capture local correlations and the local state of the dynamics [4, 5, 6, 7, 8, 9, 10, 11, 12]. One can describe contagion dynamics on networks with communities or higher-order structures, captured by distinguishing nodes by their state (infectious or susceptible) and membership (how many groups they belong to) as well as groups by their size (how many nodes they contain) and composition (how many infectious nodes they contain) [5]. Or, one can describe contagion dynamics on random networks by distinguishing nodes by their number of neighbors and infectious neighbors [6]. These are sometimes called group and node-based AMEs respectively. The former captures the effects of groups on contagion dynamics but falls back on heterogeneous pairwise approximation [13] when describing random networks. The latter captures dynamical correlations with high accuracy on random networks, but cannot account for group structure.
Compared to standard heterogeneous mean-field models [14, 15], the AME frameworks stand out by tracking the full distribution of potential dynamical states within network motifs—i.e., the number of infectious nodes either within the neighborhood of a node or within a group—not just average states. Recent results have shown that these state distributions can be very heterogeneous and even bimodal, explaining blind spots of mean-field approaches that fail to capture important dynamical regimes [16, 17]. Capturing these correlations is critical to describe the dynamics accurately, especially if adaptive behaviors are allowed to change the network structure in response to the composition of groups and neighborhoods.
In this paper, we combine node and group-based master equation frameworks to accurately tackle adaptive hypergraphs, where an agent can adapt its membership to groups based on their configuration. This leads us to a series of theoretical questions: When should a group be considered active? Is the definition of an active group the same for modelers trying to describe the dynamics and for agents hoping to avoid it? Under which condition does local adaptive behavior act as a global control against contagions on hypergraphs?
Generalized approximate master equations.
Let us consider a general binary-state dynamics on infinite-size random networks with groups. Nodes can either be susceptible () or infected () and have a membership drawn from . Groups are of various size drawn from . We partition the groups and the nodes according to their local properties. Specifically, we track , the fraction of groups of size with infected nodes at time . We also track and , the fraction of susceptible and infected nodes with membership and incident active groups. For a given node, a group to which it belongs is active when it contains at least infected nodes other than itself. Accordingly, we call the active membership of a node. These three types of compartments are also to be interpreted as joint probabilities, i.e. , , and , with normalization and . Unless specified, sums run over all possible values.
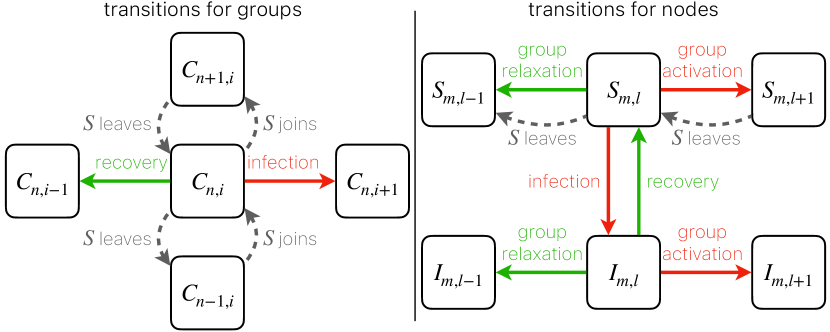
We introduce the effective infection (recovery) rate () for a node within a group of size with infected members and the effective infection (recovery) rate () for a node of membership , of which are active. From these definitions, we introduce the following set of generalized approximate master equations (GAME), schematized in Fig. 1,
| (1a) | ||||
| (1b) | ||||
| (1c) | ||||
The four mean fields are calculated as
| (2a) | ||||
| (2b) | ||||
| (2c) | ||||
| (2d) | ||||
These quantities are the average rates at which inactive groups become active () or vice versa () given that we know the state of one of their members (subscript). We therefore sum over all groups eligible for the transition (e.g. with one too few or too many infectious nodes) and count the number of nodes therein whose state matches that of the node of interest. This gives us a biased distribution over states, renormalized with the sum in the denominator, and over which we average the local rate of transition (every factor in the numerator not in the denominator).
To close the GAME, we need to estimate the previously introduced effective transition rates, , , and . We can calculate these rates with mean-field arguments, but the form of this calculation depends on the nature of the dynamics. Specifically, we use two different approaches based on whether the dynamics operate at the node level (i.e., a node gets infected based on its total number of infectious neighbors) or at the group level (i.e., a node gets infected through each group based on the number of infectious members therein). We show the simplest version here and derive the other in the Supplemental Material.
Group-based dynamics.
We consider general continuous-time Markov processes where groups are the main actors responsible for infections. Specifically, a susceptible node in a group of size with infectious receives an infection rate of from this group. The effective rate thus becomes , where is the infection rate from all the external groups, reading
| (3) |
Where and are the mean infection rates of a random external inactive or active group respectively—they do not depend on . They read as:
| (4) | ||||
| (5) |
Similarly, the effective rate simply reads
| (6) |
Finally, the rates and can be computed analogously (see Supplemental Material). For the contagion dynamics we analyze in the following, recovery is a spontaneous node transition, for which we use a simple constant rate .
Results on static networks.
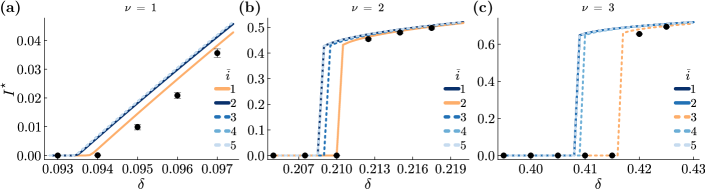
We illustrate the high accuracy of the GAME against simulations on static hypergraphs in Fig. 2. More importantly, this allows us to show which characteristic activity level best captures the dynamics. We test diverse contagions functions, using when and 0 otherwise. This transmission function produces classic simple contagion when and so-called threshold or complex contagion [18, 19, 20] where a minimum number of infectious neighbors is required for transmission when .
We find that against both simple and complex contagions, the optimal description is the one whose characteristic activity level matches the minimum number of infectious neighbors required for transmission, . One could expect that a higher might be useful to distinguish large groups that are actively transmitting from small groups where nodes were infected through some other groups. Yet, the most straightforward answer is the best: The optimal model is the one that tags as active only the groups that can transmit.
The A-GAME: Adaptive hypergraphs.
We now consider the case where susceptible nodes can rewire away from active groups. This higher-order adaptation mechanism is a hypergraph generalization of the adaptive network model by Gross et al. [21]. To quantify the information nodes have about groups before joining them, we define the probability that rewiring is targeted towards inactive groups, as opposed to random groups in any state (notice that the model in Gross et al. [21] only describes the case ). With group rewiring, the average group size and average group membership are conserved, but the active membership of nodes and the size distribution of groups (and consequently the degree distribution of the projected network) are allowed to change as an adaptive response to the contagion. In theory, this model can interpolate between a complete network with a giant infinite group and a sparse regular network.
Rewiring adds the following transitions to our system,
| (7a) | ||||
| (7b) | ||||
These transitions are tagged with ‘a’ for adaptive and added to Eqs. (1a)-(1b). The terms in Eq. (7a) accounts for susceptible nodes leaving and joining groups, respectively, while Eq. (7b) only needs to account for susceptible nodes rewiring away from their active groups. To calculate these rates, we define , which equals if proposition p is true and otherwise, to tag active groups whose members might escape and inactive groups which might be targeted; and also and . Note that we formulate a more general adaptive hypergraph, where both susceptible and infectious agents can rewire [22], in our Supplemental Material.
Results on adaptive networks.
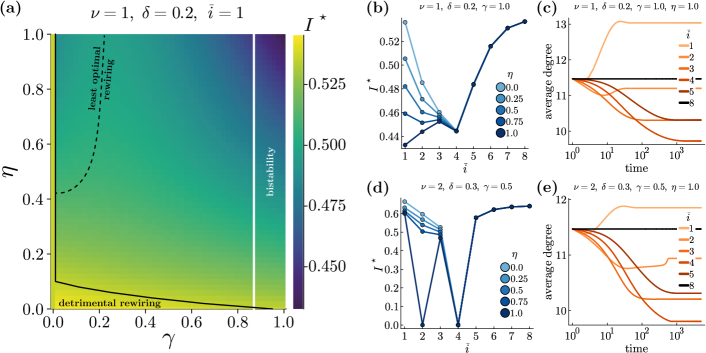
We experiment with adaptive hypergraphs on both simple () and complex contagions () in Fig. 3. The phase diagram of the dynamics highlights a few important results. There exists a bistable region for any accuracy when rewiring is fast enough, generalizing the results from Gross et al. [21]. But more importantly, the higher-order organization leads to two previously unseen phenomena. First, a low-accuracy region of detrimental rewiring, where prevalence is higher than with no rewiring. Second, a slow-rewiring region where, for high enough accuracy, prevalence is lower than with no rewiring, but increases with before eventually decreasing, defining a value of least optimal rewiring rate for each .
To better understand the rich phenomenology of higher-order adaptation, we identify two strategies for agents in the network to control the dynamics:
-
1.
Nodes can avoid the contagion. This is optimal when targeting is both fast (high ) and accurate (high ). To do so, nodes have to mimic modelers and set . Being enough reactive and precise, they can manage to escape infection without necessarily lower the connectivity of the structure;
-
2.
Nodes can avoid large groups. This is optimal when rewiring is slow (low ) or targeting is poor (low ). By setting , the average group size, nodes rewire away from groups that are larger than average, thereby minimizing their average degree and the probability of getting infected.
Importantly, to say whether the rewiring is ‘fast’ or ‘slow’ and ‘accurate’ or ‘poor’, we have to compare the system with the state of its static counterpart. There is therefore no clear boundary defining which strategy is optimal. In fact, in intermediate regimes, both strategies can work just as well but an intermediary strategy () may not, see Fig. 3(d). We hypothesize that this is because the mechanisms underlying these strategies are actually in opposition.
In Fig. 3(c & e), we show the average degree of the adaptive hypergraphs under different rewiring strategies. We see that the strategy works despite slightly decreasing () or even increasing () the connectivity of the system. As expected, the strategy works by having susceptible agents avoid groups larger than average and therefore create a more uniform sparse network, actually minimizing the average degree. In accordance to our hypothesis, the two adaptive strategies work in different ways, targeting either dynamics or structure.
A similar logic explains the observed region of least-optimal rewiring rates. Larger groups reach faster on average and slow rewiring allows to significantly correlate with group size before the typical rewiring time (). For high enough accuracy, susceptible agents then preferentially migrate to smaller groups, decreasing the average degree (see Supplemental Material). Conversely, fast rewiring makes targeting the dynamics the optimal strategy. In between, we find a least optimal rewiring rate that is too slow to avoid the dynamics but too fast to minimize the degree.
Discussion.
We studied contagions on static and adaptive hypergraphs by developing a very general model to capture dynamical correlations both within groups and across groups. To do so, we introduced the notion of characteristic scale of a contagion to tag groups as active () or inactive () based on the number of infectious nodes they contain. Our GAME thus generalizes both node-based and group-based AME frameworks, which are respectively recovered when one collapses groups to pairwise edges or considers all groups as equivalently active. Hence, whether the aim is to describe binary-state dynamics on networks or hypergraphs, on static or adaptive structures, it’s in the GAME.
We then asked three questions. What is the characteristic scale such that our mathematics best fit simulations on static hypergraphs? What is the characteristic scale such that agents can best avoid the contagion? And how similar are those two answers?
We found that modelers should always use a characteristic scale set by the number of infectious neighbor necessary for infection. However, agents have more options if they want to avoid the contagion. When rewiring is fast and accurate, agents can act as modelers and set to minimize the contagion events without minimizing their connectivity. When rewiring is slow or inaccurate, agents should instead aim to minimize their degree by rewiring away from large groups based on , the average group size.
Altogether, this work introduced adaptive hypergraphs, which are not as constrained as most adaptive network models for their density or average degree is not fixed over time, which enables them to organize in diverse ways. Yet, the conserved quantities of average hyperdegree and hyperedge size allowed us to formulate a very accurate and general model based on approximate master equations. We hope that our contributions will inspire future work on self-organized hypergraph and group structures.
Acknowledgements.
The authors thank Antoine Allard and Alex Arenas for discussions and feedback. G.B. acknowledges financial support from the European Union’s Horizon 2020 research and innovation program under the Marie Skłodowska-Curie Grant Agreement No. 945413 and from the Universitat Rovira i Virgili (URV), G.S. from the Fonds de recherche du Québec – Nature et technologies (project 313475), and L.H.-D. from the National Institutes of Health 1P20 GM125498-01 Centers of Biomedical Research Excellence Award.
References
- St-Onge et al. [2022] G. St-Onge, I. Iacopini, V. Latora, A. Barrat, G. Petri, A. Allard, and L. Hébert-Dufresne, Influential groups for seeding and sustaining nonlinear contagion in heterogeneous hypergraphs, Communications Physics 5, 1 (2022).
- Burgio et al. [2021] G. Burgio, A. Arenas, S. Gómez, and J. T. Matamalas, Network clique cover approximation to analyze complex contagions through group interactions, Communications Physics 4, 111 (2021).
- Burgio et al. [2023] G. Burgio, S. Gómez, and A. Arenas, Triadic approximation for contagions on higher-order networks, arXiv preprint arXiv:2306.11441 (2023).
- House and Keeling [2008] T. House and M. J. Keeling, Deterministic epidemic models with explicit household structure, Mathematical Biosciences 213, 29 (2008).
- Hébert-Dufresne et al. [2010] L. Hébert-Dufresne, P.-A. Noël, V. Marceau, A. Allard, and L. J. Dubé, Physical Review E 82, 036115 (2010).
- Marceau et al. [2010] V. Marceau, P.-A. Noël, L. Hébert-Dufresne, A. Allard, and L. J. Dubé, Adaptive networks: Coevolution of disease and topology, Physical Review E 82, 036116 (2010).
- Lindquist et al. [2011] J. Lindquist, J. Ma, P. van den Driessche, and F. H. Willeboordse, Effective degree network disease models, J. Math. Biol. 62, 143 (2011).
- Gleeson [2013] J. P. Gleeson, Binary-state dynamics on complex networks: Pair approximation and beyond, Physical Review X 3, 021004 (2013).
- O’Sullivan et al. [2015] D. J. O’Sullivan, G. J. O’Keeffe, P. G. Fennell, and J. P. Gleeson, Mathematical modeling of complex contagion on clustered networks, Frontiers in Physics 3, 71 (2015).
- Unicomb et al. [2019] S. Unicomb, G. Iñiguez, J. Kertész, and M. Karsai, Reentrant phase transitions in threshold driven contagion on multiplex networks, Phys. Rev. E 100, 040301 (2019).
- Unicomb et al. [2021] S. Unicomb, G. Iñiguez, J. P. Gleeson, and M. Karsai, Dynamics of cascades on burstiness-controlled temporal networks, Nat. Commun. 12, 133 (2021).
- Kim et al. [2023] J. Kim, D.-S. Lee, and K.-I. Goh, Contagion dynamics on hypergraphs with nested hyperedges (2023), arXiv:2303.00224 .
- Eames and Keeling [2002] K. T. D. Eames and M. J. Keeling, Modeling dynamic and network heterogeneities in the spread of sexually transmitted diseases, Proc. Natl. Acad. Sci. U.S.A. 99, 13330 (2002).
- Pastor-Satorras et al. [2015] R. Pastor-Satorras, C. Castellano, P. Van Mieghem, and A. Vespignani, Epidemic processes in complex networks, Rev. Mod. Phys. 87, 925 (2015).
- Landry and Restrepo [2020] N. W. Landry and J. G. Restrepo, The effect of heterogeneity on hypergraph contagion models, Chaos: An Interdisciplinary Journal of Nonlinear Science 30 (2020).
- St-Onge et al. [2021a] G. St-Onge, V. Thibeault, A. Allard, L. J. Dubé, and L. Hébert-Dufresne, Social confinement and mesoscopic localization of epidemics on networks, Physical Review Letters 126, 098301 (2021a).
- St-Onge et al. [2021b] G. St-Onge, V. Thibeault, A. Allard, L. J. Dubé, and L. Hébert-Dufresne, Master equation analysis of mesoscopic localization in contagion dynamics on higher-order networks, Phys. Rev. E 103, 032301 (2021b).
- Dodds and Watts [2004] P. S. Dodds and D. J. Watts, Universal behavior in a generalized model of contagion, Phys. Rev. Lett. 92, 218701 (2004).
- Lehmann and Ahn [2018] S. Lehmann and Y.-Y. Ahn, Complex spreading phenomena in social systems, Computational Social Sciences 10, 978 (2018).
- Guilbeault et al. [2018] D. Guilbeault, J. Becker, and D. Centola, Complex contagions: A decade in review, Complex spreading phenomena in social systems , 3 (2018).
- Gross et al. [2006] T. Gross, C. J. D. D’Lima, and B. Blasius, Epidemic dynamics on an adaptive network, Physical Review Letters 96, 208701 (2006).
- Scarpino et al. [2016] S. V. Scarpino, A. Allard, and L. Hébert-Dufresne, The effect of a prudent adaptive behaviour on disease transmission, Nature Physics 12, 1042 (2016).