Exploring the impact of high-precision top-quark pair production data on the structure of the proton at the LHC
Abstract
The impact of recent LHC top-quark pair production single differential cross section measurements at 13 TeV collision energy on the structure of the proton is explored. In particular, the impact of these high-precision data on the gluon and other parton distribution functions (PDFs) of the proton at intermediate and large partonic momentum fraction is analyzed. This study extends the CT18 global analysis framework to include these new data. The interplay between top-quark pair and inclusive jet production as well as other processes at the LHC, is studied. In addition, a study of the impact of scale choice on the theory description of the new 13 TeV measurements is performed.
I Introduction
The physics of the top quark, discovered by the D and CDF collaborations at the Tevatron proton-antiproton collider [1, 2] in 1995, is central to a large number of precision programs for theory and experiments at the Large Hadron Collider (LHC) and its future upgrades.
In proton-proton collisions at the LHC, properties of the top quark are being thoroughly investigated as they are critical to many endeavors in high-energy physics, e.g., test the QCD theory and structure of the proton with unprecedented accuracy, unravel details of the electroweak (EW) sector of the Standard Model (SM) at high energies, and search for new physics interactions.
The mass of the top quark ( GeV from direct measurements [3]) is very close to that of the recently discovered [4, 5] Higgs boson ( GeV) and quantum corrections to these masses are deeply related to one another. In particular, the mass of the top quark is an important ingredient in the determination of absolute stability conditions for the EW vacuum as top-quark mass radiative corrections drive the couplings of the Higgs boson [6, 7, 8, 9, 10, 11, 12]. In addition, the top quark provides us with unique opportunities to search for signatures of new physics interactions at the TeV scale and beyond (see for instance refs. [13, 14] and referenced therein).
The top quark mainly decays into a real boson and a quark before hadronization occurs. Therefore, precision measurements of top-quark pair production cross sections allow us to set stringent tests on perturbative QCD and to explore the structure of the proton with higher precision. In fact, more than 90% of the production rate is due to the gluon-gluon fusion channel at the LHC with of center-of-mass collision energy. This makes top-quark pair production a unique probe of proton’s parton content, especially the gluon, at intermediate and large partonic momentum fraction , which motivates this work.
The ATLAS and CMS collaborations performed high-precision measurements of both total inclusive and differential top-quark pair production cross section at , [15, 16, 17, 18, 19, 20] and 13 TeV [21, 22, 23, 24, 25, 26] of center-of-mass collision energy, at parton and particle level, in different channels (e.g., dilepton, semi-leptonic, all-hadronic, and lepton+jets) at different integrated luminosity (IL).
The higher precision LHC data samples obtained at 13 TeV are at the core of this analysis which aims at studying their impact on parton distribution functions (PDFs) of the proton in global QCD analyses using the CTEQ framework. High-precision theoretical calculations to predict top-quark pair production cross sections for a variety of kinematic distributions obtained with different bin resolutions are therefore crucial for this task.
Progress in theoretical calculations for cross sections. Radiative corrections to heavy-quark production at the next-to-leading order (NLO) in QCD are known since a long time [27, 28, 29, 30, 31, 32], and NLO calculations for total and differential cross sections have been implemented in various parton-level Monte Carlo computer programs, e.g., MCFM [33], MC@NLO [34], POWHEG [35], MadGraph/MadEvent [36, 37].
The progress made in the past two decades on both the theoretical and computational sides by many groups has been remarkable (see for instance refs. [38, 39, 40, 41, 42, 43, 44, 45, 46, 47, 48] and references therein). The fixed-order calculation for production at next-to-next-to-leading order (NNLO) at in QCD [49, 50, 51, 52, 53, 54] has been accomplished based on the STRIPPER subtraction [55, 56, 57] method. An independent calculation for the inclusive and differential production cross section has recently been accomplished based on the -subtraction [58, 59, 60] method and has been incorporated in the publicly available computer program MATRIX [61]. The inclusion of top-quark decay effects has recently been studied in refs. [62, 63].
The impact of logarithmic enhancements in threshold resummation on the cross section has also been extensively studied in the past decades, and relevant work can be found in refs. [64, 65, 66, 67, 68, 69, 70, 71, 72] and in refs. [73, 74, 75, 76, 77, 78, 79, 80, 81], while soft collinear effective field theory (SCET) [82, 83, 84, 85] has been used in refs. [86, 87, 88, 89, 90, 91, 92, 93, 94].
The impact of electroweak (EW) corrections on production from both the weak and QED sectors has been studied in refs. [95, 96, 97, 98, 99, 100, 101, 102, 103, 104, 105, 106, 107, 108, 109, 110, 111, 112, 113].
Transverse momentum resummation for top-quark pair production has also been studied and recently documented in refs. [114, 115, 116, 117, 118, 119], while higher-order QCD corrections have been combined with Parton Shower (PS) simulations in [120, 121], based on the general computer framework described in refs. [122, 123, 124].
Top-quark pair production in global PDF analyses. Top-quark pair production cross section measurements at the LHC and Tevatron are now a staple part of the data set baseline in modern global analyses at NNLO and beyond in QCD to determine proton PDFs. Examples of these analyses are ABMP [125], CT18 [126], MSHT20 [127, 128], and NNPDF [129, 130]. In particular, measurements of differential cross sections at the ATLAS and CMS experiments have been included in the most recent analyses [126, 127, 129, 130] at NNLO where, together with inclusive jet production measurements, they play an important role in constraining the gluon PDF in the intermediate to large- region as they complement each other. Though the and inclusive high- jet productions largely overlap in the plane, their matrix elements and phase-space suppression are different so that their constraints on the gluon are placed at different values of . However, the presence of tensions between experiments which can potentially result in different pulls on the gluon at intermediate/large , and the strong correlation between the top-quark mass , the strong coupling and the gluon itself, make PDFs extraction particularly challenging [125, 131, 132].
Another complication arises from the amount of information on the statistical and systematical uncertainties published by the experimental collaborations. These uncertainties can be expressed in terms of either the covariance matrix or nuisance parameter representation and conversion from covariance matrix to nuisance parameters is not unique. Complete information on the statistical, uncorrelated and correlated systematic uncertainties (and their sources) is critical to maximize constraints from the data in PDF determinations.
A large number of studies appeard in the literature that have used total and differential cross section measurements at the LHC to constrain the gluon and other PDFs. Recent and less recent analyses can be found in refs. [133, 134, 135, 136, 137, 138, 131, 139, 132].
Main goals of this analysis. In this work, we shall study the impact of particular selections of 13 TeV single differential distributions at ATLAS (in the all-hadronic and lepton+jets channels) [21, 22] and CMS (in the dilepton and lepton+jets channels) [24, 26], on NNLO PDFs obtained by using the same framework (i.e., strategy, and tolerance criteria definitions for the uncertainties) adopted in the CT18 analysis [126]. In particular, PDFs are extracted by using optimal combinations of absolute differential cross sections measurements with different IL added on top of the CT18 baseline. The impact on the global fit from individual and combined kinematic distributions is analyzed by selecting different renormalization and factorization scale choices in the theory predictions. EW corrections are also considered, however their impact is found to be negligible.
In addition, we analyze the impact of 13 TeV double differential distributions at ATLAS and CMS using the ePump (error PDF Updating Method Package) framework [140, 141]. In Sec. II.5 we discuss the observed impact from double differential distributions on PDFs, and find that this is comparable to that from single differential ones. However, the treatment and interpretation of correlated systematic uncertainties in the analysis with double differential distributions is more challenging and complicates the data vs theory description. This work mainly concerns with the study of the impact of 13 TeV single differential distributions on PDFs extracted in CTEQ global QCD analyses. A thorough and more extensive investigation of double differential distributions in PDF determinations will be presented in the future, in a separate work. A previous study investigating double differential cross sections at the LHC at 8 TeV and their impact on PDFs with ePump, is discussed in ref. [137].
Single top production. Single (anti)top production cross sections in the - and -channel have also been measured at ATLAS and CMS at 7, 8, and 13 TeV collision energies. The impact of -channel single (anti)top production has been explored in ref. [142] where it is found that an optimal combination of single-top data constrains the light quark and gluon PDFs with a reduction of their relative uncertainty by a fraction of a percent in the region with even more pronounced reduction on the ratio around . Part of these measurements are also included in the NNPDF4.0 global analysis [130]. An investigation of the impact of single top-quark production cross section measurements at the LHC on CTEQ PDFs will also be presented in a separate work.
The single and double differential cross sections of top-quark pair production as well as single (anti)top production cross sections will be ingredients of high importance in the next generation of PDF determinations which are going to use higher IL data.
The rest of this paper is organized as follows: in Sec. II.1 we summarize the findings from recent global QCD analyses using 7 and 8 TeV top-quark pair production measurements, while in Sec. II.2 we describe the LHC measurements from ATLAS and CMS at 13 TeV considered in this study. In Sec. II.3, we describe the theoretical framework where details of the calculations such as NNLO QCD corrections, EW corrections, and scale dependence are discussed. In Sec. II.4, we discuss the impact on PDFs from the bin-by-bin statistical correlations in the ATLAS 13 TeV lepton + jets channel measurements, while in Sec. II.5 we discuss single vs double distributions at the LHC. In Sec. III, we describe the impact on PDFs from individual 13 TeV data sets considered in separate fits, and in Sec. IV we present the main results of this analysis obtained from two optimal combinations of 13 TeV measurements. We will conclude in Sec. V, while the details of theoretical calculations are presented in App. A, and the treatment of the correlated systematics are summarized in App. B.
II Top-quark pair production at the LHC run I, and II
We start with a brief overview of top-quark pair production measurements in recent global QCD analyses of PDFs which include LHC 7 and 8 TeV data from ATLAS and CMS, and summarize their findings. These measurements with respective analyses are also reported in Tab. 1. Next, we discuss the LHC 13 TeV data that are at the core of this work and will play an important role in all post-CT18 PDF determinations.
II.1 Top-quark data in the CT18 era
The CT18NNLO analysis [126] includes two ATLAS absolute single-differential cross sections [17] and for the invariant mass with 20.3 fb-1 of IL, and the CMS normalized double-differential cross section [20] , with 19.7 fb-1. The two ATLAS measurements are combined into one single data set which includes the combination of the +jets and +jets channels for the and distributions with statistical correlations. These distributions are chosen according to their best compatibility within the global fit. In fact, the impact from the single-differential and rapidity distributions (absolute or normalized) at ATLAS [17] is also explored and tension is found with some other data sets. For example, the and rapidity distributions show agreement with HERA DIS data, but have opposite trend as compared to the CMS and ATLAS and combined distributions. Their inclusion, either in the single-differential or double-differential form does not reduce PDF errors. The resulting impact on the CT18 PDFs is found to be modest with a preference for a softer gluon at large in the range, and with changes that have no statistically significant amount.
The MSHT20 analysis [127], in addition to the same CMS double-differential distribution considered in the CT18 study, includes ATLAS single-differential cross section measurements for the , and distributions [17] in the lepton+jets channel combined with statistical correlations, ATLAS measurements of distribution [143] in the dilepton channel, as well as the CMS normalized distribution in the lepton+jets channel [144]. In addition, four total cross section measurements from ATLAS [145] and CMS [19, 146, 147] are included. For the ATLAS single-differential measurements in the lepton+jets channel, the correlated systematic parton-shower (PS) error across the four distributions has been decorrelated according to the procedure described in ref. [138]. The impact on the MSHT20 gluon PDF from top-quark pair production data results in a suppressed high- gluon () with a complicated interplay/tension with the - and LHC jet data. PDF uncertainties at large are slightly reduced. Most of the impact is from the ATLAS combination of single differential distributions [17, 143] in the lepton+jets channel, and the treatment of systematic uncertainties plays a significant role in the description of data in terms of .
The NNPDF4.0 analysis [130] includes the ATLAS normalized statistically combined , , , and distributions [17] in the lepton+jets channel, as well as the ATLAS normalized distribution in the dilepton channel [143]. From CMS, it includes the normalized distribution in the lepton+jets channel [144] as well as the normalized distribution in the dilepton channel [20]. Two measurements of total cross section from ATLAS [148] and CMS [149] are also considered. In addition to these measurements at = 8 TeV, the NNPDF4.0 analysis includes two CMS rapidity distributions at = 13 TeV in the lepton+jets [25] and dilepton channel [24], respectively, and other total cross section measurements at different center-of-mass energy: at CMS [150] with = 5.02 TeV, at ATLAS [148] and CMS [149] with = 7 TeV, and at ATLAS [151] and CMS [152] with = 13 TeV. -channel single top total and differential production cross section measurements are also considered in the NNPDF4.0 global fit. The resulting gluon is more suppressed at as compared to CT18 and MSHT20. However, top-quark pair production data have overall a moderate impact on the NNPDF4.0 global fit. In a fit with no top-quark data, the gluon is slightly enhanced at , but well within the NNPDF4.0 uncertainty.
The ABMP16 analysis [125] considers selected measurements of top-quark pair production total cross section only at the LHC and Tevatron with different collision energies: one data point at CMS with [153], six data points at ATLAS [154, 148, 155, 156, 157, 158] and five at CMS [159, 160, 161, 162, 163] at TeV, two data points at ATLAS [148, 145] and four at CMS [146, 147, 159, 160] at TeV, one data point at ATLAS [164], and four at CMS [152, 165, 166, 167] at TeV. The ABMP16 PDF parameters are fitted simultaneously with and . These total cross section measurements lead to an increase in the gluon central value at large in the range, with increase at in both the and calculations, depending on the factorization scale choice. These variations are well within the ABMP PDF uncertainty. However, the impact on the gluon PDF uncertainty is found to be small.
| Data | Lumi [fb-1] | Ref. | CT18 | MSHT20 | ABMP16 | NNPDF4.0 |
| ATLAS 8 TeV lep+jets (norm.) | 20.3 | [17] | – | |||
| ATLAS 8 TeV dilep (norm.) | 20.2 | [143] | – | – | ||
| CMS 8 TeV lep+j and dilep (norm.) | 19.7 | [144] | – | – | ||
| CMS 8 TeV dilep 2D (norm.) | 19.7 | [20] | – | |||
| ATLAS 13 TeV lep+jets | 36 | [21] | This work | – | – | – |
| ATLAS 13 TeV all hadronic | 36.1 | [22] | This work | – | – | – |
| CMS 13 TeV dilep | 35.9 | [24] | This work | – | – | |
| CMS 13 TeV lep+jets | 35.8 | [25] | – | – | – | |
| CMS 13 TeV lep+jets | 137 | [26] | This work | – | – | – |
| Total cross sections | ||||||
| CMS 5.02 TeV lep+jets | 0.0274 | [150] | – | – | – | |
| CMS 5.02 TeV lep+jets | 0.026 | [153] | – | – | – | |
| ATLAS 7 TeV | 4.66/4.6/1.67/4.7 | [154, 155, 156, 157, 158] | – | – | – | |
| ATLAS 7/8 TeV | 4.6/20.3 | [148] | – | – | ||
| ATLAS 8 TeV lep+jets | 20.3 | [145] | – | – | ||
| CMS 7 TeV | 2/2.2/3.9/3.54 | [159, 160, 161, 162, 163] | – | – | – | |
| CMS 7/8 TeV | 19.6/19.7 | [159, 160] | – | – | – | |
| CMS 8 TeV | 19.6/18.4 | [146, 147] | – | – | ||
| CMS 8 TeV dilep | 5.3 | [19] | – | – | – | |
| ATLAS 13 TeV dilep | 3.2 | [164] | – | – | – | |
| ATLAS 13 TeV lep+jets | 139 | [151] | – | – | – | |
| CMS 13 TeV lep+jets | 19.7 | [152] | – | – | ||
| CMS 13 TeV | 0.042/2.2/2.53 | [165, 166, 167] | – | – | – | |
II.2 The 13 TeV top-quark data in the post-CT18 era
In this section we describe the top-quark pair production differential cross section measurements at ATLAS and CMS that are considered in this study.
In 2018, the CMS collaboration published differential cross section measurements at 13 TeV in the dilepton [24] and lepton+jets [25] channels. The lepton+jets channel measurements of ref. [25] have recently been superseded by new measurements with a higher IL of 137 fb-1 [26] which we use in this analysis. In parallel, the ATLAS collaboration published two 13 TeV measurements based on the lepton+jets [21] and the all-hadronic [22] channels respectively. These measurements are described below.
ATLAS lepton+jets channel (ATL13lj). We explored the impact of absolute top-quark pair production single differential distributions based on lepton+jet events measured at ATLAS 13 TeV with 36 fb-1 of IL [21], which we label “ATL13lj”. We use full phase-space results at parton-level, and consider reconstructed measurements at parton-level in the resolved topology which are expected to provide direct constraints on PDFs. We do not consider the transverse momentum distribution of the pair because final-state interactions (FSI) between hard partons and beam remnants from the initial state may lead to substantial corrections to pair invariant mass (PIM) kinematic distributions when recoiling radiation is suppressed (see for instance the discussion in ref. [168]). These contributions may manifest as higher-order perturbative corrections to the factorized cross section, and as nonperturbative corrections that are suppressed by powers of perturbative scales.
The correlated systematic uncertainties associated to these measurements [21] are presented in terms of both the covariance matrix and nuisance parameter representations. We adopt the nuisance parameter representation because this is the default treatment for correlated systematic uncertainties in all CTEQ PDF analyses.
We study the impact of bin-by-bin statistical correlations between these distributions released for various combinations. The results are shown in Sec. II.5 where we find that the statistical correlations for these measurements have some impact on the description, but their overall impact on the PDFs and their errors is negligible.
In addition, we study the impact of combinations of double-differential distributions, such as , and confront the results with those obtained by including the corresponding statistically combined single differential , distributions.
To facilitate comparisons with measurements at CMS, the ATL13lj measurements are released by using two different bin resolutions: 1) the original ATLAS bin resolution, and 2) the CMS bin resolution which shares the size of its bins and the number of points with the CMS 13 TeV measurements in the dilepton channel [24]. These two bin resolutions differ in number of bins and bin size. Moreover, bin-by-bin statistical correlations are made available only for bin choice 1). As we shall see in the next sections, this has a non-negligible impact on the data-vs-theory description for single distributions using these two bin resolutions.
ATLAS all-hadronic channel (ATL13had). For the ATLAS 13 TeV all-hadronic channel with an integrated luminosity of [22], we consider absolute single differential cross sections for the reconstructed top quark in terms of , , , and , where is the transverse momentum of the leading (trailing) top quark. We label this data set as “ATL13had”. Combinations of double-differential cross sections for this channel are not available. For these measurements, correlated systematic uncertainties are made available in terms of nuisance parameters which are included in our global analysis.
CMS dilepton channel (CMS13ll). We study the impact of differential cross sections of top-quark pair production in the dilepton channel measured at CMS 13 TeV with of IL [24]. These are labeled as “CMS13ll”. They are published in terms of absolute and normalized single-differential distributions for the reconstructed top quarks. We consider only absolute cross section measurements in the full phase space at the top-quark level. This allows us to simplify the calculation of the theoretical predictions. Measurements relative to the decayed particle in the fiducial phase space will be analyzed in a future work as they require an additional effort to obtain complete predictions at the NNLO accuracy. In this study, we consider single-differential cross sections in terms of the , , , and distributions.
Correlated systematic uncertainties are presented in terms of the covariance matrix. In accordance with the default treatment of systematic correlations in the CTEQ framework, we convert the covariance matrix into the nuisance parameter representation by using a version of the iterative decomposition method, adopted in the CT18 analysis [126]. A slightly extended discussion is in Appendix B.
Bin-by-bin statistical correlations between measurements are not available to date, to the best of our knowledge. Therefore, we cannot exploit combinations of single differential distributions for these measurements in the global fit.
CMS lepton + jets channel (CMS13lj). In 2018, the CMS collaboration published 13 TeV measurements with 35.8 fb-1 of IL in the lepton+jets channel [25]. These measurements are now superseded by new measurements with higher precision with 137 fb-1 of IL [26], which we use in this analysis and are labeled as “CMS13lj”. We examine the impact from the and single differential distributions in the full phase space. Bin-by-bin statistical correlations are not provided also for these measurements. Statistical and correlated systematic uncertainties are given in terms of the covariance matrix which we convert to nuisance parameter representation as discussed above.
II.3 Theoretical framework
Details of the theoretical framework used in this analysis are given below. Additional details and comparisons are given in Appendix A.
Global PDF analyses necessitate fast, precise, and accurate theory predictions that are compared to experimental data in the -minimization procedure. To reduce the CPU turn-around time, fast theory predictions are obtained as interpolating tables through the FatNLO [169, 170, 171, 172] and APPLGrid [173] frameworks.
NNLO QCD and NLO EW corrections. The theory predictions at NNLO in QCD used in this work are based on two independent calculations. One is the numerical calculation described in refs. [53, 54], based on the STRIPPER subtraction method [55, 56, 57] and implemented in fastNLO tables [174, 175]; the other one is described in refs. [58, 59, 60], based on the -subtraction method [176] and implemented in the computer program MATRIX [61, 177], that is publicly available.
The theory predictions utilized for the CMS13ll [24] differential distributions which share the same bin resolution of some of the ATL13lj [21] distributions, are generated at NNLO with fastNLO [175]. The theory predictions for the ATL13lj distributions resolved in terms of the ATLAS bins, are instead obtained with MATRIX. To optimize the calculation and minimize the CPU’s turn-around time in the global fit, the MATRIX NNLO theory is constructed through bin-by-bin NNLO/NLO -factors defined as , where represents the corresponding NNLO PDF luminosity. The NLO theory calculation is obtained from fast lookup APPLGrid tables [173] generated with MCFM [33, 178]. A detailed comparison between the NNLO theory obtained with fastNLO tables [174] and that obtained with MATRIX, as well as a consistency check, are in Appendix A.1.
The theory predictions relative to the ATL13had [22] and CMS13lj [25, 26] measurements in the global fit are obtained with MATRIX in similar manner.
The EW corrections and their implementation are discussed in Appendix A.2. Overall, the impact of the EW corrections on PDF determination is found to be negligible given the current size of the experimental errors.
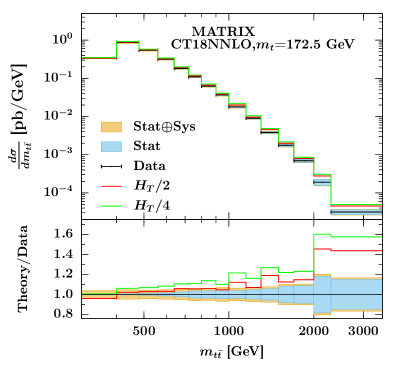
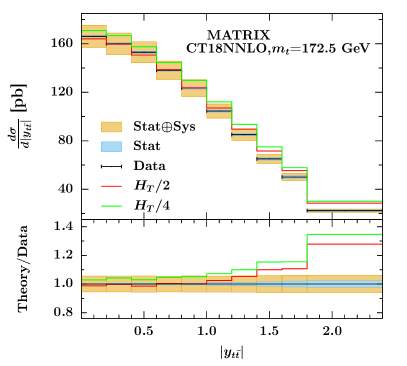
Impact of different central scales in the theory prediction. It is interesting to explore the impact of different choices for the central scale in the theory prediction for the differential cross sections at 13 TeV and make a comparison with the experimental uncertainties. To this purpose, we consider the CMS13lj measurements [26] with 137 fb-1 of IL as they are the most precise data in this analysis. In Fig. 1, we confront to the experimental data theory predictions for the (left) and (right) distributions calculated with the CT18NNLO PDFs and with different scale choices. The theory predictions are computed with central scales and respectively, represented by solid lines of different color in Fig. 1. For both distributions, the agreement with data deteriorates at large ( TeV) and large (), although it is better in correspondence of . These two CMS13lj measurements are very sensitive to the gluon and play a major role in the global fit which is discussed later.
In this work, independent fits with central-scale choices , , and are examined. Differences in the predictions obtained with these scale choices can be used to quantify part of the theoretical uncertainty in the theory predictions in the global analysis.
Hessian profiling with the ePump framework. A preliminary assessment of the impact of new measurements on existing PDFs sets before performing the global fit can be done by using different tools relying on a variety of statistical procedures based on the Monte Carlo or the Hessian method. Examples of these are: ePump (error PDF Updating Method Package) [140, 141], Hessian profiling [179], Bayesian reweighting techniques [180, 181, 182], and the PDFSense method [183].
We perform a preliminary investigation to assess the impact of the 13 TeV on PDFs using the ePump package. ePump allows one to obtain the updated best-fit PDF and relative PDF errors using the Hessian method. Previous studies using ePump are presented in refs. [184, 141, 185, 137, 186, 137, 139].
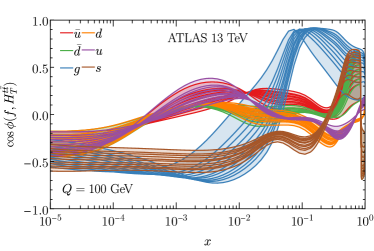
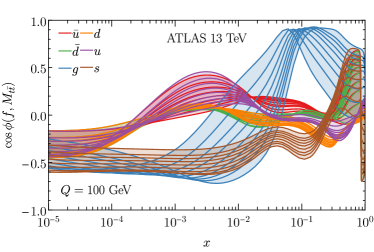
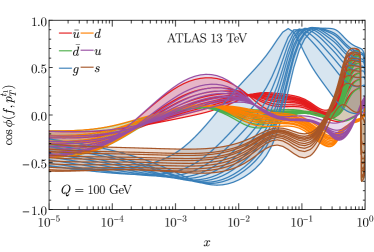
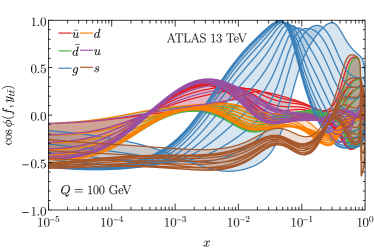
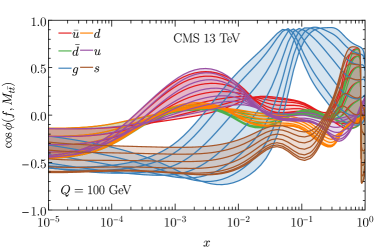
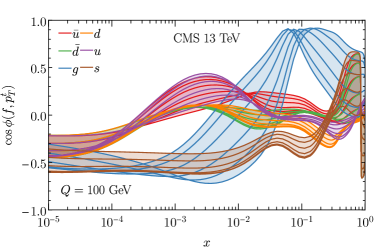
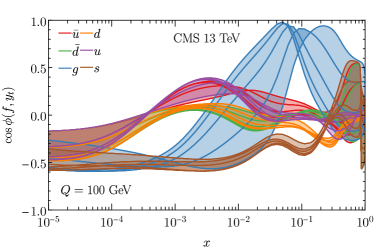
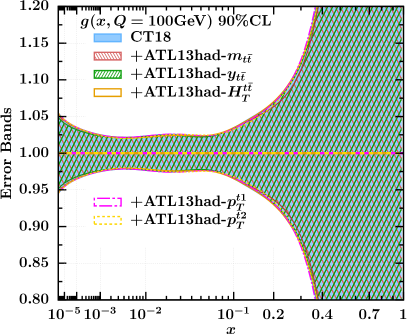
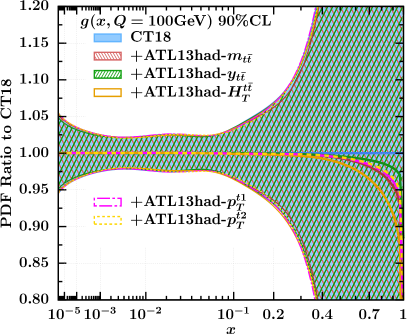
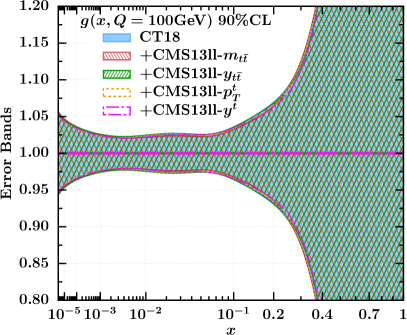
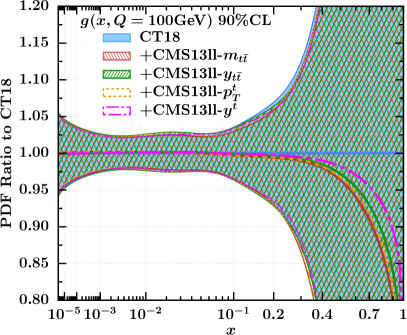
In Fig. 2 and 3, we present plots for the correlation-cosine between experimental data and PDFs for various differential distributions as a function of the parton momentum fraction for the ATL13had [22] and CMS13ll [24] measurements, added on top of the CT18 baseline. PDFs in the various insets are represented by different colors and each solid line corresponds to different bins of the distribution under scrutiny. In both experiments, the gluon PDF appears to be strongly correlated at large in the interval for all distributions. The correlation plots relative to the other experimental data considered in this work are very similar.
The results from ePump for the preliminary assessment of impact of individual experiments are reported in Tab. 3, where they are shown for different values of the central scale in the theory predictions, and can be compared to those from the global fit which will be discussed later in Sec. III. We study the quality-of-fit in terms of and use it as the criterion for an initial investigation of the data.
Looking at the values from ePump in Tab. 3, we note that the and distributions produce an acceptable fit quality (with or ) among the ATL13had measurements, while for the and distributions regardless of the scale choice.
The and distributions are the only two that can be well described (for or ) among the CMS13ll measurements, and the distribution is the only acceptable candidate in the CMS13lj measurements as cannot produce a good fit, regardless of the scale choice.
The ATL13lj case deserves more efforts because of the two bin resolutions and the bin-by-bin statistical uncertainties. In the ATL13lj measurements with the CMS bin resolution, we observe that the , and distributions produce acceptable values in Tab. 3, while the distribution produces , independently of the scale choice.
We discuss the ATL13lj measurements with the ATLAS binning resolution separately in Sec. II.4, where we analyze the results from ePump with and without inclusion of bin-by-bin statistical correlations.

II.4 Statistical correlations in the ATLAS lepton+jets data
The impact of bin-by-bin statistical correlations in the ATL13lj measurements [21] available on the HEPData [188] repository is first analyzed with ePump. The theoretical predictions are obtained with the MATRIX computer program as described in Sec. II.3, with top-quark mass set to GeV in the pole mass approximation. The impact of central-scale dependence is analyzed for the three different scales .
In Tab. 2 we report the values from ePump obtained with and without inclusion of statistical correlations. The implementation using bin-by-bin statistical correlations is labeled as “WSC” while the one without statistical correlations is “NSC”. In addition, we use the notation adopted in the ATLAS publication where denotes the boosted topology for the rapidity of the system, while denotes the scalar sum of the transverse momenta of the hadronic and leptonic top quarks, .
To consistently account for the statistical correlations, the WSC implementation adopts the ePump “error type 2” option, where one has nuisance parameters and (statistical) correlation matrices as inputs. In this case, the correlated systematic uncertainties are given in terms of their absolute (rather than percent) contribution to each data point, and are therefore treated as additive errors. For more details about the ePump implementation we refer the reader to the online manual [189]. The NSC implementation adopts the ePump “error type 4” option, where the nuisance parameters representation is used and correlated systematic uncertainties are normalized to data111This choice can in principle introduce the D’Agostini bias [190, 191], where data fluctuations can result in a bias in favor of experimental data points with lower central values. We do not discuss this here because the overall impact of the bin-by-bin statistical correlations of the ATL13lj measurements is negligible, and the same analysis is performed in the global fit where the systematic error for each multiplicative term is determined by multiplying the fractional uncertainty times the theoretical prediction for that bin. This is not affected by the same fluctuations. (See Appendix C2 of the CT18 study [126].).
On the one hand, from the values in Tab. 2 we note that regardless of the inclusion of statistical correlations and scale choice, there is some tension between various distributions, e.g., and , and , and and . Taken individually, all of these single differential distributions produce acceptable . In the ePump environment, tensions are amplified when statistical correlations are included. In addition, we note that when all distributions are statistically combined, and produce a net effect ( values) that is similar to that of the CT18++ case for the scale choice .
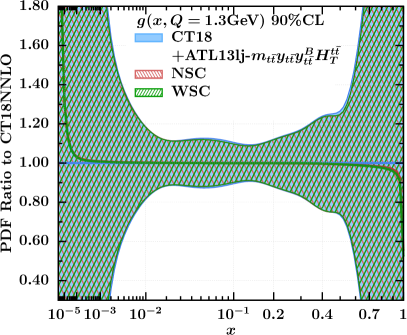
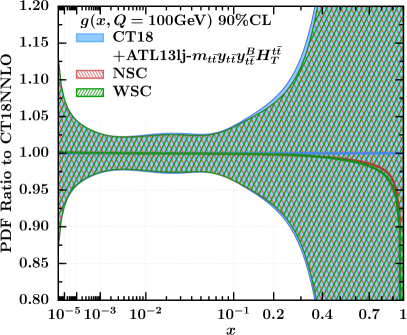
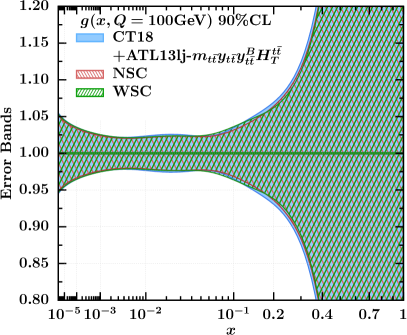
On the other hand, as illustrated in Fig. 4, the impact of the bin-by-bin statistical correlations on PDFs is negligible. In addition, even if the , , , and distributions are simultaneously included in ePump, the impact of these distributions on the gluon is very small. As we shall see in Sec. III, a similar behavior is observed in the true global QCD analysis where the overall impact from statistical correlations in the ATL13lj data is very small.
| Scale | |||||||
|---|---|---|---|---|---|---|---|
| Observable | WSC | NSC | WSC | NSC | WSC | NSC | |
| 9 | 1.150/1.146 | 1.105/1.101 | 1.309/1.300 | 1.260/1.251 | 1.249/1.231 | 1.234/1.214 | |
| 7 | 1.027/1.022 | 1.002/0.997 | 0.713/0.706 | 0.718/0.710 | 0.671/0.622 | 0.687/0.677 | |
| 9 | 1.153/1.147 | 1.087/1.081 | 0.861/0.851 | 0.855/0.845 | 0.853/0.838 | 0.862/0.847 | |
| 9 | 0.923/0.920 | 0.864/0.862 | 0.832/0.831 | 0.781/0.780 | 1.185/1.183 | 1.106/1.104 | |
| + | 16 | 1.312/1.304 | 1.204/1.193 | 1.198/1.193 | 1.139/1.132 | 1.175/1.166 | 1.151/1.141 |
| + | 18 | 1.331/1.318 | 1.246/1.230 | 1.205/1.198 | 1.143/1.135 | 1.186/1.178 | 1.144/1.135 |
| + | 18 | 1.610/1.594 | 1.462/1.449 | 1.696/1.640 | 1.206/1.187 | 2.364/2.257 | 1.511/1.472 |
| + | 16 | 0.994/0.985 | 0.906/0.900 | 0.703/0.692 | 0.633/0.625 | 0.663/0.651 | 0.581/0.571 |
| + | 16 | 0.950/0.942 | 0.892/0.886 | 0.648/0.645 | 0.625/0.622 | 0.761/0.758 | 0.725/0.721 |
| + | 18 | 1.531/1.521 | 1.255/1.247 | 1.152/1.147 | 0.967/0.962 | 1.130/1.127 | 0.961/0.956 |
| ++ | 25 | 1.098/1.085 | 1.002/0.991 | 0.925/0.919 | 0.864/0.858 | 0.906/0.900 | 0.855/0.848 |
| ++ | 25 | 1.657/1.648 | 1.431/1.425 | 1.680/1.658 | 1.087/1.082 | 2.402/2.356 | 1.377/1.362 |
| ++ | 27 | 1.694/1.687 | 1.424/1.417 | 1.780/1.766 | 1.162/1.157 | 2.480/2.447 | 1.475/1.464 |
| ++ | 25 | 1.257/1.248 | 1.001/0.994 | 0.949/0.944 | 0.729/0.724 | 0.966/0.962 | 0.716/0.712 |
| +++ | 34 | 1.571/1.564 | 1.233/1.227 | 1.672/1.654 | 0.954/0.949 | 2.466/2.429 | 1.220/1.210 |
II.5 Single vs double distributions at the LHC 13 TeV
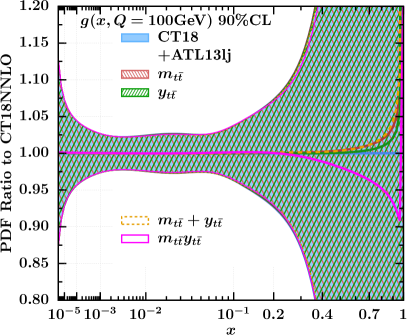
The ATLAS and CMS collaborations published several measurements of top-quark pair production double differential distributions at 13 TeV at both particle and parton level. A question then arises about the optimal strategy to be used to best exploit these new high-precision measurements. That is, whether to use statistically-combined single differential distributions, or double differential distribution directly. While a more exhaustive analysis specifically related to this point is beyond the scope of this paper and will be addressed elsewhere, here we explore the impact on CT18 PDFs in both cases by using ePump. As a case study, we consider the ATL13lj [21] measurements. In particular, we investigate the impact on the CT18 gluon PDF from adding two single-differential (1d) distributions (e.g. and ) on top of the CT18 baseline as well as the impact from the double differential (2d) distribution .
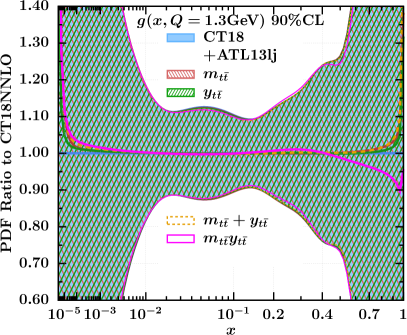
In Fig. 5 we illustrate the ePump results for the CT18 gluon in four different cases: 1) when the 1d distributions are added together on top of the CT18 baseline (orange dashed curve), 2) the distribution only is added (green curve), 3) the distribution only is added (red curve), 4) the 2d distribution is added (purple curve). The blue band represents the CT18NNLO PDF uncertainty at 90% C.L. In this example, when the and 1d distributions are individually added, or added together on top of the CT18 baseline, they generate opposite pulls on the large- gluon as compared to the 2d distribution. At GeV, the 2d distribution has a preference for a softer gluon in the region, while at GeV this preference is in the region. In both cases, the 1d distributions have opposite trend at large with a much milder effect.
Because of these opposite trends at large , and because the gluon PDF uncertainty is large in this region, where there is essentially no data, we conclude that there is no obvious preference between the 1d combination, and the 2d distribution. Ultimately, the impact from 2d and other multiple differential distributions must be assessed in the more general environment of a global PDF fit and explored against that of 1d distributions and their combinations. This will be analyzed in a future work.
III Global QCD analysis: Impact from individual single differential distributions at the LHC 13 TeV
In this section, we extend the analysis of the 13 TeV data to the global fit and extract post-CT18 PDFs at NNLO. In particular, we illustrate the results of multiple global QCD analyses at NNLO using the 1d absolute differential cross sections from the ATL13had, ATL13lj, CMS13ll, and CMS13lj measurements individually added on top of the CT18 baseline. We analyze the impact of these high-precision measurements on the gluon PDF and other relevant PDF combinations, and compare the results to the CT18 fit.
The setup of the global fits is the default one used in the CT18 study, where we use the same tolerance criterion to estimate the post-CT18 PDF uncertainties, and the same PDF parametrizations. An extended analysis using more flexible PDF parametrizations will be presented in a forthcoming study. The value of the top-quark mass is set to GeV, and the strong coupling constant at the -boson mass is set to .
To find optimal combinations of measurements that allow us to include as much information as possible and, at the same time, minimize tension between observables, we first perform analyses including the 13 TeV data sets from every single channel one at a time, in individual global fits. Distributions are included in a combined manner only for the ATL13lj measurements where bin-by-bin statistical correlations are studied in advance in ePump preliminary assessments.
In addition, we consider different choices for the central scale in the 13 TeV theory predictions and investigate their impact. The quality-of-fit in terms of (as well as the same values previously obtained with ePump), are reported in Tab. 3.
The results of individual global fits using the 13 TeV ATLAS and CMS measurements in the various channels are discussed below.
| Exp | Obs | ePump | Global fit | ||||
| 9 | 1.75 | 1.57 | 1.60 | 1.53 | 1.47 | ||
| 11 | 1.98 | 1.77 | 1.59 | 1.50 | 1.74 | ||
| 12 | 1.28 | 1.15 | 0.94 | 1.05 | 1.07 | ||
| 10 | 1.30 | 1.19 | 1.12 | 1.20 | 1.33 | ||
| ATL13had | 8 | 1.13 | 0.84 | 1.05 | 0.84 | 1.59 | |
| 7 | 3.46 | 3.07 | 3.14 | 3.12 | 3.23 | ||
| 10 | 1.66 | 0.97 | 0.68 | 0.94 | 0.67 | ||
| 6 | 3.60 | 3.70 | 3.68 | 3.56 | 3.05 | ||
| CMS13ll | 10 | 1.33 | 0.94 | 0.87 | 1.00 | 0.69 | |
| 15 | 1.49 | 1.38 | 1.81 | 1.20 | 1.67 | ||
| CMS13lj | 10 | 6.47 | 6.24 | 6.42 | 6.01 | 5.88 | |
| CMS bins | |||||||
| 7 | 2.40 | 1.17 | 0.68 | 0.83 | 0.66 | ||
| 10 | 0.91 | 0.69 | 0.62 | 0.74 | 0.75 | ||
| 6 | 2.34 | 2.01 | 2.47 | 1.35 | 1.43 | ||
| 10 | 1.30 | 1.07 | 1.10 | 1.16 | 0.68 | ||
| ATLAS bins without statistical correlation (NSC) | |||||||
| 9 | 1.55 | 1.12 | 0.94 | 1.27 | 0.92 | ||
| 7 | 0.91 | 0.74 | 0.80 | 0.76 | 0.90 | ||
| 9 | 1.40 | 1.27 | 1.53 | 0.85 | 0.93 | ||
| 9 | 1.35 | 0.91 | 0.93 | 0.81 | 0.80 | ||
| 34 | 1.87 | 1.28 | 1.46 | 0.93 | 1.06 | ||
| ATLAS bins with statistical correlations (WSC) | |||||||
| 9 | 1.68 | 1.35 | 0.98 | 1.29 | 0.96 | ||
| 7 | 0.88 | 0.75 | 0.92 | 0.75 | 0.92 | ||
| 9 | 1.06 | 0.87 | 1.01 | 0.86 | 0.99 | ||
| 9 | 1.40 | 0.85 | 0.85 | 0.86 | 0.86 | ||
| ATL13lj | 34 | 3.10 | 1.61 | 1.32 | 1.59 | 1.32 | |
III.1 Impact from the ATLAS lepton+jets channel
We start by analyzing the impact from the ATL13lj measurements [21] using the two bin resolutions, i.e., the ATLAS and CMS binning, published by the ATLAS collaboration and available on the HEPData repository [188].
ATL13lj resolved with CMS bins. The ATLAS measurements resolved in terms of CMS bins share the bin size with the CMS13ll data that have equal IL [24]. Bin-by-bin statistical correlations are not available for this specific binning resolution. Looking at the individual values in Tab. 3, the 1d distributions that are better described by the theory are and , while the description of the and distributions is more challenging due, in part, to the fact that they refer to reconstructed hadronically-decayed top quarks. We note that both the and distributions have independently of the choice of the central scale in their theory predictions. The spectrum appears to be more stable when the central scale is varied, with in both cases. The description of the distribution is largely affected by the central-scale choice.
The and distributions provide us with most of the information and introduce the least tension when they are independently added on top of the CT18 baseline.
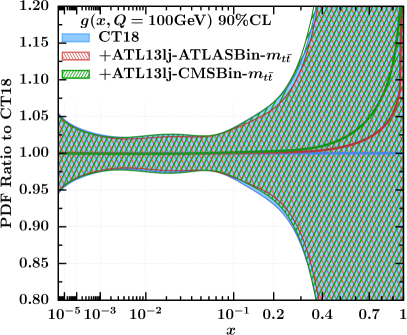
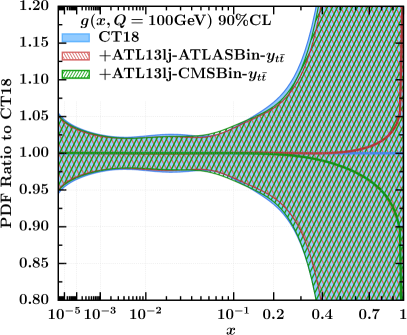
In Fig. 6 we compare the individual impact on the large- gluon obtained using the two bin resolutions in a global fit at NNLO. Error bands with different hatching represent PDF uncertainties at CL, and the central-scale choice in the 13 TeV theory predictions is set to (results are very similar for ). We observe that the constraints placed by the and distributions resolved with the CMS13ll bins have pulls in opposite directions above . In particular, the distribution prefers a harder gluon while the one prefers a softer gluon as compared to CT18. Overall, the impact on the gluon PDF error is small. As reflected in Tab. 3, both distributions exhibit with small variations when the central-scale choice in their theory prediction is varied.
ATL13lj resolved with ATLAS bins. The impact from both the individual and cumulative (in terms of bin-by-bin statistically combined) 1d ATL13lj distributions, resolved with ATLAS bins, is analyzed together with the impact of statistical correlations. The most relevant information is obtained from the , , , and distributions for which bin-by-bin statistical correlations are available. Their values from the NNLO global fit in Tab. 3 is of order 1 or less for all distributions, regardless of the central-scale choice in their theory predictions, with some deterioration when the four spectra are statistically combined and fitted together. This is expected as statistical correlations impose further constraints in the fit. Correlated systematic uncertainties are given in terms of the nuisance parameter representation.
By looking at the and distributions in Fig. 6, we observe that the pulls on the gluon at large are in the same direction, i.e., both and prefer a harder gluon at and distortions are more pronounced for . However, these distortions are milder as compared to those obtained from the same distributions resolved with the CMS13ll bins. The behavior of the gluon at large- constrained by the inclusion of the and distributions in the fit, is very similar to that of the and distributions, respectively, and it is not shown here. The individual distribution impact on the PDF uncertainty is negligible also in this case.
Impact of bin-by-bin statistical correlations in the global fit. In Fig. 7 we illustrate the impact on the gluon PDF from the , , , and distributions of the ATL13lj data added together on top of the CT18 baseline, and added together including statistical correlations. The gluon PDF is shown at a scale of GeV to emphasize the impact, while error bands with different hatching represent PDF uncertainties at CL. Also here, the central-scale choice in the 13 TeV theory predictions is set to . Considerations are similar for the scale choice . The left panel in Fig. 7 shows that statistical correlations have a negligible impact on the gluon PDF errors. In the right panel, we show distortions in the gluon central value at large in fits with and without statistical correlations. The impact of statistical correlations is very small and mostly localized at where there is weak or essentially no constraint from data. In addition, we observe that when the four distributions are added together, their effect on the gluon central value is diluted in the fit, and the quality-of-fit improves ( in Tab. 3) when the central scale is set to as compared to , in presence of statistical correlations. Without statistical correlations, a good description () of the combined spectra is obtained by using the scale choice.
As discussed in Sec. II.4, the small impact of statistical correlations from the ATL13lj data is confirmed by ePump. However, the observed trend of pulls on the gluon from ePump in Fig. 4 is in the opposite direction as compared to the global fit in Fig. 7. This is plausible, because the statistical procedure to update PDFs and their errors in ePump poses more restrictions as compared to a global PDF fit. In addition, may differ depending on the treatment of the errors (i.e., the “error type” option) in ePump (see for instance the values in Tab. 2 and Tab. 3). In Tab. 3, the ePump values are obtained by using the “error type 1” option, where uncorrelated statistical and systematic errors are given, and correlated systematic errors (with percent correlation to each data point) are also given. The correlated systematic errors are treated multiplicatively, i.e., by multiplying the percentages by the original best-fit theory predictions for each data point.
The interplay between the two bin resolutions in the ATL13lj measurements is further discussed in Sec. IV where optimal data combinations are selected. The two bin resolutions differ in number of bins and bin size. We have cross checked the theory predictions in both cases, with independent calculations from MATRIX [59, 60] and the NNLO version of fastNLO tables [174], and we find consistency. Overall, we find that the gluon impact of the ATL13lj measurements in the global analysis is negligible.

III.2 Impact from the ATLAS all-hadronic channel
The impact on the gluon when the ATL13had measurements [22] are added on top of the CT18 baseline is illustrated in Fig. 8. The most relevant information in the global fit is obtained from the , , , , and distributions which we study here. The , , and distributions produce visible impact on the large- gluon at . Pulls are all in the same direction and there is a preference for a softer gluon at large , with a more pronounced effect from at .
A milder impact is observed for and at . The and distributions produce an almost identical behavior, with most of the impact located at . The constraining power of these data in this kinematic region is limited by large experimental uncertainties that affect these distributions.
For all distributions, the impact on PDF uncertainties is negligible. The in Tab. 3 is of order 1 for the distribution regardless of the central scale choice in the theory predictions. Moreover, the and distributions are in general not well described, while the for individual fits using and depends on the central-scale choice. As before, correlated systematic uncertainties are given in terms of nuisance parameters. As for the ATL13lj data, the overall individual impact of the ATL13had measurements is negligible.
III.3 Impact from the CMS dilepton channel
In Fig. 9 we illustrate the individual PDF impact of the CMS13ll measurements [24]. The subset from which we gather the most relevant information to constrain the gluon is obtained by considering the , , , and distributions. As discussed in Sec. II.2, the correlated systematic uncertainties for these measurements are published in terms of the covariance matrix representation. Therefore, we perform conversion to nuisance parameters as discussed in Appendix B.
From the values in Tab. 3, the and distributions do not produce a good fit, regardless of the central-scale choice in their theory predictions. This is also confirmed by the results from ePump. The and spectra are the distributions for which we obtain the best description with using the central-scale choice , and with with central-scale set to .
The gluon central value with central-scale choice in Fig. 9 is affected by the CMS13ll data in the region with a strong preference for a much softer large- gluon as compared to the ATL13lj and ATL13had data. However, the impact on the gluon PDF uncertainty is very modest and comparable to that of the ATL13lj data.
III.4 Impact from the CMS lepton+jets channel
The CMS collaboration released two sets of measurements in the lepton+jets channel, obtained with 35.8 fb-1 of IL [25] and with 137 fb-1 IL [26], respectively. We focus on the 137 fb-1 measurements as they extend the previous ones [25] and their precision is significantly improved. In addition, we observe that they place stronger constraints on the gluon in the global analysis, due to their improved systematic uncertainties which results in higher precision. Bin-by-bin statistical correlations are not available for these measurements.
We study the individual impact of the and distributions, which provide us with the most relevant information among the CMS13lj measurements in the global fit. In Fig. 10, we illustrate the impact from these two measurements on the gluon PDF.
From the values in Tab. 3, we observe that the distribution cannot be well described in either the global QCD analysis or with ePump, with or more, regardless of the central-scale choice. The distribution instead produces a better fit with a preference for a slightly harder gluon in the range as compared to the spectrum. Moreover, we note that the description of improves when the central-scale choice in the theory prediction is set to .
We note that this dynamical scale choice is different from the default discussed in ref. [192]. Throughout this work, the criterion according to which the optimal central scale for the theory prediction is chosen, is based on improvements in the quality-of-fit.
In Fig. 10, we observe that these measurements have stronger impact on the gluon uncertainty as compared to those previously analyzed. This is mainly ascribed to a better control of experimental uncertainties which in turn, enhances the constraining power of these data. It would be useful to examine the impact of bin-by-bin statistical correlations, should they become available.

IV Optimal combinations of 13 TeV top-quark pair production measurements in the global analysis
The analysis of impact from individual 13 TeV differential cross section measurements in various channels at ATLAS and CMS, previously discussed in Sec. III, allows us to select optimal combinations of measurements from which we can extract maximum information to constrain the gluon PDF, and minimize tensions among data in the extended baseline. The guiding principle for this selection is essentially based on the quality of impact and quality of description in the global fit, in terms of . That is, we select those measurements that place effective constraints and produce a good quality fit, and that do not deteriorate the description of data in the pre-existing baseline.
Looking at the values and central-scale choice for the 13 TeV theory predictions in Tab. 3, we observe that the distribution is well described (i.e., ) in both the ATL13had and CMS13ll cases. We therefore select the distribution from these measurements.
We select the distribution from the CMS13lj measurements, because the one does not produce a good fit ( regardless of the central-scale choice).
Because of the differences observed in the two bin resolutions of the ATL13lj measurements, we consider two separate cases: in one case we include the distribution with the CMS bin resolution, whose appears to be more stable against central-scale changes in the theory prediction as compared to (see Tab. 3); in the other, we include the , , , and distributions added together without statistical correlations as the latter produce negligible impact on PDF uncertainties. In addition, this greatly simplifies the global analysis.
Therefore, we identify two optimal combinations which we refer to as CT18+nTT1 and CT18+nTT2, respectively. The CT18+nTT1 combination includes the ATL13had-, CMS13ll-, CMS13lj-, and ATL13lj- distributions (resolved in terms of the CMS bins), while the CT18+nTT2 combination includes the same distributions from the ATL13had, CMS13ll, CMS13lj measurements, and the combination without statistical correlations from ATL13lj, resolved with ATLAS bins.
IV.1 Main results from the post-CT18 global analysis with extended baseline
The results of the NNLO global analysis obtained with the nTT1 and nTT2 combinations are summarized in Tab. 4, and illustrated in Figs. 13 and 14 where we show the gluon PDF ratio to CT18, and the ratio. and are selected as representative cases as they show the most visible impact from the inclusion of the new data in the global fit.
In Tab. 4 we compare the values obtained from the CT18+nTT1 and CT18+nTT2 to CT18. There, we only report the CT18 data sets that exhibit a noticeable change in . The remaining CT18 data sets have the same as in Tabs. I and II in ref. [126].
The CT18 NNLO fit [126] has and with . In the CT18+nTT1 fit, the total number of points is and the resulting total from the global fit is when the central scale of the 13 TeV theory is set to , while we obtain when the same scale is set to . In the CT18+nTT2 fit, the total number of points is , for the central-scale choice , and for .
Comparing the values of the individual experiments to those of CT18 in Tab. 4, we observe that the most noticeable quality-of-fit deterioration happens for both nTT1 and nTT2, regardless of the scale choice, in the case of the LHCb 8 TeV forward rapidity cross section [193]. Another case, for both the CT18+nTT1 and CT18+nTT2 fits, is to fit the CMS13lj distribution when the central scale in the theory is set to .
Another increase for both nTT1 and nTT2 is observed for the LHCb 8 TeV production cross section [194], and for the CMS 8 TeV single inclusive jet cross section [195] measurements, respectively. The LHCb 8 TeV measurements have an impact on the strange PDF, anti-quarks (e.g., ), and their errors at both small and large . This interplay can be further understood in terms of the sensitivity [196], that is a statistical tool to explore the pulls from individual measurements on the best-fit PDFs, and to identify tensions between competing data sets.
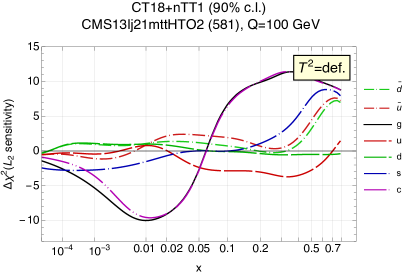
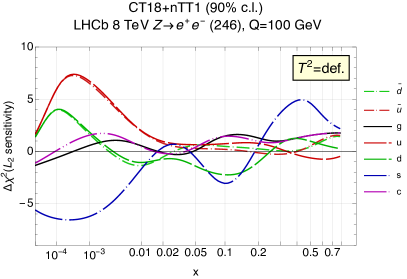
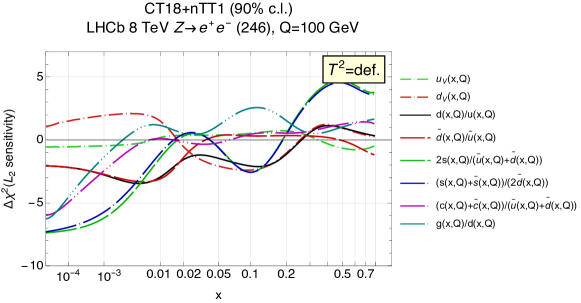
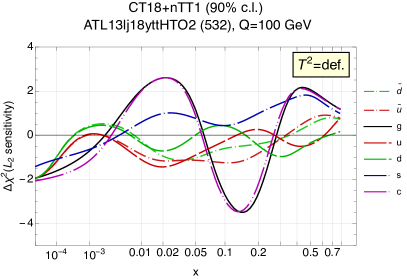
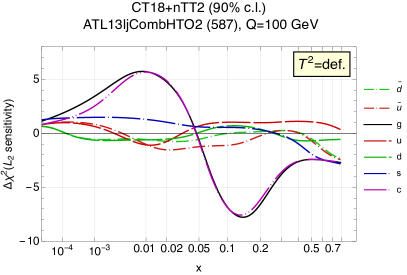
In Figs. 11 and 12, we illustrate the sensitivity for the CMS13lj distribution and the LHCb 8 TeV 2.0 fb-1 forward rapidity cross section measurements in the CT18+nTT1 global fit. The same figures for the CT18+nTT2 global fit are very similar and we do not show them here. The in the inset label refers to the default tier-2 penalty term in the definition adopted in the CT18 analysis.
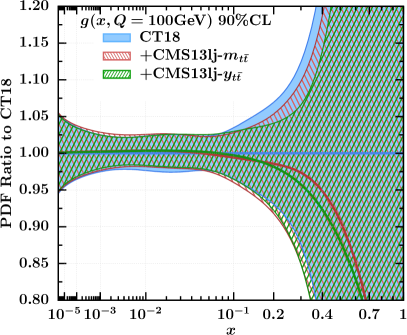
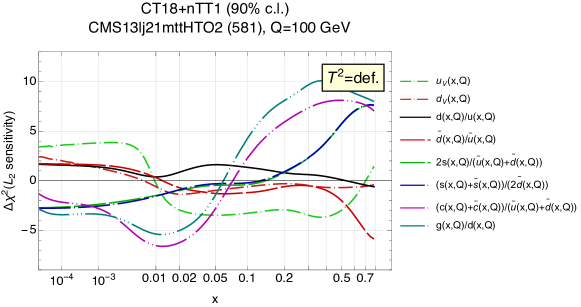
We observe that the distribution in CMS13lj has a strong preference for a softer gluon in the range, while the LHCb 8 TeV large rapidity data prefer a harder gluon in the same range. In addition, we observe a different suppression preference for the , , , and quarks across the entire range, where in particular we note a higher preference for a softer , , and quarks in the range by CMS13lj as compared to the LHCb 8 TeV measurements. These different suppression preferences have an impact on quark ratios, in particular on . The sensitivity for the ratio is illustrated in Fig. 12 where , and other PDF ratios are also shown222In the CT18 analysis , therefore ..
For these reasons, the increase for the LHCb 8 TeV large rapidity data in Tab. 4 can be ascribed to the presence of tension with the 13 TeV data. Moreover, the increase can in part be related to an increase in the uncertainty of the ratio, as compared to CT18.
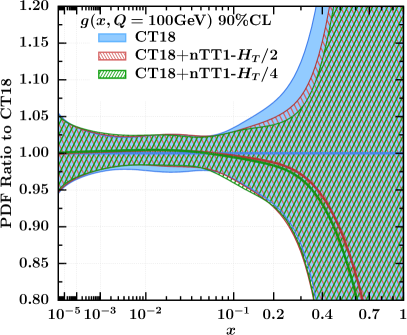
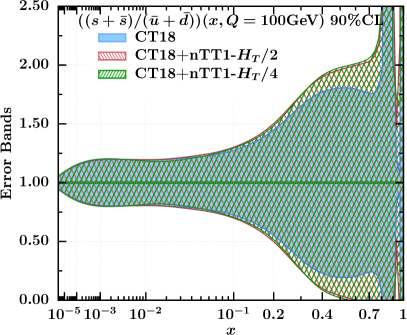
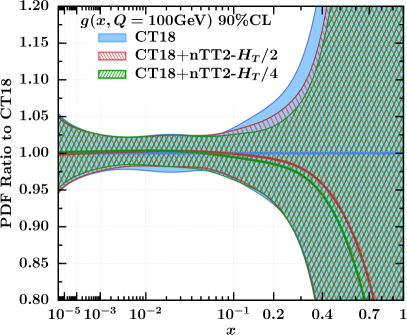
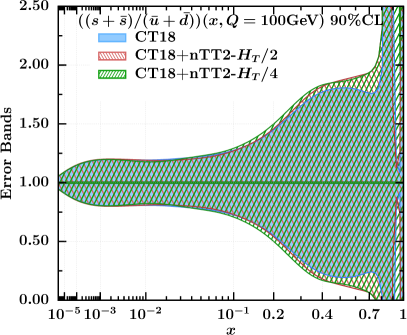
The uncertainty is shown in the right plot of Figs. 13 and 14 for CT18+nTT1 and CT18+nTT2, respectively. We note that the uncertainty increase in the region is more pronounced for CT18+nTT1 than for CT18+nTT2 where the strange-quark PDF is less suppressed in that range.
The left plots in Figs. 13 and 14 illustrate the resulting changes in the gluon PDF and its uncertainty, as well as (small) variations induced by selecting the two central scales , and , in the theory predictions at 13 TeV. For both scale choices we obtain a reduction in the gluon uncertainty in the range and above in the extrapolation region, and a much less pronounced reduction in the range.
We observe a preference for a softer gluon as compared to CT18 in the region. This constraint is mainly driven by the distribution from the CMS13lj data, with an improved description when the central-scale is set to .
While the quality-of-fit of the two CT18+nTT1 and CT18+nTT2 combinations is essentially the same as that of CT18 with , small differences between the CT18+nTT1 and CT18+nTT2 global fits are noticeable in Figs. 13 and 14 as compared to CT18. These are discussed in more detail in Sec. 17.
| ID# | Experimental data set | CT18 | nTT1 | nTT2 | nTT1 | nTT2 | ||
|---|---|---|---|---|---|---|---|---|
| 110 | CCFR | [197] | 69 | 1.1 | 1.1 | 1.1 | 1.2 | 1.2 |
| 246 | LHCb 8 TeV 2.0 fb-1 forward rapidity cross sec. | [193] | 17 | 1.0 | 1.5 | 1.5 | 1.5 | 1.5 |
| 250 | LHCb 8 TeV 2.0fb-1 cross sec. | [194] | 34 | 2.1 | 2.2 | 2.2 | 2.2 | 2.2 |
| 545 | CMS 8 TeV 19.7 fb-1, single incl. jet cross sec., , (extended in y) | [195] | 185 | 1.1 | 1.2 | 1.2 | 1.2 | 1.2 |
| 573 | CMS 8 TeV 19.7 fb-1, norm. double-diff. top and cross sec. | [20] | 16 | 1.2 | 1.2 | 1.2 | 1.1 | 1.1 |
| 580 | ATLAS 8 TeV 20.3 fb-1, and abs. spectrum | [17] | 15 | 0.6 | 0.7 | 0.7 | 0.7 | 0.7 |
| 521 | ATLAS 13 TeV 36.1 fb-1, abs. cross sec. all-hadronic | [22] | 12 | - | 1.0 | 1.0 | 1.1 | 1.1 |
| 528 | CMS 13 TeV 35.9 fb-1, abs. cross sec. dilepton ch. | [24] | 10 | - | 0.8 | 0.8 | 0.5 | 0.7 |
| 532 | ATLAS 13 TeV 36 fb-1, abs. cross sec. l+j ch. cms-bin | [21] | 10 | - | 0.7 | - | 0.8 | - |
| 587 | ATLAS 13 TeV 36 fb-1, abs. cross secs. l+j ch. | [21] | 34 | - | - | 0.7 | - | 1.1 |
| 581 | CMS 13 TeV 137 fb-1, abs. cross sec. l+j ch. | [26] | 15 | - | 1.1 | 1.1 | 1.6 | 1.7 |
IV.2 Interplay between top-quark and jet production data
Top-quark pair production and inclusive jet production at the LHC place complementary constraints on the gluon and other PDFs as these two processes overlap in the kinematic plane. It is therefore interesting to examine the interplay between top-quark pair and jet production data in NNLO global analyses with the CT18+nTT1 and CT18+nTT2 combinations. In particular, we analyze the individual constrains placed on the gluon from these processes separately.
To this purpose, we perform three main fits in each of which we study the impact of different central scales in the 13 TeV theory predictions. These global fits are performed by using the CT18 baseline as the starting point, where we remove either the jet or the 8 TeV data, or both, and add the nTT1 combination with scale choice or . The same fits performed with the nTT2 combination produce similar results.
Global fits without inclusive jet data. In a first global fit, which we label CT18mJet, PDFs are obtained from the CT18 fit by removing the inclusive jet production data. To explore the impact of the new 13 TeV combinations we consider two variants of this fit including the nTT1 data sets and where the theory predictions for the latter are included with different central scales. These fit variants are: ) the CT18 baseline without QCD jets and with nTT1 data sets, with central scale , labeled as CT18mJet+nTT1-; ) the CT18 baseline without QCD jets and with nTT1 data sets, with central scale , labeled as CT18mJet+nTT1-.
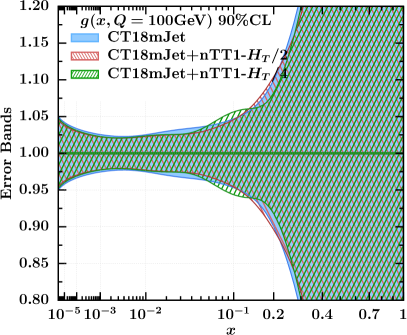
We focus our attention on the gluon which is the PDF receiving most of the impact. The results for the gluon PDF and its uncertainties resulting from these global analyses are illustrated in Fig. 15 where they are compared to the CT18 gluon at GeV.
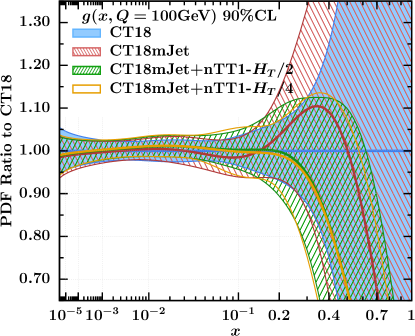
Looking at the PDF ratio plot in Fig. 15 (left), we observe that removing the QCD jet data from the CT18 baseline (CT18mJet) results in an increase of the PDF uncertainty at large in the range where there is a preference for a harder gluon with a bump in the region. Upon inclusion of the nTT1 combination in the CT18mJet+nTT1- and CT18mJet+nTT1- global fits, we observe a softer gluon in the range, regardless of the central-scale choice.
Comparing the gluon error bands in Fig. 15 (right), we note that uncertainties are only marginally reduced when nTT1 is included, with a small increase in the region for scale choice . This is due to small tensions with several data sets in the baseline, in particular the D0 run II 9.7 fb-1 electron charge asymmetry , with GeV measurements [198], and the structure function measurements [199] and [200] from the BCDMS collaboration. From an sensitivity study, one can see that the latter have a preference for a harder gluon PDF at large as compared to the nTT1 data, while the D0 run II electron charge asymmetry data are sensitive to the - and -quark PDFs with opposite trend as compared to BCDMS .
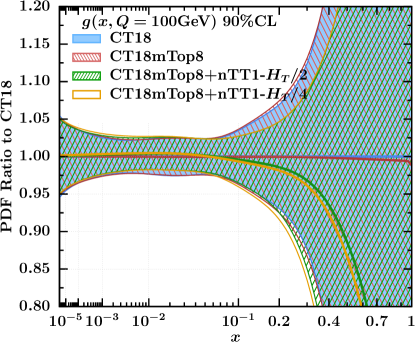
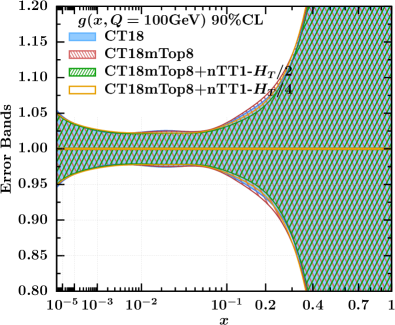
Global fits without data. In a second global fit, labeled as CT18mTop8, PDFs are obtained from the CT18 fit by removing top-quark pair production data (at 8 TeV only in CT18). As before, we consider two fit variants to assess the impact of the 13 TeV data, where the nTT1 combination is included with scale choices and in the theoretical predictions for the nTT1 data subset. These fit variants are labeled as CT18mTop8+nTT1- and CT18mTop8+nTT1-, respectively. The results for the gluon PDF are shown in Fig. 16 where we illustrate the impact. This is complementary to that in Fig. 15.
We note that when the 8 TeV measurements are removed from the CT18 baseline, the impact is negligible on both the central value and uncertainty of the gluon. When the nTT1 combination is included, there is a preference for a softer gluon at large in the region. However, the impact on the gluon uncertainty is negligible, as shown in Fig. 16 (right), regardless of the scale choice. Moreover, we observe that the central value of the gluon in the nTT1 fits is harder as compared to the CT18mJet+nTT1- and CT18mJet+nTT1- fits. This is due to the impact of inclusive jet production data which prefer a softer gluon PDF in the large- region.
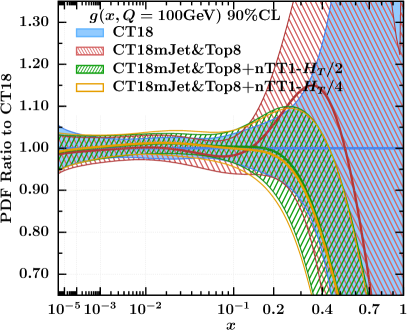
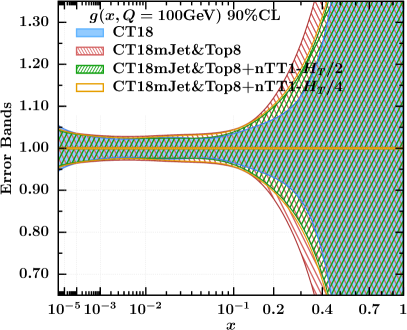
Global fits without QCD jets and production. Finally, in a third fit labeled as CT18mJet&Top8, PDFs are obtained by removing both the inclusive jet and data from the CT18 baseline. The results of this fit are then compared to the fit variants obtained by including the nTT1 data subset with central scale choice for the nTT1 theory predictions labeled as CT18mJet&Top8+nTT1-, and to that obtained with , labeled as CT18mJet&Top8+nTT1-.
The results are shown in Fig. 17 where we observe that the general trend is similar to that in Fig. 15. However, we note that the 8 TeV data lead to an approximately 8% reduction in the gluon central value in the region (compare the red solid line in Fig. 15(left) to that in Fig. 17(left)).
Looking at the PDF uncertainties in Fig. 17(right), we note only a small increase in the range as compared to the CT18mJet fit, which reflects the small impact of the 8 TeV data in the CT18 fit. When the nTT1 combination is included, the gluon central value becomes softer in the range similar to that of the CT18mJet+nTT1- and CT18mJet+nTT1- fits with a reduction of the uncertainty in the range as compared to the CT18mJet&Top8 fit (see Fig. 17(right)).
The conclusions we draw by comparing the results of the three main fits discussed above is that inclusive jet data place stronger constraints on the gluon as compared to top-quark pair production. This is mainly ascribed to the much larger number of data points in the inclusive jet measurements which tend to dilute the impact from production.
However, the impact from the 13 TeV production data results in a softer gluon at large , similar to that of the LHC jet data, but with a very different degree of suppression. In fact, the phase-space suppression in the hard scattering contributions for these two processes is different and generates different shapes and suppression in Fig. 15(left), and Fig. 16(left). Moreover, we note that most of the gluon suppression at large is driven by the CMS13lj data with 137 fb-1 of IL.
Finally, we observe that all of the changes in shape and magnitude in the gluon central value from the impact of the new measurements are within the 90% uncertainty band obtained from the CT18 NNLO fit.
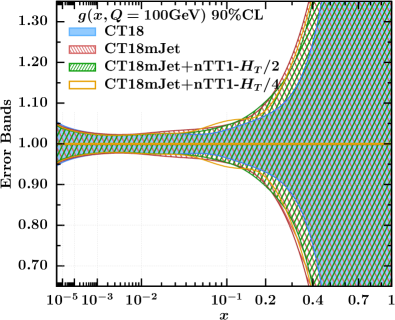
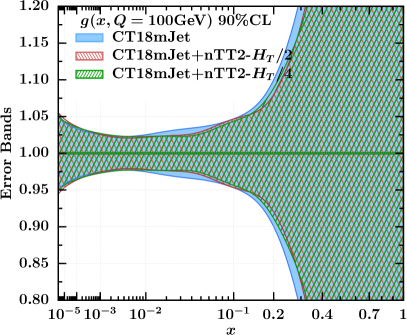
Differences between the nTT1 and nTT2 data subsets. To conclude this section, we wish to discuss differences between the nTT1 and nTT2 data subsets and their interplay with the 8 TeV top-quark data in the CT18 baseline. To facilitate this analysis and better emphasize the differences, we study the impact of the nTT1 and nTT2 data subsets on the gluon PDF uncertainty in the CT18mJet global fit, where inclusive jet data are removed. The results of this study are illustrated in Fig. 19.
In Fig. 19(left) we observe an increase in the gluon uncertainty in the region when the central scale in the nTT1 theory predictions is set to . The same increase is not present for the nTT2 combination in Fig. 19(right). This is one of the main differences which emerges in the nTT1 combination containing the distribution from the ATL13lj measurements resolved in terms of CMS bins that uses as the central scale in the nTT1 theory predictions. This tension disappears when the central scale choice is used.
By looking at the values in Tab. 4, we argue that this mild tension is generated in part by the CMS 8 TeV 19.7 fb-1 single inclusive jet cross section, whose increases from 1.1 to 1.2 (regardless of scale choice); in part by the ATLAS 8 TeV 20.3 fb-1 top-quark and absolute distributions, with a increase from 0.6 to 0.7 (regardless of scale choice), and finally, by the ATL13lj data in nTT2 with a increase from 0.7 to 1.1 when the central scale goes from to , and by the CMS13lj data in nTT1 and nTT2 with a increase from 1.1 to 1.6/1.7 when the central scale is reduced to . As already pointed out in Sec. III.4, this indicates a preference for the scale choice in the 13 TeV theory predictions in contrast to the suggested scale choice discussed in ref. [192]. In our global fits, the optimal central scale for the 13 TeV theory predictions is chosen according to the improvements it produces in the quality-of-fit.
It is also interesting to look at the sensitivity plots for the ATL13lj measurements in the full CT18+nTT1 and CT18+nTT2 gloabl fits which we illustrate in Fig. 20. There, in the left panel we show the ALT13lj distribution resolved in terms of CMS bins. In the right panel, we show the resolved with ATLAS bins, combined with the , , and distributions without bin-by-bin statistical correlations. As already argued in previous discussions, the ATL13lj bin-by-bin statistical correlations have negligible impact and can essentially be ignored. We note that the two different treatments of the ATL13lj measurements lead to different preferences for the gluon and strange PDFs in the range: the ATL13lj distribution resolved with CMS bins prefers softer gluon and softer strange PDFs, while the ATL13lj combination has opposite behavior.
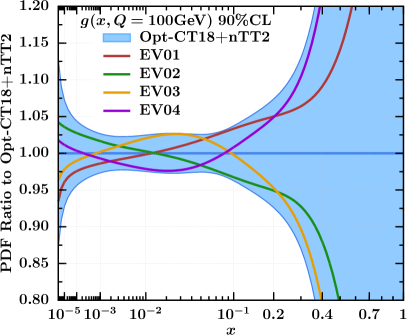
ePump Optimization. To further investigate differences in the CT18+nTT1 and CT18+nTT2 combinations, it is interesting to identify eigenvector (EV) directions that have maximal PDF sensitivity. The ePump framework allows us to identify a reduced set of error PDFs that contain the majority of the PDF dependence of the observables under consideration. The procedure is entirely based on the Hessian method and is documented in ref. [140]. The new eigenvectors contain exactly the same information as the original eigenvectors, but are optimized so that a smaller set of error PDFs can be chosen for use with the set of observables to any required PDF-sensitivity. In turn, this allows us to assess and validate the data that place the strongest constraints on PDF errors.
In Fig. 18, we illustrate the behavior of the optimized eigenvector directions for the CT18+nTT1 and CT18+nTT2 combinations, while fractional contributions to the PDF error from the leading eigenvectors for each individual data set are reported in Tabs. 5 and 6. With ePump, we find six optimized PDF error sets for both CT18+nTT1 and CT18+nTT2.
In the case of the CT18+nTT1 optimized directions, we observe that the three leading eigenvectors approximately account for 99% of the PDF error band. Among them, the largest contribution is from CMS13lj , with fractional uncertainty of approximately 31%. The second largest contribution is from ATL13had , with roughly 25%, and the smallest contributions are from CMS13ll and ATL13lj resolved in terms of CMS bins, both with fractional uncertainty of approximately 22%.
In the case of CT18+nTT2, the data with the largest contribution is the ATL13lj combination of , , and , which account for approximately 47% of fractional uncertainty. This is due to the larger number of data points. The second largest contribution is from CMS13lj with approximately 21%, and ATL13had with 16%. The smallest contribution is from CMS13ll , with fractional uncertainty of 13%.
| CT18+nTT1 (nTT1-) | |||||
|---|---|---|---|---|---|
| Leading EV No. | Leading EV (%) | ATL13had | CMS13ll | CMS13lj | ATL13lj |
| 1 | 65.80 | 16.96 | 13.42 | 22.00 | 13.42 |
| 2 | 31.64 | 7.96 | 7.24 | 9.20 | 7.24 |
| 3 | 1.69 | 0.49 | 0.47 | 0.27 | 0.47 |
| 4 | 0.79 | 0.10 | 0.14 | 0.42 | 0.14 |
| 5 | 0.07 | 0.02 | 0.01 | 0.02 | 0.01 |
| CT18+nTT2 (nTT2-) | |||||
|---|---|---|---|---|---|
| Leading EV No. | Leading EV (%) | ATL13had | CMS13ll | CMS13lj | ATL13lj |
| 1 | 68.43 | 10.53 | 8.64 | 15.53 | 33.73 |
| 2 | 28.92 | 5.91 | 4.99 | 5.24 | 12.77 |
| 3 | 1.52 | 0.36 | 0.33 | 0.12 | 0.71 |
| 4 | 1.00 | 0.08 | 0.12 | 0.22 | 0.58 |
| 5 | 0.11 | 0.02 | 0.01 | 0.01 | 0.07 |

These differences in the treatment of the ATL13lj measurements prompted us to identify the two optimal combinations CT18+nTT1 and CT18+nTT2, but overall they have mild impact in the global fits we have analyzed.
V Conclusions
We presented a comprehensive study of the impact of recent high-precision LHC top-quark pair production measurements at TeV of collision energy on PDFs of the proton, in particular the gluon, in global analyses at NNLO in QCD. This extensive analysis of post-CT18 PDFs is relevant for the next release of CTEQ-TEA PDFs which will be challenged by the inclusion of high-precision forthcoming measurements at the LHC for a multitude of standard candle processes like top-quark pair production.
Besides the PDF impact of the 13 TeV differential cross section measurements from ATLAS and CMS, we studied their interplay with inclusive jet production measurements in global PDF fits.
Due to differences in the binning resolution of the 13 TeV ATLAS lepton+jet data, we identified two optimal combinations of measurements that maximize the information to constrain the gluon, and minimize conflict with the other data sets in the extended baseline.
Overall, the impact of these measurements in reducing the uncertainty in the gluon PDF is found to be mild. However, their role is important as they constrain the behavior of the gluon PDF at large momentum fraction in a way that complements that of inclusive jet production data. In fact, the and inclusive jet production processes overlap in the – plane, but their matrix elements and phase-space suppression are different, and constraints on the gluon and other PDFs are placed at different values of .
We analyzed the impact of bin-by-bin statistical correlations whenever possible, as well as that of central-scale variations in the theory prediction for the 13 TeV top-quark data. The criterion according to which a particular scale is chosen, is based on the improvements produced in the quality-of-fit description ( description) in the global analysis. We observed that the choice of the central scale improves the description of the 13 TeV lepton+jet data at CMS with 137 fb-1 of integrated luminosity. These are the most precise data included in this work and place stronger constrains on PDFs as compared to the other measurements. Future analyses and extensions of this work will include measurements from ATLAS with similar or higher integrated luminosity as well as implications due to novel PDF parametrizations.
The global analyses performed in this work have been challenged by the interpretation of the correlated systematic uncertainties published by the ATLAS and CMS collaborations. The default treatment of correlated systematic errors in the CTEQ-framework is in terms of nuisance parameters. The top-quark pair production measurements from the CMS collaborations have been recently published in terms of the covariance matrix representation. We performed conversion between the covariance matrix and nuisance parameter representation using a similar strategy to that used in the CT18 study. This allowed us to obtain identical values in both representations. However, this conversion is not unique. Detailed information on both the covariance and nuisance parameter representations for experimental errors is critical to fully exploit constraints from the data in global QCD analyses for PDF determinations, and is critical to perform a simultaneous determination of , , and the PDFs as well as their correlations in future analyses.
Acknowledgements.
We are indebted to Pavel Nadolsky for his critical reading of the manuscript, numerous discussions, and useful suggestions. We thank Otto Hindrichs and Maria Aldaya from the CMS collaboration for correspondence and discussions about the CMS differential cross section measurements at 13 TeV with 137 fb-1 of integrated luminosity. We thank Mandy Cooper-Sarkar from the ATLAS collaboration for discussions about the ATLAS lepton+jets measurements and their bin-by-bin statistical correlations. We thank Klaus Rabbertz for discussions and for suggestions on future analyses. We thank Joey Huston, and other CTEQ-TEA members for discussions. The work of AA, SD and IS are supported by the National Natural Science Foundation of China under Grant No.11965020 and Grant No. 11847160, respectively. The work of MG is supported by the National Science Foundation under Grant No. PHY2112025. The work of KX was supported by the U.S. Department of Energy under grant No. DE-SC0007914, the U.S. National Science Foundation under Grants No. PHY-2112829 and also in part by PITT PACC. The work of KX was also performed in part at the Aspen Center for Physics, which is supported by National Science Foundation grant PHY-2210452. CPY was supported by the U.S. National Science Foundation under Grant No. PHY-2013791 as well as the Wu-Ki Tung endowed chair in particle physics. This work used resources of high-performance computing clusters from SMU M2/M3, MSU HPCC, as well as Pitt CRC.Appendix A Details of the theoretical calculations
In this section, we provide more details about the calculation of the theory predictions used in this work. We point out again that global QCD analyses to determine PDFs of the proton necessitate fast, precise, and accurate theory predictions to be confronted to the experimental data in the minimization procedure to reduce the CPU turn-around time. For this reason, frameworks like fastNLO and APPLGrid for the generation of fast tables are indispensable tools.
A.1 NNLO QCD prediction benchmarks
As discussed in Sec. II.3, two independent theory calculations for the top-quark pair production differential cross section at NNLO in QCD have been used in this work. One is obtained with fast tables [174, 175] based on the STRIPPER [56, 55] subtraction method, that are produced at NNLO with fastNLO. The other one is obtained by using NNLO/NLO -factors, where fast tables for the NLO cross section in the denominator are generated with APPLgrid [173] using the MCFM [33, 178] program, while the NNLO cross section in the numerator is computed with the MATRIX program [59, 58, 60], based on the -subtraction method [176]. Currently, there are no fast tables available for MATRIX.
Comparisons between these two calculations are shown in Figs. 21 and Fig. 22, where the theory is compared to the , , , and distributions measured at CMS at 13 TeV in the dilepton channel [24], and to the , , , and distributions measured at ATLAS at 13 TeV in the all-hadronic channel [22], respectively.
For this case study, we use CT18 NNLO PDFs [126], the central scale is set to , and the top-quark mass is GeV. These are our default parameters. In general, we find agreement between the two calculations within accuracy, which is sufficient for all of the analyses in this work.
In the upper insets of each panel of Fig. 21, theory predictions obtained with fastNLO at LO, NLO, and NNLO perturbative orders for the absolute differential distributions are compared to the CMS measurements. Statistical and systematical uncertainties are shown separately using error bars with different colors. In the lower insets, we show NNLO/NLO -factors for the two calculations. We note that for the , and distributions the overall NNLO correction is about 7%, except for the where the -factor has larger variation ranging from 5% to 12%. We observe agreement between MATRIX and fastNLO at the percent level for all distributions, though they agree better in the than in distributions.
In the upper insets of each panel in Fig. 22, the theory predictions that are compared to the ATLAS measurements are obtained with MATRIX using default parameters. Statistical and systematical uncertainties are displayed as in Fig. 21. In the lower insets, we show the MATRIX NNLO/NLO -factor as well as the ratio between the AppGrid theory prediction from MCFM and MATRIX both computed at NLO. These NLO calculations agree within accuracy. In addition, we note that the leading transverse momentum and distributions are affected by large QCD perturbative corrections as their -factors produce large variations.
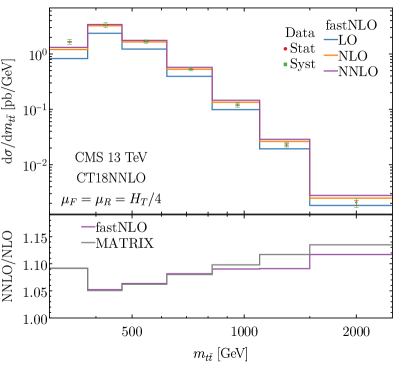
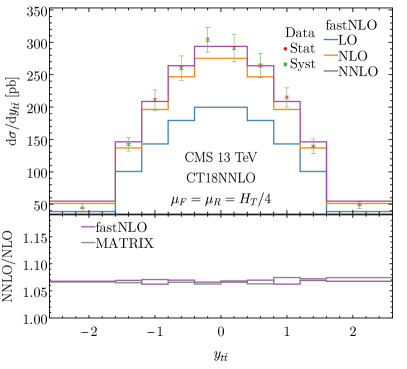
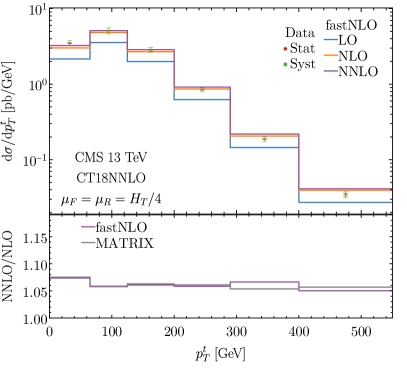
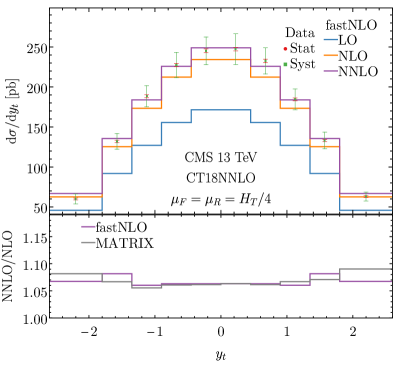
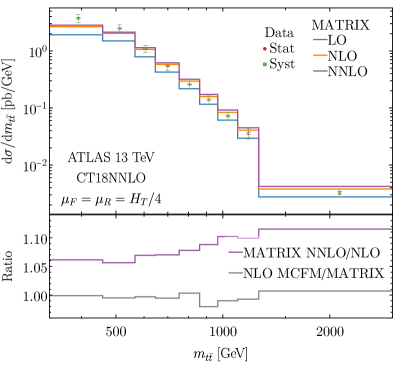
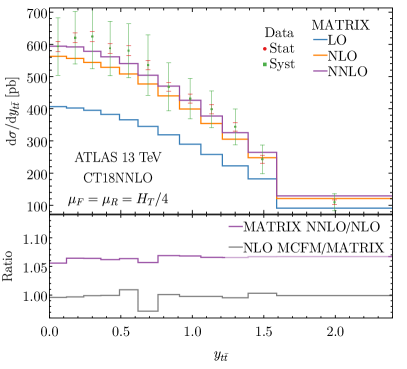
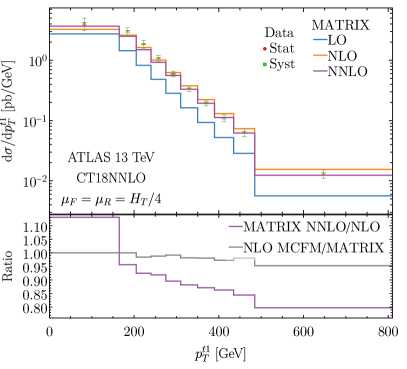
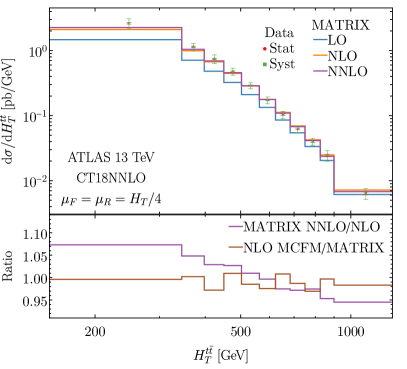
A.2 NLO electroweak corrections
We explore the impact of the electroweak (EW) corrections on the differential distributions at 13 TeV and discuss their impact in our global PDF analyses.
EW corrections are computed as -factors using the multiplicative scheme as described in Ref. [111], which are available in the repository [175]. These EW corrections include contributions of order as well as subleading ones, of order and . Meanwhile, EW corrections are also incorporated in MadGraph5_aMC@NLO [201, 109] which performs differential cross section calculations in an automated fashion, up to NLO in both couplings. Recently, MadGraph5_aMC@NLO has been interfaced with the PineAPPL library [112] to obtain fast interpolation grids which include EW corrections up to . In addition, EW corrections for top-quark pair production at hadron colliders are also included in MCFM [113].
In Fig. 23, we illustrate EW corrections from Czakon et al. [111, 175], PineAPPL [109, 112], and MCFM [113] which are defined as multiplicative -factors . The 13 TeV theory predictions for the differential distributions are calculated using the CT18NNLO PDFs, and use the same bins shared by the ATLAS distributions in the lepton+jets [21] channel and the CMS distributions in the dilepton channel [24].
While the two calculations produce almost identical shapes in the various distributions, differences within 1% or smaller are found, mainly driven by the subleading EW corrections. In addition, we observe that the rapidity distributions and appear to be more stable against EW corrections as compared to and , with most of the impact affecting bins at large rapidity.
EW corrections calculated using multiplicative EW -factors are expolored in our global PDF analyses. We essentially observe no sizable impact on either the central-value PDFs or their uncertainties. The impact of EW corrections in our PDF analyses is negligible given the current size of the experimental errors and other theoretical uncertainties affecting the calculation in the global fit.
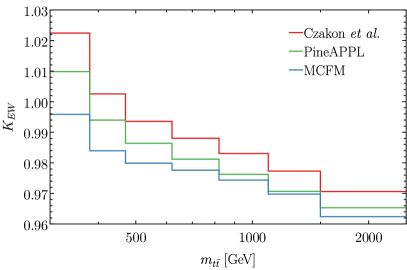
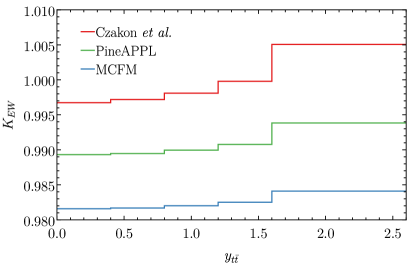
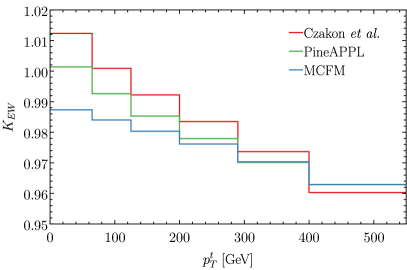
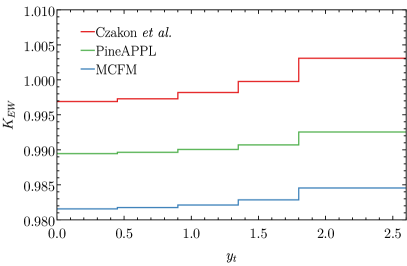
Appendix B Treatment of experimental uncertainties
In global QCD analyses, the agreement between theory and experiment can be investigated by quantifying the agreement between individual data points and shifted residuals (which will be defined later) with the corresponding nuisance parameters. Under the assumption that both these quantities are distributed according to their normal distribution, which we refer to as , this can be used to test the goodness-of-fit (see refs. [202] and references therein for more details). The experimental collaborations at the LHC often present experimental uncertainties using the covariance matrix representation (see the discussion in Sec. II.2). Therefore, to examine the normal distribution of shifted residuals a conversion to the nuisance parameters representation is required. This conversion is generally not unique, especially when the statistical and uncorrelated systematical errors are not fully specified, and when correlated systematic uncertainties and their sources are not explicitly known. In this case, a question arises about finding the optimal strategy to factor the covariance matrix and perform the conversion to nuisance parameters, and select the optimal number of correlated sources that captures most of the features of the true correlated sources of uncertainty and does not introduce artificial fluctuations in the calculation (see the discussion in ref. [203]).
In this work, when the information on the experimental uncertainties is not fully provided with the measurements used in our analysis (e.g., the CMS13ll, CMS13lj measurements), we express the covariance matrix in terms of nuisance parameters representation by using a version the decomposition, which is an iterative procedure introduced in the CT18 study [126] to obtain the nuisance parameter representation from the covariance matrix. This allows us to numerically match the in the two representations and obtain identical values.
An extended discussion of this problem, in which we consider alternative methods of performing the conversion from the covariance matrix to the nuisance parameter representation, and study the problem of finding an optimal representation for the independent experimental errors that limits artificial fluctuations in the calculation of the function, will be addressed in a separate work.
References
- [1] CDF Collaboration, F. Abe et al., “Observation of top quark production in collisions,” Phys. Rev. Lett. 74 (1995) 2626–2631, arXiv:hep-ex/9503002.
- [2] D0 Collaboration, S. Abachi et al., “Observation of the top quark,” Phys. Rev. Lett. 74 (1995) 2632–2637, arXiv:hep-ex/9503003.
- [3] Particle Data Group Collaboration, R. L. Workman et al., “Review of Particle Physics,” PTEP 2022 (2022) 083C01.
- [4] ATLAS Collaboration, G. Aad et al., “Observation of a new particle in the search for the Standard Model Higgs boson with the ATLAS detector at the LHC,” Phys. Lett. B 716 (2012) 1–29, arXiv:1207.7214 [hep-ex].
- [5] CMS Collaboration, S. Chatrchyan et al., “Observation of a New Boson at a Mass of 125 GeV with the CMS Experiment at the LHC,” Phys. Lett. B 716 (2012) 30–61, arXiv:1207.7235 [hep-ex].
- [6] S. Alekhin, A. Djouadi, and S. Moch, “The top quark and Higgs boson masses and the stability of the electroweak vacuum,” Phys. Lett. B 716 (2012) 214–219, arXiv:1207.0980 [hep-ph].
- [7] F. Bezrukov, M. Y. Kalmykov, B. A. Kniehl, and M. Shaposhnikov, “Higgs Boson Mass and New Physics,” JHEP 10 (2012) 140, arXiv:1205.2893 [hep-ph].
- [8] G. Degrassi, S. Di Vita, J. Elias-Miro, J. R. Espinosa, G. F. Giudice, G. Isidori, and A. Strumia, “Higgs mass and vacuum stability in the Standard Model at NNLO,” JHEP 08 (2012) 098, arXiv:1205.6497 [hep-ph].
- [9] J. Ellis, J. R. Espinosa, G. F. Giudice, A. Hoecker, and A. Riotto, “The Probable Fate of the Standard Model,” Phys. Lett. B 679 (2009) 369–375, arXiv:0906.0954 [hep-ph].
- [10] G. Isidori, G. Ridolfi, and A. Strumia, “On the metastability of the standard model vacuum,” Nucl. Phys. B 609 (2001) 387–409, arXiv:hep-ph/0104016.
- [11] S. R. Coleman, “The Fate of the False Vacuum. 1. Semiclassical Theory,” Phys. Rev. D 15 (1977) 2929–2936. [Erratum: Phys.Rev.D 16, 1248 (1977)].
- [12] C. G. Callan, Jr. and S. R. Coleman, “The Fate of the False Vacuum. 2. First Quantum Corrections,” Phys. Rev. D 16 (1977) 1762–1768.
- [13] R. Frederix and F. Maltoni, “Top pair invariant mass distribution: A Window on new physics,” JHEP 01 (2009) 047, arXiv:0712.2355 [hep-ph].
- [14] I. Brivio, S. Bruggisser, F. Maltoni, R. Moutafis, T. Plehn, E. Vryonidou, S. Westhoff, and C. Zhang, “O new physics, where art thou? A global search in the top sector,” JHEP 02 (2020) 131, arXiv:1910.03606 [hep-ph].
- [15] ATLAS Collaboration, G. Aad et al., “Measurements of top quark pair relative differential cross-sections with ATLAS in collisions at TeV,” Eur. Phys. J. C 73 no. 1, (2013) 2261, arXiv:1207.5644 [hep-ex].
- [16] ATLAS Collaboration, G. Aad et al., “Measurements of normalized differential cross sections for production in pp collisions at TeV using the ATLAS detector,” Phys. Rev. D 90 no. 7, (2014) 072004, arXiv:1407.0371 [hep-ex].
- [17] ATLAS Collaboration, G. Aad et al., “Measurements of top-quark pair differential cross-sections in the lepton+jets channel in collisions at TeV using the ATLAS detector,” Eur. Phys. J. C 76 no. 10, (2016) 538, arXiv:1511.04716 [hep-ex].
- [18] CMS Collaboration, S. Chatrchyan et al., “Measurement of Differential Top-Quark Pair Production Cross Sections in collisions at TeV,” Eur. Phys. J. C 73 no. 3, (2013) 2339, arXiv:1211.2220 [hep-ex].
- [19] CMS Collaboration, S. Chatrchyan et al., “Measurement of the production cross section in the dilepton channel in pp collisions at = 8 TeV,” JHEP 02 (2014) 024, arXiv:1312.7582 [hep-ex]. [Erratum: JHEP 02, 102 (2014)].
- [20] CMS Collaboration, A. M. Sirunyan et al., “Measurement of double-differential cross sections for top quark pair production in pp collisions at TeV and impact on parton distribution functions,” Eur. Phys. J. C 77 no. 7, (2017) 459, arXiv:1703.01630 [hep-ex].
- [21] ATLAS Collaboration, G. Aad et al., “Measurements of top-quark pair differential and double-differential cross-sections in the +jets channel with collisions at TeV using the ATLAS detector,” Eur. Phys. J. C 79 no. 12, (2019) 1028, arXiv:1908.07305 [hep-ex]. [Erratum: Eur.Phys.J.C 80, 1092 (2020)].
- [22] ATLAS Collaboration, G. Aad et al., “Measurements of top-quark pair single- and double-differential cross-sections in the all-hadronic channel in collisions at using the ATLAS detector,” JHEP 01 (2021) 033, arXiv:2006.09274 [hep-ex].
- [23] ATLAS Collaboration, G. Aad et al., “Inclusive and differential cross-sections for dilepton production measured in TeV collisions with the ATLAS detector,” arXiv:2303.15340 [hep-ex].
- [24] CMS Collaboration, A. M. Sirunyan et al., “Measurements of differential cross sections in proton-proton collisions at 13 TeV using events containing two leptons,” JHEP 02 (2019) 149, arXiv:1811.06625 [hep-ex].
- [25] CMS Collaboration, A. M. Sirunyan et al., “Measurement of differential cross sections for the production of top quark pairs and of additional jets in lepton+jets events from pp collisions at 13 TeV,” Phys. Rev. D 97 no. 11, (2018) 112003, arXiv:1803.08856 [hep-ex].
- [26] CMS Collaboration, A. Tumasyan et al., “Measurement of differential production cross sections in the full kinematic range using lepton+jets events from proton-proton collisions at = 13 TeV,” Phys. Rev. D 104 no. 9, (2021) 092013, arXiv:2108.02803 [hep-ex].
- [27] P. Nason, S. Dawson, and R. K. Ellis, “The Total Cross-Section for the Production of Heavy Quarks in Hadronic Collisions,” Nucl. Phys. B 303 (1988) 607–633.
- [28] P. Nason, S. Dawson, and R. K. Ellis, “The One Particle Inclusive Differential Cross-Section for Heavy Quark Production in Hadronic Collisions,” Nucl. Phys. B 327 (1989) 49–92. [Erratum: Nucl.Phys.B 335, 260–260 (1990)].
- [29] W. Beenakker, H. Kuijf, W. L. van Neerven, and J. Smith, “QCD Corrections to Heavy Quark Production in p anti-p Collisions,” Phys. Rev. D 40 (1989) 54–82.
- [30] R. Meng, G. A. Schuler, J. Smith, and W. L. van Neerven, “Simple Formulae for the Order QCD Corrections to the Reaction X,” Nucl. Phys. B 339 (1990) 325–354.
- [31] W. Beenakker, W. L. van Neerven, R. Meng, G. A. Schuler, and J. Smith, “QCD corrections to heavy quark production in hadron hadron collisions,” Nucl. Phys. B 351 (1991) 507–560.
- [32] M. L. Mangano, P. Nason, and G. Ridolfi, “Heavy quark correlations in hadron collisions at next-to-leading order,” Nucl. Phys. B 373 (1992) 295–345.
- [33] J. M. Campbell, R. K. Ellis, and W. T. Giele, “A Multi-Threaded Version of MCFM,” Eur. Phys. J. C 75 no. 6, (2015) 246, arXiv:1503.06182 [physics.comp-ph].
- [34] S. Frixione, P. Nason, and B. R. Webber, “Matching NLO QCD and parton showers in heavy flavor production,” JHEP 08 (2003) 007, arXiv:hep-ph/0305252.
- [35] S. Frixione, P. Nason, and G. Ridolfi, “A Positive-weight next-to-leading-order Monte Carlo for heavy flavour hadroproduction,” JHEP 09 (2007) 126, arXiv:0707.3088 [hep-ph].
- [36] J. Alwall, P. Demin, S. de Visscher, R. Frederix, M. Herquet, F. Maltoni, T. Plehn, D. L. Rainwater, and T. Stelzer, “MadGraph/MadEvent v4: The New Web Generation,” JHEP 09 (2007) 028, arXiv:0706.2334 [hep-ph].
- [37] R. Frederix, S. Frixione, F. Maltoni, and T. Stelzer, “Automation of next-to-leading order computations in QCD: The FKS subtraction,” JHEP 10 (2009) 003, arXiv:0908.4272 [hep-ph].
- [38] A. G. Grozin, “Heavy quark effective theory,” Springer Tracts Mod. Phys. 201 (2004) 1–213.
- [39] M. Czakon, A. Mitov, and S. Moch, “Heavy-quark production in gluon fusion at two loops in QCD,” Nucl. Phys. B 798 (2008) 210–250, arXiv:0707.4139 [hep-ph].
- [40] M. Czakon, A. Mitov, and S. Moch, “Heavy-quark production in massless quark scattering at two loops in QCD,” Phys. Lett. B 651 (2007) 147–159, arXiv:0705.1975 [hep-ph].
- [41] A. Mitov and S. Moch, “The Singular behavior of massive QCD amplitudes,” JHEP 05 (2007) 001, arXiv:hep-ph/0612149.
- [42] A. Ferroglia, M. Neubert, B. D. Pecjak, and L. L. Yang, “Two-loop divergences of scattering amplitudes with massive partons,” Phys. Rev. Lett. 103 (2009) 201601, arXiv:0907.4791 [hep-ph].
- [43] A. Ferroglia, M. Neubert, B. D. Pecjak, and L. L. Yang, “Two-loop divergences of massive scattering amplitudes in non-abelian gauge theories,” JHEP 11 (2009) 062, arXiv:0908.3676 [hep-ph].
- [44] N. Kidonakis, “Two-loop soft anomalous dimensions and NNLL resummation for heavy quark production,” Phys. Rev. Lett. 102 (2009) 232003, arXiv:0903.2561 [hep-ph].
- [45] I. Bierenbaum, M. Czakon, and A. Mitov, “The singular behavior of one-loop massive QCD amplitudes with one external soft gluon,” Nucl. Phys. B 856 (2012) 228–246, arXiv:1107.4384 [hep-ph].
- [46] P. Bärnreuther, M. Czakon, and P. Fiedler, “Virtual amplitudes and threshold behaviour of hadronic top-quark pair-production cross sections,” JHEP 02 (2014) 078, arXiv:1312.6279 [hep-ph].
- [47] A. G. Grozin, R. N. Lee, and A. F. Pikelner, “Four-loop QCD cusp anomalous dimension at small angle,” JHEP 11 (2022) 094, arXiv:2208.09277 [hep-ph].
- [48] N. Kidonakis, “Four-loop massive cusp anomalous dimension in QCD: A calculation from asymptotics,” Phys. Rev. D 107 no. 5, (2023) 054006, arXiv:2301.05972 [hep-ph].
- [49] M. Czakon, P. Fiedler, and A. Mitov, “Total Top-Quark Pair-Production Cross Section at Hadron Colliders Through ,” Phys. Rev. Lett. 110 (2013) 252004, arXiv:1303.6254 [hep-ph].
- [50] M. Czakon and A. Mitov, “NNLO corrections to top pair production at hadron colliders: the quark-gluon reaction,” JHEP 01 (2013) 080, arXiv:1210.6832 [hep-ph].
- [51] M. Czakon and A. Mitov, “NNLO corrections to top-pair production at hadron colliders: the all-fermionic scattering channels,” JHEP 12 (2012) 054, arXiv:1207.0236 [hep-ph].
- [52] P. Bärnreuther, M. Czakon, and A. Mitov, “Percent Level Precision Physics at the Tevatron: First Genuine NNLO QCD Corrections to ,” Phys. Rev. Lett. 109 (2012) 132001, arXiv:1204.5201 [hep-ph].
- [53] M. Czakon, D. Heymes, and A. Mitov, “High-precision differential predictions for top-quark pairs at the LHC,” Phys. Rev. Lett. 116 no. 8, (2016) 082003, arXiv:1511.00549 [hep-ph].
- [54] M. Czakon, P. Fiedler, D. Heymes, and A. Mitov, “NNLO QCD predictions for fully-differential top-quark pair production at the Tevatron,” JHEP 05 (2016) 034, arXiv:1601.05375 [hep-ph].
- [55] M. Czakon, “A novel subtraction scheme for double-real radiation at NNLO,” Phys. Lett. B 693 (2010) 259–268, arXiv:1005.0274 [hep-ph].
- [56] M. Czakon, “Double-real radiation in hadronic top quark pair production as a proof of a certain concept,” Nucl. Phys. B 849 (2011) 250–295, arXiv:1101.0642 [hep-ph].
- [57] M. Czakon and D. Heymes, “Four-dimensional formulation of the sector-improved residue subtraction scheme,” Nucl. Phys. B 890 (2014) 152–227, arXiv:1408.2500 [hep-ph].
- [58] S. Catani, S. Devoto, M. Grazzini, S. Kallweit, J. Mazzitelli, and H. Sargsyan, “Top-quark pair hadroproduction at next-to-next-to-leading order in QCD,” Phys. Rev. D 99 no. 5, (2019) 051501, arXiv:1901.04005 [hep-ph].
- [59] S. Catani, S. Devoto, M. Grazzini, S. Kallweit, and J. Mazzitelli, “Top-quark pair production at the LHC: Fully differential QCD predictions at NNLO,” JHEP 07 (2019) 100, arXiv:1906.06535 [hep-ph].
- [60] S. Catani, S. Devoto, M. Grazzini, S. Kallweit, and J. Mazzitelli, “Top-quark pair hadroproduction at NNLO: differential predictions with the mass,” JHEP 08 no. 08, (2020) 027, arXiv:2005.00557 [hep-ph].
- [61] M. Grazzini, S. Kallweit, and M. Wiesemann, “Fully differential NNLO computations with MATRIX,” Eur. Phys. J. C 78 no. 7, (2018) 537, arXiv:1711.06631 [hep-ph].
- [62] A. Behring, M. Czakon, A. Mitov, A. S. Papanastasiou, and R. Poncelet, “Higher order corrections to spin correlations in top quark pair production at the LHC,” Phys. Rev. Lett. 123 no. 8, (2019) 082001, arXiv:1901.05407 [hep-ph].
- [63] M. Czakon, A. Mitov, and R. Poncelet, “NNLO QCD corrections to leptonic observables in top-quark pair production and decay,” JHEP 05 (2021) 212, arXiv:2008.11133 [hep-ph].
- [64] G. F. Sterman, “Summation of Large Corrections to Short Distance Hadronic Cross-Sections,” Nucl. Phys. B 281 (1987) 310–364.
- [65] S. Catani and L. Trentadue, “Resummation of the QCD Perturbative Series for Hard Processes,” Nucl. Phys. B 327 (1989) 323–352.
- [66] N. Kidonakis and G. F. Sterman, “Resummation for QCD hard scattering,” Nucl. Phys. B 505 (1997) 321–348, arXiv:hep-ph/9705234.
- [67] E. Laenen, G. Oderda, and G. F. Sterman, “Resummation of threshold corrections for single particle inclusive cross-sections,” Phys. Lett. B 438 (1998) 173–183, arXiv:hep-ph/9806467.
- [68] R. Bonciani, S. Catani, M. L. Mangano, and P. Nason, “NLL resummation of the heavy quark hadroproduction cross-section,” Nucl. Phys. B 529 (1998) 424–450, arXiv:hep-ph/9801375. [Erratum: Nucl.Phys.B 803, 234 (2008)].
- [69] M. Czakon, A. Mitov, and G. F. Sterman, “Threshold Resummation for Top-Pair Hadroproduction to Next-to-Next-to-Leading Log,” Phys. Rev. D 80 (2009) 074017, arXiv:0907.1790 [hep-ph].
- [70] M. Aliev, H. Lacker, U. Langenfeld, S. Moch, P. Uwer, and M. Wiedermann, “HATHOR: HAdronic Top and Heavy quarks crOss section calculatoR,” Comput. Phys. Commun. 182 (2011) 1034–1046, arXiv:1007.1327 [hep-ph].
- [71] M. Cacciari, M. Czakon, M. Mangano, A. Mitov, and P. Nason, “Top-pair production at hadron colliders with next-to-next-to-leading logarithmic soft-gluon resummation,” Phys. Lett. B 710 (2012) 612–622, arXiv:1111.5869 [hep-ph].
- [72] M. Czakon and A. Mitov, “Top++: A Program for the Calculation of the Top-Pair Cross-Section at Hadron Colliders,” Comput. Phys. Commun. 185 (2014) 2930, arXiv:1112.5675 [hep-ph].
- [73] N. Kidonakis, “High order corrections and subleading logarithms for top quark production,” Phys. Rev. D 64 (2001) 014009, arXiv:hep-ph/0010002.
- [74] N. Kidonakis, E. Laenen, S. Moch, and R. Vogt, “Sudakov resummation and finite order expansions of heavy quark hadroproduction cross-sections,” Phys. Rev. D 64 (2001) 114001, arXiv:hep-ph/0105041.
- [75] N. Kidonakis and R. Vogt, “Next-to-next-to-leading order soft gluon corrections in top quark hadroproduction,” Phys. Rev. D 68 (2003) 114014, arXiv:hep-ph/0308222.
- [76] N. Kidonakis and R. Vogt, “The Theoretical top quark cross section at the Tevatron and the LHC,” Phys. Rev. D 78 (2008) 074005, arXiv:0805.3844 [hep-ph].
- [77] N. Kidonakis, “Next-to-next-to-leading soft-gluon corrections for the top quark cross section and transverse momentum distribution,” Phys. Rev. D 82 (2010) 114030, arXiv:1009.4935 [hep-ph].
- [78] N. Kidonakis, “NNNLO soft-gluon corrections for the top-quark and rapidity distributions,” Phys. Rev. D 91 no. 3, (2015) 031501, arXiv:1411.2633 [hep-ph].
- [79] N. Kidonakis, “NNNLO soft-gluon corrections for the top-antitop pair production cross section,” Phys. Rev. D 90 no. 1, (2014) 014006, arXiv:1405.7046 [hep-ph].
- [80] N. Kidonakis, “Top-quark double-differential distributions at approximate N3LO,” Phys. Rev. D 101 no. 7, (2020) 074006, arXiv:1912.10362 [hep-ph].
- [81] N. Kidonakis, M. Guzzi, and A. Tonero, “Top-quark cross sections and distributions at aN3LO,” arXiv:2306.06166 [hep-ph].
- [82] M. Neubert, “Heavy quark symmetry,” Phys. Rept. 245 (1994) 259–396, arXiv:hep-ph/9306320.
- [83] C. W. Bauer, S. Fleming, D. Pirjol, and I. W. Stewart, “An Effective field theory for collinear and soft gluons: Heavy to light decays,” Phys. Rev. D 63 (2001) 114020, arXiv:hep-ph/0011336.
- [84] C. W. Bauer, D. Pirjol, and I. W. Stewart, “Soft collinear factorization in effective field theory,” Phys. Rev. D 65 (2002) 054022, arXiv:hep-ph/0109045.
- [85] M. Beneke, A. P. Chapovsky, M. Diehl, and T. Feldmann, “Soft collinear effective theory and heavy to light currents beyond leading power,” Nucl. Phys. B 643 (2002) 431–476, arXiv:hep-ph/0206152.
- [86] V. Ahrens, A. Ferroglia, M. Neubert, B. D. Pecjak, and L. L. Yang, “Threshold expansion at order alpha(s)**4 for the t t-bar invariant mass distribution at hadron colliders,” Phys. Lett. B 687 (2010) 331–337, arXiv:0912.3375 [hep-ph].
- [87] V. Ahrens, A. Ferroglia, M. Neubert, B. D. Pecjak, and L. L. Yang, “Renormalization-Group Improved Predictions for Top-Quark Pair Production at Hadron Colliders,” JHEP 09 (2010) 097, arXiv:1003.5827 [hep-ph].
- [88] V. Ahrens, A. Ferroglia, M. Neubert, B. D. Pecjak, and L.-L. Yang, “RG-improved single-particle inclusive cross sections and forward-backward asymmetry in production at hadron colliders,” JHEP 09 (2011) 070, arXiv:1103.0550 [hep-ph].
- [89] V. Ahrens, A. Ferroglia, M. Neubert, B. D. Pecjak, and L. L. Yang, “Precision predictions for the t+t(bar) production cross section at hadron colliders,” Phys. Lett. B 703 (2011) 135–141, arXiv:1105.5824 [hep-ph].
- [90] M. Beneke, P. Falgari, S. Klein, and C. Schwinn, “Hadronic top-quark pair production with NNLL threshold resummation,” Nucl. Phys. B 855 (2012) 695–741, arXiv:1109.1536 [hep-ph].
- [91] M. Beneke, P. Falgari, S. Klein, J. Piclum, C. Schwinn, M. Ubiali, and F. Yan, “Inclusive Top-Pair Production Phenomenology with TOPIXS,” JHEP 07 (2012) 194, arXiv:1206.2454 [hep-ph].
- [92] A. Ferroglia, B. D. Pecjak, L. L. Yang, B. D. Pecjak, and L. L. Yang, “The NNLO soft function for the pair invariant mass distribution of boosted top quarks,” JHEP 10 (2012) 180, arXiv:1207.4798 [hep-ph].
- [93] A. Ferroglia, B. D. Pecjak, and L. L. Yang, “Soft-gluon resummation for boosted top-quark production at hadron colliders,” Phys. Rev. D 86 (2012) 034010, arXiv:1205.3662 [hep-ph].
- [94] A. Ferroglia, S. Marzani, B. D. Pecjak, and L. L. Yang, “Boosted top production: factorization and resummation for single-particle inclusive distributions,” JHEP 01 (2014) 028, arXiv:1310.3836 [hep-ph].
- [95] W. Beenakker, A. Denner, W. Hollik, R. Mertig, T. Sack, and D. Wackeroth, “Electroweak one loop contributions to top pair production in hadron colliders,” Nucl. Phys. B 411 (1994) 343–380.
- [96] J. H. Kuhn, A. Scharf, and P. Uwer, “Electroweak corrections to top-quark pair production in quark-antiquark annihilation,” Eur. Phys. J. C 45 (2006) 139–150, arXiv:hep-ph/0508092.
- [97] W. Bernreuther, M. Fücker, and Z. G. Si, “Mixed QCD and weak corrections to top quark pair production at hadron colliders,” Phys. Lett. B 633 (2006) 54–60, arXiv:hep-ph/0508091. [Erratum: Phys.Lett.B 644, 386–386 (2007)].
- [98] J. H. Kuhn, A. Scharf, and P. Uwer, “Electroweak effects in top-quark pair production at hadron colliders,” Eur. Phys. J. C 51 (2007) 37–53, arXiv:hep-ph/0610335.
- [99] W. Bernreuther, M. Fuecker, and Z.-G. Si, “Weak interaction corrections to hadronic top quark pair production,” Phys. Rev. D 74 (2006) 113005, arXiv:hep-ph/0610334.
- [100] W. Bernreuther, M. Fucker, and Z.-G. Si, “Weak interaction corrections to hadronic top quark pair production: Contributions from quark-gluon and b anti-b induced reactions,” Phys. Rev. D 78 (2008) 017503, arXiv:0804.1237 [hep-ph].
- [101] A. V. Manohar and M. Trott, “Electroweak Sudakov Corrections and the Top Quark Forward-Backward Asymmetry,” Phys. Lett. B 711 (2012) 313–316, arXiv:1201.3926 [hep-ph].
- [102] J. H. Kühn, A. Scharf, and P. Uwer, “Weak Interactions in Top-Quark Pair Production at Hadron Colliders: An Update,” Phys. Rev. D 91 no. 1, (2015) 014020, arXiv:1305.5773 [hep-ph].
- [103] J. M. Campbell, D. Wackeroth, and J. Zhou, “Electroweak Corrections at the LHC with MCFM,” PoS DIS2015 (2015) 130, arXiv:1508.06247 [hep-ph].
- [104] W. Hollik and M. Kollar, “NLO QED contributions to top-pair production at hadron collider,” Phys. Rev. D 77 (2008) 014008, arXiv:0708.1697 [hep-ph].
- [105] W. Bernreuther and Z.-G. Si, “Distributions and correlations for top quark pair production and decay at the Tevatron and LHC.,” Nucl. Phys. B 837 (2010) 90–121, arXiv:1003.3926 [hep-ph].
- [106] W. Hollik and D. Pagani, “The electroweak contribution to the top quark forward-backward asymmetry at the Tevatron,” Phys. Rev. D 84 (2011) 093003, arXiv:1107.2606 [hep-ph].
- [107] J. H. Kuhn and G. Rodrigo, “Charge asymmetries of top quarks at hadron colliders revisited,” JHEP 01 (2012) 063, arXiv:1109.6830 [hep-ph].
- [108] W. Bernreuther and Z.-G. Si, “Top quark and leptonic charge asymmetries for the Tevatron and LHC,” Phys. Rev. D 86 (2012) 034026, arXiv:1205.6580 [hep-ph].
- [109] D. Pagani, I. Tsinikos, and M. Zaro, “The impact of the photon PDF and electroweak corrections on distributions,” Eur. Phys. J. C 76 no. 9, (2016) 479, arXiv:1606.01915 [hep-ph].
- [110] A. Denner and M. Pellen, “NLO electroweak corrections to off-shell top-antitop production with leptonic decays at the LHC,” JHEP 08 (2016) 155, arXiv:1607.05571 [hep-ph].
- [111] M. Czakon, D. Heymes, A. Mitov, D. Pagani, I. Tsinikos, and M. Zaro, “Top-pair production at the LHC through NNLO QCD and NLO EW,” JHEP 10 (2017) 186, arXiv:1705.04105 [hep-ph].
- [112] S. Carrazza, E. R. Nocera, C. Schwan, and M. Zaro, “PineAPPL: combining EW and QCD corrections for fast evaluation of LHC processes,” JHEP 12 (2020) 108, arXiv:2008.12789 [hep-ph].
- [113] J. M. Campbell, D. Wackeroth, and J. Zhou, “Study of weak corrections to Drell-Yan, top-quark pair, and dijet production at high energies with MCFM,” Phys. Rev. D 94 no. 9, (2016) 093009, arXiv:1608.03356 [hep-ph].
- [114] S. Catani, M. Grazzini, and H. Sargsyan, “Transverse-momentum resummation for top-quark pair production at the LHC,” JHEP 11 (2018) 061, arXiv:1806.01601 [hep-ph].
- [115] R. Angeles-Martinez, M. Czakon, and S. Sapeta, “NNLO soft function for top quark pair production at small transverse momentum,” JHEP 10 (2018) 201, arXiv:1809.01459 [hep-ph].
- [116] R. Bonciani, S. Catani, M. Grazzini, H. Sargsyan, and A. Torre, “The subtraction method for top quark production at hadron colliders,” Eur. Phys. J. C 75 no. 12, (2015) 581, arXiv:1508.03585 [hep-ph].
- [117] S. Catani, M. Grazzini, and A. Torre, “Transverse-momentum resummation for heavy-quark hadroproduction,” Nucl. Phys. B 890 (2014) 518–538, arXiv:1408.4564 [hep-ph].
- [118] H. T. Li, C. S. Li, D. Y. Shao, L. L. Yang, and H. X. Zhu, “Top quark pair production at small transverse momentum in hadronic collisions,” Phys. Rev. D 88 (2013) 074004, arXiv:1307.2464 [hep-ph].
- [119] H. X. Zhu, C. S. Li, H. T. Li, D. Y. Shao, and L. L. Yang, “Transverse-momentum resummation for top-quark pairs at hadron colliders,” Phys. Rev. Lett. 110 no. 8, (2013) 082001, arXiv:1208.5774 [hep-ph].
- [120] J. Mazzitelli, P. F. Monni, P. Nason, E. Re, M. Wiesemann, and G. Zanderighi, “Next-to-Next-to-Leading Order Event Generation for Top-Quark Pair Production,” Phys. Rev. Lett. 127 no. 6, (2021) 062001, arXiv:2012.14267 [hep-ph].
- [121] J. Mazzitelli, P. F. Monni, P. Nason, E. Re, M. Wiesemann, and G. Zanderighi, “Top-pair production at the LHC with MINNLOPS,” JHEP 04 (2022) 079, arXiv:2112.12135 [hep-ph].
- [122] P. Nason, “A New method for combining NLO QCD with shower Monte Carlo algorithms,” JHEP 11 (2004) 040, arXiv:hep-ph/0409146.
- [123] S. Frixione, P. Nason, and C. Oleari, “Matching NLO QCD computations with Parton Shower simulations: the POWHEG method,” JHEP 11 (2007) 070, arXiv:0709.2092 [hep-ph].
- [124] S. Alioli, P. Nason, C. Oleari, and E. Re, “A general framework for implementing NLO calculations in shower Monte Carlo programs: the POWHEG BOX,” JHEP 06 (2010) 043, arXiv:1002.2581 [hep-ph].
- [125] S. Alekhin, J. Blümlein, S. Moch, and R. Placakyte, “Parton distribution functions, , and heavy-quark masses for LHC Run II,” Phys. Rev. D 96 no. 1, (2017) 014011, arXiv:1701.05838 [hep-ph].
- [126] T.-J. Hou et al., “New CTEQ global analysis of quantum chromodynamics with high-precision data from the LHC,” Phys. Rev. D 103 no. 1, (2021) 014013, arXiv:1912.10053 [hep-ph].
- [127] S. Bailey, T. Cridge, L. A. Harland-Lang, A. D. Martin, and R. S. Thorne, “Parton distributions from LHC, HERA, Tevatron and fixed target data: MSHT20 PDFs,” Eur. Phys. J. C 81 no. 4, (2021) 341, arXiv:2012.04684 [hep-ph].
- [128] J. McGowan, T. Cridge, L. A. Harland-Lang, and R. S. Thorne, “Approximate N3LO parton distribution functions with theoretical uncertainties: MSHT20aN3LO PDFs,” Eur. Phys. J. C 83 no. 3, (2023) 185, arXiv:2207.04739 [hep-ph]. [Erratum: Eur.Phys.J.C 83, 302 (2023)].
- [129] NNPDF Collaboration, R. D. Ball et al., “Parton distributions from high-precision collider data,” Eur. Phys. J. C 77 no. 10, (2017) 663, arXiv:1706.00428 [hep-ph].
- [130] NNPDF Collaboration, R. D. Ball et al., “The path to proton structure at 1% accuracy,” Eur. Phys. J. C 82 no. 5, (2022) 428, arXiv:2109.02653 [hep-ph].
- [131] A. M. Cooper-Sarkar, M. Czakon, M. A. Lim, A. Mitov, and A. S. Papanastasiou, “Simultaneous extraction of and from LHC differential distributions,” arXiv:2010.04171 [hep-ph].
- [132] T. Cridge, L. A. Harland-Lang, A. D. Martin, and R. S. Thorne, “An investigation of the and heavy quark mass dependence in the MSHT20 global PDF analysis,” Eur. Phys. J. C 81 no. 8, (2021) 744, arXiv:2106.10289 [hep-ph].
- [133] R. Gauld, “Feasibility of top quark measurements at LHCb and constraints on the large- gluon PDF,” JHEP 02 (2014) 126, arXiv:1311.1810 [hep-ph].
- [134] M. Czakon, M. L. Mangano, A. Mitov, and J. Rojo, “Constraints on the gluon PDF from top quark pair production at hadron colliders,” JHEP 07 (2013) 167, arXiv:1303.7215 [hep-ph].
- [135] M. Guzzi, K. Lipka, and S.-O. Moch, “Top-quark pair production at hadron colliders: differential cross section and phenomenological applications with DiffTop,” JHEP 01 (2015) 082, arXiv:1406.0386 [hep-ph].
- [136] M. Czakon, N. P. Hartland, A. Mitov, E. R. Nocera, and J. Rojo, “Pinning down the large-x gluon with NNLO top-quark pair differential distributions,” JHEP 04 (2017) 044, arXiv:1611.08609 [hep-ph].
- [137] M. Czakon, S. Dulat, T.-J. Hou, J. Huston, A. Mitov, A. S. Papanastasiou, I. Sitiwaldi, Z. Yu, and C. P. Yuan, “A study of the impact of double-differential top distributions from CMS on parton distribution functions,” arXiv:1912.08801 [hep-ph].
- [138] S. Bailey and L. Harland-Lang, “Differential Top Quark Pair Production at the LHC: Challenges for PDF Fits,” Eur. Phys. J. C80 no. 1, (2020) 60, arXiv:1909.10541 [hep-ph].
- [139] M. Kadir, A. Ablat, S. Dulat, T.-J. Hou, and I. Sitiwaldi, “The impact of ATLAS and CMS single differential top-quark pair measurements at = 8 TeV on CTEQ-TEA PDFs,” Chin. Phys. C 45 no. 2, (2021) 023111, arXiv:2003.13740 [hep-ph].
- [140] C. Schmidt, J. Pumplin, C. P. Yuan, and P. Yuan, “Updating and optimizing error parton distribution function sets in the Hessian approach,” Phys. Rev. D98 no. 9, (2018) 094005, arXiv:1806.07950 [hep-ph].
- [141] T.-J. Hou, Z. Yu, S. Dulat, C. Schmidt, and C. P. Yuan, “Updating and optimizing error parton distribution function sets in the Hessian approach. II.,” Phys. Rev. D 100 no. 11, (2019) 114024, arXiv:1907.12177 [hep-ph].
- [142] E. R. Nocera, M. Ubiali, and C. Voisey, “Single Top Production in PDF fits,” JHEP 05 (2020) 067, arXiv:1912.09543 [hep-ph].
- [143] ATLAS Collaboration, M. Aaboud et al., “Measurement of top quark pair differential cross-sections in the dilepton channel in collisions at = 7 and 8 TeV with ATLAS,” Phys. Rev. D 94 no. 9, (2016) 092003, arXiv:1607.07281 [hep-ex]. [Addendum: Phys.Rev.D 101, 119901 (2020)].
- [144] CMS Collaboration, V. Khachatryan et al., “Measurement of the differential cross section for top quark pair production in pp collisions at ,” Eur. Phys. J. C 75 no. 11, (2015) 542, arXiv:1505.04480 [hep-ex].
- [145] ATLAS Collaboration, G. Aad et al., “Measurement of the top pair production cross section in 8 TeV proton-proton collisions using kinematic information in the lepton+jets final state with ATLAS,” Phys. Rev. D 91 no. 11, (2015) 112013, arXiv:1504.04251 [hep-ex].
- [146] CMS Collaboration, V. Khachatryan et al., “Measurement of the Production Cross Section in Collisions at TeV in Dilepton Final States Containing One Lepton,” Phys. Lett. B 739 (2014) 23–43, arXiv:1407.6643 [hep-ex].
- [147] CMS Collaboration, V. Khachatryan et al., “Measurement of the production cross section in the all-jets final state in pp collisions at TeV,” Eur. Phys. J. C 76 no. 3, (2016) 128, arXiv:1509.06076 [hep-ex].
- [148] ATLAS Collaboration, G. Aad et al., “Measurement of the production cross-section using events with b-tagged jets in pp collisions at = 7 and 8 with the ATLAS detector,” Eur. Phys. J. C 74 no. 10, (2014) 3109, arXiv:1406.5375 [hep-ex]. [Addendum: Eur.Phys.J.C 76, 642 (2016)].
- [149] CMS Collaboration, V. Khachatryan et al., “Measurement of the top quark mass using proton-proton data at = 7 and 8 TeV,” Phys. Rev. D 93 no. 7, (2016) 072004, arXiv:1509.04044 [hep-ex].
- [150] CMS Collaboration, A. M. Sirunyan et al., “Measurement of the inclusive cross section in pp collisions at TeV using final states with at least one charged lepton,” JHEP 03 (2018) 115, arXiv:1711.03143 [hep-ex].
- [151] ATLAS Collaboration, G. Aad et al., “Measurement of the production cross-section in the lepton+jets channel at TeV with the ATLAS experiment,” Phys. Lett. B 810 (2020) 135797, arXiv:2006.13076 [hep-ex].
- [152] CMS Collaboration, V. Khachatryan et al., “Measurement of the top quark pair production cross section in proton-proton collisions at 13 TeV,” Phys. Rev. Lett. 116 no. 5, (2016) 052002, arXiv:1510.05302 [hep-ex].
- [153] CMS Collaboration, “First measurement of the top quark pair production cross section in proton-proton collisions at ,” CMS-PAS-TOP-16-015 (2016) .
- [154] ATLAS Collaboration, G. Aad et al., “Simultaneous measurements of the , , and production cross-sections in collisions at TeV with the ATLAS detector,” Phys. Rev. D 91 no. 5, (2015) 052005, arXiv:1407.0573 [hep-ex].
- [155] ATLAS Collaboration, “Measurement of the top quark pair production cross-section with ATLAS in collisions at TeV in the single-lepton channel using semileptonic decays,” ATLAS-CONF-2012-131 (2012) .
- [156] ATLAS Collaboration, G. Aad et al., “Measurements of the top quark branching ratios into channels with leptons and quarks with the ATLAS detector,” Phys. Rev. D 92 no. 7, (2015) 072005, arXiv:1506.05074 [hep-ex].
- [157] ATLAS Collaboration, G. Aad et al., “Measurement of the ttbar production cross section in the tau+jets channel using the ATLAS detector,” Eur. Phys. J. C 73 no. 3, (2013) 2328, arXiv:1211.7205 [hep-ex].
- [158] ATLAS Collaboration, “Measurement of the production cross section in the all-hadronic channel in ATLAS with TeV data,” ATLAS-CONF-2012-031 (2012) .
- [159] CMS Collaboration, V. Khachatryan et al., “Measurement of the t-tbar production cross section in the e-mu channel in proton-proton collisions at sqrt(s) = 7 and 8 TeV,” JHEP 08 (2016) 029, arXiv:1603.02303 [hep-ex].
- [160] CMS Collaboration, V. Khachatryan et al., “Measurements of the production cross section in lepton+jets final states in pp collisions at 8 TeV and ratio of 8 to 7 TeV cross sections,” Eur. Phys. J. C 77 no. 1, (2017) 15, arXiv:1602.09024 [hep-ex].
- [161] CMS Collaboration, S. Chatrchyan et al., “Measurement of the top quark pair production cross section in collisions at TeV in dilepton final states containing a ,” Phys. Rev. D 85 (2012) 112007, arXiv:1203.6810 [hep-ex].
- [162] CMS Collaboration, S. Chatrchyan et al., “Measurement of the Production Cross Section in the +Jets Channel in Collisions at TeV,” Eur. Phys. J. C 73 no. 4, (2013) 2386, arXiv:1301.5755 [hep-ex].
- [163] CMS Collaboration, S. Chatrchyan et al., “Measurement of the Production Cross Section in the All-Jet Final State in pp Collisions at = 7 TeV,” JHEP 05 (2013) 065, arXiv:1302.0508 [hep-ex].
- [164] ATLAS Collaboration, M. Aaboud et al., “Measurement of the production cross-section using events with b-tagged jets in pp collisions at =13 TeV with the ATLAS detector,” Phys. Lett. B 761 (2016) 136–157, arXiv:1606.02699 [hep-ex]. [Erratum: Phys.Lett.B 772, 879–879 (2017)].
- [165] CMS Collaboration, “Measurement of the inclusive and differential tt production cross sections in lepton + jets final states at 13 TeV,” CMS-PAS-TOP-15-005 (2015) .
- [166] CMS Collaboration, V. Khachatryan et al., “Measurement of the production cross section using events in the e final state in pp collisions at 13 TeV,” Eur. Phys. J. C 77 (2017) 172, arXiv:1611.04040 [hep-ex].
- [167] CMS Collaboration, “Measurement of the production cross section at 13 TeV in the all-jets final state,” CMS-PAS-TOP-16-013 (2016) .
- [168] A. Mitov and G. Sterman, “Final state interactions in single- and multi-particle inclusive cross sections for hadronic collisions,” Phys. Rev. D 86 (2012) 114038, arXiv:1209.5798 [hep-ph].
- [169] T. Kluge, K. Rabbertz, and M. Wobisch, “FastNLO: Fast pQCD calculations for PDF fits,” in 14th International Workshop on Deep Inelastic Scattering, pp. 483–486. 9, 2006. arXiv:hep-ph/0609285.
- [170] fastNLO Collaboration, M. Wobisch, D. Britzger, T. Kluge, K. Rabbertz, and F. Stober, “Theory-Data Comparisons for Jet Measurements in Hadron-Induced Processes,” arXiv:1109.1310 [hep-ph].
- [171] fastNLO Collaboration, D. Britzger, K. Rabbertz, F. Stober, and M. Wobisch, “New features in version 2 of the fastNLO project,” in 20th International Workshop on Deep-Inelastic Scattering and Related Subjects, pp. 217–221. 2012. arXiv:1208.3641 [hep-ph].
- [172] D. Britzger, G. S. Klaus Rabbertz, F. Stober, and M. Wobisch, “Recent Developments of the fastNLO Toolkit,” PoS DIS2015 (2015) 055.
- [173] T. Carli, D. Clements, A. Cooper-Sarkar, C. Gwenlan, G. P. Salam, F. Siegert, P. Starovoitov, and M. Sutton, “A posteriori inclusion of parton density functions in NLO QCD final-state calculations at hadron colliders: The APPLGRID Project,” Eur. Phys. J. C 66 (2010) 503–524, arXiv:0911.2985 [hep-ph].
- [174] M. Czakon, D. Heymes, and A. Mitov, “fastNLO tables for NNLO top-quark pair differential distributions,” arXiv:1704.08551 [hep-ph].
- [175] “Repository with fastNNLO tables.” https://www.precision.hep.phy.cam.ac.uk/results/ttbar-fastnlo/.
- [176] S. Catani and M. Grazzini, “An NNLO subtraction formalism in hadron collisions and its application to Higgs boson production at the LHC,” Phys. Rev. Lett. 98 (2007) 222002, arXiv:hep-ph/0703012.
- [177] “Repository with MATRIX code.” https://matrix.hepforge.org/.
- [178] J. M. Campbell and R. K. Ellis, “Top-Quark Processes at NLO in Production and Decay,” J. Phys. G 42 no. 1, (2015) 015005, arXiv:1204.1513 [hep-ph].
- [179] H. Paukkunen and P. Zurita, “PDF reweighting in the Hessian matrix approach,” JHEP 12 (2014) 100, arXiv:1402.6623 [hep-ph].
- [180] W. T. Giele and S. Keller, “Implications of hadron collider observables on parton distribution function uncertainties,” Phys. Rev. D58 (1998) 094023, arXiv:hep-ph/9803393 [hep-ph].
- [181] R. D. Ball, V. Bertone, F. Cerutti, L. Del Debbio, S. Forte, A. Guffanti, N. P. Hartland, J. I. Latorre, J. Rojo, and M. Ubiali, “Reweighting and Unweighting of Parton Distributions and the LHC W lepton asymmetry data,” Nucl. Phys. B855 (2012) 608–638, arXiv:1108.1758 [hep-ph].
- [182] NNPDF Collaboration, R. D. Ball, V. Bertone, F. Cerutti, L. Del Debbio, S. Forte, A. Guffanti, J. I. Latorre, J. Rojo, and M. Ubiali, “Reweighting NNPDFs: the W lepton asymmetry,” Nucl. Phys. B849 (2011) 112–143, arXiv:1012.0836 [hep-ph]. [Erratum: Nucl. Phys.B854,926(2012); Erratum: Nucl. Phys.B855,927(2012)].
- [183] B.-T. Wang, T. J. Hobbs, S. Doyle, J. Gao, T.-J. Hou, P. M. Nadolsky, and F. I. Olness, “Mapping the sensitivity of hadronic experiments to nucleon structure,” Phys. Rev. D 98 no. 9, (2018) 094030, arXiv:1803.02777 [hep-ph].
- [184] C. Willis, R. Brock, D. Hayden, T.-J. Hou, J. Isaacson, C. Schmidt, and C.-P. Yuan, “New method for reducing parton distribution function uncertainties in the high-mass Drell-Yan spectrum,” Phys. Rev. D99 no. 5, (2019) 054004, arXiv:1809.09481 [hep-ex].
- [185] N. Yalkun and S. Dulat, “QCD analysis of CMS W + charm measurements at LHC with TeV and implications for the strange PDF,” Chin. Phys. C43 no. 12, (2019) 123101, arXiv:1908.00026 [hep-ph].
- [186] A. Ablat, S. Dulat, R. Rashidin, A. Ruzi, and N. Yalkun, “The Impact of Single Top Data on CT14nnlo PDFs,” Int. J. Theor. Phys. 59 no. 10, (2020) 3023–3031.
- [187] P. M. Nadolsky, H.-L. Lai, Q.-H. Cao, J. Huston, J. Pumplin, D. Stump, W.-K. Tung, and C. P. Yuan, “Implications of CTEQ global analysis for collider observables,” Phys. Rev. D 78 (2008) 013004, arXiv:0802.0007 [hep-ph].
- [188] “HEPData repository for ATLAS lep+jet 13 TeV, Eur. Phys. J. C 79, 12, (2019).” https://www.hepdata.net/record/ins1750330.
- [189] “HEPforge repository for ePump.” https://epump.hepforge.org/.
- [190] G. D’Agostini, “On the use of the covariance matrix to fit correlated data,” Nucl. Instrum. Meth. A 346 (1994) 306–311.
- [191] G. D’Agostini, “Bayesian reasoning in high-energy physics: Principles and applications,”.
- [192] M. Czakon, D. Heymes, and A. Mitov, “Dynamical scales for multi-TeV top-pair production at the LHC,” JHEP 04 (2017) 071, arXiv:1606.03350 [hep-ph].
- [193] LHCb Collaboration, R. Aaij et al., “Measurement of forward production at TeV,” JHEP 05 (2015) 109, arXiv:1503.00963 [hep-ex].
- [194] LHCb Collaboration, R. Aaij et al., “Measurement of forward W and Z boson production in collisions at TeV,” JHEP 01 (2016) 155, arXiv:1511.08039 [hep-ex].
- [195] CMS Collaboration, V. Khachatryan et al., “Measurement and QCD analysis of double-differential inclusive jet cross sections in pp collisions at TeV and cross section ratios to 2.76 and 7 TeV,” JHEP 03 (2017) 156, arXiv:1609.05331 [hep-ex].
- [196] X. Jing et al., “Quantifying the interplay of experimental constraints in analyses of parton distributions,” arXiv:2306.03918 [hep-ph].
- [197] CCFR/NuTeV Collaboration, U.-K. Yang et al., “Measurements of and from CCFR Fe and Fe data in a physics model independent way,” Phys. Rev. Lett. 86 (2001) 2742–2745, arXiv:hep-ex/0009041.
- [198] D0 Collaboration, V. M. Abazov et al., “Measurement of the electron charge asymmetry in decays in collisions at TeV,” Phys. Rev. D 91 no. 3, (2015) 032007, arXiv:1412.2862 [hep-ex]. [Erratum: Phys.Rev.D 91, 079901 (2015)].
- [199] BCDMS Collaboration, A. C. Benvenuti et al., “A High Statistics Measurement of the Proton Structure Functions F(2) (x, Q**2) and R from Deep Inelastic Muon Scattering at High Q**2,” Phys. Lett. B 223 (1989) 485–489.
- [200] BCDMS Collaboration, A. C. Benvenuti et al., “A High Statistics Measurement of the Deuteron Structure Functions F2 (X, ) and R From Deep Inelastic Muon Scattering at High ,” Phys. Lett. B 237 (1990) 592–598.
- [201] J. Alwall, R. Frederix, S. Frixione, V. Hirschi, F. Maltoni, O. Mattelaer, H. S. Shao, T. Stelzer, P. Torrielli, and M. Zaro, “The automated computation of tree-level and next-to-leading order differential cross sections, and their matching to parton shower simulations,” JHEP 07 (2014) 079, arXiv:1405.0301 [hep-ph].
- [202] K. Kovařík, P. M. Nadolsky, and D. E. Soper, “Hadronic structure in high-energy collisions,” Rev. Mod. Phys. 92 no. 4, (2020) 045003, arXiv:1905.06957 [hep-ph].
- [203] Z. Kassabov, E. R. Nocera, and M. Wilson, “Regularising experimental correlations in LHC data: theory and application to a global analysis of parton distributions,” Eur. Phys. J. C 82 no. 10, (2022) 956, arXiv:2207.00690 [hep-ph].