Anticipating Driving Behavior through Deep Learning-Based Policy Prediction
Abstract
In this project, we implemented an end-to-end system that takes in combined visual features of video frames from a normal camera and depth information from a cloud points scanner, and predicts driving policies (vehicle speed and steering angle). We verified the safety of our system by comparing the predicted results with standard behaviors by real-world experienced drivers. Our test results show that the predictions can be considered as accurate in at lease half of the testing cases (50% 80%, depending on the model), and using combined features improved the performance in most cases than using video frames only.
Introduction
Driving policy learning is one of the core topics in the research of autonomous driving. Researchers have successfully applied machine learning to the topic, and specifically, neural networks and computer vision techniques have been proved to be a promising solution to this task. There are mainly two categories of methods towards such this problem:
-
•
End-to-end systems, which learn and predict the driving behaviors based on current visual input and previous vehicle states, i.e., mapping pixels from a video steam directly to a series of driving policies, including speed, steering, throttle and brake actions, etc. Various previous work have demonstrated that neural networks can learn effectively in simple to moderate scenarios.
-
•
Non end-to-end systems, which usually involve further processing of the visual input, such as segmentation(Babahajiani et al. 2017), object detection, or detecting a set of predefined affordance measurements, such as distance to surrounding cars (Chen et al. 2015; Li et al. 2023), and such outputs are then feed into a rule-based system. By nature these intermediate outputs are much more human interpretable, but it can be hard to define a complete set of such affordance measurements, and we still need a lot of manual effort to associate these measurements with real-world scenarios.
Safety is with no doubt the most important thing in autonomous driving technologies, and we need mechanisms to measure whether the self-driving system is safe to use or not. One solution is to verify the resemblance of driving behaviors between AI-prediction and human drivers (The assumption is experienced human drivers make reasonable decision and drive safely). So if there is a higher similarity between the predictions produced by self-driving systems and behaviors collected from human drivers, we consider the models intelligent and learning, and self-driving policies accurate.
Related Work
It has been understood that research and applications on autonomous driving behavior learning should leverage image and video cameras as well as laser scanners in order to comprehensively learn traffic and driving behavior. Deep learning techniques like neural networks are best positioned to address this problem because of the complexity of traffic.
Pomerleau et al. (Pomerleau 1989; Liu et al. 2020b; Li et al. 2023) were the first researchers to use neural networks for lane following and obstacles avoiding. Since then, two primary methods for this task have been developed for solving this task (Xu et al. 2017; Liu, Tan, and Tensmeyer 2023). These researchers also proposed a driving perplexity metric which is inspired by representative Markov model in linguistics.
In 2017, researchers at the Conference on Computer Vision and Pattern Recognition Workshops (Kim and Park 2017; Liu et al. 2020a, 2023) showed that autonomous vehicles can learn driving policies in simple scenarios like highways. NVIDIA group used an end-to-end system, specifically a multi-layer convolution neural network, that maps directly from images for autonomous driving. Later, other researchers completed the same task for more complex driving scenarios.
However, these approaches only learn from large-scale videos because there were not sufficient precise laser-scanner data benchmarks. Chen et al. (Chen et al. ; Liu, Yacoob, and Shrivastava 2023) were the first to propose a Driving Behavior Net (DBNet), which provides large-scale high-quality point clouds scanned by a Velodyne laser, videos recorded by a dashboard camera and standard drivers’ behaviors. These researchers confirmed that additional depth information improves networks’ abilities to determine driving policies. Nonetheless, it still has a large room to improve the usage of point cloud information.
Method
Generally speaking, we proposed an end-to-end deep learning network to predict the driving behaviors (Figure 2). In order to extract high-quality image features, we employ pre-trained models ResNet152 and Inception-v4. Different from (Chen et al. ), which simply used the concatenation operation to fuse the features before final prediction, we plan to leverage the more state-of-art techniques to thoroughly combine these features and discover the underlying connections in the future. What’s more, as predicting the continuous values is much harder than the classification task, we will also try to find the extra guide mechanism to better predict the steering angles and vehicle speeds.
Targets
As we known, the aim of our task is policy decision making in the field of automatic driving so as to improve the safety level just as a professional driver. In details, policy decision making process can be grouped into classification task with the decisions including turning right, turning left, going straight and stopping. It seems correct in the games but in the real-world driving, it’s obviously not enough and too coarse to make sure the safe driving. In this case, continuous prediction is needed instead of discrete action prediction. As a result, vehicles are more likely to successfully drive by learning the regression task with angles and speed. That means the the inputs of the model are images from the digital video and cloud points from LiDAR. The outputs are according speeds and angles.
Preliminary Components
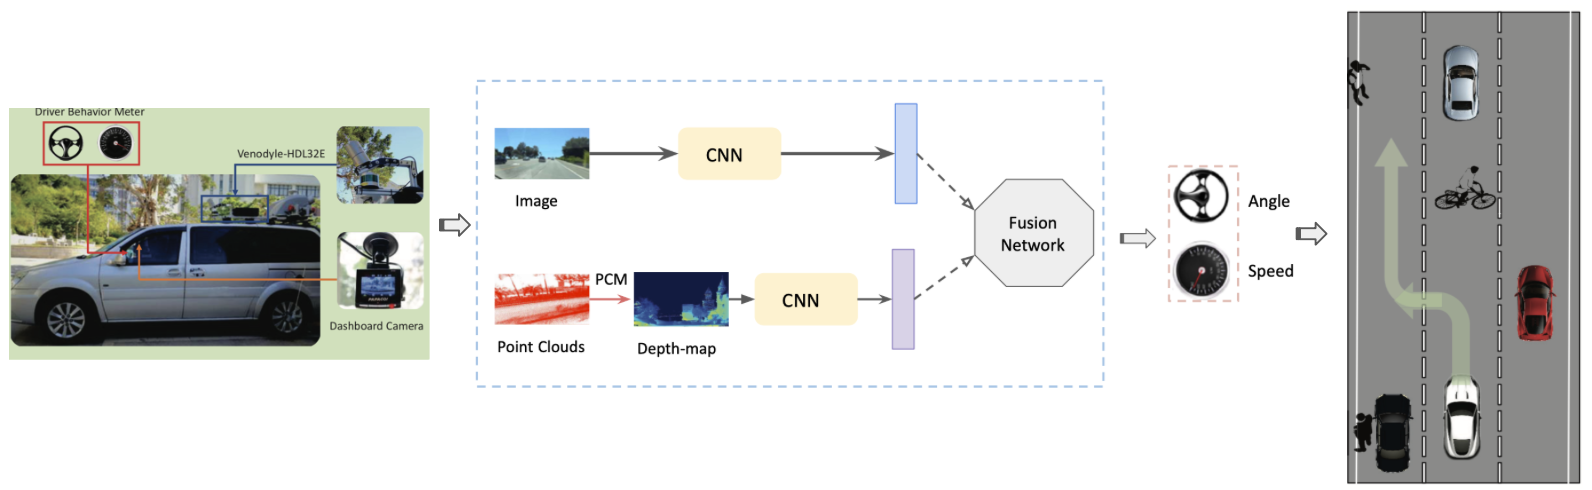
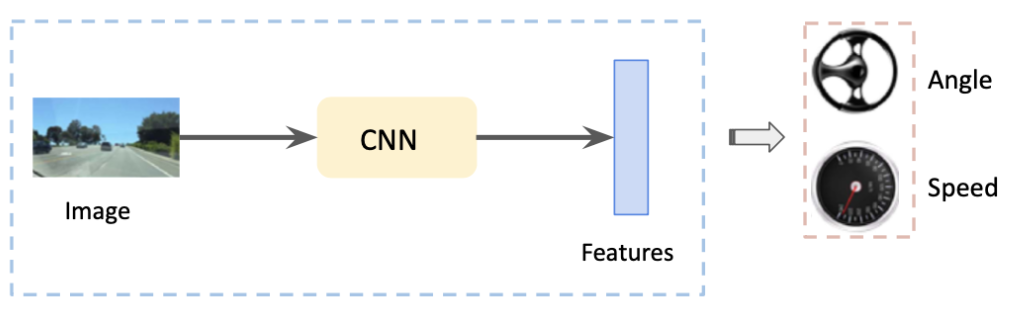
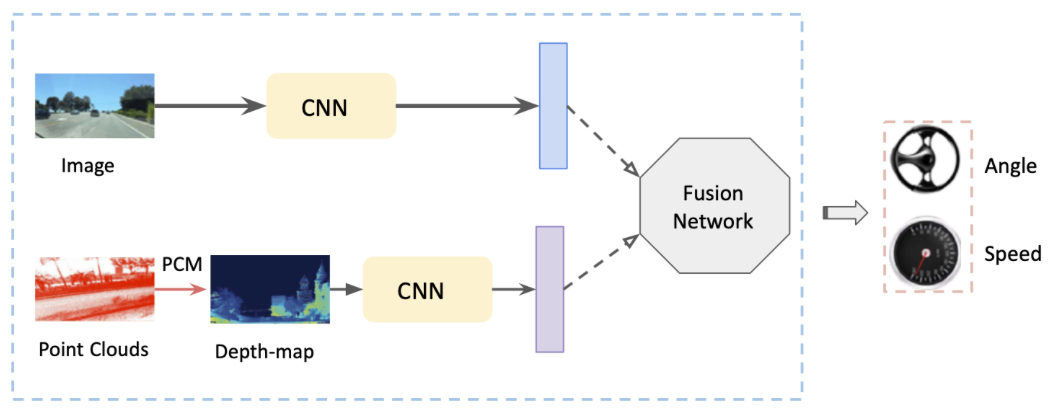
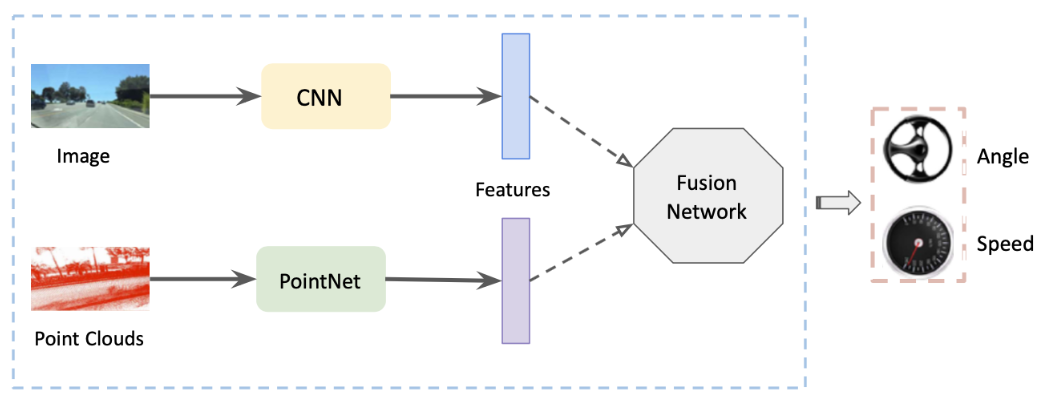
As illustrated in Figure 1, Figure 2 and Figure 3, inspired by many previous work (Chen et al. 2018; Agelastos et al. 2014), we designed a series of models to predict the speed and angles. We have three versions of models in total, Image Only (IO), meaning that we only use image input, image plus Point Cloud Mapping (PCM) and image plus PointNet (Qi et al. 2017). The two latter models are both equipped with two inputs instead of one while the only difference is the ways they leveraged to process the cloud points.
In order to predict the speeds and angles, we are supposed to introduce the basic tools we use to extract the image features and depth features from the cloud components. As described in Figure 1, the first model we employ is CNN, where we adapt ResNet152 (He et al. 2016), Inception-v4 (Li et al. 2017). Both of the two models are state-of-art models in the field of computer vision, achieving perfect performance on the ImageNet (Pennington, Socher, and Manning 2014) dataset. The model parameters here we used are pretrained ones from the ImageNet. Apart from this two, we also used NVIDIA architecture (Kim and Park 2017), which is also the advanced model but much smaller than the previous two models. The CNN models are adapted in all the three versions of models.
Another component is Points Clouds Mapping (PCM) targets at processing the cloud points data. Specifically, it’s able to nicely preserve the geometry information in the cloud points. By using PCM, we will get the Depth-map with colors containing the key features from the original data. After this, another convolution neural network is needed to extract the visual features. Instead of the two steps, we also tries another simple advanced network PointNet (Qi et al. 2017), which directly takes disorder points as the input of neural networks and finally output the representation features. The overall architecture of our model are shown in Figure 2 and Figure 3. What’s more, the the comparison experiments will be shown in the experiment section.
Models
Generally speaking, we ran three models in total. The first one (Figure 1) is image only model, which follows the DNN end-to-end framework. This framework receives one (or a mini-batch) frame input including images and predicts driving behavior. The RGB image feature extractor we used is Inception-v4, ResNet152 and NVIDIA.
The Second model (Figure 2) absorbs images features from digital video and cloud points from LiDAR and then produce exact driving behaviors including speeds and angles. The RGB image feature extractor we used is Inception-v4, ResNet152 and NVIDIA. The Point Clouds feature extractor we used is Point Cloud Mapping(PCM). Then we will use another CNN to extract features. After getting the image features and cloud points features, a fusion network will be used to combine the two features. As for the second model in Figure 3, the only improvement is that we used a more efficient framework called PointNet to directly extract features from the cloud points.
We came up with several different ways to combine the features. The first one is the concentration operation, meaning we used a fully connected hidden layer to mix the the image and cloud points features and then predict the speeds and angles, which are trained with the loss functions together. This method is simple while the drawback is also obvious. So in order to make the model more complex, LSTM or attention mechanism could be employed. LSTM is able to leverage the time information to better predict the value and attention mechanism can learn the correlation between the two features and how to combine them more efficiently.
Dataset
We adapted the LiVi-Set from DBNet (Chen et al. 2018) as our training and testing dataset. It is a large-scale, high-quality dataset containing point clouds scanned by a Velodyne laser, driving videos recorded by a dashboard camera, and standard driving behaviors (vehicle speed and steering angle) collected from drivers with more than 10 years of driving experience using real-time sensors. All sensors are manually calibrated and data is synchronised.
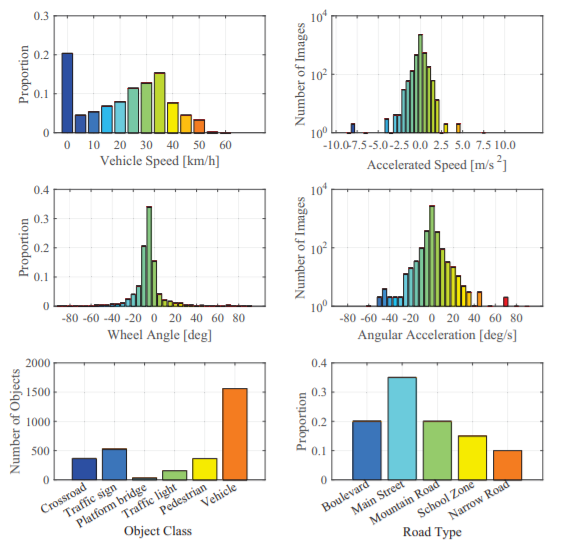
Features LiVi-Set is the first dataset to combine 2D and 3D features and use depth information to make driving behavior predictions and is very different from other vision-based autonomous driving benchmarks. In addition, it covers a variety of driving scenarios such as traffic conditions (local route, boulevard, primary road, mountain road, school areas, etc), traffic volume (light, normal and heavy) and the number of pedestrians captured by the camera. Figure 7 describes the diversity in details.
Preprocessing. The driving videos are first down-sampled to 1 fps and then later reshaped to fit pre-trained neural networks (Nvidia takes 66200, ResNet and DenseNet takes 224224, and Inception takes 299299). The point clouds are also down-sampled to 16384x3 to fit in PointNet. However the feature maps are still generated from the original point clouds to keep as much features as possible. Furthermore, we only used 10% of the original dataset to speed up training and testing.
Experiments
This section contains two parts: tasks of our research and evaluation methods we will leverage to analyse the performance our model.
Generally speaking, our task can be divided into two sections, discrete prediction(classification task) and continuous prediction(regression task). As for the discrete prediction task, we aim to predict the current probability distribution over actions categories. To be more clear, the driving actions may include straight, stop, turn right, turn left and back. After this, we can decide whether it has safe issues. However, simply considering this policy making problem as a classification task is not suitable for the real driving since the actions are very limited, which will be dangerous for the drivers. We will design experiments to demonstrate its drawbacks. On the other hand, we will also employ multiple perception information including video frames and point clouds to predict steering angles and vehicle speeds.
In order to evaluate the performance of driving behavior prediction by our model, we will use two metrics: perplexity metric and accuracy metric. Perplexity metric, proposed by (Xu et al. 2017), is the exponent of the sum of entropy in sequential prediction events. The prediction is more accurate if the perplexity metric is smaller than one meanwhile is larger than zero. Obviously, this metric is more suitable to represent the loss. As a result, we use accuracy metric, which uses a tolerance threshold to decide whether the case is correct. In detail, if the bias between the predictions and ground truth is smaller than the threshold, we will say the driving behavior is smooth and safe.
Performance Evaluation
We train models by using CentOS Linux 7 Server with one RTX 2080Ti Graphic Card. We use Python 2.7.1 and Tensorflow-gpu 1.11 as our software package tool. Each model was trained for 125 epochs and the we use the Root-Mean-Square Deviation (RMSD) = as our loss function.
We select the best checkpoint if the difference between ground truth of angle value and predicted value of angles is less than ,and if the difference between ground truth of speed value and predicted value of speed is less than 0.25. The figure 8 shows the a checkpoint is saved as the best one.
We set range of threshold to see the how accuracy of angle/speed grows with the increases og the threshold. Note that a higher threshold means that the difference between ground truth and predicted data is larger.
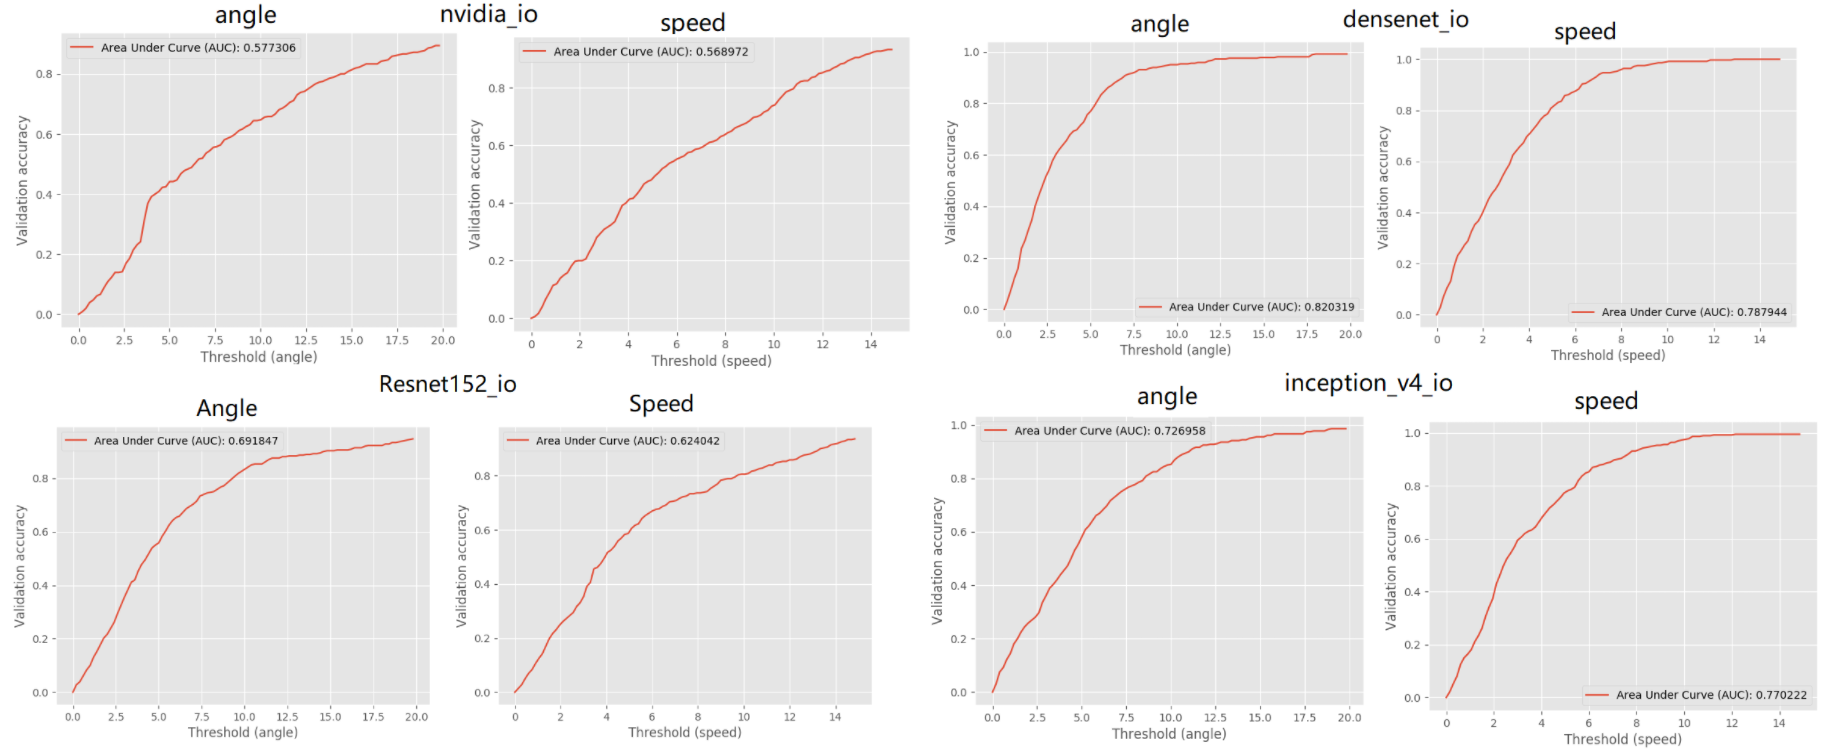
Figure 5 shows the performance or accuracy of our IO models for Nvidia, Densenet, Resnet and inceptionV4 network. It can be known from the plot, for the IO model, Densenet converges much faster than other networks. The angle accuracy and speed accuracy increase to around 90% then threashold is set to 12.5 and 6 separately.
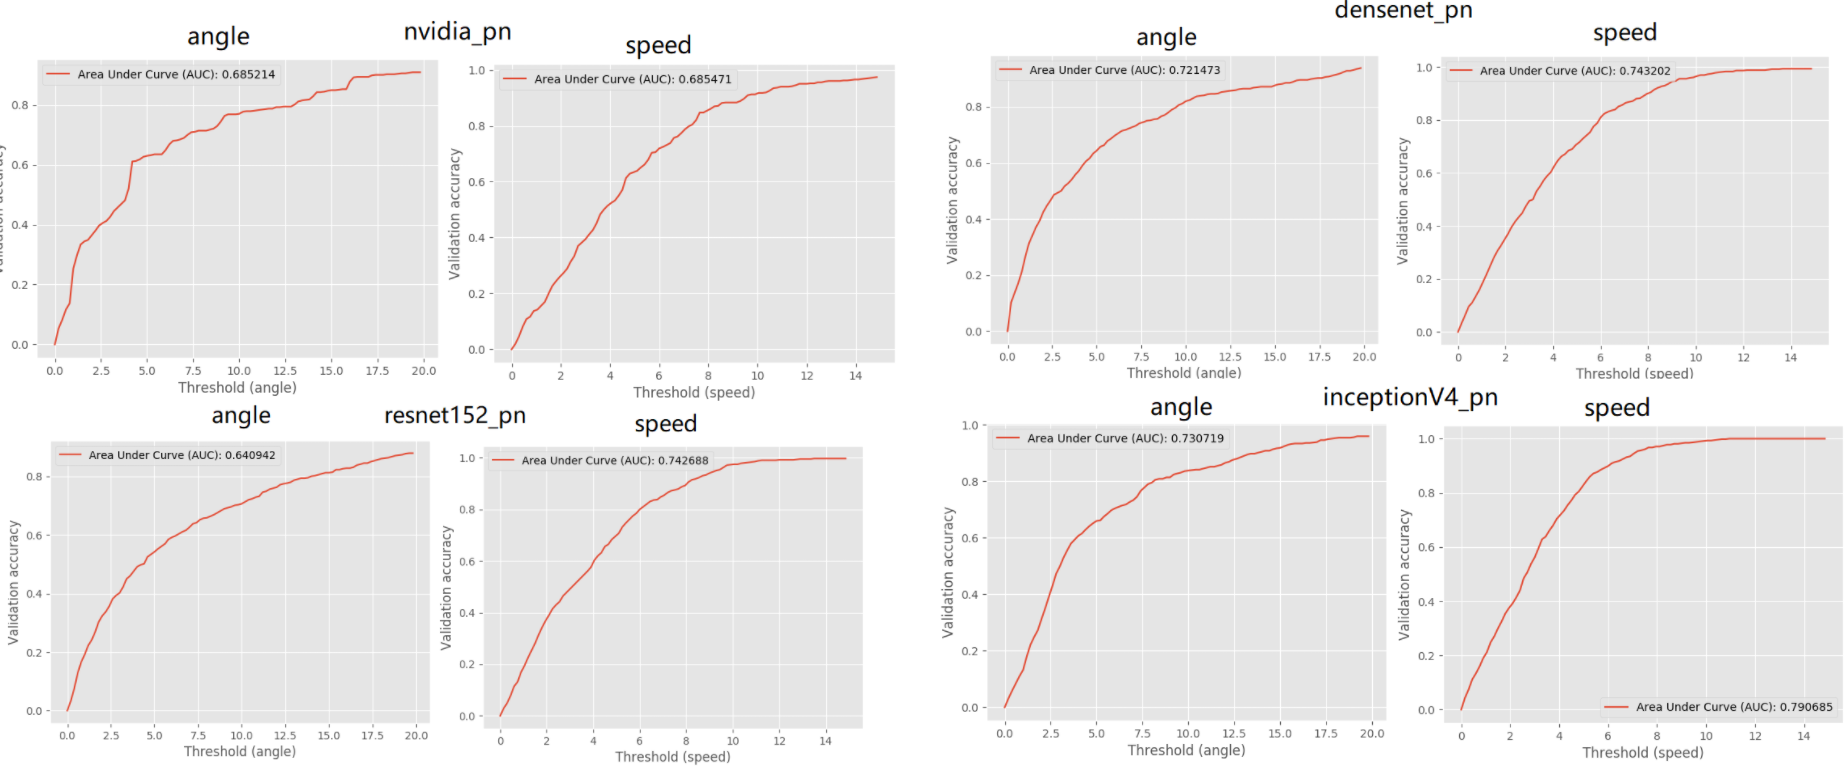
Figure 6 shows the performance or accuracy of our PN models for Nvidia, Densenet, Resnet and inceptionV4 network. It can be known from the plot, for the PN model, InceptionV4 converges much faster than other networks. Both angle accuracy and speed accuracy increase to around 90% then threashold is set to around 7-8.
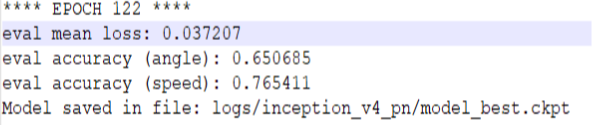
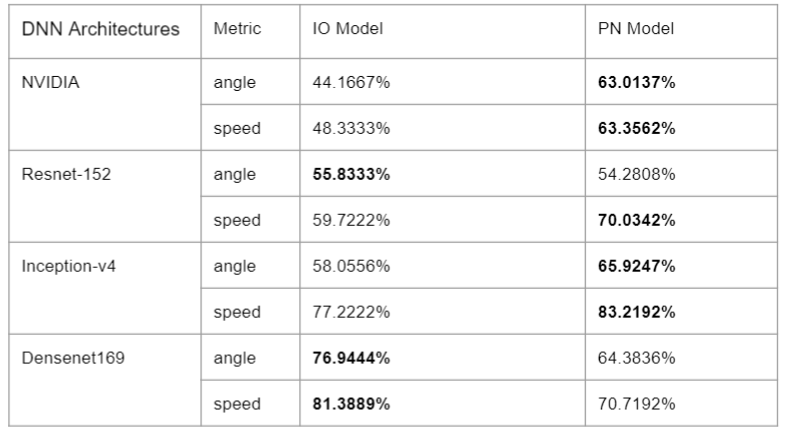
Figure 9 shows the angle/speed accuracy of each IO Model and PN Model when threshold is set to 5. The accuracy of PN Models are better than IO Model in the most cases. The PN model with inception-V4 has the highest angle accuracy (65.9247%) and highest speed accuracy(83.2192%). For densenet-169, the angle accuracy(76.9444%) and speed accuracy (81.3889%) of IO Model is much higher than PN model.
Conclusion and Future Work
In conclusion, our project implemented an end-to-end system and used the dataset that contains images and point cloud data to train IO and PM model. PM Model has higher accuracy than the IO Model. The angle/speed prediction is important in the real world as it can evaluating if a self-driving is safe or not. If the self-driving system provide the similar speed/angle result with the ground truth(i.e. data collected from the experienced drivers), we believe the system is safe to use. Due to the time limitation, we did not implement the PM model as well as LSTM. So in the future, we plan to finished them and automate the training and evaluating process.
References
- Agelastos et al. (2014) Agelastos, A.; Allan, B.; Brandt, J.; Cassella, P.; Enos, J.; Fullop, J.; Gentile, A.; Monk, S.; Naksinehaboon, N.; Ogden, J.; et al. 2014. The lightweight distributed metric service: a scalable infrastructure for continuous monitoring of large scale computing systems and applications. In SC’14: Proceedings of the International Conference for High Performance Computing, Networking, Storage and Analysis, 154–165. IEEE.
- Babahajiani et al. (2017) Babahajiani, P.; Fan, L.; Kämäräinen, J.; and Gabbouj, M. 2017. Urban 3D segmentation and modelling from street view images and LiDAR point clouds. Machine Vision and Applications 28: 679–694.
- Chen et al. (2015) Chen, C.; Seff, A.; Kornhauser, A.; and Xiao, J. 2015. Deepdriving: Learning affordance for direct perception in autonomous driving. In Proceedings of the IEEE international conference on computer vision, 2722–2730.
- Chen et al. (2018) Chen, Y.; Wang, J.; Li, J.; Lu, C.; Luo, Z.; HanXue; and Wang, C. 2018. LiDAR-Video Driving Dataset: Learning Driving Policies Effectively. In The IEEE Conference on Computer Vision and Pattern Recognition (CVPR).
- (5) Chen, Y.; Wang, J.; Li, J.; Lu, C.; Luo, Z.; Xue, H.; and Wang, C. ???? DBNet: A Large-Scale Dataset for Driving Behavior Learning .
- He et al. (2016) He, K.; Zhang, X.; Ren, S.; and Sun, J. 2016. Deep residual learning for image recognition. In Proceedings of the IEEE conference on computer vision and pattern recognition, 770–778.
- Kim and Park (2017) Kim, J.; and Park, C. 2017. End-to-end ego lane estimation based on sequential transfer learning for self-driving cars. In Proceedings of the IEEE Conference on Computer Vision and Pattern Recognition Workshops, 30–38.
- Li et al. (2017) Li, L.; Tang, S.; Deng, L.; Zhang, Y.; and Tian, Q. 2017. Image caption with global-local attention. In Thirty-First AAAI Conference on Artificial Intelligence.
- Li et al. (2023) Li, Z.; Xu, P.; Liu, F.; and Song, H. 2023. Towards Understanding In-Context Learning with Contrastive Demonstrations and Saliency Maps. arXiv preprint arXiv:2307.05052 .
- Liu et al. (2023) Liu, F.; Lin, K.; Li, L.; Wang, J.; Yacoob, Y.; and Wang, L. 2023. Aligning Large Multi-Modal Model with Robust Instruction Tuning. arXiv preprint arXiv:2306.14565 .
- Liu, Tan, and Tensmeyer (2023) Liu, F.; Tan, H.; and Tensmeyer, C. 2023. DocumentCLIP: Linking Figures and Main Body Text in Reflowed Documents. arXiv preprint arXiv:2306.06306 .
- Liu et al. (2020a) Liu, F.; Wang, Y.; Wang, T.; and Ordonez, V. 2020a. Visual news: Benchmark and challenges in news image captioning. arXiv preprint arXiv:2010.03743 .
- Liu et al. (2020b) Liu, F.; Wang, Y.; Wang, T.; and Ordonez, V. 2020b. Visualnews: Benchmark and challenges in entity-aware image captioning. arXiv preprint arXiv:2010.03743 .
- Liu, Yacoob, and Shrivastava (2023) Liu, F.; Yacoob, Y.; and Shrivastava, A. 2023. COVID-VTS: Fact Extraction and Verification on Short Video Platforms. arXiv preprint arXiv:2302.07919 .
- Pennington, Socher, and Manning (2014) Pennington, J.; Socher, R.; and Manning, C. D. 2014. Glove: Global vectors for word representation. In Proceedings of the 2014 conference on empirical methods in natural language processing (EMNLP), 1532–1543.
- Pomerleau (1989) Pomerleau, D. A. 1989. ALVINN: An Autonomous Land Vehicle in a Neural Network. In Advances in neural information processing systems, 305–313.
- Qi et al. (2017) Qi, C. R.; Su, H.; Mo, K.; and Guibas, L. J. 2017. Pointnet: Deep learning on point sets for 3d classification and segmentation. In Proceedings of the IEEE conference on computer vision and pattern recognition, 652–660.
- Xu et al. (2017) Xu, H.; Gao, Y.; Yu, F.; and Darrell, T. 2017. End-to-end learning of driving models from large-scale video datasets. In Proceedings of the IEEE conference on computer vision and pattern recognition, 2174–2182.