Inorganic synthesis-structure maps in zeolites with machine learning and crystallographic distances
Abstract
Zeolites are inorganic materials known for their diversity of applications, synthesis conditions, and resulting polymorphs. Although their synthesis is controlled both by inorganic and organic synthesis conditions, computational studies of zeolite synthesis have focused mostly on organic template design. In this work, we use a strong distance metric between crystal structures and machine learning (ML) to create inorganic synthesis maps in zeolites. Starting with 253 known zeolites, we show how the continuous distances between frameworks reproduce inorganic synthesis conditions from the literature without using labels such as building units. An unsupervised learning analysis shows that neighboring zeolites according to our metric often share similar inorganic synthesis conditions, even in template-based routes. In combination with ML classifiers, we find synthesis-structure relationships for 14 common inorganic conditions in zeolites, namely Al, B, Be, Ca, Co, F, Ga, Ge, K, Mg, Na, P, Si, and Zn. By explaining the model predictions, we demonstrate how (dis)similarities towards known structures can be used as features for the synthesis space. Finally, we show how these methods can be used to predict inorganic synthesis conditions for unrealized frameworks in hypothetical databases and interpret the outcomes by extracting local structural patterns from zeolites. In combination with template design, this work can accelerate the exploration of the space of synthesis conditions for zeolites.
1 Introduction
Zeolites are inorganic porous materials widely recognized for their rich polymorphism and numerous applications.1, 2, 3 Their porous structure provides unique opportunities to tailor materials performance in catalysis, gas adsorption, selective membranes, and more.4, 5, 6 In principle, the performance of zeolites for each application can be controlled by adequate selection of polymorph and composition. However, this selection is often hindered by the high-dimensional synthesis routes required to produce the materials 7. Zeolites are often synthesized with hydrothermal treatments, with inorganic and organic precursors cooperating to crystallize the nanoporous structure 8. Organic templates are known to direct the formation of certain topologies, thus biasing the phase competition landscape to favor the best-matching topology instead of another 9, 8. Because of this effect, design of organic structure-directing agents (OSDAs) led to multiple successful examples of phase-selective zeolite synthesis and control of catalytic properties 10, 11, 12, especially when used in combination with computational methods 13, 14, 15, 16, 17, 18, 19.
On the other hand, computational design of inorganic synthesis conditions for zeolites has not yet achieved the same impact as template design. Despite their promise in controlling active site distribution 20, phase selectivity 21, Si/Al ratio 22, morphology 23, or lowering the cost of syntheses 24, selection of inorganic conditions capable of synthesizing existing and novel zeolites is not easily modeled 25. Recent progress in quantifying the role of inorganic synthesis conditions in zeolites includes: coupling machine learning and literature extraction 26, 27; obtaining structure-synthesis correlations from synthesis routes 21, 28; predicting effects of inorganic cations in heteroatom distributions 20, 17; or using ML to control composition and particle sizes from template-free syntheses 22. Nevertheless, their reliance on reported data prevents them to propose inorganic conditions for the synthesis of novel or hypothetical frameworks. Whereas some inorganic synthesis-structure relationships can be derived from building units 29, 30, 27 or alternative structural descriptors 28, automatically screening for new structures in hypothetical zeolite databases requires bypassing human-crafted labels such as building units. Furthermore, although graph-theoretical methods can detect composite building units (CBUs) in arbitrary structures, their computational cost may be prohibitive when exploring large datasets. Data-driven methods based in the topology of the structure also provide information on key factors that govern kinetics of zeolite crystallization 31, 32, but do not immediately inform their synthesis conditions. Finally, aggregate framework information such as density-energy plots 33, 34 or local interatomic distances 35 provide few correlations between different inorganic synthesis conditions and targeted frameworks, which motivate new data-driven approaches to synthesizability prediction 36. Thus, advancing towards a priori discovery of novel zeolite frameworks requires developing methods to: (1) uncover synthesis-structure relationships in zeolites; (2) efficiently explore the inorganic synthesis space of zeolites; and (3) bypass the absence of labeled data in hypothetical zeolite databases.
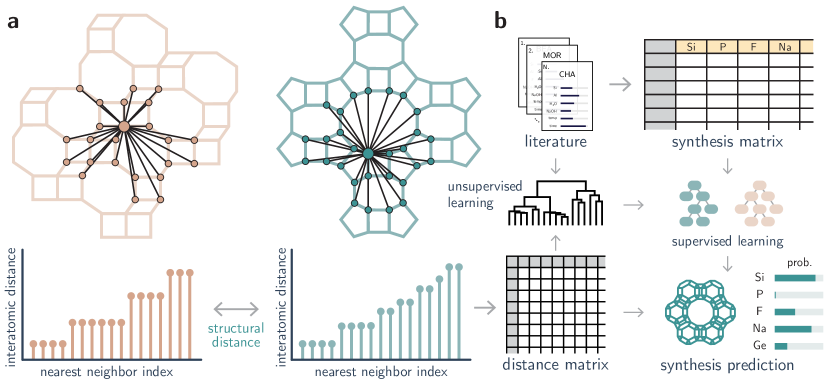
In this work, we correlate inorganic synthesis conditions to zeolite structure using a mathematically strong representation for comparing periodic crystals, the Average Minimum Distance (AMD)37, derived from the Pointwise Distance Distribution (PDD)38 of crystal structures (see Fig. 1). The PDD is independent of a unit cell, continuous under small perturbations, theoretically complete for generic crystals, and distinguished all periodic crystals in the Cambridge Structural Database. Importantly, it can be computed much more efficiently than graph-based approaches, only requiring a fast nearest neighbor search 39. We show that the AMD vectors of zeolites can be used to predict inorganic synthesis conditions and recall a comprehensive dataset of synthesis conditions from the literature. Then, we demonstrate that unsupervised and supervised machine learning (ML) methods can be used to create structure-synthesis relationships independently from OSDA design. Finally, we propose inorganic synthesis conditions to realize hypothetical frameworks based on distances toward structures whose synthesis is known, thus proposing interpretable synthesis-structure models to guide the synthesis of new zeolites.
2 Results and Discussion
2.1 Inorganic synthesis maps from unsupervised learning
Designing synthesis-structure relationships in zeolites has long relied on intuitive patterns emerging from their natural structure. For example, some CBUs are typically known to be synthesized by different inorganic conditions, such as d6r in the presence of sodium ions or d4r in the presence of germanium or fluorine. Nevertheless, not all structures produced with certain inorganic agents exhibit the same CBUs, and CBUs are not necessarily realized only by one element. Data-driven methods showed promise in connecting zeolite synthesizability to their local structure 35 or accelerating their screening 36, but interpreting large databases of structures can be challenging depending on the selected data representations. For instance, subgraph isomorphism used to extract building units is an NP-type problem, and requires creating a predefined set of substructures that are being searched for. On the other hand, local structural fingerprints such as the Smooth Overlap of Atomic Positions (SOAP) 40 may be unable to distinguish between certain atomic environments 41.
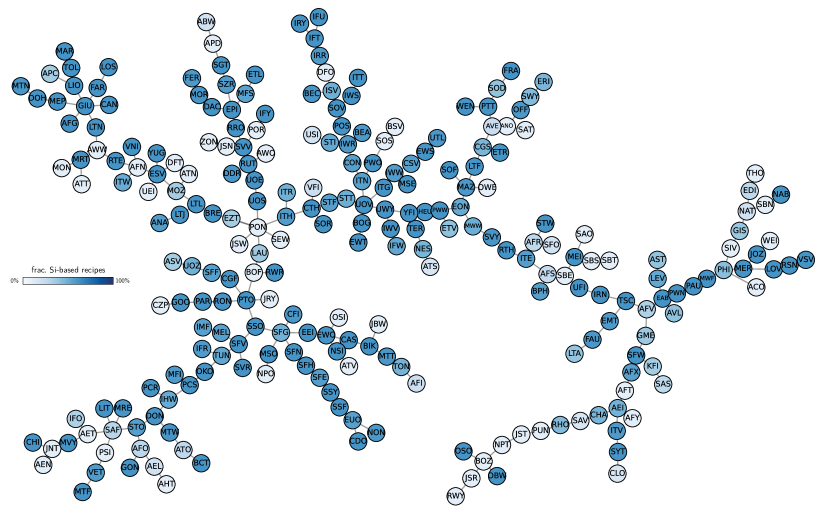
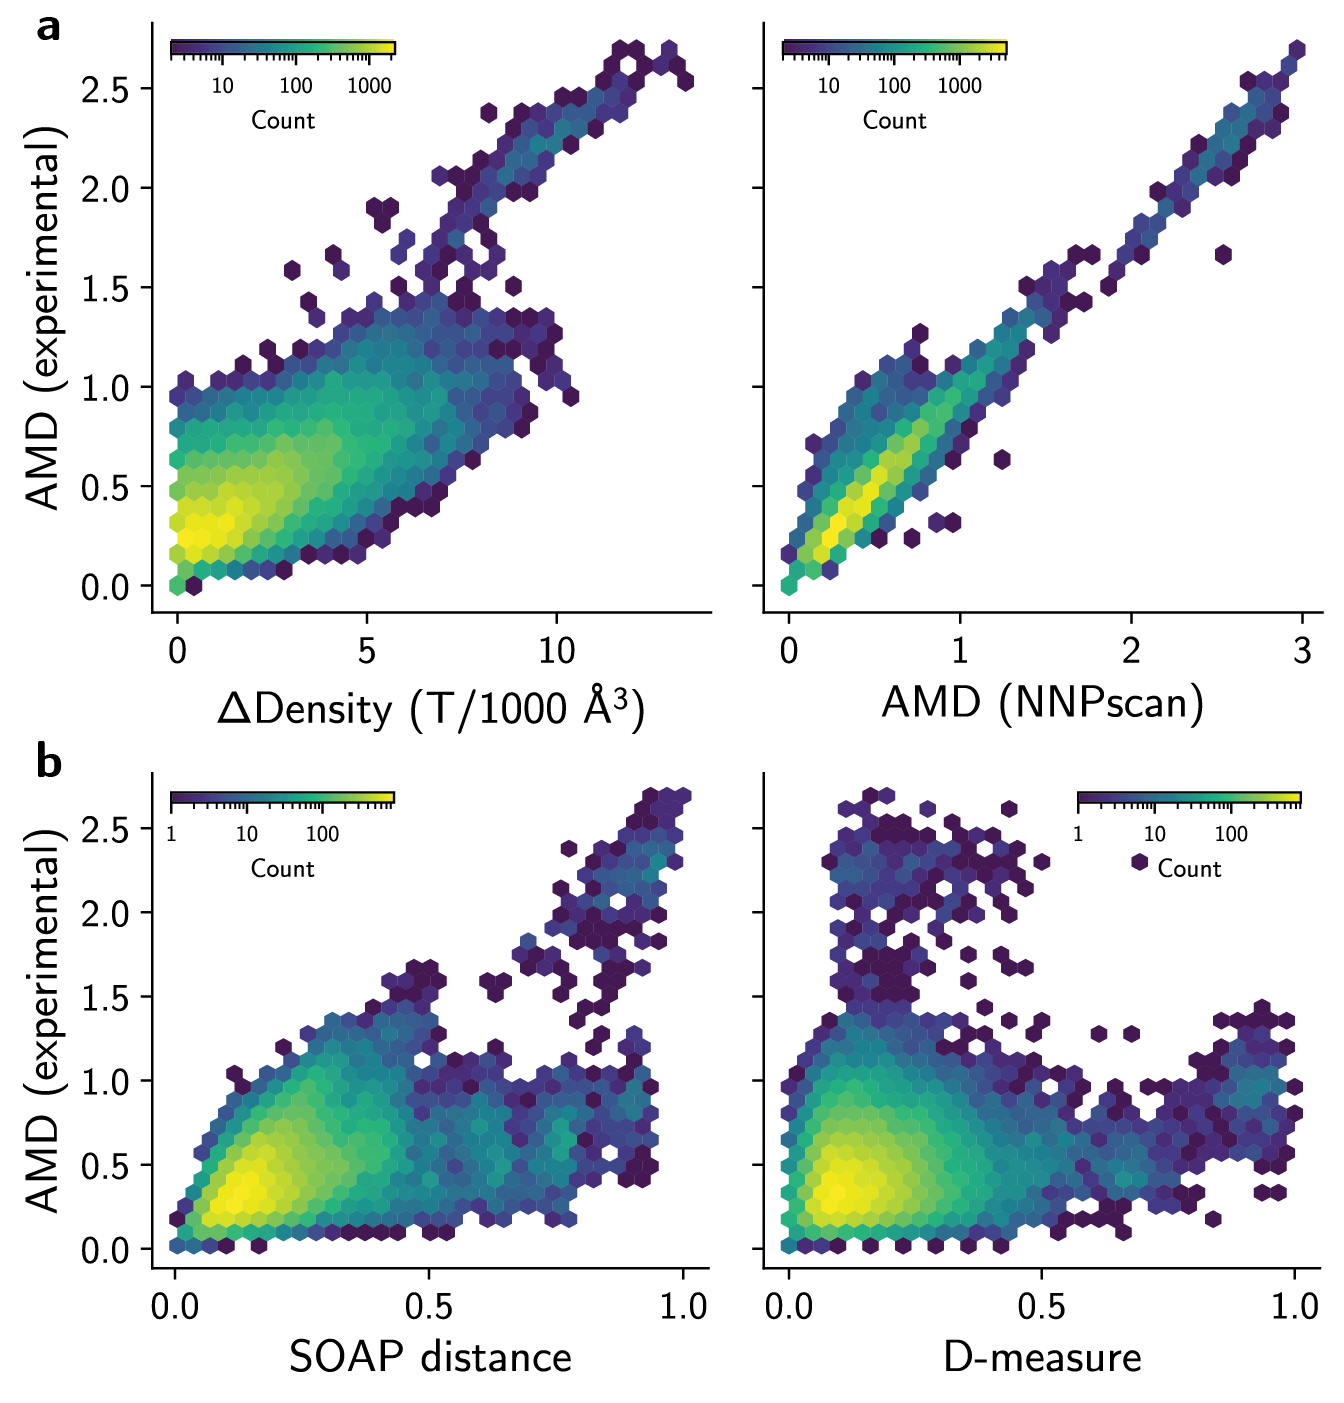
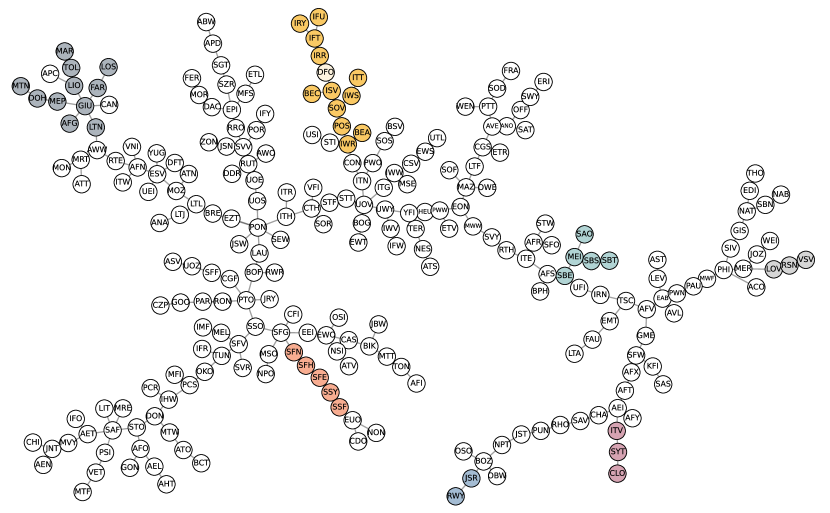
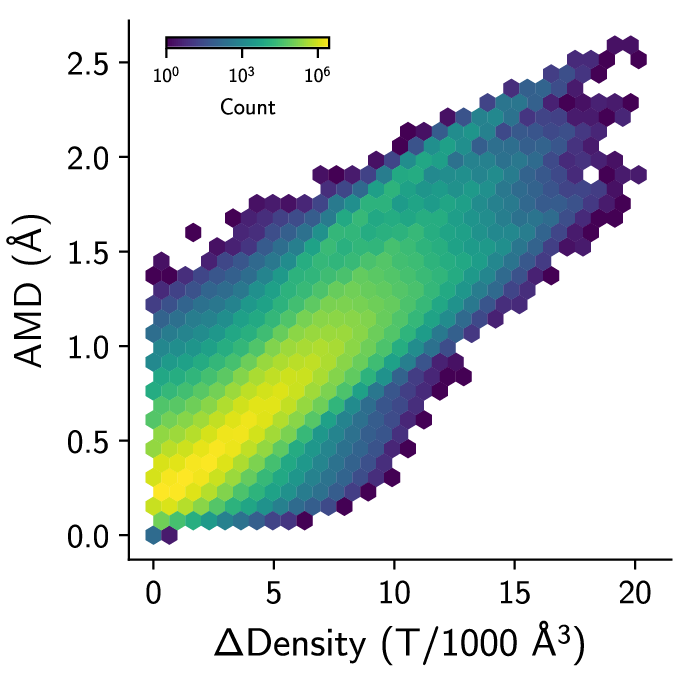
To address these problems, we created a procedure to compare zeolites and extract synthesis-structure relationships without relying on any structural labels except for the atomic positions (Fig. 1). Using the concept of PDDs and AMDs, we calculated the distance between two zeolite structures by comparing their AMD (see Methods). This comparison between average local environments is computationally efficient but descriptive enough to distinguish all crystals in the CSD 38. Then, we assumed that zeolites sharing similar local structures exhibit similar inorganic synthesis conditions. To test this hypothesis, we computed the distance matrix between 253 known frameworks in the International Zeolite Association (IZA) database using AMD, and then performed a qualitative analysis of the results. We found that the AMDs correlated weakly with differences of density and with the SOAP distance between structures, but showed almost no correlation with graph-based distances from previous work 42 (Fig. S1). Moreover, we noted that zeolites sharing the lowest distances according to our metric have often been synthesized together (see Table S1 in the Supporting Information). Recovering pairs of structurally similar frameworks such as ITH-ITR, SBS-SBT, or MWF-PAU at low distance already suggests that the similarity metric is qualitatively sound. To generalize this observation, we charted a map of zeolite structures based on their distances. Figure 2 shows the minimum spanning tree created by converting the AMD distance matrix into a graph with weighted edges. Although the tree shows discrete connections and may not be accurate in the presence of outliers, it facilitates a qualitative interpretation of the results and may provide insights about synthesis-structure maps. Even without considering synthesis labels of the data in Fig. 2, known relationships between zeolites emerge naturally from the structural tree map. Zeolites known for their similar building patterns are clustered together in the minimum spanning tree, demonstrating that their AMD values capture the space of zeolites without learnable features. Examples of such clusters include the ABC-6 zeolites, structures containing lov building units, six-membered rings frameworks (e.g., GIU cluster), Ge- or boron-containing zeolites (e.g., BEC or IRR and SFN-SSF branch, respectively), to name a few (see also Fig. S3 for a visual guide). Similarly, structural outliers such as the low-density RWY or JSR, or interrupted frameworks such as -CLO, -SYT, and -ITV tend to cluster together, as their distances to all other zeolites is high (Fig. S2). At the same time, other interrupted frameworks produced in different synthesis conditions, such as -IRY, -IFU, or -IFT synthesized with germanium, appear along with other germanosilicates in the synthesis map, not only with other interrupted frameworks. This ability to traverse the structural space in a continuous way allows drawing non-obvious connections that may be overlooked by building units alone. For example, the MEI framework lies within the SBS, SBT, SAO, and SBE cluster despite not having common CBUs with any of these zeolites. Nevertheless, the MEI structure also has large pores and building patterns that could help inform the synthesis of other of these zeolites. In fact, the recent synthesis of PST-32 (SBT) and PST-2 (SBS/SBT) aluminosilicate zeolites was performed in the presence of sodium 24, similar to the original inorganic synthesis of MEI, although at lower Si/Al ratios.
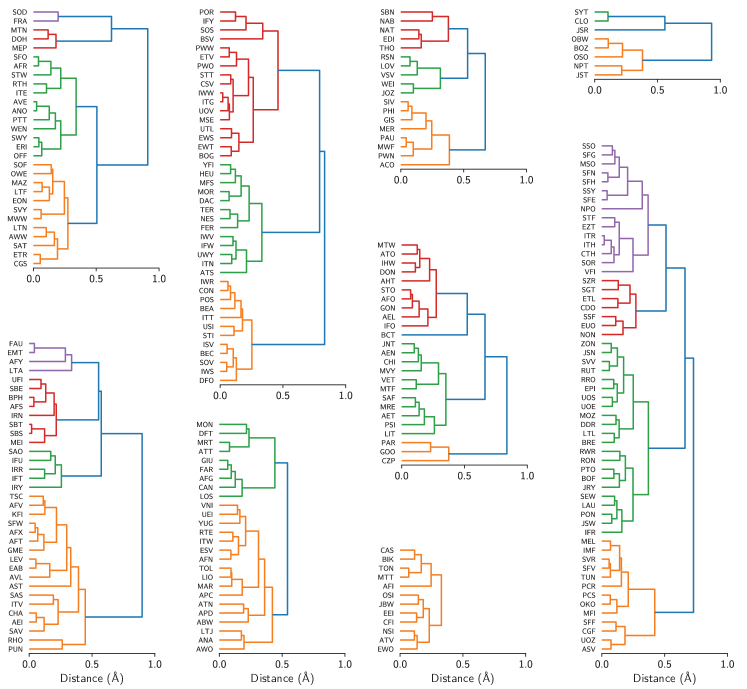
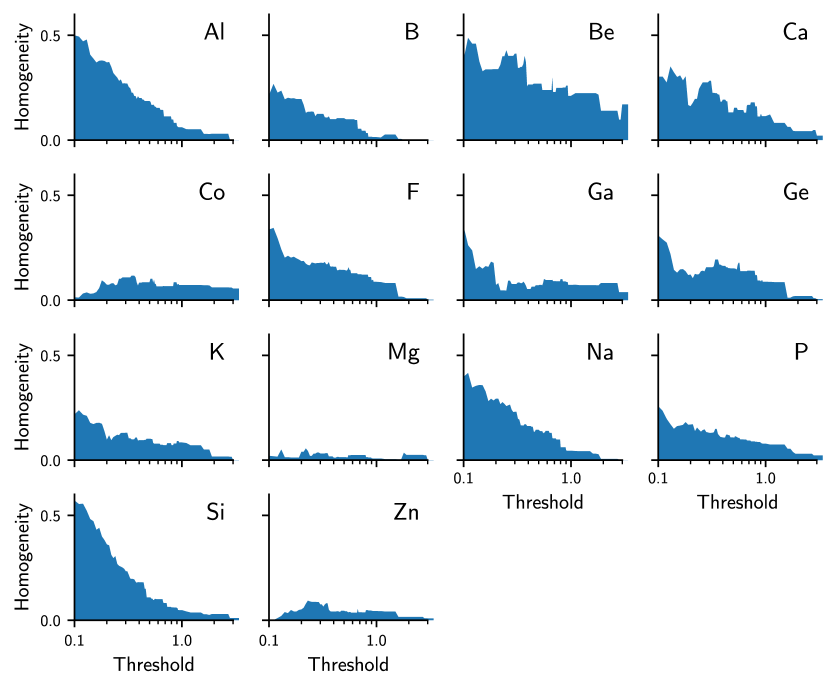
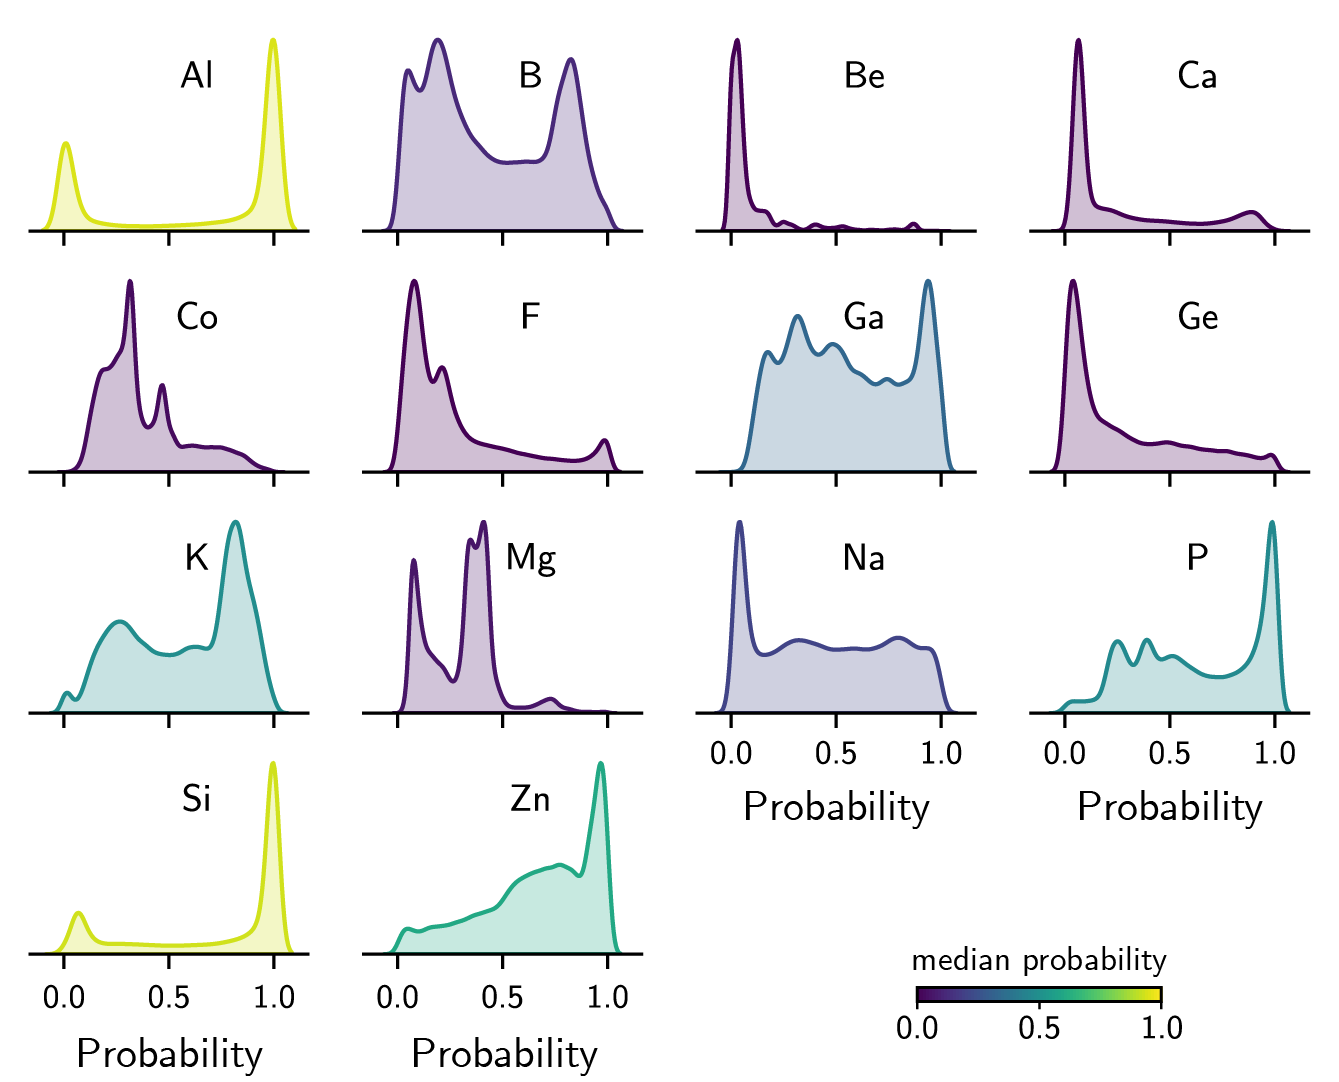
Despite the usefulness of the tree map in connecting zeolites with similar synthesis conditions, the visual analysis cannot determine whether the map consistently provides new insights on the synthesis of zeolites. To improve this qualitative analysis, we performed a hierarchical clustering of the data to quantify whether the structural distance metric clusters the data according to the literature synthesis conditions (see Methods). The dendrogram of the AMD values (Figs. S5 and S6) shows how zeolites are related to each other based on distances, thus providing a more quantitative view to the minimum spanning tree of Fig. 2. Then, to create labels for synthesis conditions, we started with a dataset of extensive synthesis conditions extracted from the zeolite literature from Jensen et al. 43. After augmenting the data with frameworks not typically reported in publications, such as those found as minerals, we analyzed the frequency of occurrence of each synthesis condition for each framework. Although the initial dataset had information on both organic and inorganic conditions, we disregarded the organic templates when labeling the data, thus assuming that inorganic and organic conditions can, to an extent, be predicted independently of each other. Furthermore, given the scarcity of data for some synthesis conditions, we focused only on the 14 inorganic conditions that have been used to synthesize at least 10 zeolites, namely Al, B, Be, Ca, Co, F, Ga, Ge, K, Mg, Na, P, Si, and Zn. Finally, we verify whether flat clusters formed by points with a maximum distance of each other share the same positive labels. This intuition is quantified by computing the homogeneity between data points given clusters formed by a given distance threshold 44 (see Methods). If all clusters had only positive labels, their homogeneity would be 1, whereas zero homogeneity indicates perfect mixing of positive and negative labels. Figure 3a shows that clusters with at least one positive data point become more homogeneous as the distance threshold decreases. This supports the qualitative view that structures considered similar according to the AMD values also share similar synthesis conditions more often than not. On the other hand, as clusters become larger and the increasingly dissimilar structures are grouped together, the homogeneity decreases. Whereas the distribution of labels for some inorganic agents such as Al, Si, Be, F, or Na exhibit higher homogeneity at low distances (see Fig. S7), others such as Co, Mg, or Zn show little predictive power. This suggests that structural distances computed with the AMD have stronger correlations with certain synthesis conditions than with others. Although the lack of true negative data points may also influence the computed homogeneity, these results demonstrate quantitatively that some synthesis-structure relationships can be established in zeolites using AMDs.
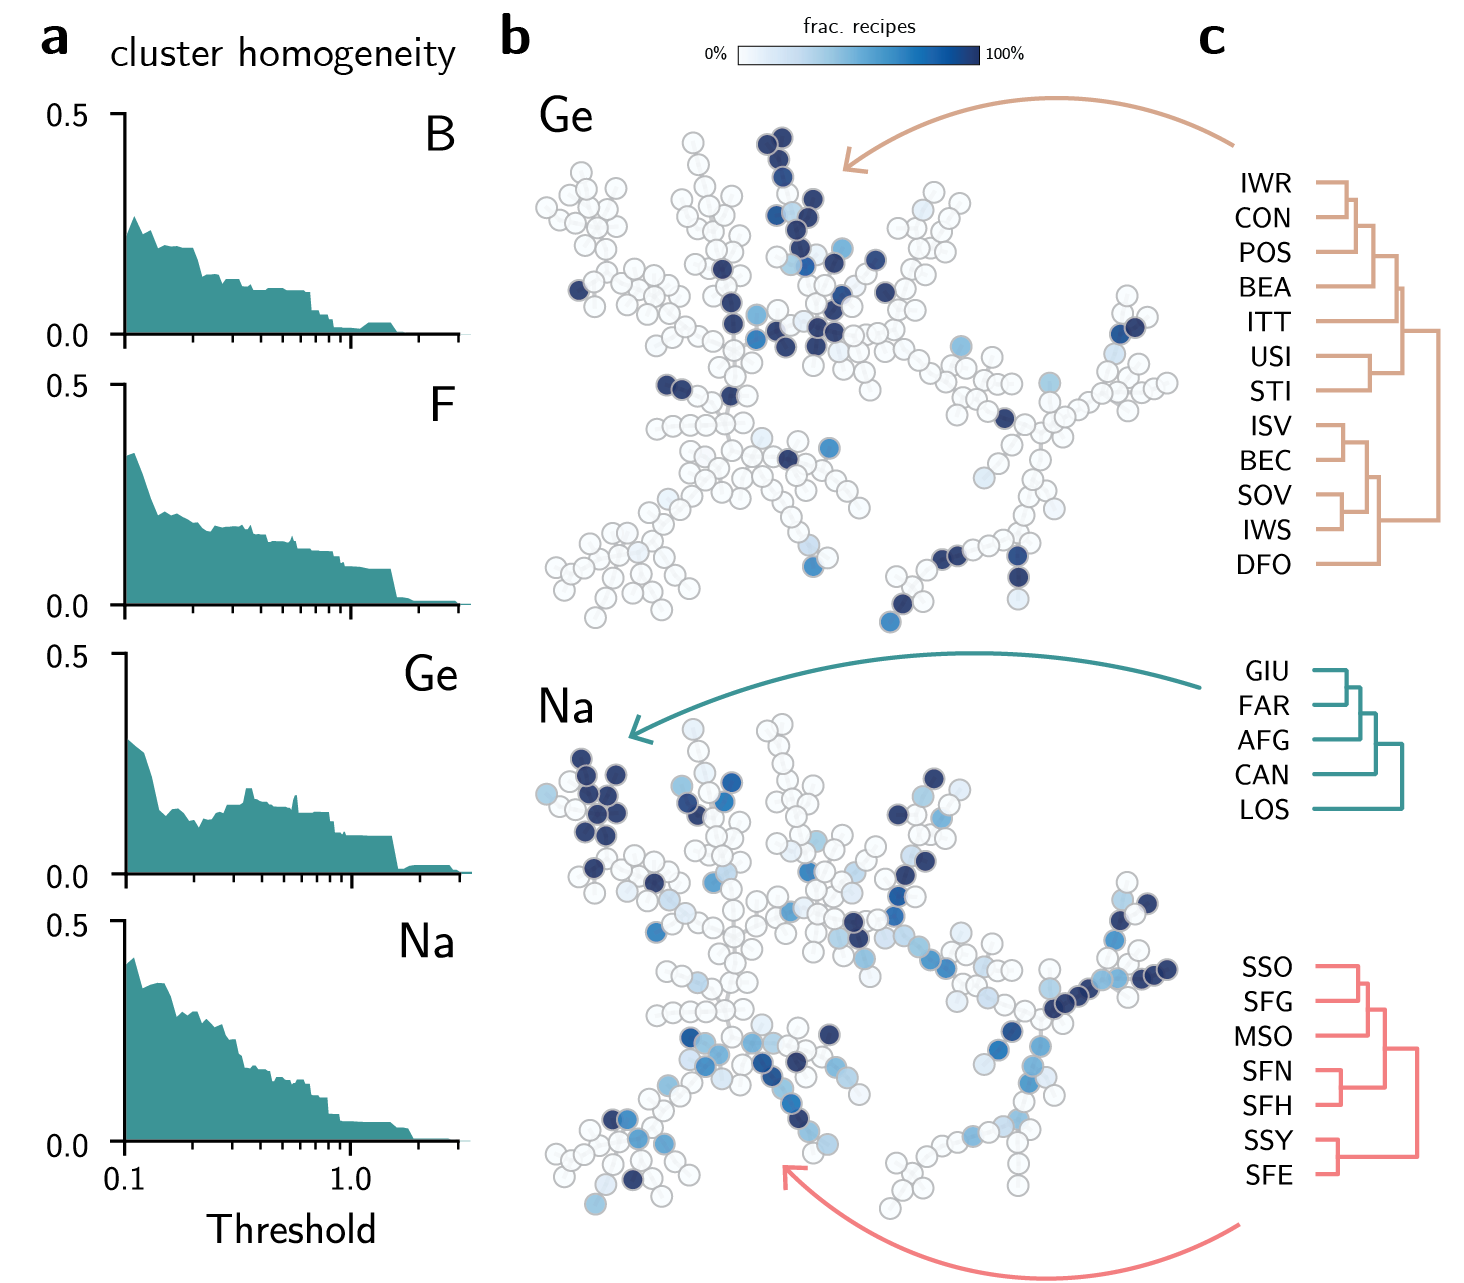
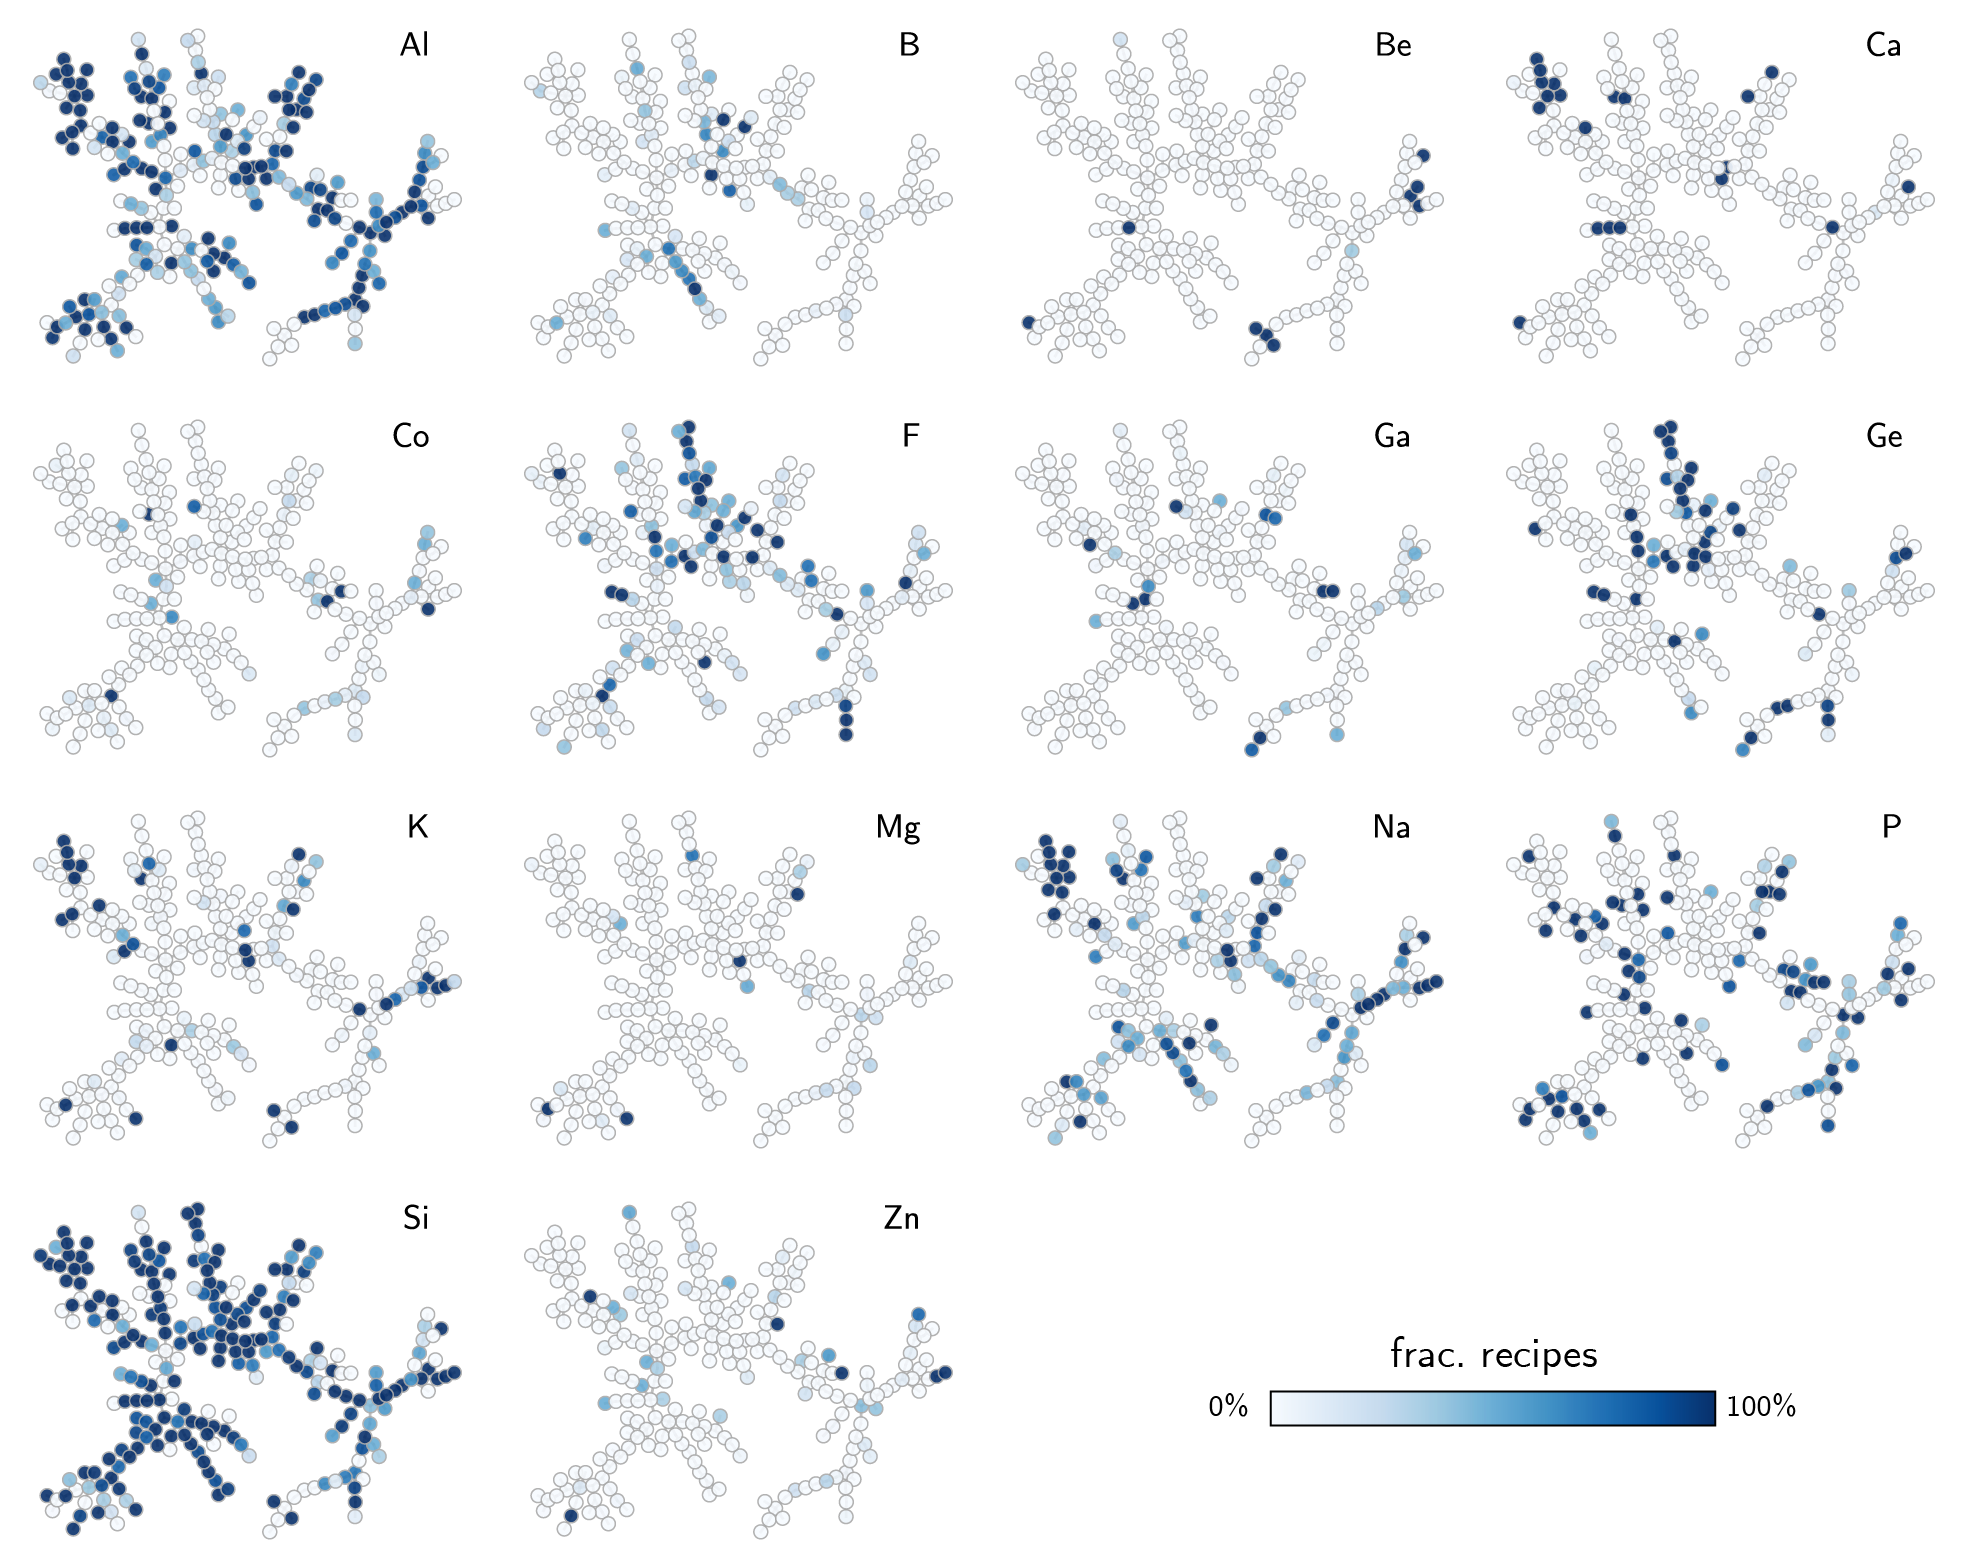
Additional investigations of the data explain the patterns in homogeneity obtained above. Figure 3b shows how the minimum spanning tree can be visualized according to the frequency of certain inorganic conditions in zeolite synthesis (see Fig. S4 for complete results). For example, some frameworks realizable with Ge or Na form their own groups in the tree, as also illustrated by the subclusters in dendrograms (Fig. 3c). Indeed, zeolites such as BEC, ISV, ITT or IWR are typical examples of large- and extra-large pore structures synthesized using germanium. Similarly, denser phases such as GIU, FAR, LOS etc. are often obtained in sodium-mediated syntheses. For common synthesis conditions such as silicon, trends can be derived from the visualization of silicon-free routes. The labeled trees from Figs. 2 and S4 show that non-silica zeolites are often located in similar regions of the structure space. Groups formed by zeolites such as NAT, EDI, and THO, or AFO, AEL, AHT show that non-silica zeolites also share structural patterns that may be harder to obtain in silica-based structures.
This unsupervised analysis demonstrates that our distance metric relates zeolites with similar inorganic synthesis conditions without any learnable parameters. Although zeolite structures contain several outliers and lack true negative data, the structural patterns still provide a strong prior for exploring the synthesis conditions. In particular, as inorganic synthesis conditions can be inferred by the similarity between crystal structures, they can also help downselect structures for zeolites yet to be realized.
2.2 Interpretable classifiers for predicting inorganic synthesis conditions
One disadvantage of the pure unsupervised learning approach is the inefficient utilization of the available labels. Although similarity between crystal structures is a good indicator of common synthesis conditions, the dissimilarity between structures can also provide insights on which structures are less likely to be synthesized with a given composition. To perform this analysis, we use the labeled data to train supervised learning methods that predict the synthesis conditions of a zeolite given its distances to known frameworks. Specifically, we trained logistic regression, random forest, and XGBoost classifiers on literature data to predict each class label individually. However, training models on the literature labels has two caveats: (1) the data is often unbalanced, i.e., the number of positive data points is much smaller than the number of negative data points; and (2) the negative data is not truly negative, as its lack of literature reporting does not imply that a zeolite cannot be synthesized under the synthesis conditions in analysis. To account for these problems, we trained balanced classifiers by subsampling the dataset for each synthesis conditions, thus ensuring that training sets had the same proportion of positive and negative data points, but validation/test sets were allowed to have more negative samples than positive ones. In that case, because models were tested on different negative splits, they were prevented from memorizing “negative” data points as truly negative, as exemplified by the case of MEI zeolite above. Finally, for each synthesis condition, we performed an extensive hyperparameter optimization for each of the three classifiers, evaluating the models according to their accuracy, precision, recall, F1 score, and areas under the receiving operating characteristic (ROC) and precision-recall (PR) curves.
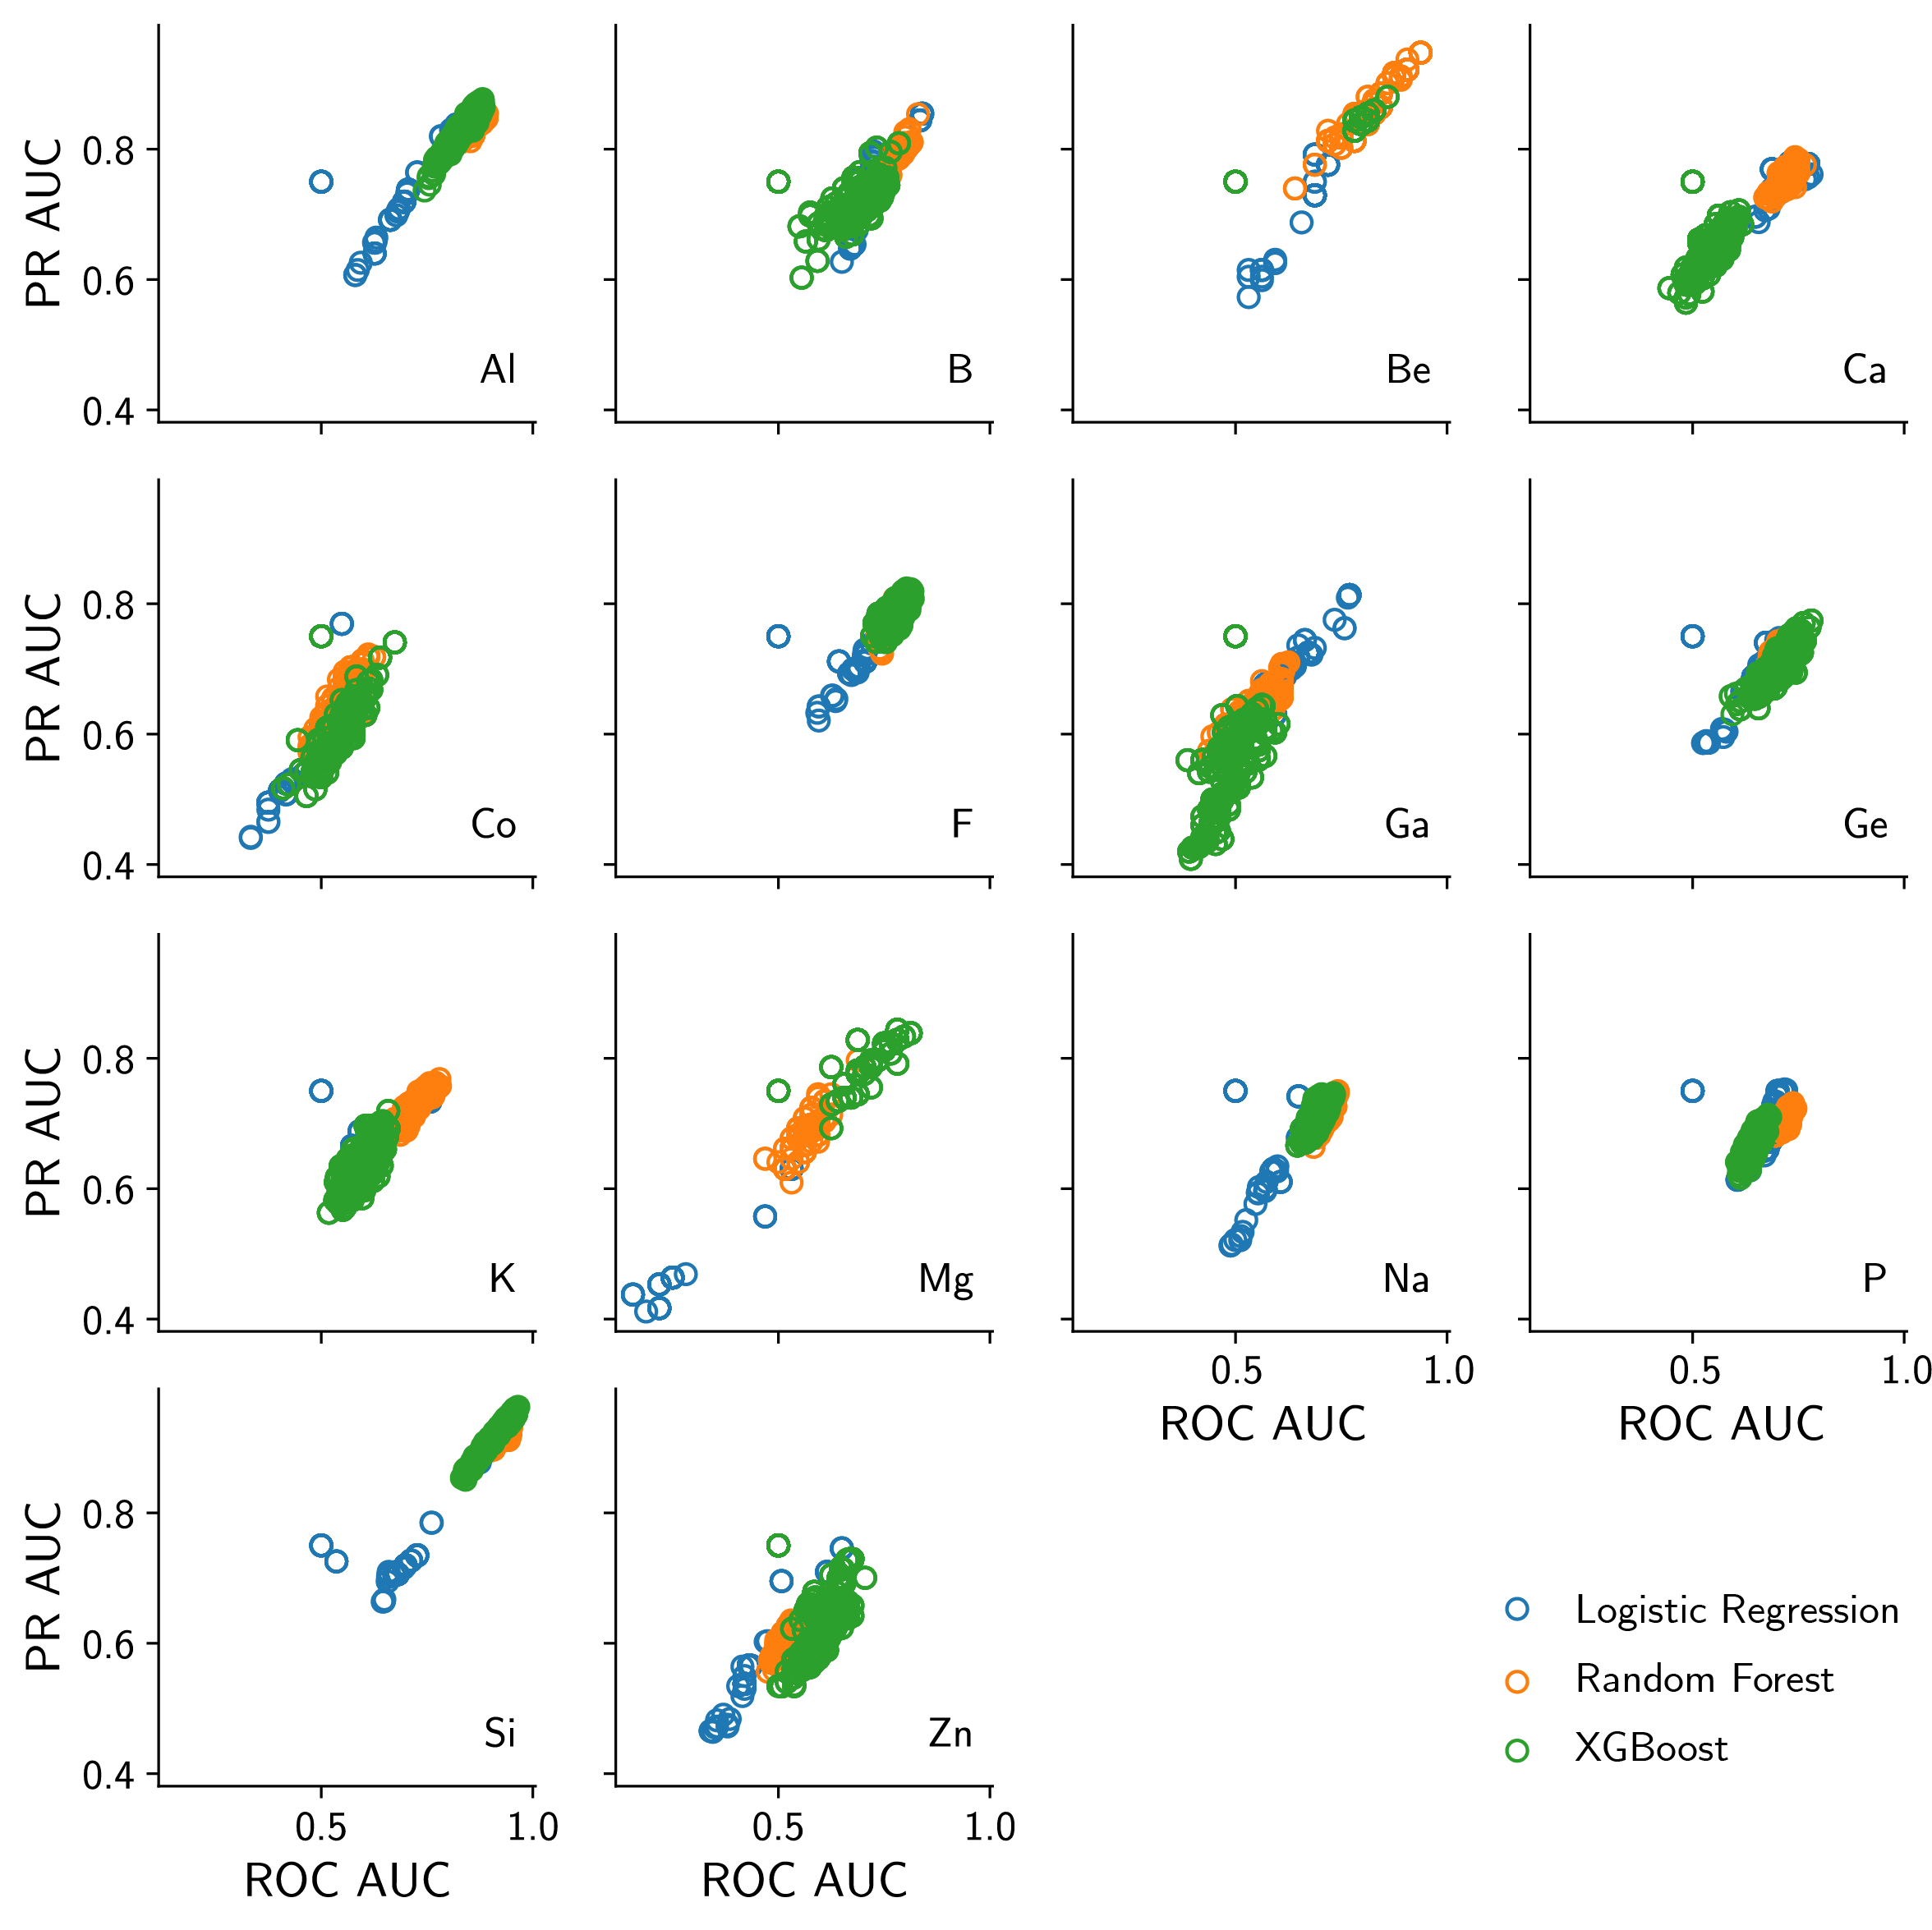
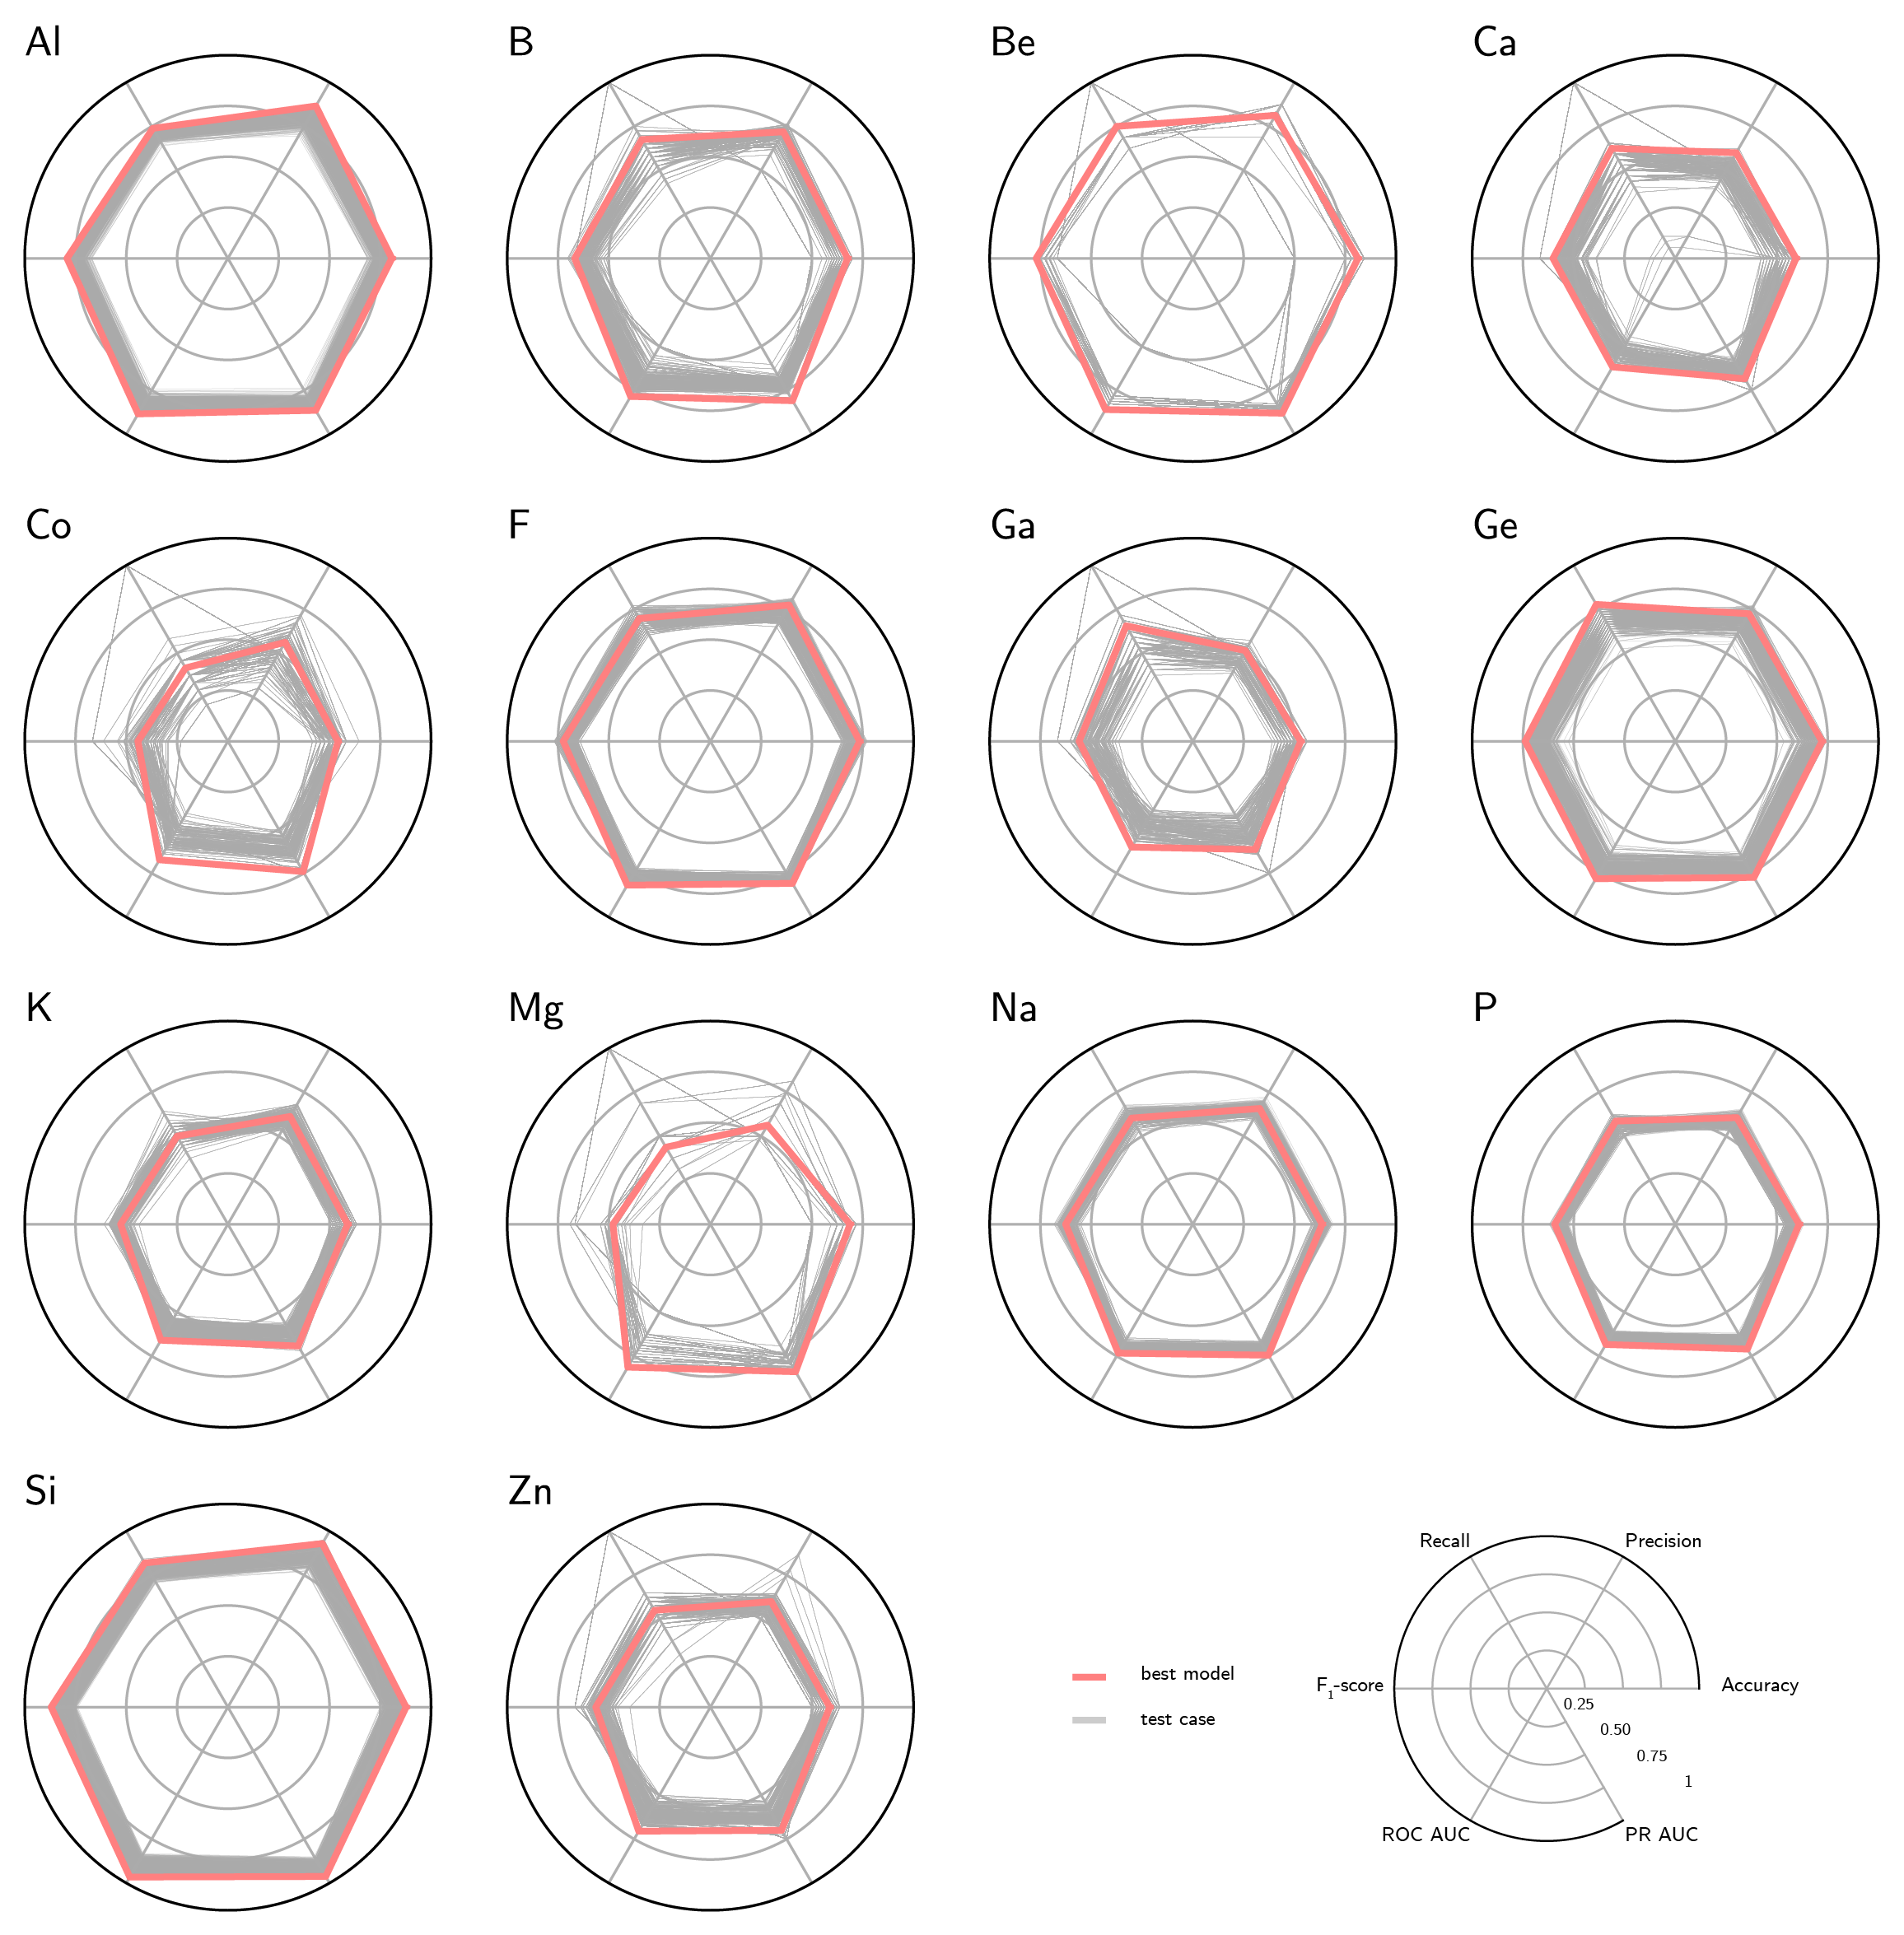
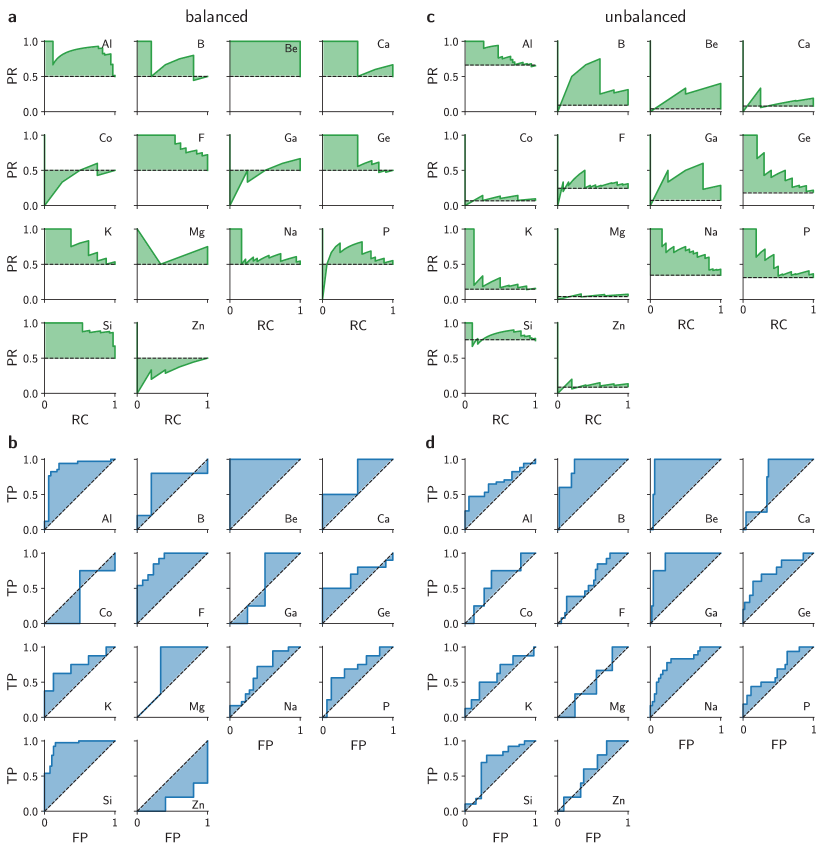
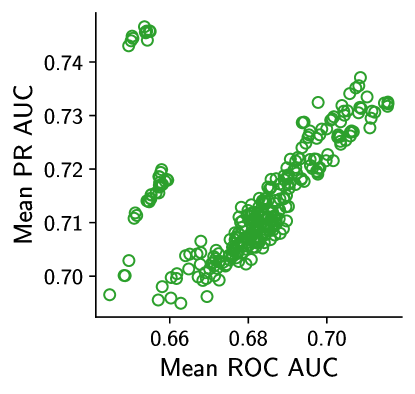
The results of the hyperparameter search are summarized in Fig. S8. Whereas no classifier outperforms the other in all tasks, XGBoost models often show the best metrics of ROC and PR areas under the curve (AUC) for a variety of synthesis conditions. When the results for the XGBoost classifier are visualized according to all metrics at once (Fig. 4a), they demonstrate how the best hyperparameters lead to adequate figures of merit based on results from the validation set (see also Fig. S9). When evaluated against a held-out test set, the model with best set of hyperparameters still exhibits high ROC and PR AUCs for a variety of synthesis conditions (Fig. S10). Nevertheless, this set of hyperparameters is far from being the only one that performs well in these conditions (Fig. S11). As discussed in the analysis using unsupervised learning, the ability to correctly label zeolites whose synthesis contains Co or Zn is smaller than other labels, as indicated by the worse performance of all classifiers in labeling these conditions. However, some synthesis conditions that were not well-predicted by the unsupervised learning method, such as Mg, can now be predicted using XGBoost models, despite its low recall (Fig. S10). These results show that ML classifiers can predict inorganic synthesis conditions using distances towards known zeolites as features. This has useful implications, as it bypasses the need to create general representations for zeolites, and instead uses a set of points in the space as references for new synthesis conditions.
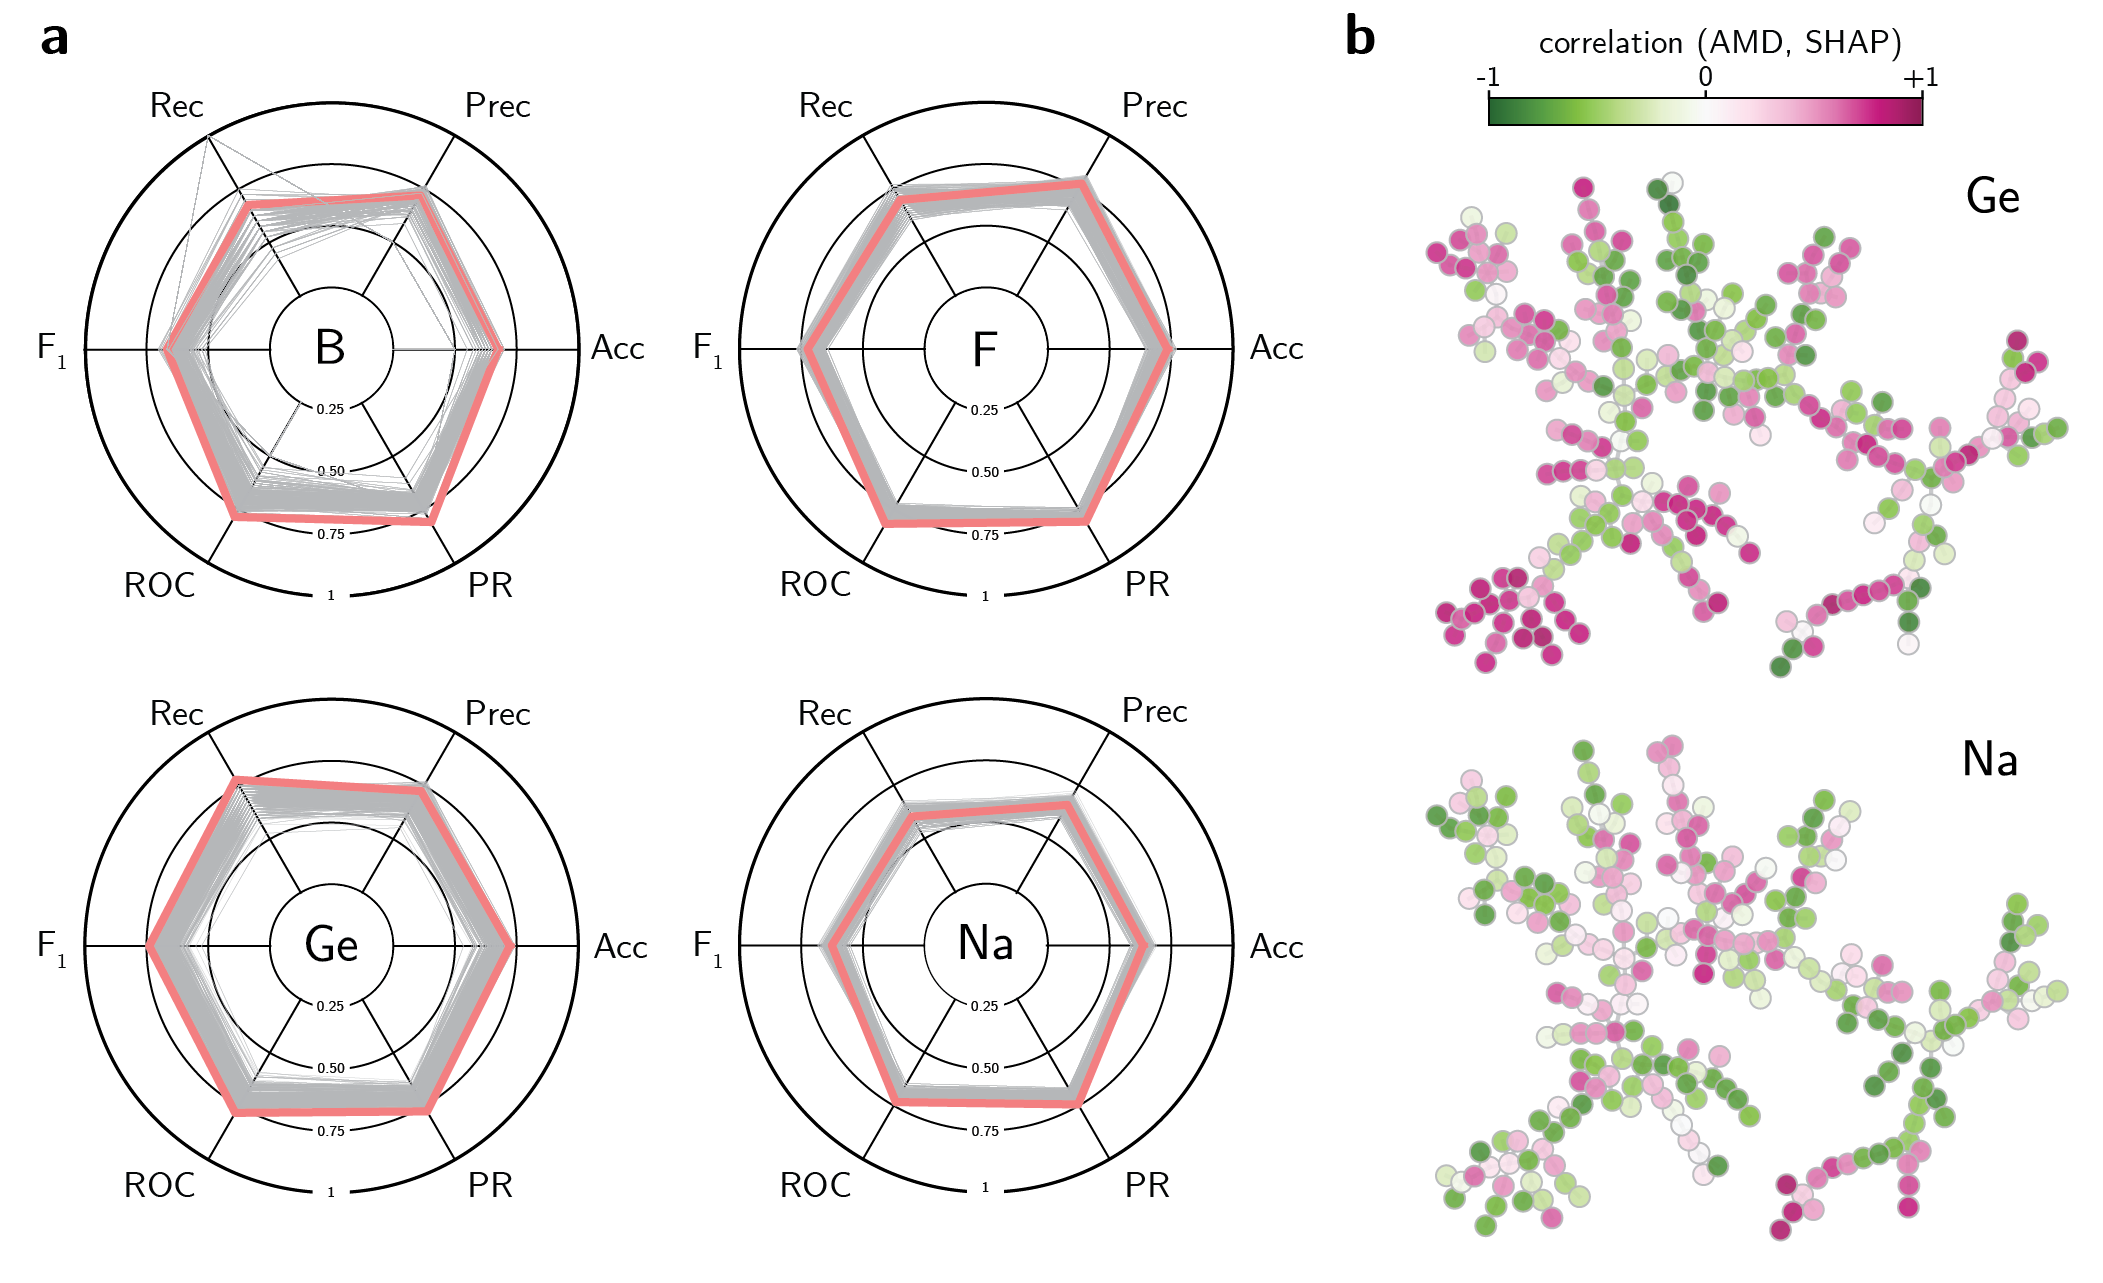
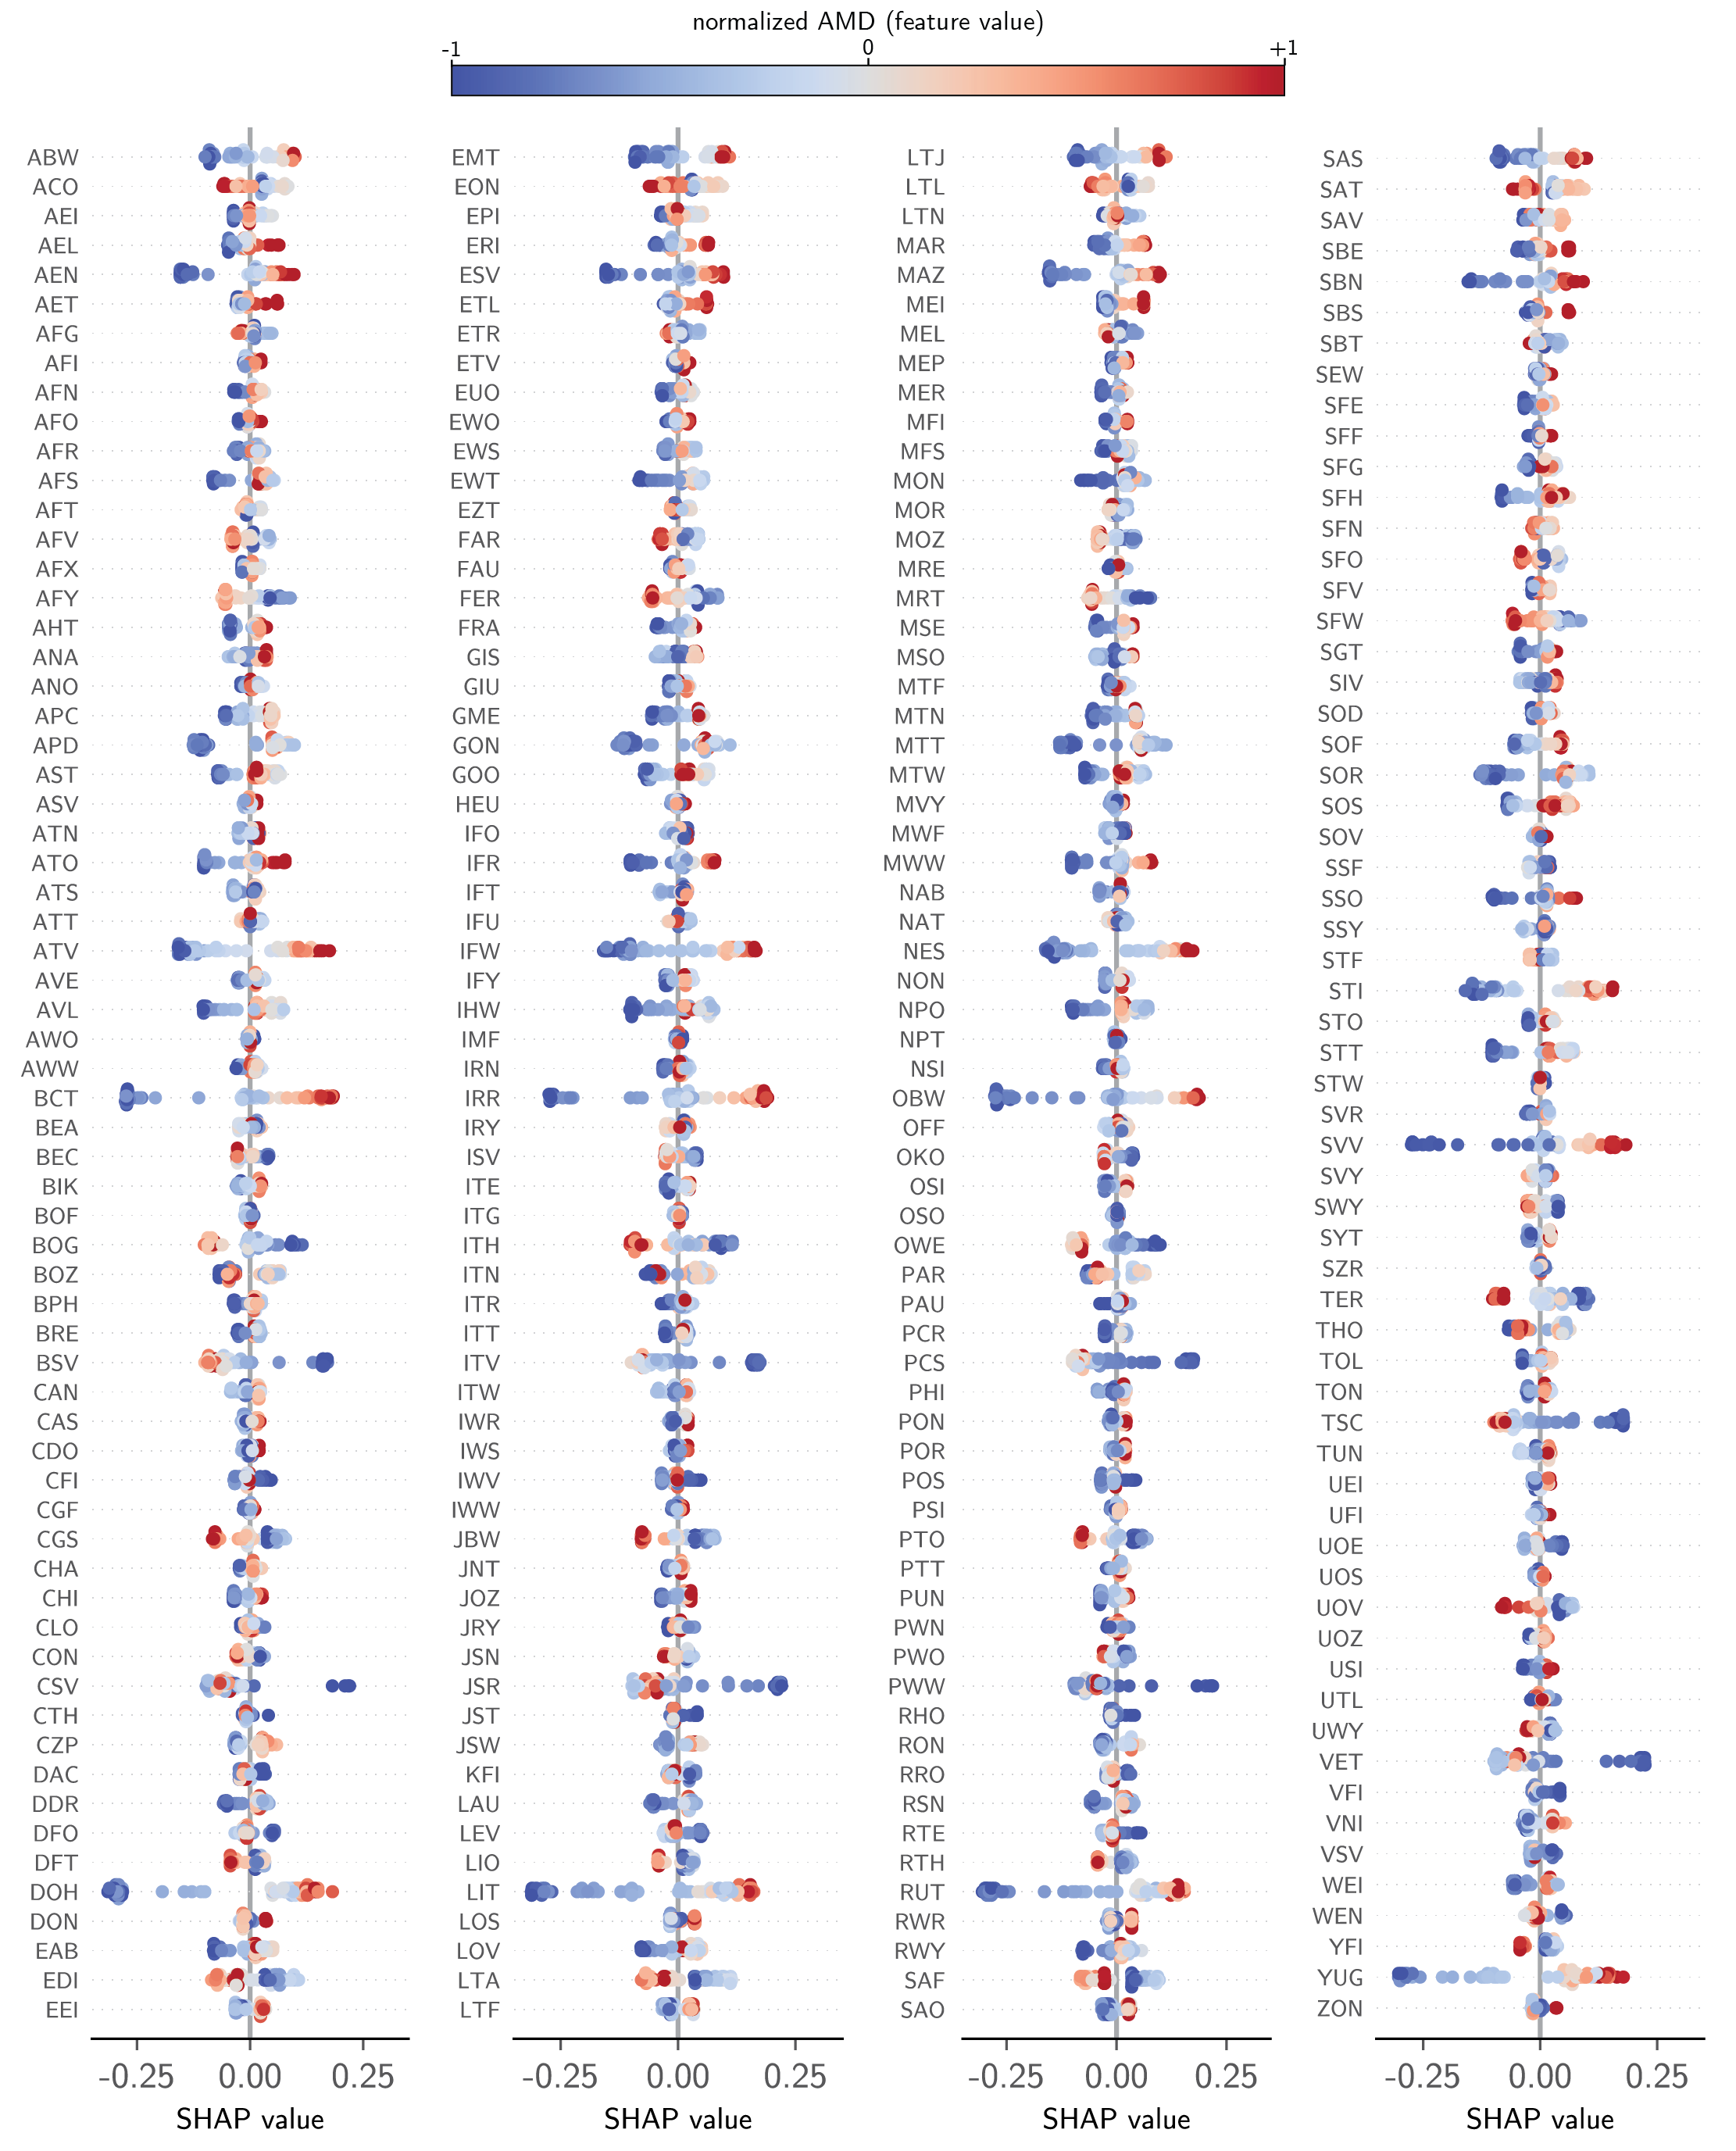
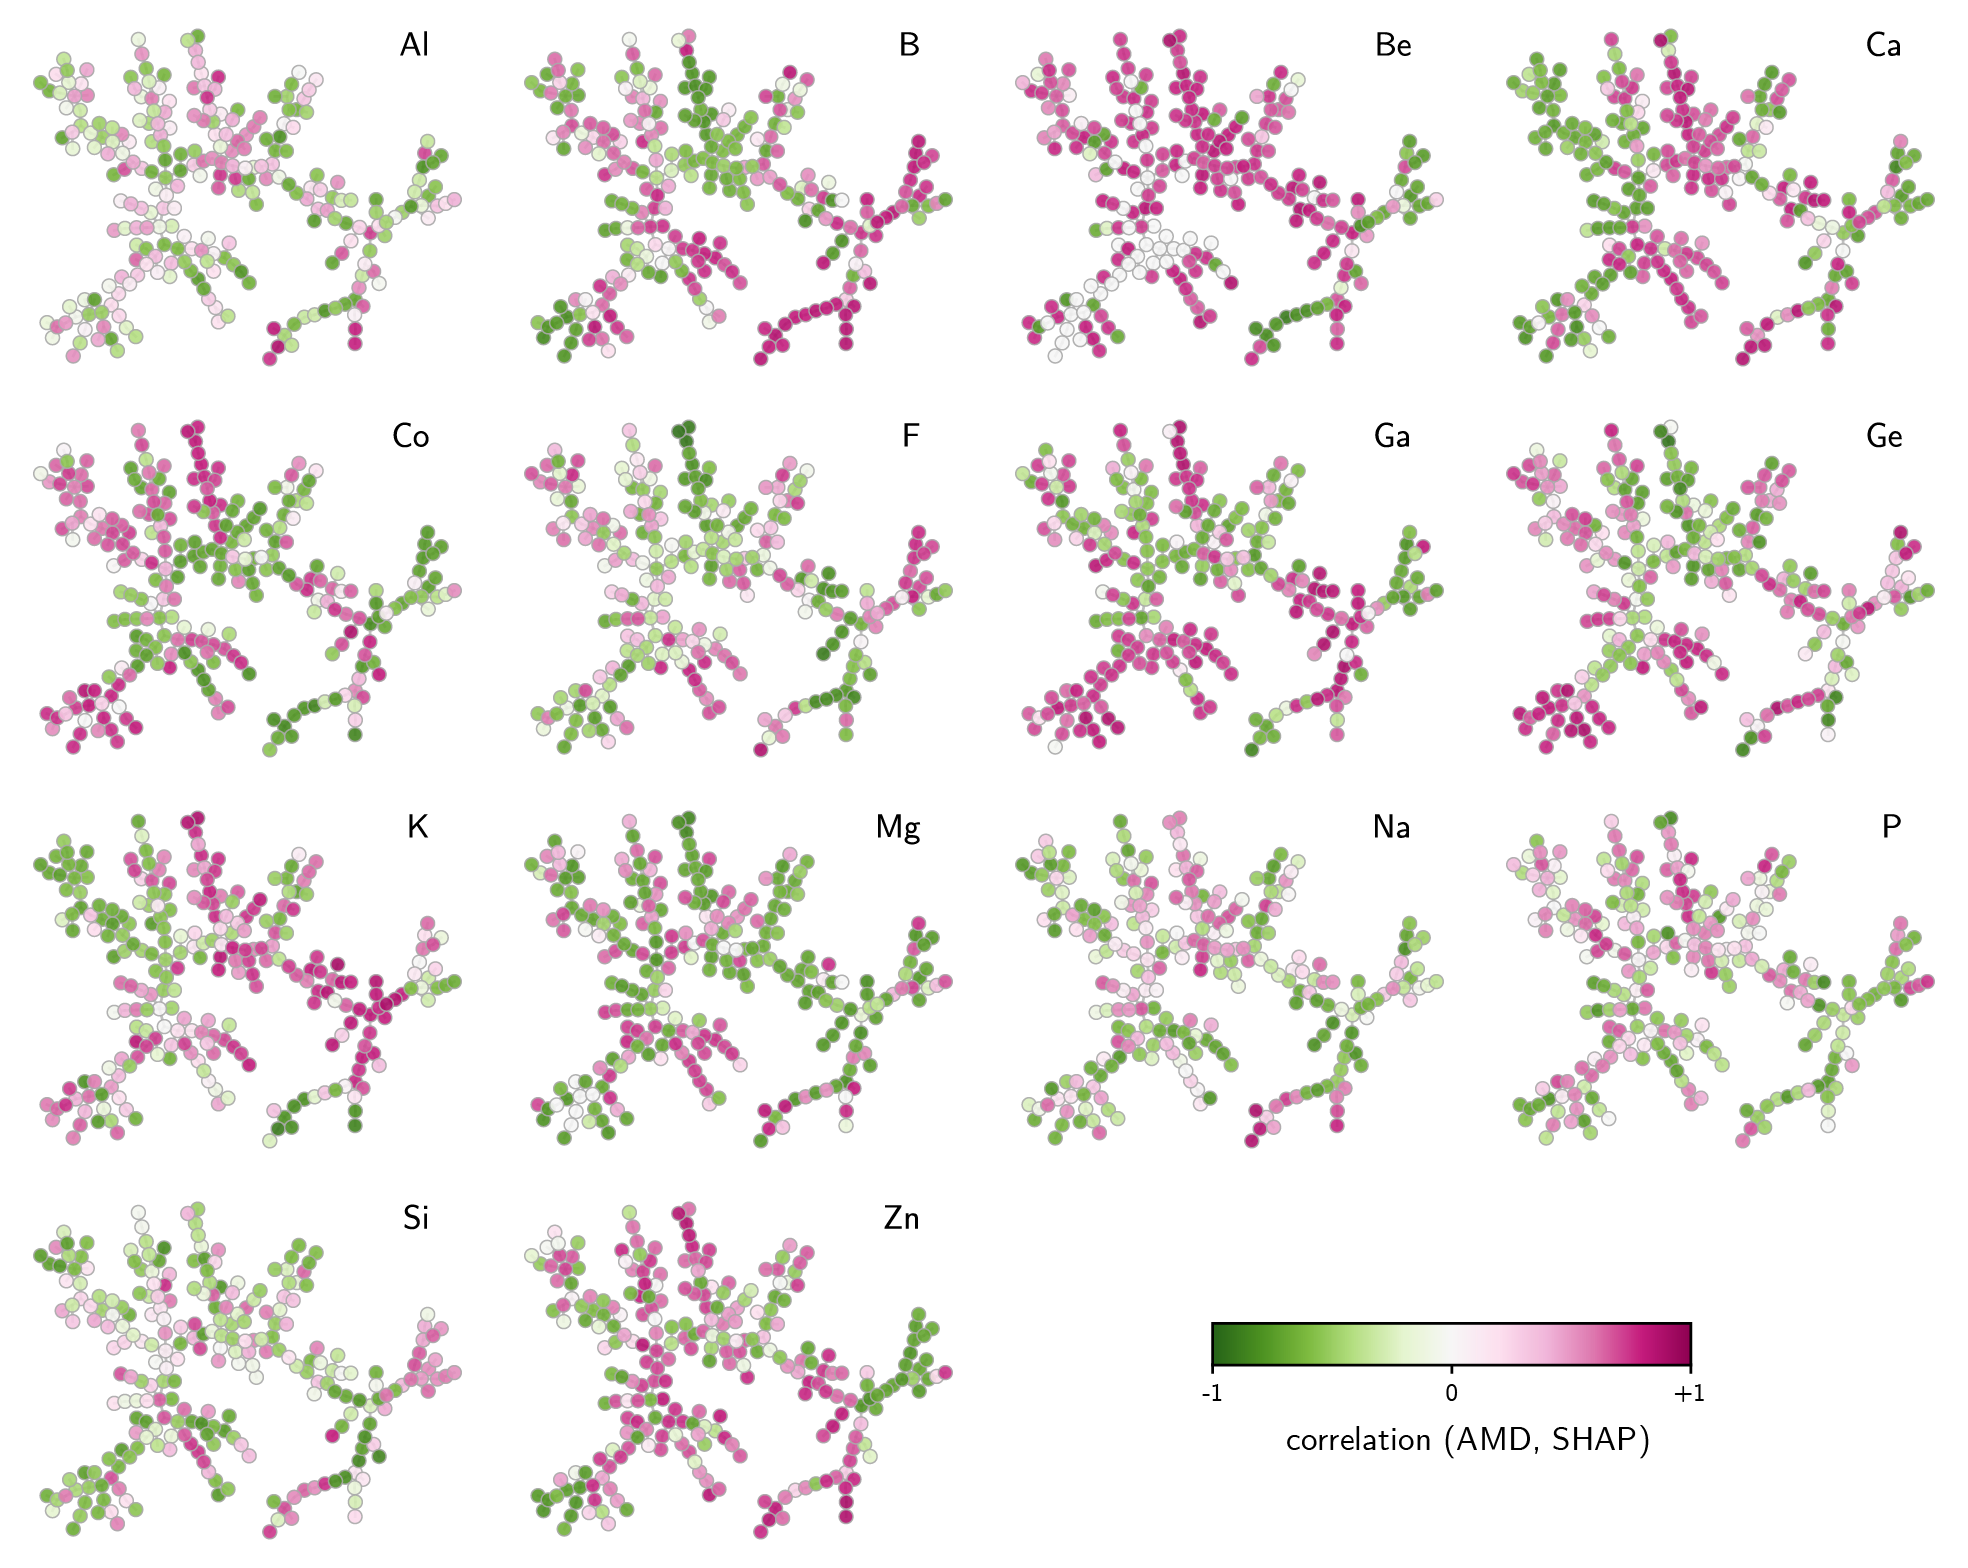
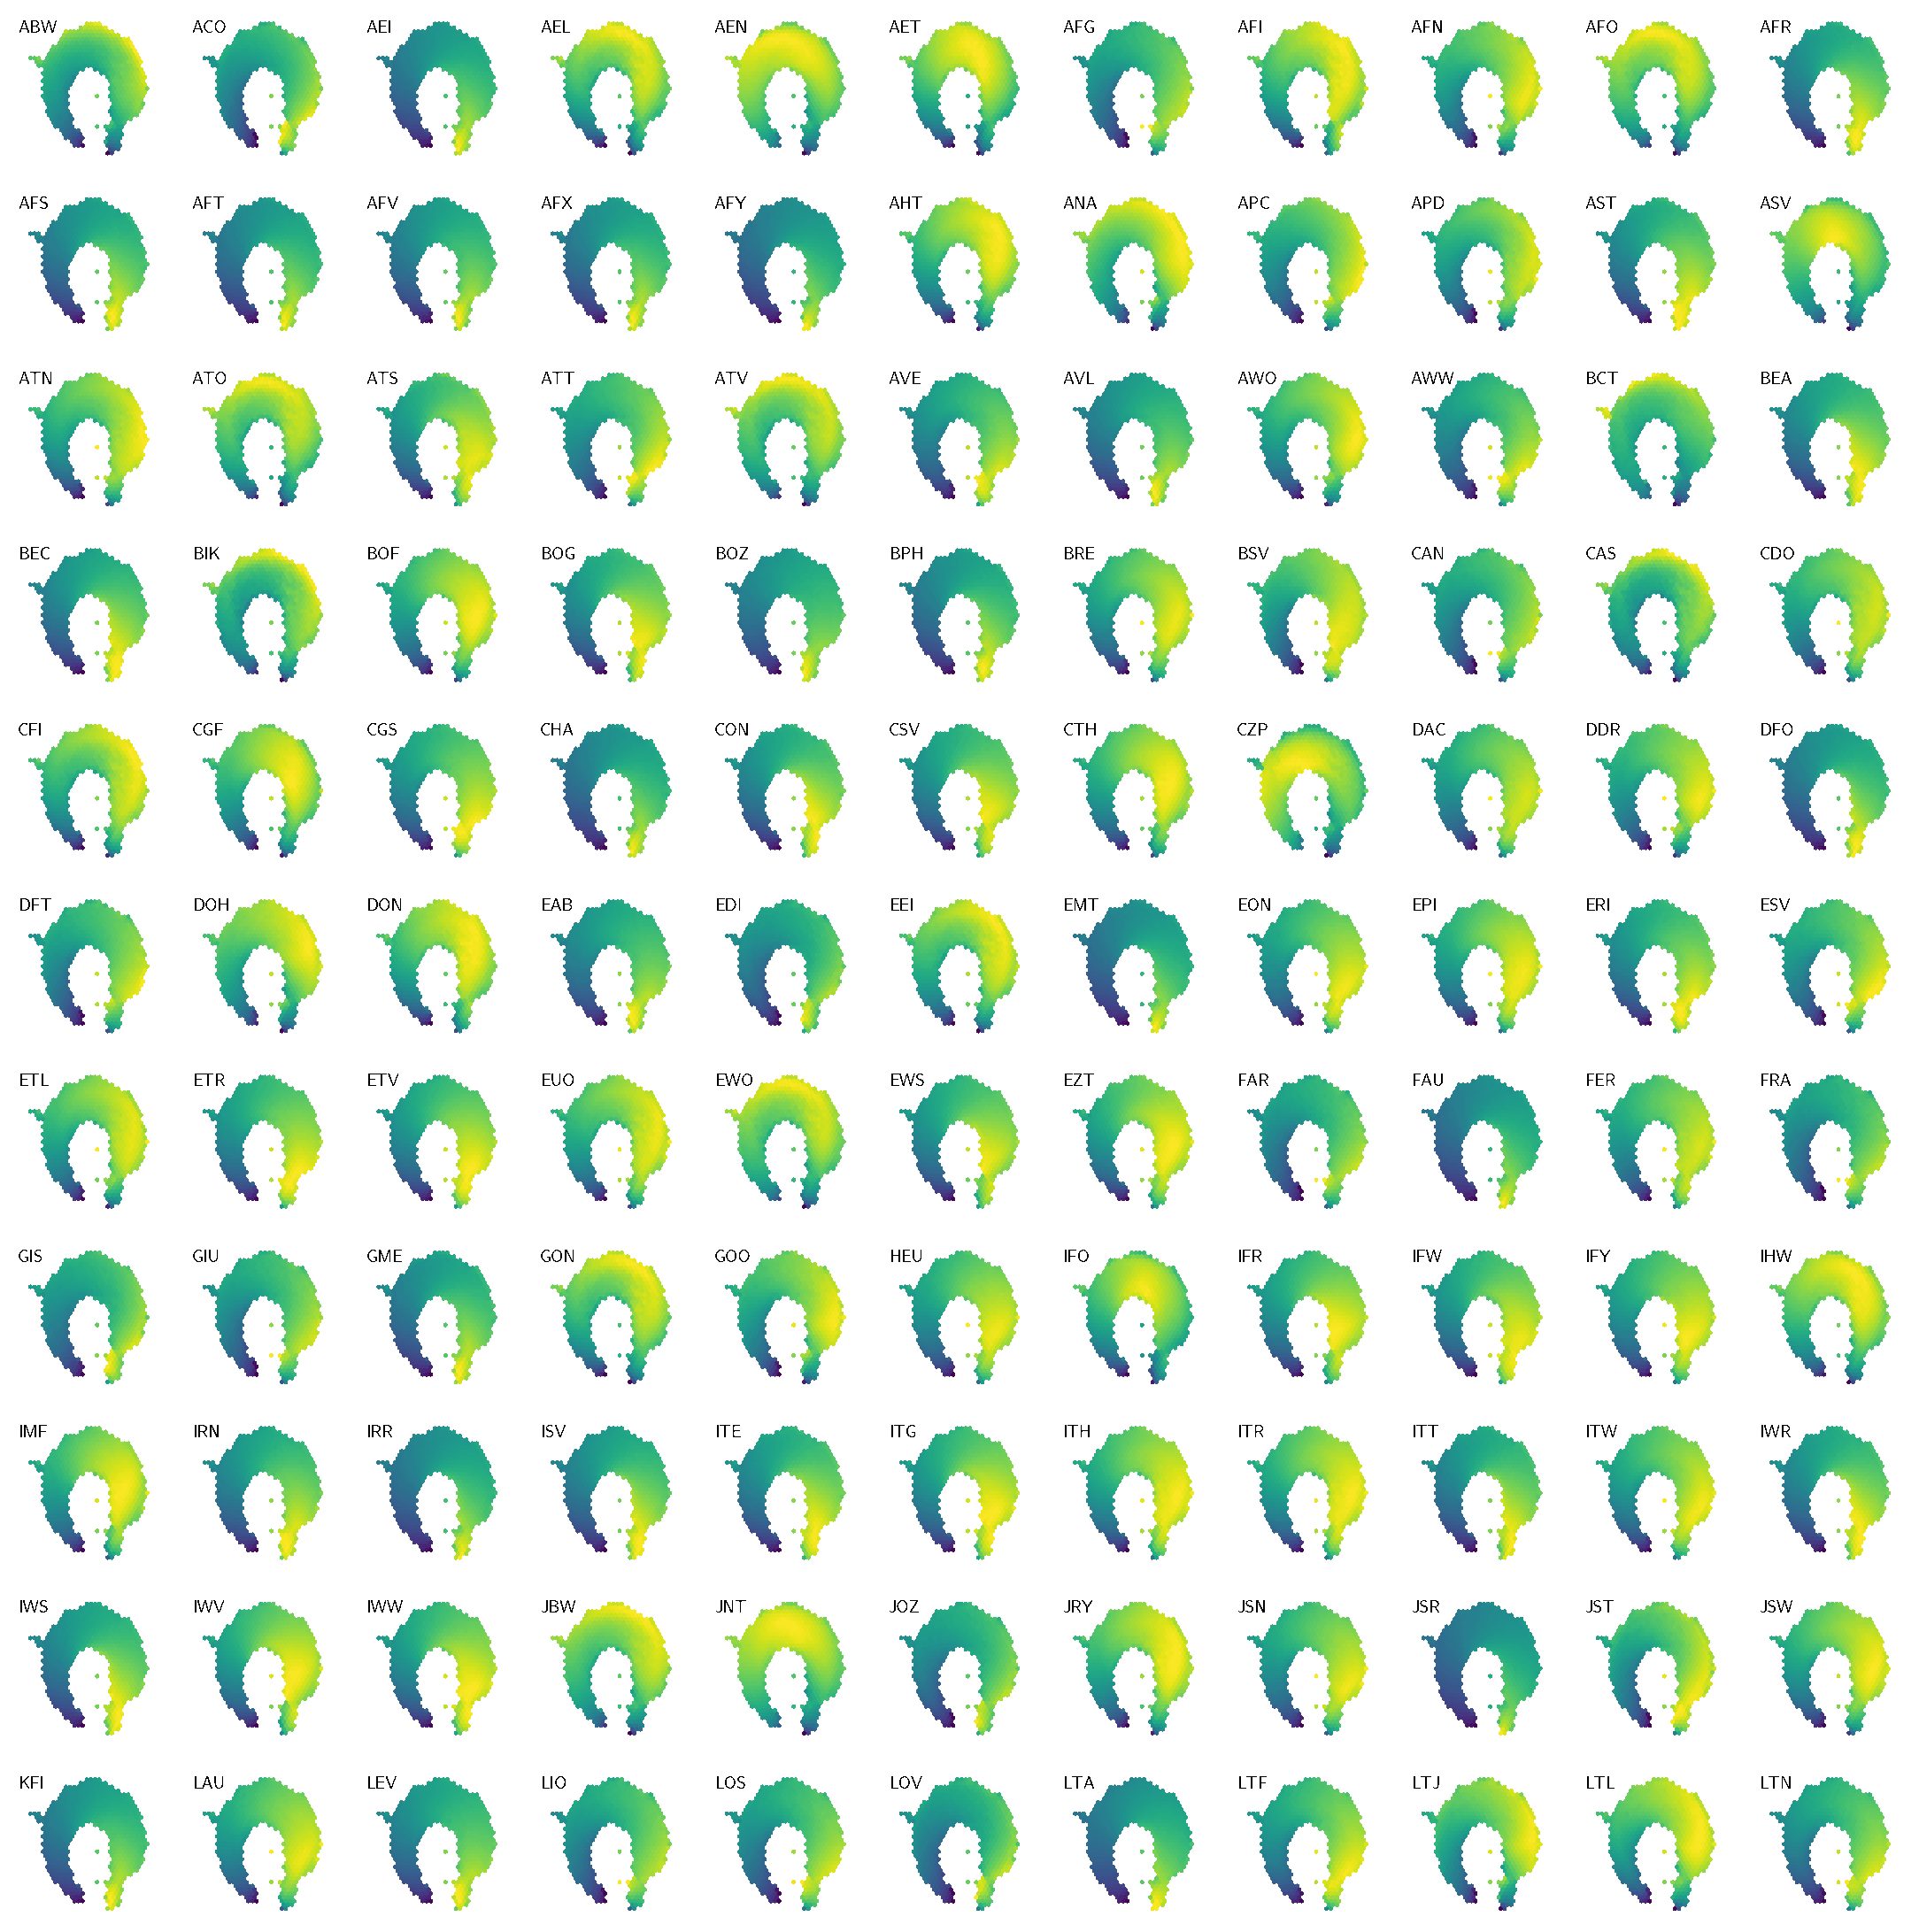
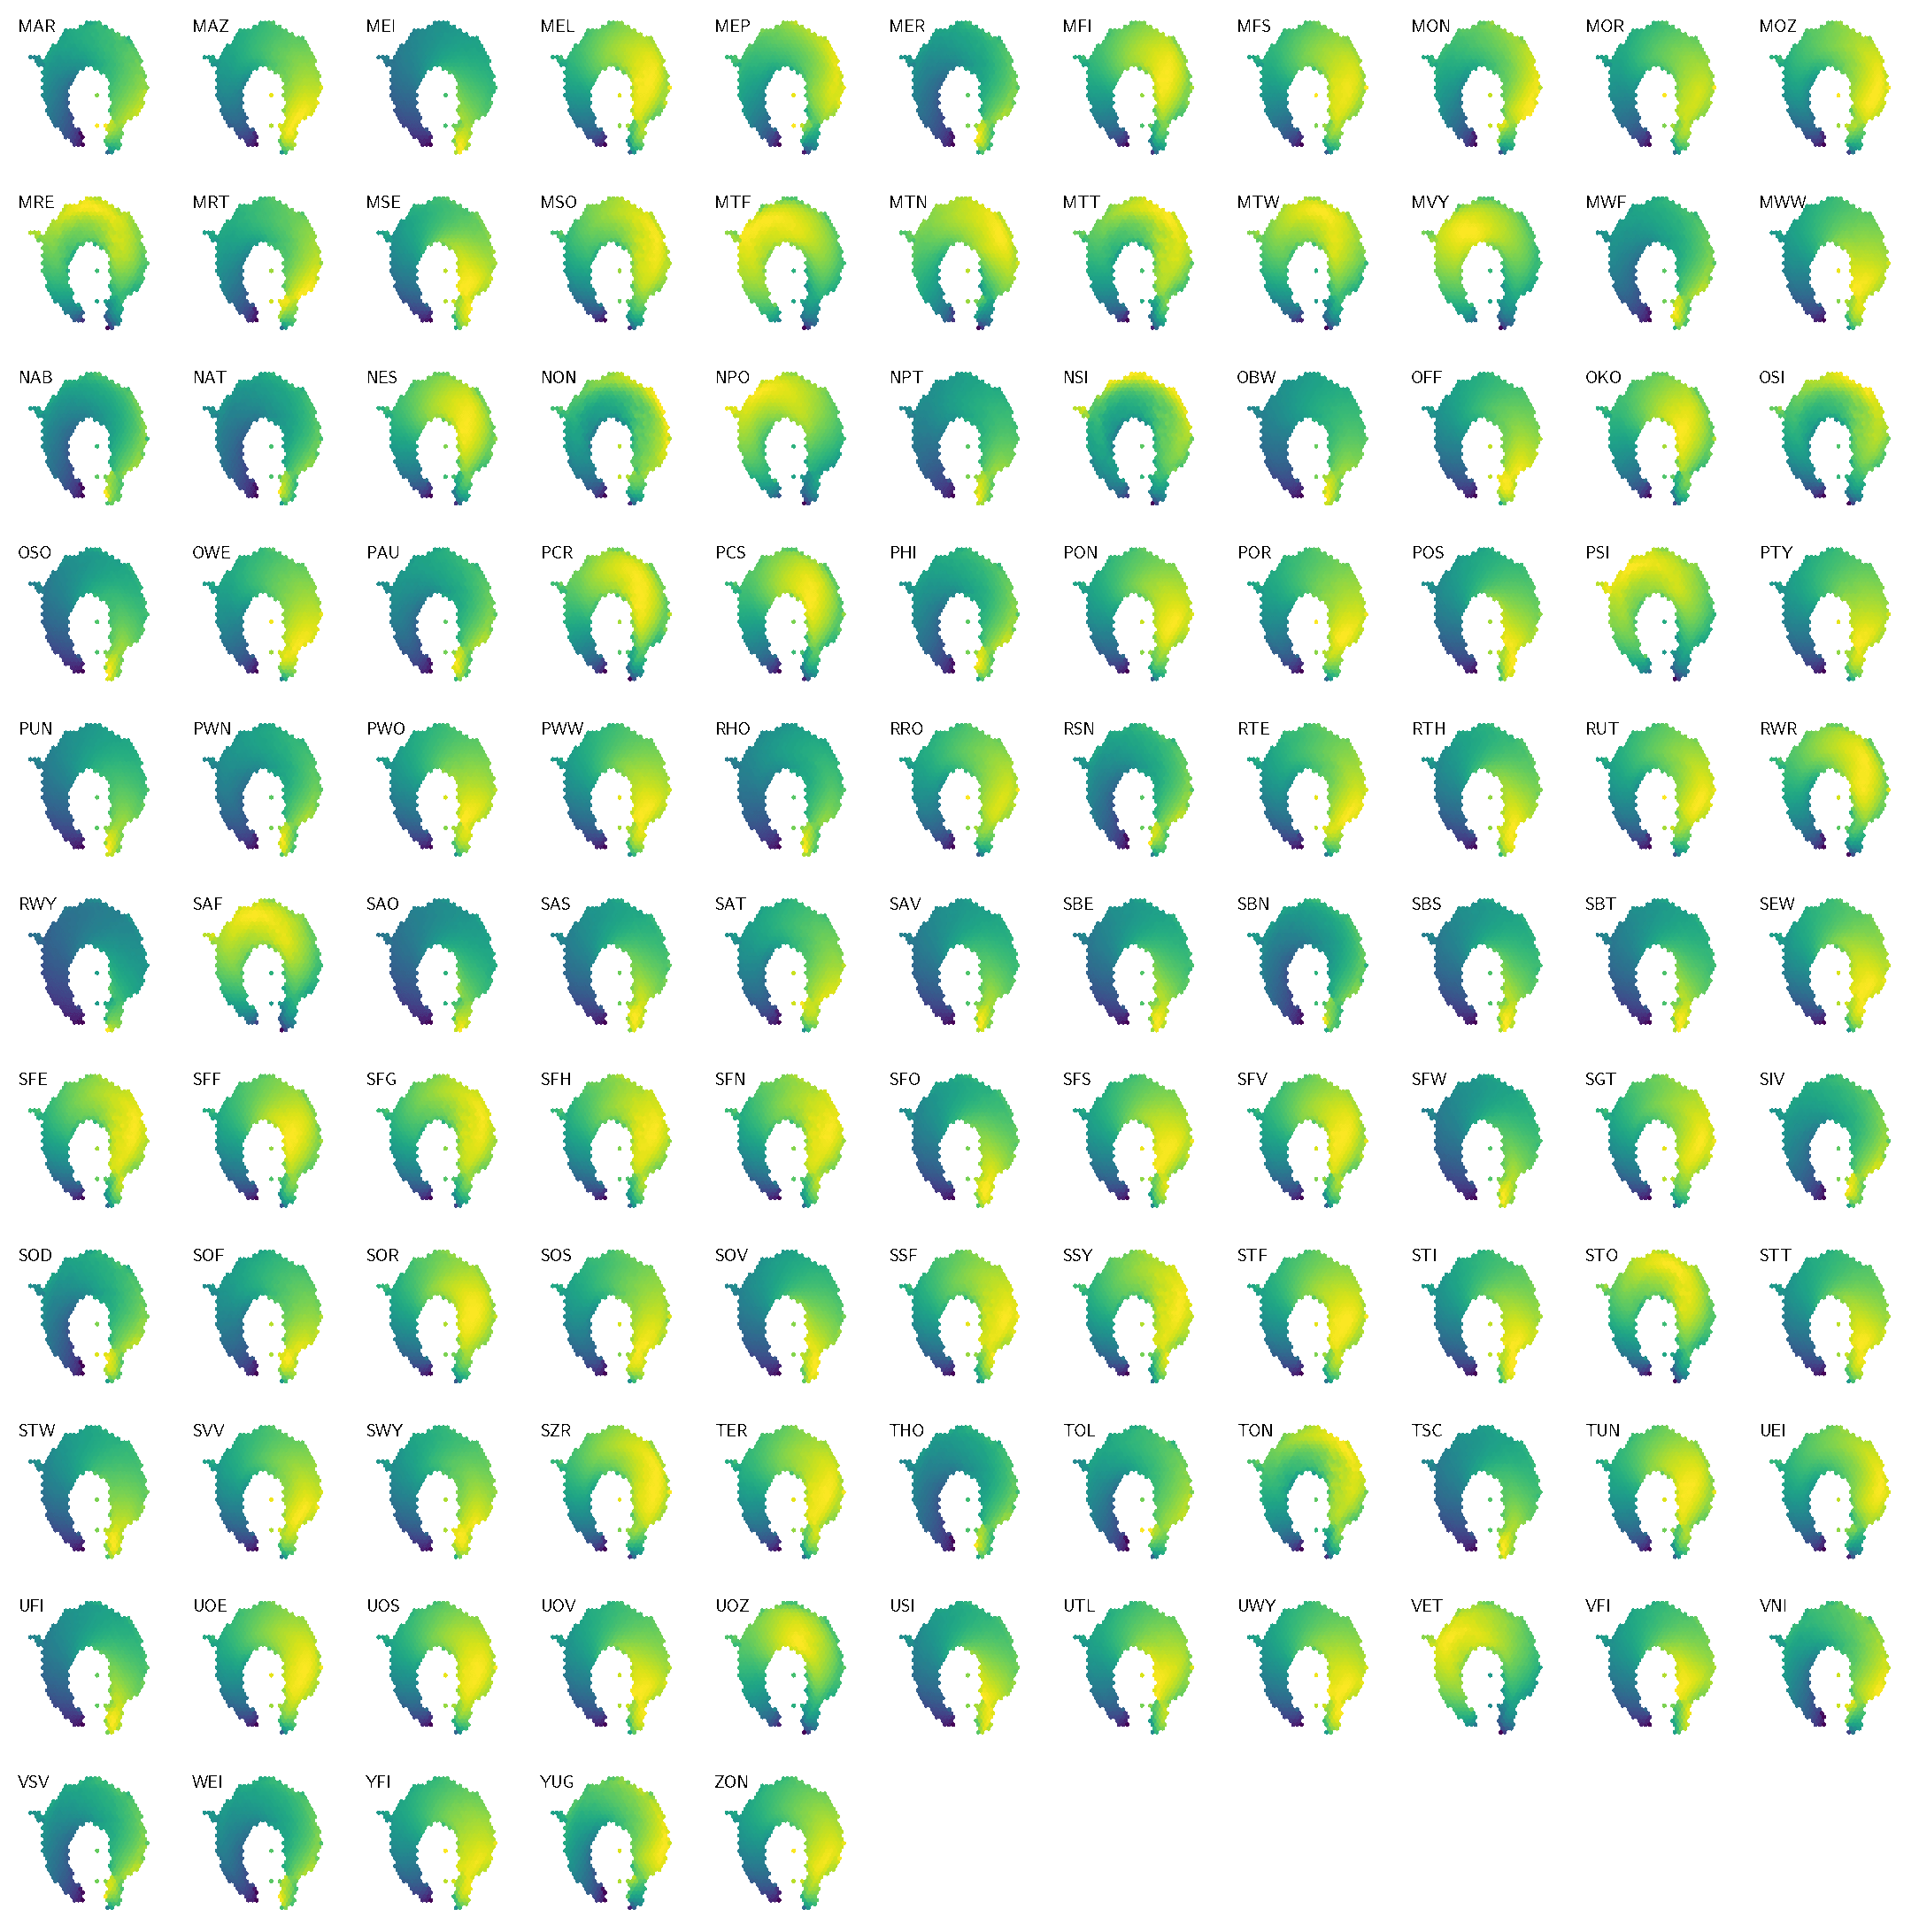
To interpret the outcomes of the classifiers, explainability techniques can be used to probe what features most affect a positive (or negative) classification of a zeolite within certain synthesis conditions. Given that the input features are distances towards known frameworks, a trained classifier decides how to assign a label to an input structure based on its similarity values. Using the Shapley value method (SHAP), we analyze what distances most affect the classification of a zeolite into a given class. As each SHAP value indicates how much each feature affects the probability of classifying a framework into a given class, we compute the Pearson correlation coefficient between the actual feature value and the SHAP value for each one of the inorganic synthesis conditions. This quantifies whether being close to a particular framework (feature) increases or decreases the likelihood of being assigned a positive label. The results for the interpretability of XGBoost classifiers are shown in Fig. 4b (see also Fig. S12 and S13). As the correlation coefficient between AMD and SHAP values are computed on a per-feature (thus per-zeolite) basis, the nodes from the tree map in Fig. 2 are colored according to these coefficients. In this plot, a negative correlation (in green color) indicates that low distances increase the SHAP value and thus the likelihood of being classified as a positive label. Conversely, a positive correlation (in pink color) with a feature indicates that a given zeolite is more likely to be synthesized with a given synthesis condition if it is distant from the featurizing structure. The results not only support the observations highlighted by the unsupervised learning methods, but also complement them with new insights. For instance, zeolites synthesized with Ca and K have a wide overlap of positive and negative correlations (Fig. S13), possibly due to the clustering of minerals in the tree map. There is also an overlap between boron-containing zeolites and germanium-containing zeolites, especially in the ISV branch. This result could be interesting if validated in practice, especially as the use of boron may enable the removal of Ge from the synthesis of certain zeolites, such as BEC. The central branch characterized by Ge-containing zeolites (such as BEC, ISV, IRR, ITT, see Fig. 2) also have features that correlate with F or Mg, but not Al or Ca. On the other hand, Be-containing zeolites are often complementary to Si-containing zeolites, as the former are found only in specific clusters or outliers in the tree map. This further supports the fact that the classifiers are able to obtain correlations beyond existing heuristics, thus providing data-driven ways to guide inorganic synthesis in zeolites.
2.3 Proposing inorganic synthesis conditions for hypothetical zeolites
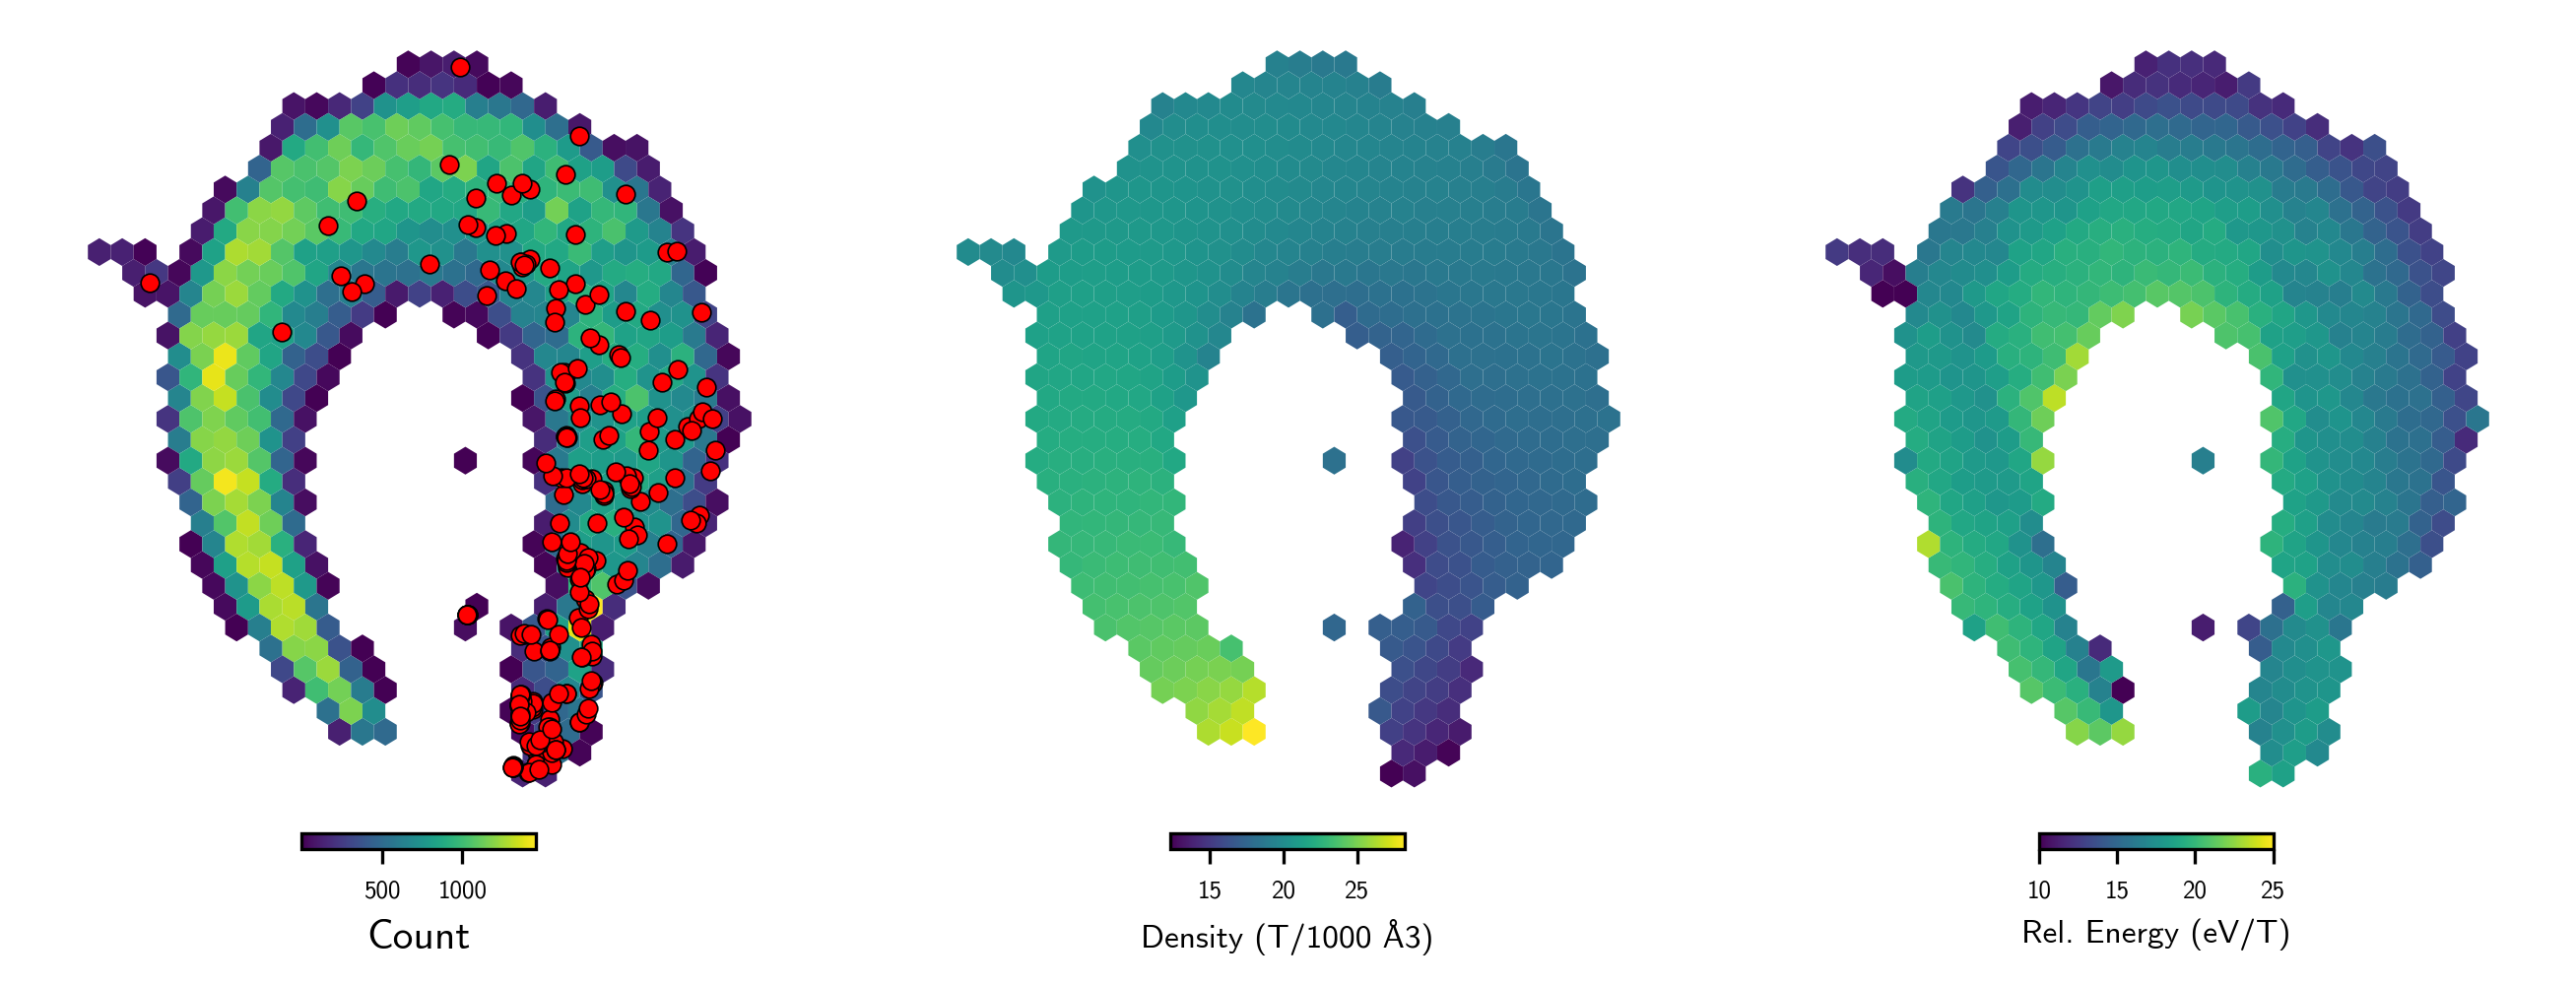
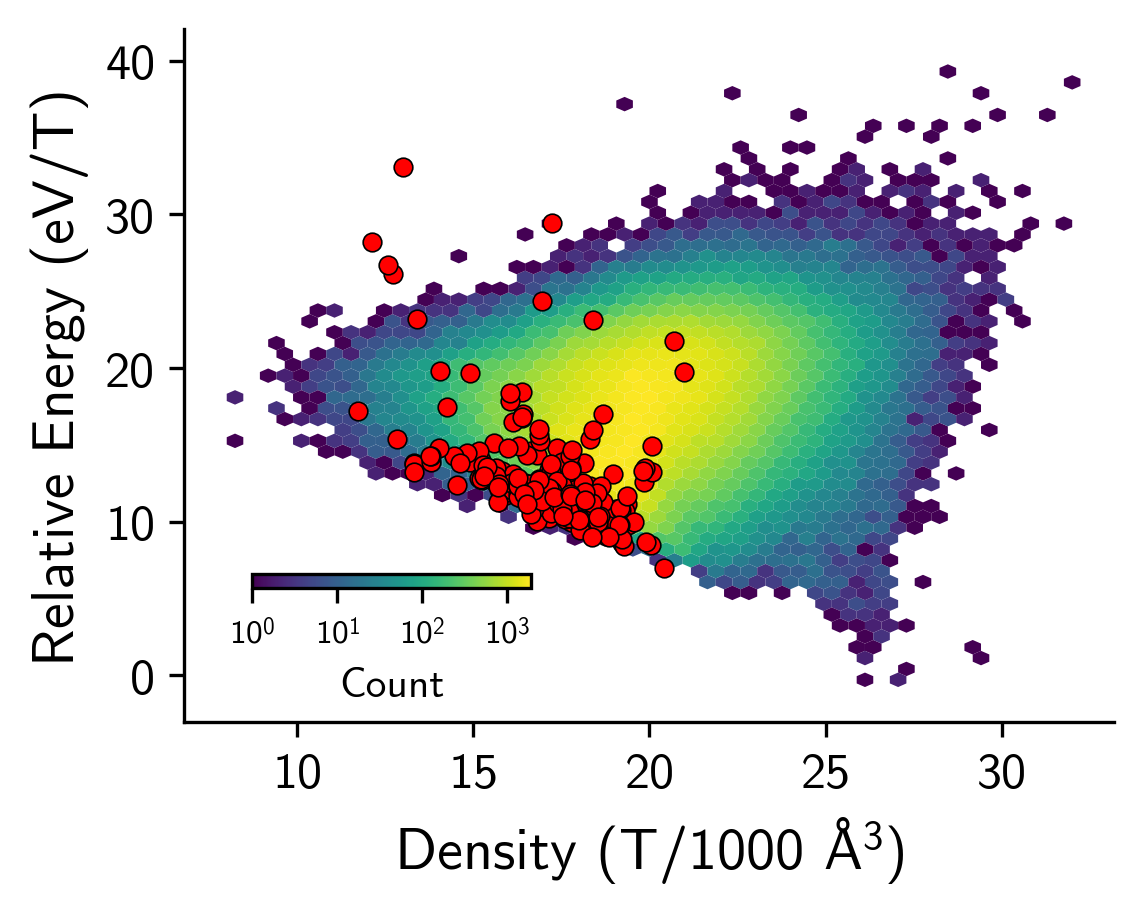
Given that structural similarity is correlated to inorganic synthesis in zeolites and that supervised learning methods are able to predict synthesis using only distances as inputs, we can use the models developed in this work to propose inorganic synthesis conditions for hypothetical zeolites. This approach complements previous work on the design of OSDAs for frameworks, thus enabling inorganic synthesis conditions to be predicted in silico whenever a new framework is proposed. To do that, we used the dataset of 331,171 hypothetical zeolites proposed by Pophale et al. 33, known as the “Deem dataset.” As structural features and densities from the hypothetical zeolites optimized with force fields may deviate from the experimental ones, we used the IZA and hypothetical zeolites from Erlebach et al. 45, which employed a neural network force field trained at the SCAN level of density functional theory calculations to reoptimize the hypothetical zeolites. Then, by comparing the hypothetical structures against all known zeolites, we created a distance matrix that is used as input for the unsupervised and supervised learning methods shown in the previous section. As in the case of known zeolites, AMDs are correlated with differences of density, but are not solely determined by them (Fig. S14). Using AMDs, a low-dimensional map can be created for all hypothetical structures, thus providing an intuitive way to visualize the space of structures. Figure S15 shows a 2D projection of the distribution of hypothetical zeolites based on their distance matrix using UMAP. This plot shows that distance features are able to sort the space of zeolites according to energy and density despite not using this information as explicit inputs. The visualization also illustrates that most hypothetical frameworks do not have neighboring known structures. While 105 of all known zeolites have at least one other known zeolite up to 0.1 Å away (45% of structures, see Fig. S6), only about 36,112 of the 331,171 hypothetical structures have at least one known zeolite as neighbor when the same distance threshold is used (11% of zeolites in the dataset). This illustrates how the space of enumerated zeolites is often populated with structures far from known structural patterns of zeolites, as also demonstrated by previous studies (see also Fig. S16).
As demonstrated in this work, zeolites in the neighborhood of known frameworks are likely to share similar synthesis conditions as those known structures. Thus, downselecting frameworks for given synthesis conditions can benefit from the unsupervised and supervised methods developed here. This approach can be used in combination with previous “synthesizability metrics” of zeolites, such as local interatomic distances 35 or other data-driven predictions 46. However, we chose to evaluate them independently, as these synthesizability predictions do not take into account that certain known frameworks may be considered “unfeasible” depending on the synthesis conditions 47, 34. For instance, structures containing three-connected rings, such as those with building units lov or vsv, could be ranked as “unsynthesizable,” despite being achieved with beryllium or borogermanate conditions. Thus, to propose synthesis conditions for zeolites, we evaluated all hypothetical frameworks for all synthesis conditions using an ensemble of 100 binary classifiers per inorganic condition (see Methods). As each classifier is trained on different negative data splits, the resulting classification varies for each model, allowing us to assess the degree of agreement between the models. By taking the average of the predictions, we obtain the probability of synthesizing the zeolite with that synthesis condition.
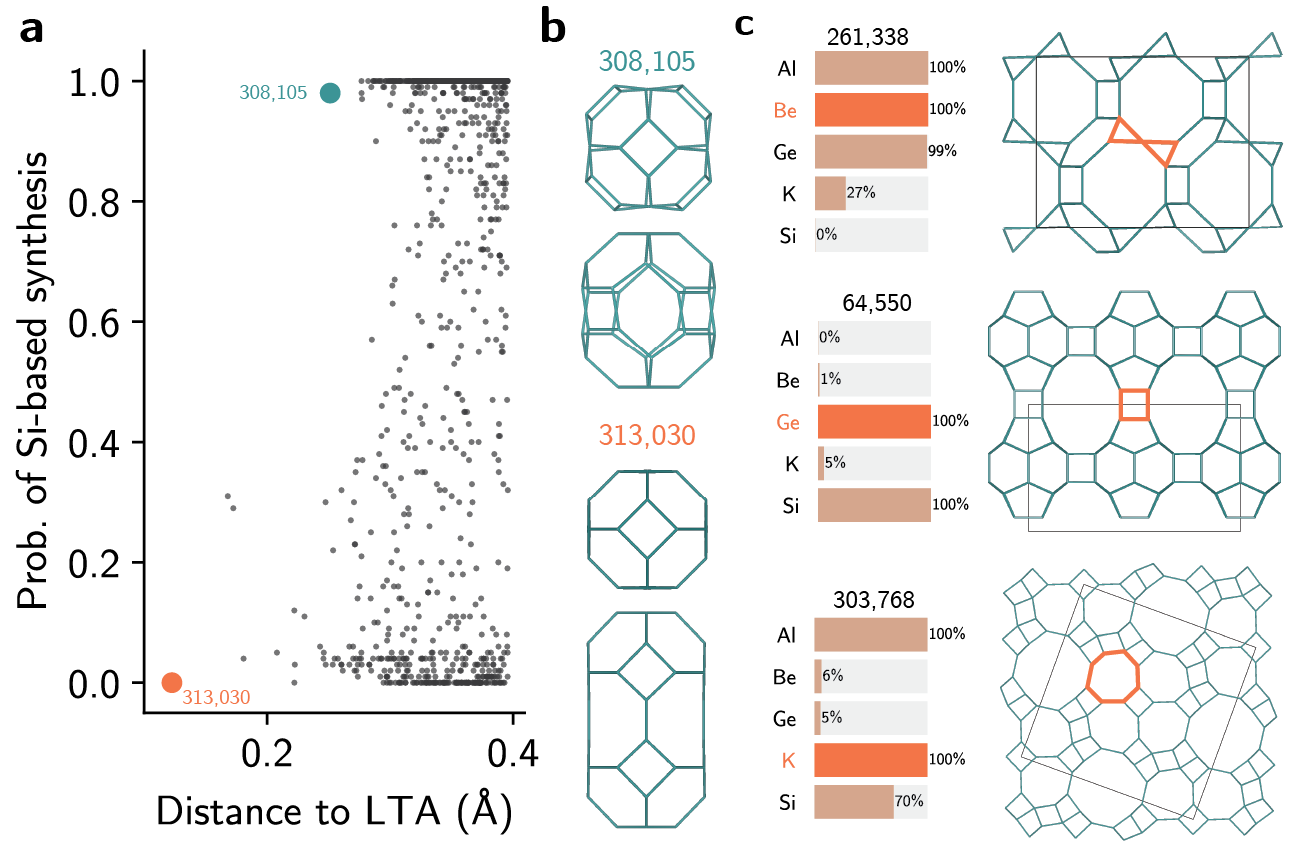
Figure 5a depicts the distribution of hypothetical zeolites with Si-based recipes in the neighborhood of LTA zeolite. As all distances between known and hypothetical zeolites had been already computed, we can use both the distances and the class probabilities as criteria for navigating the space of hypothetical structures. This navigation using reference materials instead of features facilitates the selection process and can also inform their synthesis. For example, Figs. 5a,b illustrate two different hypothetical zeolites in the neighborhood of LTA. Although both have low distance towards LTA (compare with dendrogram in Fig. S6), structure #308,105 is predicted to be more likely to be synthesized as a silicate than #313,030. Both contain the lta and sod cages characteristic of the LTA zeolite, but differ by the presence of a second cage similar to sod, shown in Fig. 5b. Whereas this new building unit resembles an expanded sod cage with distorted six-membered rings in #308,105, hypothetical framework #313,030 shows a new cage, formed by the merging of two sod cages, not seen in known zeolites. This increased distance towards known structural patterns drives the prediction of feasible synthesis using Si as unlikely, even when the distance towards the LTA zeolite is lower. This example shows how the combination of AMD values and classifier predictions facilitates the exploration of hypothetical zeolites using reference structures.
Beyond exploration of the zeolite space, the models also uncover existing and new synthesis-structure relationships. Figure 5c shows three examples of hypothetical frameworks predicted to be synthesized using three different elements: Be, Ge, and K. To obtain these frameworks, we filtered only frameworks within densities of 14 and 17 T/1000 Å3 that are predicted to have 100% probability of synthesis with the given element. Then, we ranked the frameworks by their relative energy. Despite not using explicit labels on the CBUs, the supervised learning models recovered the known heuristics of building units and inorganic synthesis conditions. For instance, framework #261,338, predicted to be synthesized in presence of Be, is formed mostly by lov building units, as found in other Be-zeolites such as RSN, LOV, or NAB. This same framework is predicted to be unlikely as a silicate, possibly following the trends seen in JSR or NPT structures. Hypothetical zeolite #64,550, predicted to be synthesized with germanium, also shows features similar to known ones. In addition to its three-dimensional pore structure, with intersecting pores, the structure shows the d4r CBU typical of other structurally similar germanosilicates, such as POS or UOV, but with 7 symmetrically inequivalent T sites. Finally, one unrealized framework predicted to be synthesized with potassium is structure #303,768. Although this hypothetical structure does not exhibit typical CBUs, the local structures similar to d8r CBUs are predicted to be favored by K, in analogy with similar relationships in known zeolites. This demonstrates how data-driven models can not only recover known relationships between CBUs and inorganic conditions, but also propose new synthesis-structure relationships in zeolites based on distance patterns towards known structures. When used to analyze the entire space of hypothetical frameworks, the models show that the distribution of predicted inorganic synthesis conditions is uneven across the space of zeolites (Fig. S19). For instance, whereas about 27% of all known zeolites can be synthesized with germanium, according to the literature dataset we used in this work, only 8% of the hypothetical zeolites have probability of being synthesizable under Ge conditions of at least 80%. Similarly, the space of hypothetical structures is surprisingly lacking in structures predicted to be synthesizable with sodium. While about 45% of all known structures have at least one sodium-based synthesis, 17% of hypothetical structures are predicted to be realizable with Na given the 80% threshold probability. As most enumerated datasets are often created without considering synthesis conditions 48, comprehensive enumerations may introduce biases in structures that do not reflect the space of zeolite synthesis typically considered in practice. Thus, in combination with template design 17 and property screening 49, 50, our methods to predict inorganic synthesis conditions in zeolites may help in synthesizing unrealized frameworks with targeted properties.
3 Conclusions
Mapping the space of inorganic conditions in materials synthesis is an outstanding challenge due to the complexity of chemical interactions during synthesis. In the case of zeolites, synthesis conditions are known to affect structural patterns in the materials, but finding correlations between structural patterns and inorganic syntheses often relies on heuristics. In this work, we used unsupervised and supervised learning methods to propose inorganic synthesis conditions for zeolite synthesis. In particular, we showed how a mathematically strong distance metric between crystals can predict inorganic synthesis conditions in zeolites. This enables structural comparisons beyond human-crafted labels of building units or pore sizes/topologies. Clustering techniques demonstrate that our metric consistently recalls the inorganic synthesis conditions from literature datasets, thus providing predictive power even in the absence of labels. Then, we show that ML classifiers can predict synthesis conditions of a given framework based on its distribution of distances towards known structures. The classifiers were used to predict 14 different synthesis conditions for known and unrealized zeolites. When explaining the predictions, we showed how ML classifiers analyze synthesis conditions also from the dissimilarity between crystals, as well as from the similarity. The results from the explainability analysis reveals overlaps in inorganic synthesis conditions, such as boron and germanium, as well as complementary relationships, such as silicon and beryllium. Finally, we showcased how our methods can be used to predict inorganic synthesis conditions for hypothetical zeolites, facilitating the downselection of new structures for experimental attempts. This combination of data-driven methods can create a pathway for full in silico prediction of zeolite synthesis beyond the design of organic templates.
4 Methods
4.1 Pointwise Distance Distributions and Average Minimum Distances
Any periodic crystal structure is modeled as a periodic set of atomic centers considered as zero-sized points, with atomic types as optional labels. Any linear basis of vectors in 3-dimensional space generates a lattice and unit cell . Any finite motif of points defines the periodic point set . This conventional representation of a periodic crystal by a unit cell and a motif is ambiguous because infinitely many different pairs (cell, motif) generate periodic sets that are equivalent up to rigid motion (a composition of translations and rotations). Fixing any reduced cells leads to unavoidable discontinuities 51 even for 2-dimensional lattices.
The ambiguity of crystal representations was theoretically resolved for all periodic point sets in any dimension by the complete isoset 52 invariant. We define below the computationally faster Pointwise Distance Distribution (PDD) invariant, which distinguished all (more than 670,000) periodic crystals in the Cambridge Structural Database (CSD) through more than 200 billion pairwise comparisons within two days on a typical desktop computer.
Fix a number of atomic neighbors. Our experiments on zeolites and the CSD used . Let be a periodic set with a motif of points . For each point , write down the sequence of increasing distances to its nearest neighbors in the full infinite set without considering any extended cell or cut-off radius. Collect these sequences of distances into an matrix and lexicographically order the rows. If any of the rows coincide (usually due to extra symmetries), collapse them into a single row with the weight and put these weights into an additional first column (unique rows have weight ). The resulting matrix is called the Pointwise Distance Distribution, a statistical distribution of rows with weights describing each point’s environment. As an example, Fig. 6 shows the computation for a point in the square lattice whose first neighbours have distances (in green) and (in blue).

The Average Minimum Distance is the vector obtained by taking the weighted average of the last columns in , so is a single vector of average distances. To compare two AMD vectors of the same length, our experiments used the metric equal to the maximum absolute difference of corresponding coordinates. For a metric on PDDs, we use the Earth Mover’s Distance (EMD)53 with the metric on rows. If any point of is perturbed in its -neighborhood, then changes by at most in the EMD metric. If a periodic set is generic, which is achievable by almost any perturbation of atoms, then can be reconstructed from the number of motif points, a (basis of a) lattice and with a known upper bound on . For the details on these results, see Definition C5 and proofs of Theorems 4.3 and 4.4 in the extended version of Ref. 54.
4.2 Zeolite structures data
The dataset of 253 known zeolite structures used in the unsupervised learning method was obtained from the International Zeolite Association (IZA) database 55. The dataset of hypothetical frameworks used in this work was developed by Pophale et al. 33, and re-optimized using a neural network force field trained on DFT-SCAN data by Erlebach et al. 45. Because not all of the 253 known zeolites used previously were optimized by Erlebach et al., we used their subset of 236 known frameworks when computing distance matrices from the hypothetical frameworks and the known frameworks.
Following the notation from the IZA, known zeolites are named in this manuscript according to their three-letter code in bold typeface. Known CBUs are represented with their three-letter code in lowercase and italic typeface.
4.3 Literature data
Literature data was obtained from public datasets of zeolite synthesis conditions from Jensen et al. 43, which has been validated by Schwalbe-Koda et al. for the computational design of OSDAs 17. Whereas in those works only zeolite-OSDA pairs were considered, in this work only relationships between zeolites and non-organic synthesis conditions are analyzed. As the dataset was produced by collecting literature data from over 60 years of studies in synthetic zeolites, several natural frameworks were omitted from the table, as well as newer structures not captured at the time of this study. To address this problem, we manually inserted new rows on the table with the composition of the missing structures. The compositions were obtained with manual verification of the synthesis conditions in articles describing the mineral/synthetic zeolite, as also shown in the online IZA database. The resulting, cleaned data used in this study is available for download (see Code and Data Availability).
In the literature analysis, a zeolite is classified as having a certain synthesis condition when at least 25% of its synthesis recipes exhibit that condition (excluding OSDAs). This label is used as a categorical variable when performing the classification task.
4.4 Unsupervised learning
A minimum spanning tree between zeolites was constructed by first creating a fully connected, undirected graph with weighted edges, where weights correspond to the distances between two structures. The tree was then obtained using NetworkX’s (v. 2.5) 56 minimum spanning tree algorithm, which minimizes the total length of the tree.
The dendrogram of known zeolites was produced by creating a linkage matrix from the distance matrix using the Ward algorithm as implemented in SciPy (v. 1.10.0) 57. The resulting clusters in Fig. S6 were obtained by forming flat clusters with maximum AMD distance of a given threshold.
The homogeneity of the clustering was computed by calculating the Shannon entropy of flat clusters created with a given threshold 44, as implemented in scikit-learn (v. 1.2.0) 58. As the literature dataset is not balanced and lack true negative points, the homogeneity was only computed for clusters containing at least one positive data point. This ensures that a large homogeneity corresponds to recall of positive data points, which prevents biasing this metric in imbalanced datasets.
Dimensionality reduction was performed using UMAP 59, as implemented in the umap-learn package in Python (v. 0.5.3). The 2D UMAP plot was produced by comparing hypothetical frameworks using the cosine distance of their normalized distances to IZA structures, and using 10 neighbors as parameter.
4.5 Supervised learning
Classification of inorganic synthesis conditions was performed by training separate classifiers for each synthesis condition. The features used during training were the distances towards the 253 known frameworks, as computed with the AMD method described above. To obtain a statistically meaningful result, only elements used to synthesize at least 10 zeolites were considered. In particular, 14 inorganic conditions are considered: Al, B, Be, Ca, Co, F, Ga, Ge, K, Mg, Na, P, Si, and Zn.
Train-validation-test sets were created starting with a 60-20-20 ratio, respectively, then subsampling the training set to have an equal number of points with positive and negative labels. Although techniques such as reweighting or resampling could have been employed to obtained balanced training sets, removing data points is a simple approach that prevents classifiers from treating negative data as “true negative”, resembling positive-unlabeled learning strategies.
Hyperparameter optimization of synthesis classifiers was performed using a grid-search method over relevant spaces of hyperparameters for logistic regression, random forest, and XGBoost 60 methods. The full range of hyperparameters investigated in this hyperparameter search is shown in Tables S2, S3 and S4, following the notation in the scikit-learn (v. 1.2.0) and xgboost (v. 1.7.5) Python packages. Model performances were compared using the same dataset splits, and the best model is selected according to its validation performance. The results on the paper showcase the performance on held-out test data.
One of the best models to classify synthesis conditions of zeolites was the XGBoost model with the following hyperparameters: colsample_bytree = 0.5, learning_rate = 0.1, max_depth = 6, min_child_weight = 1, n_estimators = 200, subsample = 0.5. This model and set of hyperparameters showed good performance across a range of inorganic synthesis conditions, as evaluated by the accuracy, precision, recall, F1 score, area under the receiving operator characteristic curve (ROC AUC), and area under the precision-recall curve (PR AUC). In particular, the best model was selected to maximize the ROC AUC and PR AUC for the balanced classifiers. As a comparison, the performance metrics and their baselines of unbalanced classifiers — thus trained on dataset splits with an uneven number of positive/negative labels — are shown in Fig. S10.
Explainability of the classifiers was computed using the Shapley value method (SHAP) 61 under the TreeExplainer framework 62, as implemented in the shap Python package (v. 0.41.0). The interventional feature perturbation method was used without limit for the tree explainer. Then, correlations between the SHAP values and the distance features were computed for each synthesis condition. To ensure that the correlations are not artifacts of particular train splits, we report the average correlation obtained from an ensemble of 100 XGBoost classifiers trained on splits with different negative data points.
This work was performed under the auspices of the U.S. Department of Energy by Lawrence Livermore National Laboratory (LLNL) under Contract DE-AC52-07NA27344. D.S.-K. acknowledges funding from the Laboratory Directed Research and Development (LDRD) Program at LLNL under project tracking code 22-ERD-055, and under the Postdoctoral Development Program. T.A.P. acknowledges funding from the Center for Enhanced Nanofluidic Transport (CENT), an Energy Frontier Research Center funded by the U.S. Department of Energy, Office of Science, Basic Energy Sciences under Award DE-SC0019112. D.E.W. and V.A.K. acknowledge funding from the EPSRC (EP/R018472/1, EP/X018474/1) and Royal Academy of Engineering (IF2122/186) in the UK.
Manuscript released as LLNL-JRNL-851183.
Data and Code Availability
The code to compute PDDs and AMDs for arbitrary crystal structures is available on GitHub at https://github.com/dwiddow/average-minimum-distance. The code and data required to reproduce all results and figures in this manuscript will be available after peer-review.
References
- Davis 2002 Davis, M. E. Ordered porous materials for emerging applications. Nature 2002, 417, 813–821
- Čejka et al. 2007 Čejka, J., van Bekkum, H., Corma, A., Schueth, F., Eds. Introduction to Zeolite Science and Practice, 3rd ed.; Studies in Surface Science and Catalysis 168; Elsevier: Amsterdam ; Boston, 2007; OCLC: ocn163318390
- Vermeiren and Gilson 2009 Vermeiren, W.; Gilson, J.-P. Impact of Zeolites on the Petroleum and Petrochemical Industry. Topics in Catalysis 2009, 52, 1131–1161
- Li et al. 2017 Li, Y.; Li, L.; Yu, J. Applications of Zeolites in Sustainable Chemistry. Chem 2017, 3, 928–949
- Li and Yu 2021 Li, Y.; Yu, J. Emerging Applications of Zeolites in Catalysis, Separation and Host–Guest Assembly. Nature Reviews Materials 2021,
- Dusselier and Davis 2018 Dusselier, M.; Davis, M. E. Small-Pore Zeolites: Synthesis and Catalysis. Chemical Reviews 2018, 118, 5265–5329
- Corma 2004 Corma, A. In Studies in Surface Science and Catalysis; van Steen, E., Claeys, I., Callanan, L., Eds.; Elsevier B.V., 2004; Vol. 154 A; pp 25–40
- Cundy and Cox 2003 Cundy, C. S.; Cox, P. A. The Hydrothermal Synthesis of Zeolites: History and Development from the Earliest Days to the Present Time. Chemical Reviews 2003, 103, 663–701
- Lobo et al. 1995 Lobo, R. F.; Zones, S. I.; Davis, M. E. Structure-Direction in Zeolite Synthesis. Journal of Inclusion Phenomena and Molecular Recognition in Chemistry 1995, 21, 47–78
- Barrer 1981 Barrer, R. M. Zeolites and Their Synthesis. Zeolites 1981, 1, 130–140
- Brand et al. 2017 Brand, S. K.; Schmidt, J. E.; Deem, M. W.; Daeyaert, F.; Ma, Y.; Terasaki, O.; Orazov, M.; Davis, M. E. Enantiomerically Enriched, Polycrystalline Molecular Sieves. Proceedings of the National Academy of Sciences of the United States of America 2017, 114, 5101–5106
- Gallego et al. 2017 Gallego, E. M.; Portilla, M. T.; Paris, C.; León-Escamilla, A.; Boronat, M.; Moliner, M.; Corma, A. ”Ab Initio” Synthesis of Zeolites for Preestablished Catalytic Reactions. Science 2017, 355, 1051–1054
- Lewis et al. 1996 Lewis, D. W.; Willock, D. J.; Catlow, C. R. A.; Thomas, J. M.; Hutchings, G. J. De novo design of structure-directing agents for the synthesis of microporous solids. Nature 1996, 382, 604–606
- Sastre et al. 2005 Sastre, G.; Cantin, A.; Diaz-Cabañas, M. J.; Corma, A. Searching Organic Structure Directing Agents for the Synthesis of Specific Zeolitic Structures: An Experimentally Tested Computational Study. Chemistry of Materials 2005, 17, 545–552
- Schmidt et al. 2015 Schmidt, J. E.; Deem, M. W.; Lew, C.; Davis, T. M. Computationally-Guided Synthesis of the 8-Ring Zeolite AEI. Topics in Catalysis 2015, 58, 410–415
- Davis et al. 2016 Davis, T. M.; Liu, A. T.; Lew, C. M.; Xie, D.; Benin, A. I.; Elomari, S.; Zones, S. I.; Deem, M. W. Computationally Guided Synthesis of SSZ-52: A Zeolite for Engine Exhaust Clean-Up. Chemistry of Materials 2016, 28, 708–711
- Schwalbe-Koda et al. 2021 Schwalbe-Koda, D.; Kwon, S.; Paris, C.; Bello-Jurado, E.; Jensen, Z.; Olivetti, E.; Willhammar, T.; Corma, A.; Román-Leshkov, Y.; Moliner, M.; Gómez-Bombarelli, R. A Priori Control of Zeolite Phase Competition and Intergrowth with High-Throughput Simulations. Science 2021, 374, 308–315
- Schwalbe-Koda et al. 2021 Schwalbe-Koda, D.; Corma, A.; Román-Leshkov, Y.; Moliner, M.; Gómez-Bombarelli, R. Data-driven design of biselective templates for intergrowth zeolites. The Journal of Physical Chemistry Letters 2021, 12, 10689–10694
- Bello-Jurado et al. 2022 Bello-Jurado, E.; Schwalbe-Koda, D.; Nero, M.; Paris, C.; Uusimäki, T.; Román-Leshkov, Y.; Corma, A.; Willhammar, T.; Gómez-Bombarelli, R.; Moliner, M. Tunable CHA/AEI zeolite intergrowths with A priori biselective organic structure-directing agents: controlling enrichment and implications for selective catalytic reduction of NOx. Angewandte Chemie International Edition 2022, 61, e202201837
- Di Iorio et al. 2020 Di Iorio, J. R.; Li, S.; Jones, C. B.; Nimlos, C. T.; Wang, Y.; Kunkes, E.; Vattipalli, V.; Prasad, S.; Moini, A.; Schneider, W. F.; Gounder, R. Cooperative and Competitive Occlusion of Organic and Inorganic Structure-Directing Agents within Chabazite Zeolites Influences Their Aluminum Arrangement. Journal of the American Chemical Society 2020, 142, 4807–4819
- Shin et al. 2019 Shin, J.; Jo, D.; Hong, S. B. Rediscovery of the Importance of Inorganic Synthesis Parameters in the Search for New Zeolites. Acc. Chem. Res. 2019, 52, 1419–1427
- Li et al. 2023 Li, X.; Han, H.; Evangelou, N.; Wichrowski, N. J.; Lu, P.; Xu, W.; Hwang, S.-J.; Zhao, W.; Song, C.; Guo, X., et al. Machine learning-assisted crystal engineering of a zeolite. Nature Communications 2023, 14, 3152
- Li et al. 2019 Li, S.; Li, J.; Dong, M.; Fan, S.; Zhao, T.; Wang, J.; Fan, W. Strategies to control zeolite particle morphology. Chemical Society Reviews 2019, 48, 885–907
- Lee et al. 2021 Lee, H.; Shin, J.; Lee, K.; Choi, H. J.; Mayoral, A.; Kang, N. Y.; Hong, S. B. Synthesis of Thermally Stable SBT and SBS/SBT Intergrowth Zeolites. Science 2021, 373, 104 LP – 107
- Oleksiak and Rimer 2014 Oleksiak, M. D.; Rimer, J. D. Synthesis of Zeolites in the Absence of Organic Structure-Directing Agents: Factors Governing Crystal Selection and Polymorphism. Reviews in Chemical Engineering 2014, 30, 1–49
- Jensen et al. 2019 Jensen, Z.; Kim, E.; Kwon, S.; Gani, T. Z. H.; Román-Leshkov, Y.; Moliner, M.; Corma, A.; Olivetti, E. A Machine Learning Approach to Zeolite Synthesis Enabled by Automatic Literature Data Extraction. ACS Central Science 2019, 5, 892–899
- Muraoka et al. 2019 Muraoka, K.; Sada, Y.; Miyazaki, D.; Chaikittisilp, W.; Okubo, T. Linking Synthesis and Structure Descriptors from a Large Collection of Synthetic Records of Zeolite Materials. Nature Communications 2019, 10, 4459
- Asselman et al. 2022 Asselman, K.; Vandenabeele, D.; Pellens, N.; Doppelhammer, N.; Kirschhock, C. E.; Breynaert, E. Structural Aspects Affecting Phase Selection in Inorganic Zeolite Synthesis. Chemistry of Materials 2022, 34, 11081–11092
- Itabashi et al. 2012 Itabashi, K.; Kamimura, Y.; Iyoki, K.; Shimojima, A.; Okubo, T. A Working Hypothesis for Broadening Framework Types of Zeolites in Seed-Assisted Synthesis without Organic Structure-Directing Agent. Journal of the American Chemical Society 2012, 134, 11542–11549
- Li et al. 2015 Li, J.; Corma, A.; Yu, J. Synthesis of New Zeolite Structures. Chemical Society Reviews 2015, 44, 7112–7127
- Blatov et al. 2013 Blatov, V. A.; Ilyushin, G. D.; Proserpio, D. M. The Zeolite Conundrum: Why Are There so Many Hypothetical Zeolites and so Few Observed? A Possible Answer from the Zeolite-Type Frameworks Perceived as Packings of Tiles. Chemistry of Materials 2013, 25, 412–424
- Kuznetsova et al. 2018 Kuznetsova, E. D.; Blatova, O. A.; Blatov, V. A. Predicting New Zeolites: A Combination of Thermodynamic and Kinetic Factors. Chemistry of Materials 2018, 30, 2829–2837
- Pophale et al. 2011 Pophale, R.; Cheeseman, P. A.; Deem, M. W. A Database of New Zeolite-like Materials. Physical Chemistry Chemical Physics 2011, 13, 12407–12412
- Li et al. 2019 Li, L.; Slater, B.; Yan, Y.; Wang, C.; Li, Y.; Yu, J. Necessity of Heteroatoms for Realizing Hypothetical Aluminophosphate Zeolites: A High-Throughput Computational Approach. The Journal of Physical Chemistry Letters 2019, 10, 1411–1415
- Li et al. 2013 Li, Y.; Yu, J.; Xu, R. Criteria for Zeolite Frameworks Realizable for Target Synthesis. Angewandte Chemie International Edition 2013, 52, 1673–1677
- Helfrecht et al. 2019 Helfrecht, B. A.; Semino, R.; Pireddu, G.; Auerbach, S. M.; Ceriotti, M. A New Kind of Atlas of Zeolite Building Blocks. The Journal of Chemical Physics 2019, 151, 154112
- Widdowson et al. 2022 Widdowson, D.; Mosca, M.; Pulido, A.; Cooper, A.; Kurlin, V. Average Minimum Distances of periodic point sets - fundamental invariants for mapping all periodic crystals. MATCH Communications in Mathematical and in Computer Chemistry 2022, 87, 529–559
- Widdowson and Kurlin 2022 Widdowson, D.; Kurlin, V. Resolving the data ambiguity for periodic crystals. Advances in Neural Information Processing Systems (NeurIPS 2022) 2022, 35, 24625–24638
- Elkin and Kurlin 2023 Elkin, Y.; Kurlin, V. A new near-linear time algorithm for k-nearest neighbor search using a compressed cover tree. International Conference on Machine Learning (ICML). 2023
- Bartók et al. 2013 Bartók, A. P.; Kondor, R.; Csányi, G. On Representing Chemical Environments. Physical Review B 2013, 87, 184115
- Pozdnyakov et al. 2020 Pozdnyakov, S. N.; Willatt, M. J.; Bartók, A. P.; Ortner, C.; Csányi, G.; Ceriotti, M. Incompleteness of atomic structure representations. Physical Review Letters 2020, 125, 166001
- Schwalbe-Koda et al. 2019 Schwalbe-Koda, D.; Jensen, Z.; Olivetti, E.; Gómez-Bombarelli, R. Graph Similarity Drives Zeolite Diffusionless Transformations and Intergrowth. Nature Materials 2019, 18, 1177–1181
- Jensen et al. 2021 Jensen, Z.; Kwon, S.; Schwalbe-Koda, D.; Paris, C.; Gómez-Bombarelli, R.; Román-Leshkov, Y.; Corma, A.; Moliner, M.; Olivetti, E. A. Discovering Relationships between OSDAs and Zeolites through Data Mining and Generative Neural Networks. ACS Central Science 2021, 7, 858–867
- Rosenberg and Hirschberg 2007 Rosenberg, A.; Hirschberg, J. V-Measure: A Conditional Entropy-Based External Cluster Evaluation Measure. Proceedings of the 2007 Joint Conference on Empirical Methods in Natural Language Processing and Computational Natural Language Learning (EMNLP-CoNLL). Prague, Czech Republic, 2007; pp 410–420
- Erlebach et al. 2022 Erlebach, A.; Nachtigall, P.; Grajciar, L. Accurate large-scale simulations of siliceous zeolites by neural network potentials. npj Computational Materials 2022, 8, 174
- Helfrecht et al. 2022 Helfrecht, B. A.; Pireddu, G.; Semino, R.; Auerbach, S. M.; Ceriotti, M. Ranking the Synthesizability of Hypothetical Zeolites with the Sorting Hat. Digital Discovery 2022, 1, 779–789
- Mazur et al. 2016 Mazur, M.; Wheatley, P. S.; Navarro, M.; Roth, W. J.; Položij, M.; Mayoral, A.; Eliášová, P.; Nachtigall, P.; Čejka, J.; Morris, R. E. Synthesis of ’unfeasible’ Zeolites. Nature Chemistry 2016, 8, 58–62
- Argente et al. 2023 Argente, E.; Valero, S.; Misturini, A.; Treacy, M. M.; Baumes, L.; Sastre, G. Computer Generation of Hypothetical Zeolites. AI-Guided Design and Property Prediction for Zeolites and Nanoporous Materials 2023, 145–172
- Lin et al. 2012 Lin, L.-C.; Berger, A. H.; Martin, R. L.; Kim, J.; Swisher, J. A.; Jariwala, K.; Rycroft, C. H.; Bhown, A. S.; Deem, M. W.; Haranczyk, M.; Smit, B. In Silico Screening of Carbon-Capture Materials. Nature Materials 2012, 11, 633–641
- Hewitt et al. 2022 Hewitt, D.; Pope, T.; Sarwar, M.; Turrina, A.; Slater, B. Machine learning accelerated high-throughput screening of zeolites for the selective adsorption of xylene isomers. Chemical Science 2022, 13, 13178–13186
- Kurlin 2022 Kurlin, V. A. Mathematics of 2-dimensional lattices. Foundations of Computational Mathematics 2022, 1–59
- Anosova and Kurlin 2021 Anosova, O.; Kurlin, V. An isometry classification of periodic point sets. Lecture Notes in Computer Science (Proceedings of DGMM). 2021; pp 229–241
- Hargreaves et al. 2020 Hargreaves, C. J.; Dyer, M. S.; Gaultois, M. W.; Kurlin, V. A.; Rosseinsky, M. J. The Earth Mover’s Distance as a Metric for the Space of Inorganic Compositions. Chemistry of Materials 2020, 32, 10610–10620
- Widdowson and Kurlin 2021 Widdowson, D.; Kurlin, V. Pointwise Distance Distributions of periodic sets. arXiv:2108.04798 2021,
- Baerlocher and McCusker 2023 Baerlocher, C.; McCusker, Database of Zeolite Structures. https://www.iza-structure.org/databases/, 2023
- Hagberg et al. 2008 Hagberg, A. A.; Schult, D. A.; Swart, P. J. Exploring Network Structure, Dynamics, and Function using NetworkX. Proceedings of the 7th Python in Science Conference. Pasadena, CA USA, 2008; pp 11 – 15
- Virtanen et al. 2020 Virtanen, P. et al. SciPy 1.0: Fundamental Algorithms for Scientific Computing in Python. Nature Methods 2020, 17, 261–272
- Pedregosa et al. 2011 Pedregosa, F. et al. Scikit-learn: Machine Learning in Python. Journal of Machine Learning Research 2011, 12, 2825–2830
- McInnes et al. 2018 McInnes, L.; Healy, J.; Melville, J. UMAP: Uniform manifold approximation and projection for dimension reduction. arXiv:1802.03426 2018,
- Chen and Guestrin 2016 Chen, T.; Guestrin, C. XGBoost: A Scalable Tree Boosting System. Proceedings of the 22nd ACM SIGKDD International Conference on Knowledge Discovery and Data Mining. New York, NY, USA, 2016; pp 785–794
- Lundberg and Lee 2017 Lundberg, S. M.; Lee, S.-I. In Advances in Neural Information Processing Systems 30; Guyon, I., Luxburg, U. V., Bengio, S., Wallach, H., Fergus, R., Vishwanathan, S., Garnett, R., Eds.; Curran Associates, Inc., 2017; pp 4765–4774
- Lundberg et al. 2020 Lundberg, S. M.; Erion, G.; Chen, H.; DeGrave, A.; Prutkin, J. M.; Nair, B.; Katz, R.; Himmelfarb, J.; Bansal, N.; Lee, S.-I. From local explanations to global understanding with explainable AI for trees. Nature Machine Intelligence 2020, 2, 2522–5839
Supporting Information for: Inorganic synthesis-structure maps in zeolites with machine learning and crystallographic distances
Daniel Schwalbe-Koda∗,†, Daniel E. Widdowson,‡ Tuan Anh Pham,† and Vitaliy Kurlin∗,‡
†Lawrence Livermore National Laboratory, Livermore, CA, United States
‡University of Liverpool, Liverpool, United Kingdom
E-mail: dskoda@llnl.gov; vitaliy.kurlin@gmail.com
Appendix A Supporting Figures
Appendix B Supporting Tables
| Zeolite 1 | Zeolite 2 | AMD distance (Å) |
|---|---|---|
| ITH | ITR | 0.016 |
| ITG | UOV | 0.021 |
| SBS | SBT | 0.022 |
| ITG | IWW | 0.025 |
| MEL | SFV | 0.032 |
| MWF | PAU | 0.033 |
| IMF | SFV | 0.035 |
| IMF | TUN | 0.035 |
| AFG | TOL | 0.037 |
| FAR | MAR | 0.037 |
| ERI | SWY | 0.039 |
| OFF | SWY | 0.040 |
| AFT | AFX | 0.040 |
| IWW | UOV | 0.041 |
| AFS | BPH | 0.042 |
| SFH | SFN | 0.042 |
| AFX | SFW | 0.044 |
| EMT | FAU | 0.045 |
| LIO | TOL | 0.045 |
| PTY | PWO | 0.046 |
| IWS | SOV | 0.047 |
| AWO | UEI | 0.047 |
| ITG | UWY | 0.050 |
| Parameter | Choices |
|---|---|
| penalty | [l2, l1, none] |
| C | [0.001, 0.01, 0.1, 1, 10, 100] |
| solver | [lbfgs, liblinear, sag, saga] |
| l1_ratio | [0.25, 0.5, 0.75, 1.0] |
| Parameter | Choices |
|---|---|
| n_estimators | [50, 100, 200] |
| max_depth | [None, 10, 20] |
| min_samples_split | [2, 5, 10] |
| min_samples_leaf | [1, 2, 4] |
| bootstrap | [True, False] |
| Parameter | Choices |
|---|---|
| n_estimators | [50, 100, 200] |
| learning_rate | [0.01, 0.1, 0.2] |
| max_depth | [3, 4, 5, 6] |
| min_child_weight | [1, 2, 3] |
| subsample | [0.5, 0.75, 1] |
| colsample_bytree | [0.5, 0.75, 1] |