Search for UHE Photons from Gravitational Wave Sources with the Pierre Auger Observatory
Abstract
A search for time-directional coincidences of ultra-high-energy (UHE) photons above 10 EeV with gravitational wave (GW) events from the LIGO/Virgo runs O1 to O3 is conducted with the Pierre Auger Observatory. Due to the distinctive properties of photon interactions and to the background expected from hadronic showers, a subset of the most interesting GW events is selected based on their localization quality and distance. Time periods of 1000 s around and 1 day after the GW events are analyzed. No coincidences are observed. Upper limits on the UHE photon fluence from a GW event are derived that are typically at (time period 1000 s) and (time period 1 day). Due to the proximity of the binary neutron star merger GW170817, the energy of the source transferred into UHE photons above 40 EeV is constrained to be less than 20% of its total gravitational wave energy. These are the first limits on UHE photons from GW sources.
1 Introduction
With the first gravitational waves (GW) measured by the Advanced LIGO and Virgo detectors in 2015 (Abbott et al., 2016), a new window to the universe has been opened. In addition, a new type of transient astronomical object has been observed for the first time: the merging process of two compact stellar mass objects (compact binary merger, CBM). Since the first measurement in 2015, three observation runs (O1, O2 and O3) have been conducted with a total yield of 91 confident GW observations. The sources of these signals turned out to belong to different groups including the merging events of binary black holes (BBH), binary neutron stars (BNS), and neutron star – black hole (NSBH) systems (Abbott et al., 2019, 2021a, 2021b, 2021c).
An extensive follow-up campaign in the electromagnetic domain revealed a coincident kilonova event from the BNS merger GW170817 whereas no astrophysical neutrino signal has been identified (Abbott et al., 2017). This observation became a milestone of multimessenger astronomy and the first multimessenger observation involving GWs. The acceleration mechanisms of cosmic rays for such an event are being debated in the theoretical community (Fang & Metzger, 2017; Kimura et al., 2018; Rodrigues et al., 2019; Decoene et al., 2020). Although no further observations of electromagnetic or neutrino counterparts from other GW sources have been confirmed so far, BBH and NSBH mergers are also being discussed as possible candidates for the acceleration of ultra-high-energy (UHE) cosmic rays and, hence, potential sources of high-energy neutrinos and photons (Kotera & Silk, 2016; Murase et al., 2016; McKernan et al., 2019).
With its design sensitivity at the highest energies in the cosmic ray spectrum above , the Pierre Auger Observatory (Aab et al., 2015) plays an important role in the multimessenger follow-up campaign of GW sources (Kampert et al., 2019). Constraints on the production of UHE neutrinos by the source of GW170817 and the first BBH mergers detected during O1 have been obtained (Aab et al., 2016; Albert et al., 2017), and a stacking analysis has been performed using 83 confident BBH merger observations aiming to constrain the neutrino emission from the source class as a whole (Abreu et al., 2023a). A first analysis of GW sources with respect to an UHE photon signal using the data of the Pierre Auger Observatory is reported here. Although the attenuation length of UHE photons is of the order of due to interactions with the cosmic background radiation fields (Risse & Homola, 2007) – mainly the cosmic microwave background (CMB) and the universal radio background (URB) – it turns out that the exposure of the Pierre Auger Observatory towards UHE photons is large enough to potentially observe photons from sufficiently close sources. More distant sources on the other hand can be used to probe the attenuation of UHE photons in the background radiation fields and an observation of an UHE photon from such a source could point to new physics scenarios (Fairbairn et al., 2011; Galaverni & Sigl, 2008). Focusing on the most promising sources while keeping an open window for unexpected discovery, a selected set of GW sources will be analyzed here to reduce the overall background from hadronic cosmic rays.
The paper is structured as follows. In Sec. 2, a summary of the method used to search for UHE photons with the Pierre Auger Observatory is provided. In Sec. 3, an overview of the already concluded GW observation runs and the GW data relevant for this work is given. A description of the GW selection strategy that is used to pick only the most relevant GW sources is detailed in Sec. 4 followed by a brief discussion in Sec. 5 of the signal sensitivity that can be achieved using that selection. The final results of the analysis are presented in Sec. 6 in the form of upper limits on UHE photons from this selection of sources. Sec. 7 concludes with a short summary and a comparison of our results to other search results from the literature.
2 Ultra-high-energy Photon Search at the Auger Observatory
The search for an UHE photon signal in coincidence with a GW is carried using data collected by the surface detector array (SD) of the Pierre Auger Observatory (Aab et al., 2015). The SD consists of 1660 autonomous water Cherenkov detectors (WCDs) arranged on a triangular grid with a spacing of 1500 m. Its geolocation is at in longitude and in latitude, in the western part of Argentina. With a field of view to UHE photons limited to the zenith angle range between and (as determined by data quality cuts necessary for the photon identification method used), a fraction of 18.3 % of the whole sky is covered at any time. Due the field of view and the geolocation of the Observatory, 70.8 % of the sky is covered during a full rotation of the Earth. A small region with a radius of about around the celestial south pole is constantly observed.
The bulk of data received at the Pierre Auger Observatory originates from cosmic rays of hadronic nature. With its different detector components and various enhancements, the Observatory is also sensitive to a possible component of primary photons. Different searches have been performed aiming to identify such a component among the diffuse flux of cosmic rays (Abreu et al., 2023b; Aab et al., 2017a; Abreu et al., 2022), as well as from steady point sources in the sky (Aab et al., 2017b). No statistically significant excess of primary UHE photons has been identified so far, and the strongest constraints to date on the flux of photons from up to energies beyond have been obtained.
If an air shower event in coincidence with a GW is found, a method is needed to judge the likelihood of it originating from a primary photon or hadron. For this purpose, the photon discrimination method from Abreu et al. (2023b) is adopted which is briefly described in the following. This method utilizes the data recorded by the SD taking advantage of its high duty cycle of almost 100 %. The identification of photon-induced air showers is based on the shower lateral distribution, i.e. the distribution of particles as a function of the distance to the shower axis, and the shapes of the signal time traces recorded by the WCD stations. In particular, two discriminating photon observables are used, termed and . Photon-induced air showers, which are typically poor in muons, show on average a steeper lateral distribution function (LDF) compared to hadron-induced showers. The observable measures the signal in the WCDs as a function of their distance to the shower axis and is therefore sensitive to the steepness of the LDF. The second observable, , quantifies the deviation of the risetime from a reference signal, typical of hadron-induced showers as measured in data. It is sensitive to both the ratio between the electromagnetic and the muonic shower components at the ground level, and to , which is the atmospheric depth (slant depth) where the shower reaches its maximum development. Photon-induced air showers are expected to exhibit a large deviation from the average (hadronic) data, i.e large , because their signal risetime will be longer due to an intrinsically smaller muonic component and a less attenuated electromagnetic component (as a consequence of a deeper ). To maximize the photon-hadron separation power, the observables are first normalized with respect to the total signal and the direction of the shower axis and are then combined using a Fisher discriminant analysis. The distributions of the Fisher discriminant of data events and a set of simulated photon events are shown in Fig. 1. A typical photon-induced air shower is expected to have a significantly larger Fisher discriminant value than the average event found in data. The distributions shown in Fig. 1 provide a measure with which to judge the likelihood of a single event originating from a primary photon.
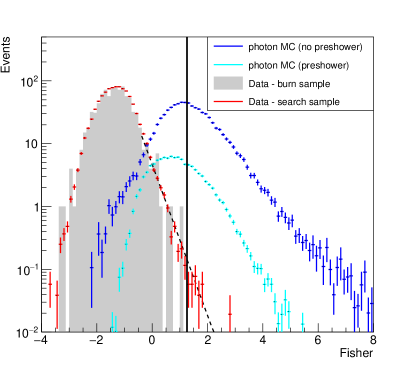
On the axis of the Fisher discriminant, a threshold value may be placed to define which events will be accepted as “photon candidate events”. Depending on this photon candidate selection cut, the photon-discrimination method described above has a non-zero rate of expected false-positive detections contributing a certain amount of background within the signal region. In Abreu et al. (2023b), out of all air shower events recorded during a period of 16.5 yr (2004 January 2020 June), 16 events passed the photon candidate cut which was placed at the median of the distribution of photon simulations in that analysis (c.f. vertical line in Fig. 1). This number was found to be consistent with the expected hadronic background.
The photon discrimination method is optimized for air showers with incident zenith angles between and and photon energies . Since the energy scale of the SD is calibrated using hadronic air showers observed by both the SD and the fluorescence detectors, the energy of a possible photon-induced air shower would be underestimated. In order to obtain a less biased estimator for the photon energy , the hadronic energy scale has been replaced by a function of and calibrated with photon simulations (Abreu et al., 2023b). Here, is the interpolated average signal produced in an SD station with a perpendicular distance of 1000 m from the shower axis. The photon energy estimator can be calculated for any air shower with reconstructed and zenith angle and is used to define the lower energy cut for the application of the analysis.
To clean the shower data set of non-well reconstructed events, a number of selection criteria is imposed prior to the calculation of the discriminating air shower observables. The selected events are required to have a successfully reconstructed shower axis and LDF, and have to fulfill the 6T5 trigger criterion (= 6 active SD stations around the station with the highest signal). For the calculation of and , events with reconstructed hadronic energy (energy estimator obtained by the standard SD energy reconstruction (Aab et al., 2015)), and events without triggered stations (excluding stations with a saturated low-gain channel) more than 1000 m away from the shower axis are rejected. A more detailed description of the two observables, and , and further details of the photon-hadron separation method can be found in Abreu et al. (2023b).
3 GW data
The GW events considered in this analysis were recorded by Advanced LIGO and Virgo during their first three observation runs and published in three gravitational wave transient catalogs: GWTC-1 (Abbott et al., 2019), GWTC-2 (Abbott et al., 2021a) with its second revision GWTC-2.1 (Abbott et al., 2021b), and GWTC-3 (Abbott et al., 2021c). While the first catalog covers the observations of the first two runs O1 (from 2015 September 12 to 2016 January 19) and O2 (from 2016 November 30 to 2017 August 25), the third observation run has been split in two parts, O3a (from 2019 April 1 to 2019 October 1) and O3b (from 2019 November 1 to 2020 March 27), with a maintenance break of 1 month in between. The observations of each part of O3 have been released in separate catalogs, GWTC-2 (GWTC-2.1) and GWTC-3 respectively.
Key information about GWs which is important for this analysis is the localization of their sources. This information is distributed by the GW observatories in the form of probability density distributions realized via pixelized skymaps (“localization maps”) in the HEALPix (Gorski et al., 2005) segmentation scheme. The resolution of these maps varies between GW events and typically depends on the overall localization quality of a source. In addition to the directional localization, a “best fit” estimator for the luminosity distance is also given for each source. In the case of GW170817, additional information about the host galaxy, NGC 4993, is available. In this case, the source is treated as a point source and the well constrained distance to the host galaxy is used instead of the estimate provided by the GW measurement. The pronounced differences in localization qualities and distances give rise to a priorization of sources in the context of this analysis.
4 Gravitational Wave Event Selection
Due to shower-to-shower fluctuations, photon-induced air showers cannot unambiguously be separated from the bulk of showers with hadronic origin. Since the 16 photon candidate events found in Abreu et al. (2023b) are consistent with the expected hadronic background, this number may serve as an estimate of the background rate for the present analysis. This leads to a directional-averaged background rate of . With this rate, the expected number of background events passing the photon candidate cut from all 91 GW sources for a 1 day search period within the 90 % localization regions is . Hence, the background hypothesis could only be rejected at a level of (derived using the Feldman-Cousins method described in the following paragraph), should a coincident shower with a Fisher discriminant above the photon median be detected. Hence, an actual photon event could not be identified as such and had to be attributed to the hadronic background because of the high background rate. Possible ways to reduce the total background for a set of GW events include a reduction of the temporal and directional search windows. With an additional selection of GW events, the background contamination of the search regions can further be efficiently reduced, boosting the sensitivity of the analysis.
The sensitivity to a possible signal of primary photons can be quantified through the confidence level (CL) at which the background hypothesis can be rejected in the case of a detection. For a given number of observed photon candidate events and a given background, two-sided confidence intervals for the true expectation value can be obtained through the construction described by Feldman & Cousins (1998) (FC). Depending on the CL, the lower limit of this interval may or may not be equal to zero. Thus, as a convenient measure for the sensitivity, we define as the lowest confidence level at which the lower FC limit is still consistent with zero for the given background and a measured number of one photon candidate event. Technically, this is done by calculating the FC confidence interval for a given background (i.e., the expected number of coincident air shower events not associated with a transient event) and an assumed signal (i.e., the number of actual photon events originating from a particular transient) and iterating through the CL until the lower limit matches exactly 0, i.e. so that a slightly lower confidence level would lead to a lower limit . With this definition, only depends on and, naturally, a higher number of expected background events leads to a lower value of – the confidence level at which the hypothesis of a photon candidate belonging to the hadronic background can be rejected.
In the following, the term “photon candidate event” shall be used for air shower events with a Fisher discriminant value larger than the photon candidate cut value used in Abreu et al. (2023b). However, for this analysis, this value is only relevant for the definition of the GW selection strategy described in the following. The likelihood of an air shower event that coincides with a GW source originating from a primary photon from that source depends on multiple parameters, like the precise value of the Fisher discriminant, the direction of the source, and its localization quality.
As a first measure to limit the total background, two (mutually exclusive) time windows have been defined during which a GW source is analzyed. A short time window of starting at before the GW event time, and a longer time window starting at after the GW event time have been chosen. While the short time window serves as a window for potential discovery with a high degree of sensitivity, the long time window is the result of a compromise between sensitivity and a long-term follow-up and is loosely motivated by the time scale predicted by Fang & Metzger (2017) for the emission of UHE neutrinos.
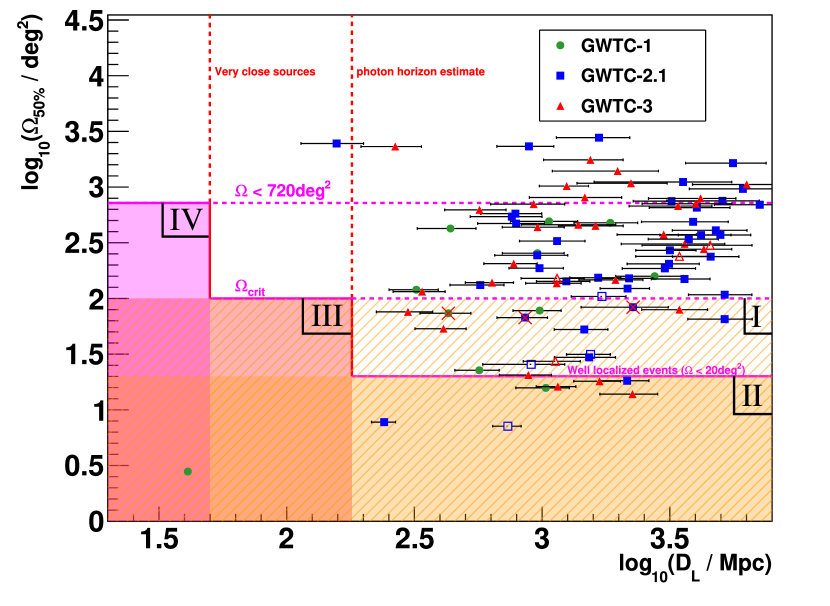
An analysis of the GW sky localization maps distributed by LIGO/Virgo leads to the conclusion that using their 50 % contour, defining a solid angle , as the search region in the sky is a reasonable compromise between the expected level of background (which is proportional to the solid angle of the analyzed sky region) and the confidence level at which the true source is localized within the search region. By using the 50 % contour instead of the 90 % contour – which is the most commonly adopted convention – on average about four times as many GW sources may be analyzed before the same level of expected background is reached, while only losing 40 % in confidence that the source is located within the analyzed sky region. To also take into account the directional resolution of the Auger SD, which is about for photon-induced air showers above , the sky localization maps of GW sources are convolved with a corresponding Gaussian distribution before constructing the 50 % contour.
In order to keep the sensitivity to a possible photon signal as high as possible, GW events are additionally selected by their localization quality and distance. Close and well localized sources are preferred over distant and poorly localized ones. Thus, optimal results can be obtained while keeping the expected background at a reasonable level. Four classes of accepted GW events are defined here for which the 50 % localization region is analyzed for coincident air shower events (see Fig. 2). These selection criteria can be summarized as
with the lowercase “l” and “s” in the subscript in which time window (long and/or short) each class of events is analyzed.
The first class (class I) comprises GW sources with a maximum 50% contour size of and any distance. The value of is chosen such that for a photon candidate event within a 1000 s time window would always be above the level in this specific event (i.e., omitting any penalization factor from multiple trials). Since classically no photon signal is expected from very distant sources, this class also keeps a window open for potential discoveries of new physics. GW events in this class are analyzed only in the short time window.
Especially well-localized sources with are additionally analyzed in the long time window (class II). From such a small region in the sky, the expected background would still be small () despite the longer observation time, and the detection of a coincident photon-like event from a distant source could be a hint towards new physics.
| UTC time | / | / | source type | class | time window | |||
|---|---|---|---|---|---|---|---|---|
| GW150914 | 2015-09-14T09:50:45.4 | 429 | 73.6 | BBH | I | short | ||
| GW170817 | 2017-08-17T12:41:04.4 | 41 | 3.1 | BNS | all | long | ||
| GW170818 | 2017-08-18T02:25:09.1 | 1033 | 15.7 | BBH | I,II | long | ||
| GW190517_055101 | 2019-05-17T05:51:01.8 | 2270 | 83.6 | BBH | I | short | ||
| GW190701_203306 | 2019-07-01T20:33:06.6 | 2152 | 18.2 | BBH | I,II | long | ||
| GW190728_064510 | 2019-07-28T06:45:10.5 | 858 | 67.3 | BBH | I | short | ||
| GW190814 | 2019-08-14T21:10:39.0 | 241 | 7.8 | BHNS | I,II | long | ||
| GW200208_130117 | 2020-02-08T13:01:17.9 | 2258 | 13.8 | BBH | I,II | long | ||
| GW200224_222234 | 2020-02-24T22:22:34.4 | 1677 | 18.0 | BBH | I,II | long | ||
| GW200311_115853 | 2020-03-11T11:58:53.4 | 1152 | 16.2 | BBH | I,II | long |
The long time window is also applied to GW events in the third class (class III) which comprises sources with a maximum contour size of which at the same time are required to be closer than 180 Mpc. The maximum distance is chosen such that we reject GW sources from which no photons are expected to reach the Earth even under the most optimistic assumptions about the photon flux and its emission pattern, unless new physics is involved. For this choice, a “photon horizon” has been estimated. This photon horizon is the distance up to which the energy transferred in to UHE by the so far brightest GW source, with a total radiated mass of almost , could be constrained to be less than its radiated GW energy. This distance is mainly driven by the photon attenuation length in the extragalactic medium. Using the CRPropa 3 simulation code (Batista et al., 2016) to simulate the propagation of UHE photons, a maximum horizon of has been found for photons at . This horizon is derived for isotropic emission. To take into account sources which might expose narrow jets pointing directly towards Earth, only sources beyond are rejected.
A final class of accepted GW events (class IV) allows especially close sources to be analyzed up to a maximum allowed contour size of . For such sources with luminosity distance , there is a realistic chance of observing a potential UHE photon flux or at least placing strong physical constraints on the fraction of energy transferred into UHE photons. The value of is defined by the maximum distance a source like GW170817 may have so that the fraction of energy transferred into UHE photons could still be constrained by a non-observation of photons at the SD array. The cut on the maximum contour size is chosen such that the bulk of GW events would be accepted and only the tail (about 10%) in the distribution of is rejected, which can mostly be addressed to events which were not observed by one of the two LIGO detectors.
The four classes are not mutually exclusive and, hence, a single GW event may belong to multiple classes at the same time. Although classes II and III are subsets of class I in the space of and , an event belonging, e.g., to class II can only be analyzed in class I as well if its localization contour overlaps with the field of view during the short time window.
In Fig. 2, the accepted regions in the space of source localization and luminosity distance are visualized on top of the distribution of all 91 confident GW observations detected between O1 and O3b. In total, 23 GW events qualify in terms of and for being checked in the short time window (classes I or IV), and a subset of 8 for also being checked in the long time window (classes IIIV). Out of these 23 (8) GW events, in 3 (7) cases the localization contours were at least partly covered by the Auger SD field of view in the short (long) time window. The 3 events in the short time window belong exclusively to class I, i.e. none of these events also qualifies for an inspection in the long time window. All 7 events in the long time window are found in class II. One of these, GW170817, also passes the selection criteria for classes I, III and IV, but it was not observable in the short time window. For a quick reference, further information about the 10 GW events that pass the event selection, like the precise time stamp of their detection, the most likely source direction, the source distance and most likely source type are compiled in Tab. 1. For a more comprehensive reference of the GW signals, one may refer to the official catalogs GWTC-1, GWTC-2, GWTC-2.1 and GWTC-3 published by the LIGO and Virgo Collaborations.
5 Sensitivity
In view of the future growth of the GW data set, let us first consider the overall sensitivity of this analysis to a photon signal. As in Sec. 4, the sensitivity is quantified by adopting the photon candidate cut value of Abreu et al. (2023b) and assuming a single photon candidate event within any of the sky regions and time windows analyzed here for the 7(3) events selected. While the expected number of random air showers (i.e. irrespective of the Fisher discriminant) to be coincident with any of the analyzed GW sources and time windows is about 0.03, the expected total background with a Fisher discriminant value exceeding the cut value is events. This leads to , meaning that the hypothesis of such a photon candidate event belonging to the hadronic background could have been rejected at a CL of . Since this value is calculated for the combined background from all selected GW sources, in both the long and the short time windows, it naturally takes into account the trial factor that comes with an increasing number of analyzed sources. Considering future applications of this analysis to larger sets of GW sources, this penalized value of is expected to decrease. The real value of in the actual case of a coincident air shower detection will, however, strongly depend on the precise values of the photon discrimination observables and as well as the direction and photon energy of the event. These values carry more detailed information about the primary particle and its photon-likeliness than the binary selection method that is introduced by a simple photon candidate cut.
6 Results
For both analysis time windows of 1000 s and 1 day the data of the Pierre Auger Observatory have been analyzed for possible coincident photon events. No coincident air showers with occured for any source in either of the time windows. This is well in agreement with the expected amount of 0.03 chance coincidences. Consequently, also none of the 16 photon candidate events from Abreu et al. (2023b) was found to be coincident with any of the selected GWs. Following this non-observation of coincident events, for each GW source an upper limit on the number of photons can be placed using the FC approach. In general, the FC upper limit at 90% CL without a measured signal and zero background is . The small amount of background which is expected, however, does not significantly change this number.
From , one can obtain limits on the corresponding spectral photon flux , which is the number of photons arriving at the Earth from the direction of the GW source per unit time and area in the energy range . Assuming that the spectral photon flux follows a power law with spectral index , it can be written as
| (1) |
With the energy dependence of the flux modeled as a power law, an upper limit on the flux normalization factor can be derived from as
| (2) |
For comparison to other results, the energy interval covers one order of magnitude starting with . is the directional exposure of the Observatory to photons with energy within the time interval . The calculation of is explained in the following.
The quality cuts that are imposed on the Auger SD data (see Sec. 2) limit the photon detection efficiency as a function of energy and zenith angle of the incident primary particle. The zenith-angle-averaged photon efficiency between and and , assuming an power-spectrum, has been found to be . The efficiency has been derived using simulated photon events produced with the CORSIKA simulation code (Heck et al., 1989) and after applying the same selection cuts as used for data. With the photon efficiency given as a function of energy and direction, the exposure to UHE photons from a transient point source at zenith angle during the obervation period between and is given by
| (3) |
with being the time-dependent effective area of the Auger SD array which is determined by the number of active SD stations at a given moment. The step-function accounts for the fraction of the observation time in which the source is covered by the field of view of the SD between zenith angles and . Since the zenith angle of a GW source is a coordinate of the horizontal coordinate system which co-rotates with the Earth, is a function of the sidereal time , source right ascension , and declination :
| (4) |
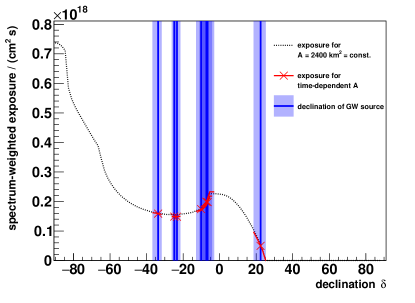
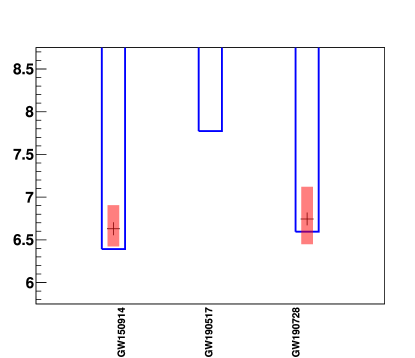
with being the latitude of the Auger SD array and the duration of a sidereal day. After weighting the exposure by a -spectrum and integrating over a decade in energy, the spectrum-weighted exposure is a function of source right ascension and declination during the short time window, while in the long time window depends only on declination to first order and is depicted by the dotted curve in Fig. 3. The exposure has a maximum at the celestial pole and vanishes for . The basic structure of the exposure curve is determined by the visibility of a certain direction in the zenith band between and modulated by the directional photon detection efficiency . For each GW source analyzed in the long time window, the declination band covered by the -contour is highlighted in Fig. 3 by a blue shaded bar with the most likely source declination marked with a solid line. Since the effective area of the SD array varies over time (typically only at the percent-level), the actual time-dependent values of the exposure are highlighted in solid red next to the dotted benchmark-line, which is based on a fixed area of corresponding to a typical average value.
Finally, an upper limit on the spectral fluence of UHE photons arriving from a given source at the Earth can be derived from the flux upper limit:
| (5) |
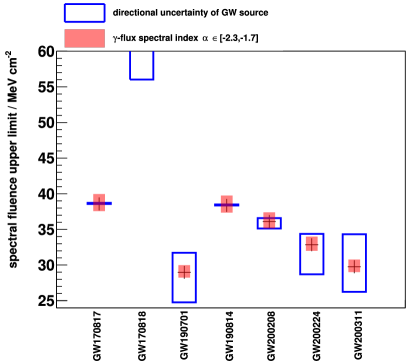
While no assumption on the time dependence of the flux is made, the extrapolation of the flux limits (which are based on data while the source is in the field of view) to the full time window implicitely assumes that the average flux during the period for which the source has been in the field of view is representative for the whole time window. The limits on the spectral fluence depend on the exact direction of the GW source and change with a variation of the assumed spectral shape of the UHE photon flux. Hence, in Fig. 4 the results for are shown for all possible source directions within each localization contour and a variation of the spectral index for both time windows. In the long time window, all localization regions have been fully covered by the field of view except for GW170818. Hence, this event could not be constrained for all source directions within the -contour. All three GW sources in the short time window have contours which partly leak out of the field of view. The upper limits that could be placed in the long (short) time window vary typically around ().
The BNS merger GW170817 plays a special role in this analysis for multiple reasons: as the first GW source which has a confirmed observation of an electromagnetic counterpart, a kilonova (Arcavi et al., 2017), the BNS merger is especially interesting for all kinds of follow-up multimessenger studies. So far, this source is also the only GW source for which the host galaxy has been identified, in this case NGC 4993 at a distance of about (Hjorth et al., 2017). This makes GW170817 the closest and best localized source to date. While a large fraction of a potential UHE photon flux from NGC 4993 is expected to be attenuated by the cosmic background radiation fields, the intergalactic medium still has a degree of transparency to UHE photons and first constraints on the energy transferred into UHE photons can be derived. To accurately take into account the interactions of photons, the photon attenuation has been studied as a function of photon energy using CRPropa 3. The upper limit to the spectral fluence at Earth , with an underlying flux modeled according to an -power-law spectrum, is then back-propagated to the source of the BNS and extrapolated to a full sphere to gain a limit on the energy transferred into UHE photons. Upper limits that do not exceed the GW energy lower limit of can be placed for photons above . Furthermore, we find that the strongest limits can be placed for photon energies above , where less than 20 % of the total GW energy at 90 % CL is transferred into UHE photons. Since the attenuation of UHE photons follows an exponential law, this result indicates that the energy transferred into UHE photons by an even closer GW source, which might be observed in the near future, could likely be constrained well below the percent level.
7 Conclusion
With the large exposure of its surface detector array, the Pierre Auger Observatory has been utilized to investigate a possible outflow of ultra-high-energy photons from the gravitational wave sources detected in recent years. The focus of this study were photons with energies above . Searching for transient point sources of photons at such energies comes with two major difficulties: the attenuation of ultra-high-energy photons in the cosmic background radiation fields which reduces the photon interaction length to only a few Mpc, and the separation of primary photons from an overwhelming background of hadronic cosmic rays using air shower properties. To overcome these obstacles, an educated selection of gravitational wave sources has been defined aiming to maximize the physics impact of the results. These – in total 10 – sources were analyzed for a coincident photon signal in a time span ranging from 500 s before the gravitational wave until one sidereal day after. Following the non-observation of a coincident signal, limits on the spectral fluence of photons in the respective energy range were constructed assuming an power-law spectrum. These are the first limits on UHE photons from GW sources.
The limits on the binary neutron star merger GW170817 add one further piece to the overall multimessenger puzzle by constraining the electromagnetic outflow of the source in the UHE regime. The results can be compared to the observed fluence of gamma rays between 50 keV and 300 keV as measured e.g. by the Fermi GBM (Meegan et al., 2009) to be (Goldstein et al., 2017) which are more than two orders of magnitude stronger than the upper limits found here in the long time window (after extrapolating the limits to a comparable range in ). The results can also be compared to the limits on the photon flux between 4 TeV and 100 TeV placed by HAWC (Abeysekara et al., 2017; Abbott et al., 2017) and on the fluence of neutrinos between 100 TeV and 1 PeV placed by IceCube (Aartsen et al., 2017; Albert et al., 2017). After converting our limits to a comparable range in , we find that the limits placed in this work are of the same order of magnitude as the limits by HAWC (by a factor of weaker) and by a factor of stronger than the neutrino limits by IceCube. In the case of HAWC, the comparable sensitivity of the observatories is mainly due to the exposure of the SD being compensated by the higher expected particle flux at lower energies and HAWC’s larger field of view, covering almost . The difference to the IceCube sensitivity additionally depends to a large extent on the different detection efficiencies between photons and neutrinos.
With the upcoming GW observation run O4, starting prospectively in 2023, a further increase in the detection rate is expected. With many more GW events to be analyzed in the future, a coincident air shower from the cosmic ray background will be almost certain at some point. Then, the photon likeliness of a coincident shower may be analyzed using dedicated simulations of photon-induced air showers aiming to mimic the signal found in the data. Comparing the Fisher discriminant of a coincident shower with the distributions obtained from photon simulations and hadronic background events, one can then judge the overall photon likeliness of the air shower on an event-by-event basis.
This analysis is only a first step towards exploiting the full potential of the Pierre Auger Observatory in multimessenger astronomy of transient point sources with UHE photons. While its sensitivity is already competitive with that of other instruments measuring photons and neutrinos at lower energies, the case of GW170817 shows the potential of the Observatory if even closer GW sources should be detected in upcoming observation runs. A future observation of e.g. a BNS merger in the Virgo cluster of galaxies could possibly lead to a probe of the energy transferred into UHE photons at a level well below one percent of its GW energy, a significant improvement compared to the obtained in this work for GW170817.
Acknowledgments
The successful installation, commissioning, and operation of the Pierre Auger Observatory would not have been possible without the strong commitment and effort from the technical and administrative staff in Malargüe. We are very grateful to the following agencies and organizations for financial support:
Argentina – Comisión Nacional de Energía Atómica; Agencia Nacional de Promoción Científica y Tecnológica (ANPCyT); Consejo Nacional de Investigaciones Científicas y Técnicas (CONICET); Gobierno de la Provincia de Mendoza; Municipalidad de Malargüe; NDM Holdings and Valle Las Leñas; in gratitude for their continuing cooperation over land access; Australia – the Australian Research Council; Belgium – Fonds de la Recherche Scientifique (FNRS); Research Foundation Flanders (FWO); Brazil – Conselho Nacional de Desenvolvimento Científico e Tecnológico (CNPq); Financiadora de Estudos e Projetos (FINEP); Fundação de Amparo à Pesquisa do Estado de Rio de Janeiro (FAPERJ); São Paulo Research Foundation (FAPESP) Grants No. 2019/10151-2, No. 2010/07359-6 and No. 1999/05404-3; Ministério da Ciência, Tecnologia, Inovações e Comunicações (MCTIC); Czech Republic – Grant No. MSMT CR LTT18004, LM2015038, LM2018102, CZ.02.1.01/0.0/0.0/16_013/0001402, CZ.02.1.01/0.0/0.0/18_046/0016010 and CZ.02.1.01/0.0/0.0/17_049/0008422; France – Centre de Calcul IN2P3/CNRS; Centre National de la Recherche Scientifique (CNRS); Conseil Régional Ile-de-France; Département Physique Nucléaire et Corpusculaire (PNC-IN2P3/CNRS); Département Sciences de l’Univers (SDU-INSU/CNRS); Institut Lagrange de Paris (ILP) Grant No. LABEX ANR-10-LABX-63 within the Investissements d’Avenir Programme Grant No. ANR-11-IDEX-0004-02; Germany – Bundesministerium für Bildung und Forschung (BMBF); Deutsche Forschungsgemeinschaft (DFG); Finanzministerium Baden-Württemberg; Helmholtz Alliance for Astroparticle Physics (HAP); Helmholtz-Gemeinschaft Deutscher Forschungszentren (HGF); Ministerium für Kultur und Wissenschaft des Landes Nordrhein-Westfalen; Ministerium für Wissenschaft, Forschung und Kunst des Landes Baden-Württemberg; Italy – Istituto Nazionale di Fisica Nucleare (INFN); Istituto Nazionale di Astrofisica (INAF); Ministero dell’Istruzione, dell’Universitá e della Ricerca (MIUR); CETEMPS Center of Excellence; Ministero degli Affari Esteri (MAE); México – Consejo Nacional de Ciencia y Tecnología (CONACYT) No. 167733; Universidad Nacional Autónoma de México (UNAM); PAPIIT DGAPA-UNAM; The Netherlands – Ministry of Education, Culture and Science; Netherlands Organisation for Scientific Research (NWO); Dutch national e-infrastructure with the support of SURF Cooperative; Poland – Ministry of Education and Science, grant No. DIR/WK/2018/11; National Science Centre, Grants No. 2016/22/M/ST9/00198, 2016/23/B/ST9/01635, and 2020/39/B/ST9/01398; Portugal – Portuguese national funds and FEDER funds within Programa Operacional Factores de Competitividade through Fundação para a Ciência e a Tecnologia (COMPETE); Romania – Ministry of Research, Innovation and Digitization, CNCS/CCCDI UEFISCDI, grant no. PN19150201/16N/2019 and PN1906010 within the National Nucleus Program, and projects number TE128, PN-III-P1-1.1-TE-2021-0924/TE57/2022 and PED289, within PNCDI III; Slovenia – Slovenian Research Agency, grants P1-0031, P1-0385, I0-0033, N1-0111; Spain – Ministerio de Economía, Industria y Competitividad (FPA2017-85114-P and PID2019-104676GB-C32), Xunta de Galicia (ED431C 2017/07), Junta de Andalucía (SOMM17/6104/UGR, P18-FR-4314) Feder Funds, RENATA Red Nacional Temática de Astropartículas (FPA2015-68783-REDT) and María de Maeztu Unit of Excellence (MDM-2016-0692); USA – Department of Energy, Contracts No. DE-AC02-07CH11359, No. DE-FR02-04ER41300, No. DE-FG02-99ER41107 and No. DE-SC0011689; National Science Foundation, Grant No. 0450696; The Grainger Foundation; Marie Curie-IRSES/EPLANET; European Particle Physics Latin American Network; and UNESCO.
References
- Aab et al. (2015) Aab, A., et al. 2015, Nuclear Instruments and Methods in Physics Research Section A: Accelerators, Spectrometers, Detectors and Associated Equipment, 798, 172, doi: https://doi.org/10.1016/j.nima.2015.06.058
- Aab et al. (2016) —. 2016, Phys. Rev. D, 94, 122007, doi: 10.1103/PhysRevD.94.122007
- Aab et al. (2017a) —. 2017a, Journal of Cosmology and Astroparticle Physics, 2017, 009, doi: 10.1088/1475-7516/2017/04/009
- Aab et al. (2017b) —. 2017b, ApJ, 837, L25, doi: 10.3847/2041-8213/aa61a5
- Aartsen et al. (2017) Aartsen, M., et al. 2017, Journal of Instrumentation, 12, P03012, doi: 10.1088/1748-0221/12/03/p03012
- Abbott et al. (2016) Abbott, B. P., et al. 2016, Phys. Rev. Lett., 116, 061102, doi: 10.1103/PhysRevLett.116.061102
- Abbott et al. (2017) —. 2017, The Astrophysical Journal, 848, L12, doi: 10.3847/2041-8213/aa91c9
- Abbott et al. (2019) —. 2019, Phys. Rev. X, 9, 031040, doi: 10.1103/PhysRevX.9.031040
- Abbott et al. (2021a) Abbott, R., et al. 2021a, Phys. Rev. X, 11, 021053, doi: 10.1103/PhysRevX.11.021053
- Abbott et al. (2021b) —. 2021b, doi: 10.48550/ARXIV.2108.01045
- Abbott et al. (2021c) —. 2021c, doi: 10.48550/ARXIV.2111.03606
- Abeysekara et al. (2017) Abeysekara, A. U., et al. 2017, The Astrophysical Journal, 843, 39, doi: 10.3847/1538-4357/aa7555
- Abreu et al. (2022) Abreu, P., et al. 2022, The Astrophysical Journal, 933, 125, doi: 10.3847/1538-4357/ac7393
- Abreu et al. (2023a) —. 2023a, The Pierre Auger Collaboration, paper in preparation
- Abreu et al. (2023b) —. 2023b, Journal of Cosmology and Astroparticle Physics, 05, 021, doi: 10.1088/1475-7516/2023/05/021
- Albert et al. (2017) Albert, A., et al. 2017, The Astrophysical Journal, 850, L35, doi: 10.3847/2041-8213/aa9aed
- Arcavi et al. (2017) Arcavi, I., et al. 2017, Nature, 551, 64, doi: 10.1038/nature24291
- Batista et al. (2016) Batista, R. A., Dundovic, A., Erdmann, M., et al. 2016, Journal of Cosmology and Astroparticle Physics, 2016, 038, doi: 10.1088/1475-7516/2016/05/038
- Decoene et al. (2020) Decoene, V., Guépin, C., Fang, K., Kotera, K., & Metzger, B. 2020, Journal of Cosmology and Astroparticle Physics, 2020, 045, doi: 10.1088/1475-7516/2020/04/045
- Fairbairn et al. (2011) Fairbairn, M., Rashba, T., & Troitsky, S. 2011, Phys. Rev. D, 84, 125019, doi: 10.1103/PhysRevD.84.125019
- Fang & Metzger (2017) Fang, K., & Metzger, B. D. 2017, The Astrophysical Journal, 849, 153, doi: 10.3847/1538-4357/aa8b6a
- Feldman & Cousins (1998) Feldman, G., & Cousins, R. 1998, Phys. Rev. D, 57(7), 3873
- Galaverni & Sigl (2008) Galaverni, M., & Sigl, G. 2008, Phys. Rev. Lett., 100, 021102, doi: 10.1103/PhysRevLett.100.021102
- Goldstein et al. (2017) Goldstein, A., et al. 2017, The Astrophysical Journal, 848, L14, doi: 10.3847/2041-8213/aa8f41
- Gorski et al. (2005) Gorski, K. M., Hivon, E., Banday, A. J., et al. 2005, The Astrophysical Journal, 622, 759, doi: 10.1086/427976
- Heck et al. (1989) Heck, D., et al. 1989, Wissenschaftliche Berichte FZKA, 6019
- Hjorth et al. (2017) Hjorth, J., Levan, A. J., Tanvir, N. R., et al. 2017, The Astrophysical Journal, 848, L31, doi: 10.3847/2041-8213/aa9110
- Kampert et al. (2019) Kampert, K.-H., Alejandro Mostafa, M., Zas, E., et al. 2019, Frontiers in Astronomy and Space Sciences, 6, doi: 10.3389/fspas.2019.00024
- Kimura et al. (2018) Kimura, S. S., Murase, K., & Mészáros, P. 2018, The Astrophysical Journal, 866, 51, doi: 10.3847/1538-4357/aadc0a
- Kotera & Silk (2016) Kotera, K., & Silk, J. 2016, The Astrophysical Journal, 823, L29, doi: 10.3847/2041-8205/823/2/l29
- McKernan et al. (2019) McKernan, B., Ford, K. E. S., Bartos, I., et al. 2019, The Astrophysical Journal, 884, L50, doi: 10.3847/2041-8213/ab4886
- Meegan et al. (2009) Meegan, C., Lichti, G., Bhat, P. N., et al. 2009, The Astrophysical Journal, 702, 791, doi: 10.1088/0004-637x/702/1/791
- Murase et al. (2016) Murase, K., Kashiyama, K., Mészáros, P., Shoemaker, I., & Senno, N. 2016, The Astrophysical Journal, 822, L9, doi: 10.3847/2041-8205/822/1/l9
- Risse & Homola (2007) Risse, M., & Homola, P. 2007, Mod. Phys. Lett., 22, 749, doi: https://doi.org/10.1142/S0217732307022864
- Rodrigues et al. (2019) Rodrigues, X., Biehl, D., Boncioli, D., & Taylor, A. 2019, Astroparticle Physics, 106, 10, doi: https://doi.org/10.1016/j.astropartphys.2018.10.007