THE POST-AGB STAR IRAS 07253-2001: PULSATIONS, LONG-TERM BRIGHTNESS VARIABILITY AND SPECTRAL PECULIARITIES
Abstract
The observations and comprehensive study of intermediate initial mass stars at the late stages of evolution, and after the asymptotic giant branch (AGB) in particular, are of crucial importance to identify the common properties for the stars of given group and to reveal binaries among them. This work aims to investigate photometric and spectral peculiarities of a poorly studied post-AGB candidate and infrared source IRAS 07253-2001. We present the new multicolour photometry obtained with the telescopes of the Caucasian mountain observatory and analyse it together with the data acquired by the All Sky Automated Survey for SuperNovae. We report on the detection of multiperiod brightness variability caused by pulsations. A beating of close periods, the main one of 73 days and additional ones of 68 and 70 days, leads to amplitude variations. We have also detected a long-term sine trend in brightness with a period of nearly 1800 days. We suppose it to be orbital and IRAS 07253-2001 to be binary. Based on new low-resolution spectroscopic data obtained with the 2.5-m telescope of the Caucasian mountain observatory in 2020 and 2023 in the 3500–7500 wavelength range we have identified spectral lines and compiled a spectral atlas. We have found the [N II], [Ni II] and [S II] forbidden emission lines in the spectrum and discuss their origin. The H line has a variable double-peaked emission component. We have derived preliminary estimates of the star’s parameters and detected a variation of radial velocity with a peak-to-peak amplitude of about 30 km s-1.
1 INTRODUCTION
One of the most urgent tasks in exploring the evolution of stars of intermediate initial masses (1–8 ) is to study these objects in the transition from the asymptotic giant branch (AGB) to planetary nebulae. During the thermal pulsing of AGB phase these stars suffer large mass loss and supply the interstellar medium with nucleosynthesis products created during the stars’ evolution and, thus, along with supernova remnants stimulate the further development of their host galaxies (Iben and Renzini, 1983).
As it turned out from observations, the vast majority of objects in the post-asymptotic (post-AGB) stage of evolution are variable stars. The type of brightness variability depends on the temperature of the star, that is, on its position on the horizontal evolutionary track. Cooler objects pulsate, and, as a rule, not with one single frequency (Sasselov, 1984; Arkhipova et al., 2010; Hrivnak et al., 2020) while the hot ones show rapid (with a characteristic time of several days or less) irregular variability, which may be due to variations in the stellar wind power, as well as to the pulsations of the compact core (Handler et al., 1997; Arkhipova et al., 2013). Besides, the variations of circumstellar reddening in inhomogeneous dust shells play a significant role in the occurrence of photometric variability of post-AGB stars (Arkhipova et al., 2010; Hrivnak et al., 2022).
Currently, the pulsation theory of stars in the late stages of evolution is under development. It’s rather difficult to construct such a theory because for AGB and post-AGB stars the convection processes and outflows of matter are of crucial importance, and these are hard to simulate (Fadeev, 2019). The pulsation characteristics obtained from observations for as many stars as possible provide valuable information for computing pulsation models.
A considerable portion of the currently known post-AGB objects are binaries (Van Winckel, 2003, 2007). These stars are not contact systems at this stage of evolution, but they should have been subjected to strong interaction in the past, when the main star was on AGB and had a larger size (Van Winckel, 2017), so it is important to distinguish between binary and single objects and to consider them separately when comparing with theoretical evolutionary models.
Among the 209 most probable post-AGB objects presented in the catalogue of Szczerba et al. (2007), there are stars that have not been investigated well enough. One of them is the infrared (IR) source IRAS 07253-2001, which was included in the list of post-AGB candidates by García-Lario et al. (1990). For the first time, the authors obtained the observations for the star and constructed the energy distribution based on these data, and the IRAS data in the wavelength range from 12 to 60 m as well. In García-Lario et al. (1990), the IR source was wrongly identified with the bright neighboring star HD 59049, nevertheless the -observations refer to IRAS 07253-2001, and not to HD 59049.
Later the object was added to the sample of possible OH/IR masers (Blommaert et al., 1993) but the 1612 MHz emission was not detected. Neither H2O (Suárez et al., 2007) nor SiO (Yoon et al., 2014) maser emission associated with IRAS 07253-2001 was found.
Blommaert et al. (1993) classified IRAS 07253-2001 as an oxygen-rich (O-rich) AGB object which was later confirmed by Suh and Hong (2017) who included the source in the catalogue of O-rich AGB objects.
Reddy and Parthasarathy (1996) obtained the photometry and a low-resolution spectrum for IRAS 07253-2001. The authors defined the spectral class as F5 Ie and derived a satisfactory model fit to the spectral energy distribution in the wavelength region from 0.4 to 100 m which was a sum of radiation from the photosphere with K and and the dust shell heated to K. At the same time the authors indicated the presence of both cold and warm dust shells in the system. According to the calculations of Reddy and Parthasarathy (1996) the star has a total extinction of , radius of , is surrounded by a dust shell with and is located at a distance of kpc. Suárez et al. (2006) classified IRAS 07253-2001 as an F2 supergiant based on a low-resolution spectrum.
Our aim was to study the photometric behaviour of the star and its spectral peculiarities, and to determine the star’s parameters based on both archive and our new data. Here we present the analysis of photometric and spectroscopic data for the star obtained with the telescopes of the Caucasian mountain observatory of the Sternberg astronomical institute of the Lomonosov Moscow State University (CMO SAI MSU) and the photometry acquired by the All Sky Automated Survey for SuperNovae (ASAS-SN). We report on the detection of photometric and spectral variability and estimate the star’s parameters.
The obtained observational data have demonstrated that the equipment, weather conditions and the skills of the staff at the CMO SAI MSU have proved suitable to get good quality data for the observational project devoted to post-AGB stars and related objects which was started on the telescopes of the Crimean astronomical station of SAI MSU more than 30 years ago.
2 OBSERVATIONS
2.1 -photometry
Optical photometry for the star was obtained on the 60-cm Ritchey-Crétien telescope (RC600) at the CMO SAI MSU. The telescope is equipped with a set of photometric filters and an Andor iKon-L CCD (20482048 pixels of 13.5 m, the pixel scale is pixel-1, the field of view is ). For a more detailed description of the telescope and instrumentation we refer to Berdnikov et al. (2020). The observations were carried out in remote control mode. We have observed IRAS 07253-2001 for four seasons of visibility in 2019–2023. A complete set of exposures for each night consisted of 2–3 frames in each of the filters.
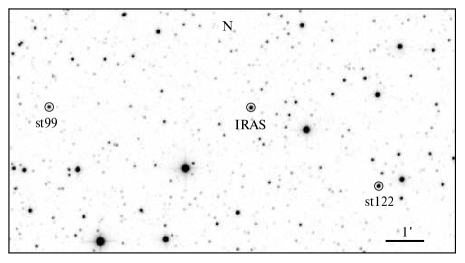
On one photometric night (January 2, 2020) we made a series of frames at close airmass for the standard field SA104 presented in Landolt (2009). Astrometry and photometry for the standard stars from the field were taken from the database of Peter Stetson111https://www.canfar.net/storage/list/STETSON/Standards/L104. Based on the photometry for the standard field, we derived the transformation coefficients to calibrate our instrumental photometry to the standard system. Then we selected a sample of rather bright stars of – in the vicinity of IRAS 07253-2001 and transformed their instrumental magnitudes to the standard system using the derived coefficients. Based on the reduced data for the IRAS 07253-2001 field we chose two stars with brightness and colours close to those of IRAS 07253-2001 to be used later as comparison stars in differential photometry. According to the ASAS-SN database the selected stars did not show variability on a timescale of about 4000 days. Fig. 1 provides a finding chart for IRAS 07253-2001 and comparison stars. Their 2MASS designations and our derived magnitudes are listed in Table 1.
| Star | ID 2MASS | |||||
|---|---|---|---|---|---|---|
| St99 | 07275650-2007120 | 14.598 | 14.243 | 13.466 | 13.051 | 12.641 |
| St122 | 07271826-2009324 | 13.494 | 13.419 | 12.797 | 12.443 | 12.083 |
We present the resulting photometry for IRAS 07253-2001 in Table 2 (in its entirety the table is provided in electronic form (http://lnfm1.sai.msu.ru/~davnv/iras07253/UBVRcIc.txt)) where for every night we list the mean time of observation and magnitudes in each of photometric bands averaged over 2–3 frames. Our uncertainties defined as standard deviations for each night and averaged over all nights are , , , , .
| JD, 2400000+ | |||||
|---|---|---|---|---|---|
| 58784.610 | 13.736 | 13.449 | 12.675 | 12.199 | 11.708 |
| 58785.617 | 13.698 | 13.479 | 12.676 | 12.207 | 11.699 |
| 58791.602 | 13.603 | 13.313 | 12.569 | 12.111 | 11.638 |
| … | … | … | … | … | … |
2.2 IR-photometry
Near-IR photometry was carried out on the 2.5-m telescope of the CMO SAI MSU with the ASTRONIRCAM camera-spectrograph (Nadjip et al., 2017) during six seasons of visibility in 2018–2023. We used the dithering mode to obtain images in the bands of the MKO–NIR system (Mauna Kea Observatories Near-InfraRed (Simons and Tokunaga, 2002; Tokunaga et al., 2002)) and also in the band in 2021–2023. We took 10–15 images in each filter for each pointing. The initial processing of raw images described in detail in Tatarnikov et al. (2023) included the correction for non-linearity and bad pixels, dark subtraction, flat-fielding and background subtraction. Then we performed aperture-based photometry. Usually we used HD 59049 (A2 III/IV) as a comparison star: it is close to IRAS 07253-2001 in IR brightness and appeared in the field of view of the camera (). Its MKO-NIR magnitudes (, , , ) were calculated from the 2MASS magnitudes according to the transforming equations given in Leggett et al. (2006). Sometimes during the 2021–2022 season HD 59049 was not caught by the camera. Then we used HD 59095 (A3 IV/V) as a comparison star. Its magnitudes (, , , ) were derived similarly but adjusted so that the brightness differences with HD 59049 corresponded to those observed when both comparison stars came into view. Tables 3 and 4 present the resulting -photometry. The magnitudes were calculated as mean values for each pointing. The errors were computed as standard deviations, they do not include the uncertainties of the comparison stars’ magnitudes. Their mean values are , , , .
| JD, 2400000+ | , mag | , mag | , mag |
|---|---|---|---|
| 58147.331 | 10.867 | 10.048 | 8.808 |
| 58151.340 | 10.893 | 10.079 | 8.852 |
| 58153.360 | 10.893 | 10.084 | 8.850 |
| 58156.296 | 10.911 | 10.102 | 8.899 |
| 58166.312 | 10.888 | 10.054 | 8.840 |
| 58180.248 | 10.892 | 10.077 | 8.834 |
| 58482.412 | 10.906 | 10.097 | 8.877 |
| 58486.395 | 10.901 | 10.097 | 8.872 |
| 58487.375 | 10.896 | 10.089 | 8.858 |
| 58489.350 | 10.885 | 10.097 | 8.848 |
| 58493.401 | 10.903 | 10.107 | 8.895 |
| 58504.439 | 10.848 | 10.079 | 8.905 |
| 58511.479 | 10.844 | 10.079 | 8.862 |
| 58863.360 | 10.901 | 10.105 | 8.870 |
| 58866.356 | 10.923 | 10.126 | 8.918 |
| 58867.410 | 10.912 | 10.126 | 8.923 |
| 58868.354 | 10.913 | 10.119 | 8.919 |
| 58869.371 | 10.899 | 10.122 | 8.924 |
| 58870.385 | 10.880 | 10.107 | 8.906 |
| 58871.349 | 10.891 | 10.100 | 8.906 |
| 58884.344 | 10.948 | 10.171 | 9.014 |
| 58891.351 | 10.895 | 10.081 | 8.920 |
| 58908.203 | 10.988 | 10.133 | 8.900 |
| 58909.272 | 10.981 | 10.135 | 8.867 |
| 58911.257 | 10.969 | 10.132 | 8.881 |
| 58914.269 | 10.907 | 10.068 | 8.851 |
| 58919.219 | 10.928 | 10.110 | 8.873 |
| 58920.283 | 10.927 | 10.102 | 8.863 |
| JD, 2400000+ | , mag | , mag | , mag | , mag | JD, 2400000+ | , mag | , mag | , mag | , mag |
|---|---|---|---|---|---|---|---|---|---|
| 59541.565 | 11.575 | 11.011 | 10.174 | 8.970 | 59656.210 | – | 11.020 | 10.152 | 8.939 |
| 59547.503 | – | 11.055 | 10.220 | 9.014 | 59679.203 | – | 10.990 | 10.148 | 8.960 |
| 59552.396 | – | 11.052 | 10.179 | 8.990 | 59890.542 | – | 10.905 | 10.095 | 8.931 |
| 59555.467 | – | 11.056 | 10.187 | 8.980 | 59892.544 | – | 10.916 | 10.107 | 8.956 |
| 59565.416 | 11.617 | 11.091 | 10.209 | 9.001 | 59895.546 | – | 10.929 | 10.116 | 8.966 |
| 59571.483 | 11.607 | 11.061 | 10.176 | 8.952 | 59899.598 | – | 10.904 | 10.098 | 8.934 |
| 59584.435 | 11.596 | 11.034 | 10.158 | 8.968 | 59912.470 | – | 10.933 | 10.118 | 8.938 |
| 59599.379 | – | 11.050 | 10.197 | 9.013 | 59915.440 | 11.425 | 10.941 | 10.124 | 8.949 |
| 59602.308 | – | 11.036 | 10.190 | 8.982 | 59922.458 | 11.407 | 10.907 | 10.081 | 8.877 |
| 59606.297 | – | – | – | 8.971 | 59930.432 | – | 10.913 | 10.079 | 8.896 |
| 59609.475 | – | 10.996 | 10.186 | 9.015 | 59945.519 | – | 10.895 | 10.087 | 8.886 |
| 59611.350 | 11.524 | 11.011 | 10.163 | 8.960 | 59953.477 | 11.385 | 10.900 | 10.102 | 8.938 |
| 59616.329 | 11.515 | 11.016 | 10.163 | 8.948 | 59954.384 | 11.391 | 10.903 | 10.105 | 8.938 |
| 59623.394 | 11.561 | 11.034 | 10.174 | 8.981 | 59958.394 | 11.386 | 10.907 | 10.092 | 8.923 |
| 59625.258 | 11.566 | 11.040 | 10.194 | 8.991 | 59962.366 | 11.354 | 10.881 | 10.071 | 8.887 |
| 59636.285 | 11.533 | 11.028 | 10.180 | 8.955 | 59980.331 | 11.357 | 10.873 | 10.068 | 8.908 |
| 59639.211 | 11.548 | 11.033 | 10.173 | 8.956 | 60000.243 | 11.413 | 10.942 | 10.119 | 8.930 |
| 59641.270 | 11.556 | 11.039 | 10.167 | 8.964 | 60012.281 | 11.433 | 10.947 | 10.065 | 8.922 |
| 59645.267 | 11.577 | 11.052 | 10.186 | 8.978 |
2.3 ASAS-SN data
The observational data from the All Sky Automated Survey for SuperNovae (Kochanek et al., 2017; Shappee et al., 2014) conducted on robotic telescopes appeared very useful for the study of the star’s photometric behaviour.
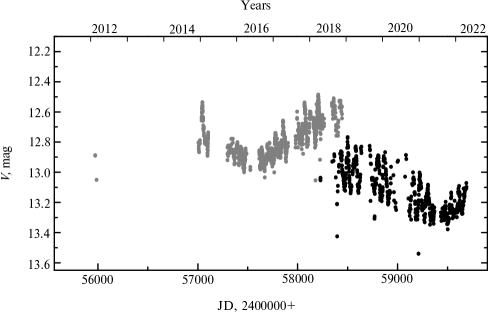
About 920 brightness estimates with an accuracy of were obtained by the ASAS-SN project for IRAS 07253-2001 from February 14, 2012 till May 25, 2018 (HJD = 2455972.9–2458264.5). The -band observations started in 2018. In this work we used the data obtained from February 17, 2018 till April 19, 2022 (HJD = 2458226.6–2459689.6). A total amount of 580 brightness estimates with an accuracy of was obtained for the interval.
2.4 Spectroscopic observations
Spectroscopic observations of IRAS 07253-2001 were carried out in 2020 and 2023 on the 2.5-m telescope of the CMO SAI MSU with the new low-resolution Transient Double-beam Spectrograph (TDS) equipped with holographic gratings (Potanin et al., 2020). The detectors in use are Andor Newton 940P cameras with E2V CCD42-10 CCDs. A long slit of width of was selected which provided the best spectral resolution but at the cost of losing some light if seeing was worse than . The light losses at the slit may be different for the program and standard stars due to varying seeing and the accuracy of centering the star in the slit. Therefore it’s impossible to obtain absolute flux-calibrated spectra with our spectrograph when a slit is used. The spectra covered the range 3500–7500. The spectral resolution was 1300 for the 3500–5720 region (blue channel) and 2500 for the 5720–7500 region (red channel). The log of observations can be found in Table 5. The moments of spectroscopic observations are marked in Fig. 4.
The reduction sequence was performed using a number of self-developed scripts. The processing algorithm is described in Potanin et al. (2020). Although we did not aim to derive absolute stellar fluxes, and moreover we used continuum-normalized spectra, nevertheless it was necessary to observe standard stars to eliminate small-scale features present in the spectrum due to the transmission inhomogeneities of the device and the atmospheric absorption bands. The stars from the list of spectrophotometric standards compiled at the European Southern Observatory222https://www.eso.org/sci/observing/tools/standards/spectra/stanlis.html were used during observations in 2020. In 2023 we used an A0 V star HIP 38789 as a spectrophotometric standard. It is located close to IRAS 07253-2001, its spectrum was obtained with a signal-to-noise ratio just after the object.
| Date | HJD | , | SNR | Standard |
| s | ||||
| 2020/01/18 | 8867.4 | 130 | BD +25 4655 | |
| 2020/12/14 | 9198.5 | 170 | Feige 66 | |
| 2023/01/06 | 9951.4 | 190 | HIP 38789 | |
| 2023/01/10 | 9955.4 | 340 | HIP 38789 | |
| SNR is a signal-to-noise ratio for the continuum in the resulting spectrum near 6000. | ||||
The continuum-normalized spectrum of the standard star was processed using the pySME project333https://pysme-astro.readthedocs.io/en/latest/ (Piskunov and Valenti, 2017; Wehrhahn et al., 2023) and we managed to deduce stellar parameters (the effective temperature , the surface gravity , the overall metallicity and the microturbulence velocity km s-1) which fitted the spectral lines with an accuracy better than 1%. The simulated spectrum was integrated with the standard transmission curves for the filters444http://svo2.cab.inta-csic.es/theory/fps/, Generic and flux-calibrated based on the photometry taken from the Simbad database, whereas the photometry served to get interstellar extinction by assuming a standard law of interstellar extinction. The resulting value is in agreement with the absence of diffuse interstellar bands in the observed spectrum. This approach makes it possible to reconstruct a pixel-to-pixel transmission curve and to remove telluric absorptions from the observed spectrum under the condition of observing at the same airmass and with the full width of the slit being filled with stellar light. The latter condition is due to the fact that non-uniform illumination of the slit affects the line profiles; the difference in the profiles of the tellurics between the object and the standard will lead to incomplete compensation of them when divided by the transmission curve and to the appearance of residual artefacts in the spectrum. A similar effect will arise if a shift of wavelength occurs between the observations of the object and the standard due to device deformations.
3 OBSERVATIONAL DATA ANALYSIS
3.1 Search for periodicity
A preliminary examination of the photometric data showed that the star’s brightness varies quasi-periodically with time. In order to determine a period we used dense data sets of the and photometry obtained by ASAS-SN (Fig. 2).
To perform a frequency analysis we used the program WINEFK developed by V. P. Goranskij555http://www.vgoranskij.net/software/WinEFrusInstruction.pdf which implements a discrete Fourier transform for sets of data with arbitrary spacing in time (Deeming, 1975).
First, we removed the trend which was satisfactorily fitted with a quadratic polynomial. Then, we employed the Fourier transform and successive whitening – the subtraction of phase-smoothed periodic variation from the observed light curve. As a result, three periodic components in the light curve for 2012–2018 were identified: the primary period of and, after successive pre-whitening the data, и . The data for 2018–2022 processed similarly yielded the primary period of and, after whitening applied, the close values of and , but also . The amplitude spectra for the 10–100 days period range obtained from the and photometry with the primary periods of and marked are shown in Fig. 3 as well as the phase curves folded on these periods. The maximum peak-to-peak variations are and .

The detected brightness variability of IRAS 07253-2001 is typical for the F0–F8 supergiants at the post-AGB stage of evolution. Semi-regular brightness variations of these stars are characterized by small amplitudes (from to ), the periods of 30–100 days, switching between modes of close frequencies—the properties which were described in Sasselov (1984) for the UU Her type stars and confirmed later for a number of other post-AGB objects (Arkhipova et al., 1993; Hrivnak and Lu, 2000; Kiss et al., 2007). A combined study of light, colour and radial velocity curves supports the idea that these stars vary in brightness due to pulsations (Hrivnak et al., 2013, 2018).
3.2 Multicolour photometry analysis
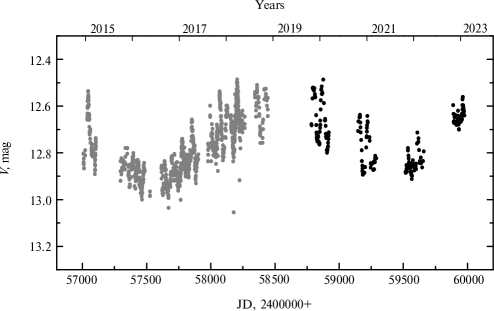
The light and , , colour curves resulted from our observations performed on the RC600 telescope during four seasons of visibility in 2019–2023 are shown in Fig. 4.

It’s clearly seen that the star undergoes semi-regular brightness oscillations in the bands with varying amplitude superimposed on a long-term trend. The maximum amplitudes of brightness variations were observed during the first two seasons: , , , and .
With the trend fitted by a quadratic polynomial removed, the frequency analysis yielded a primary period of . Using the WINEFK program we subtracted a phase-smoothed periodic oscillation with from the observed light curve and found a close period . The values are in good agreement with the periods derived from the ASAS-SN data.
We obtained near-IR photometry for six seasons during 2018–2023. Figures 5 shows the light and , colour curves.

The near-IR variations in the bands are about within each season that is larger than the observational error. The near-IR measurements are less numerous than the optical ones and the expected amplitude of oscillations is smaller as well, so we were not able to detect a periodic component of brightness variations. A long-term trend can be traced well and is similar to that in the optical.
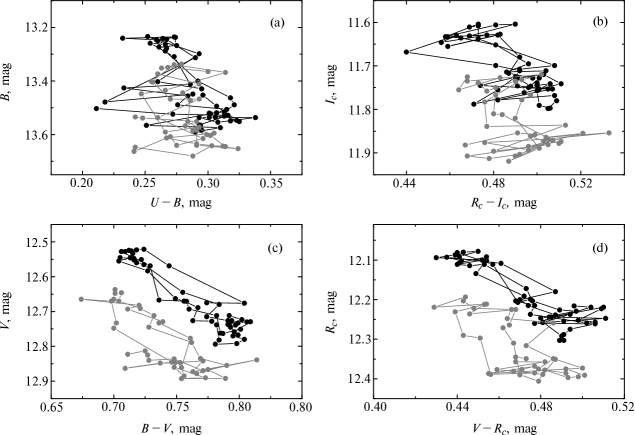
During the first two seasons of optical observations when the periodic oscillations were more prominent a clear correlation between the brightness and the and colours was seen (Fig. 6): the star was redder when fainter, which is indicative of temperature changes due to pulsations. The colour correlation with brightness is less pronounced for the first season (black dots) and almost absent for the second one (grey dots). One can also see that the mean brightness in all the bands was lower in 2020–2021 (grey dots) whereas the season-mean colours did not change.
3.3 Long-term trend of brightness
Figure 7 shows the summary light curve incorporating the ASAS-SN and RC600 data over the 2014–2023 interval. Figure 7 implies that there is a sine wave with a large enough period. We processed the 2014–2023 data set with WINEFK and in the 500–3000 days range we found a period of days. Figures 8 and 9 show the phase light and , , , , colour curves, respectively, folded on this period. The optical and near-IR brightness varies with phase as well as the colour does, whereas the , , and colours do not.


The long-term brightness variability with a period of about 1800 days which we have found is not surprising for post-AGB objects. For example, the RV Tau stars of the RVb subtype which are post-AGB stars as well demonstrate a long-term modulation of mean brightness with the periods of 470–2800 days in addition to their pulsation activity Soszyński et al., 2017). In our current understanding, this type of variability is considered related to binarity and the presence of a circumbinary dusty disc which produces variable obscuration of the central source due to orbital motion (Kiss and Bódi, 2017).
Hotter post-AGB objects, which have already left the instability strip, sometimes show a long-term modulation of mean brightness, too. V510 Pup (IRAS 08005-2356), a bipolar protoplanetary nebula with a binary central star, may serve as an example. Manick et al. (2021) discovered its brightness variability with a period of days based on optical () and near-IR () photometric data. The authors also performed spectroscopic monitoring of the star and detected a variation of radial velocity with the same period of days which they adopted as the orbital period of the system.
Thus, taking into consideration the fact that some post-AGB objects demonstrate a long-term periodic trend of brightness we consider that the found period is orbital and the most likely reason for this type of brightness variability with optical colours being constant is the varying obscuration of the central source by large particles of the dusty disc which produce neutral absorption during the orbital motion as was detected for IRAS 19135+3937 (Gorlova et al. (2015) and our unpublished data).
3.4 Analysis of spectroscopic data
In total, we obtained four spectra for IRAS 07253-2001 in 2020 and 2023. The best-quality spectrum (with the highest SNR) was acquired on January 10, 2023 under very good weather conditions with the longest exposures. That spectrum was mainly used for the following analysis. Figure 10 shows the continuum-normalized spectrum for that date with the identified lines marked. For line identification we used the VALD3 database (Ryabchikova et al., 2015).
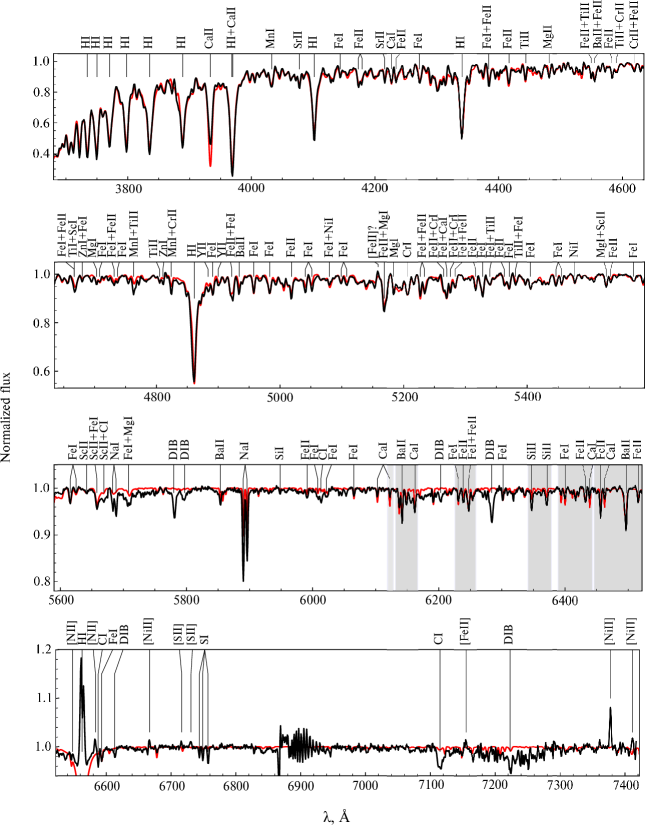
In addition to hydrogen lines there are numerous absorptions of neutral and once-ionized metals Fe I, Fe II, Mg I, Mn I, Sc II, Ni I, Si II, etc. The presence of strong lines of S I ( 6744, 6749, 6757) and C I ( 6010–6020, 6588, 7107–7120) is worth mentioning. We also detected the lines of -process elements: barium Ba II ( 5853, 6142, 6498), strontium Sr II ( 4078 and 4215) and yttrium Y II ( 4884). Broad absorptions at 5797, 6286, 6613 may be identified as diffuse interstellar bands (DIBs). In the spectrum of IRAS 07253-2001 the K Ca II line ( 3933) is shallower than the blend H+H Ca II in contrast to what is seen in the spectra of other post-AGB stars of close spectral classes (V887 Her, V1648 Agl and V448 Lac) where these lines are quite equal in depth (Hrivnak et al. (1989); Suárez et al. (2006) and our unpublished data).
3.4.1 Envelope emission lines
An important feature of the spectrum is the presence of the emission component of H. The H profile is shown in Fig. 11 where we plot the spectra obtained on January 18, 2020, December 14, 2020, and January 10, 2023. We do not show the spectra obtained on January 6, 2023 as there is almost no difference in the H profile with that from January 10, 2023 (Fig. 11).
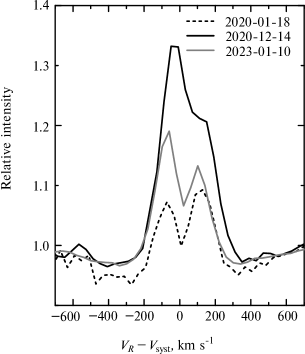
The H line demonstrates a double-peaked emission component and varies significantly with time. The times of spectroscopic observations are marked in Fig. 4. On January 18, 2020 when the star was at pulsation maximum with , the emission component was the faintest. The next spectroscopic observation carried out on December 14, 2020 coincided with a pulsation minimum when the brightness was . At that moment the H emission in the normalized spectrum appeared considerably stronger, with the central absorption almost absent. On January 10, 2023 at the emission component was double-peaked again and had intermediate normalized intensity.
The emission equivalent width variation can be explained if we assume that the stellar continuum varies in brightness whereas the emission comes from a circumbinary gaseous envelope and has constant intensity. Thus, a double-peaked profile arises when the emission is added on the photospheric absorption.
We did not expect to detect any forbidden lines in the spectrum of a cool star and surprisingly we have found the emissions [N II] 6548, 6584, [S II] 6716, 6731, [Ni II] 6667, 7378, 7412 and [Fe II] 7155. As far as we know, this phenomenon has not been observed for F0–F8 post-AGB supergiants unlike hot post-AGB stars with K which spectra are a sum of radiation from the central star and a low-excitation gas shell as it was shown for IRAS 14331-6435 (Arkhipova et al., 2018) and IRAS 18379-1707 (Ikonnikova et al., 2020).
We list the equivalent widths for [N II] 6584, [S II] 6716, 6731, [Ni II] 6667, 7378, 7412 in Table 6. The lines being faint, the uncertainties in the measurements of equivalent widths are as large as 15–20%.
| Line | , Å | , Å |
|---|---|---|
| [N II] 1F | 6583.45 | 0.057 |
| [Ni II] 2F | 6666.80 | 0.037 |
| [S II] 2F | 6716.47 | 0.024 |
| [S II] 2F | 6730.85 | 0.036 |
| [Ni II] 2F | 7377.83 | 0.221 |
| [Ni II] 2F | 7411.61 | 0.108 |
The line intensity ratios [S II] and [Ni II] barely depend on electron temperature and may be used to estimate the electron density in the region where the emissions arise. We have rejected the [Ni II] line from the analysis as it is located at the edge of our spectral range and is possibly distorted.
Before we compare the observed intensity ratios with the predicted ones, it’s necessary to correct them for reddening. Reddy and Parthasarathy (1996) give the value (or ) for the interstellar extinction and (or ) for the total one which includes the circumstellar part. Vickers et al. (2015) adopted . As we don’t know the distance to the object (see Section 4), we can’t yet estimate using the interstellar extinction maps.
Taking into account the ambiguity of , we derived the intensity ratios for [S II] and [Ni II] using the equivalent widths for these lines and the modelled spectral energy distribution (see Section 3.4.2 for details). To estimate for the region where the [S II] and [Ni II] emissions originate we compared the observed ratios with the theoretical ones based on the emissivities calculated under non-LTE conditions by Giannini et al. (2015). We derived – cm-3 for the [S II] zone and a significantly larger value of – cm-3 for the [Ni II] region for the temperature range – K. This result is in agreement with the conclusion of Bautista et al. (1996) articulated for gas nebulae that the value of derived from the [Ni II] lines appears larger than that derived from [S II].
The origin of forbidden emission lines seen in the spectrum of IRAS 07253-2001 is still questionable. If we consider IRAS 07253-2001 binary then the forbidden lines may point to the presence of a hot component in the system, most likely a white dwarf, and to detect it ultraviolet observations would be needed.
3.4.2 Determination of the stellar parameters
We have tried to determine the stellar parameters by comparing the observed spectrum with the synthetic one found by the pySME program (see the reference above) using the MARCS model atmospheres (Gustafsson at el., 2008).
A model with К, , km s-1, [Me/H] fits the hydrogen lines and most of the metal lines well with an exception for the Ca II lines which appear stronger in the model spectrum than in the observed one and for the S I and C I lines enhanced in our spectrum but absent in the model one (Fig. 10). To obtain more reliable stellar parameters and to estimate abundances in the atmosphere a high-resolution spectroscopy combined with a non-LTE approach would be needed.
This star with its lower metallicity along with the presence of strong enough lines of S and C provides a good illustration of the peculiar abundances of some post-AGB stars noted in early works, e.g. Waelkens et al. (1991) for HD 52961. Thus, some A–F supergiants demonstrate almost solar abundances of C, N, O, S and Zn but the abundances of Fe, Mg, Ca, Si, Cr and some other elements are much lower than solar. Lamers (1992) suggested that the atmospheres of post-AGB stars were originally solar in composition but at the end of the AGB stage some heavy nuclei were captured by dust grains and blown away from the atmosphere. So, the present atmospheres of these stars are comprised of heavy-elements-depleted gas.
Now we are going to compare the derived parameters with the results published previously.
Using a low-resolution spectrum covering 5800–8500, Reddy and Parthasarathy (1996) derived an F5 I(e) spectral class for the star. An effective temperature of K was determined based on the –spectral class calibration proposed by Flower (1977). Note that the Straižys (1982) calibration gives K for this spectral and luminosity class. Reddy and Parthasarathy (1996) adopted the value of from the tables with the –luminosity relations (Flower, 1977).
IRAS 07253-2001 was assigned an F2 I spectral type by Suárez et al. (2006) based on a low-resolution spectrum (spectral dispersion of 2.47 Å pixel-1) covering 4272–6812. Molina (2018) derived K relying on the same spectrum and the empirical relation which incorporates the equivalent width of Ca II K (). Note that the line used was out of the observed wavelength coverage. Other parameters presented by Molina (2018), namely [Fe/H] and , do not seem reliable as well, since they were estimated from the equations given therein and the equations include the equivalent widths of the Fe I () blend and Fe, Ti II (–) lines but the measurements of these spectral features are not listed in Table 1 of Molina (2018).
3.4.3 Radial velocity measurements
Since the model spectrum fits the most lines quite well, we can use it for measuring radial velocity. For this purpose we have selected eight spectral regions with best coincidence. All the selected areas relate to the red channel because the wavelength calibration of TDS is much more accurate for the red channel than for the blue one. Besides, a large number of sky emission lines allows the correction of calibration shift which arises due to deformation of the spectrograph. The resulting calibration accuracy relative to sky lines is about 3 km s-1. After the wavelengths are calibrated relative to sky lines, they are corrected to the solar system barycenter. In order to compute radial velocity relative to the model spectrum, the latter is convolved with a Gauss function to fit the widths of absorption lines. The observed spectrum in each of the selected areas is additionally normalized and scaled to fit best the continuum level and line depths of the model spectrum. Radial velocity and two scaling parameters are computed using the least-square method.
A mean radial velocity averaged over the selected areas was found to be km s-1 for January 18, 2020, km s-1 for December 14, 2020, km s-1 for January 6 and 10, 2023, taking into account the calibration error. The difference in radial velocity between December 2020 and January 2023 is clearly seen at first sight: the absorption lines are shifted, whereas the interstellar and forbidden lines stay in place. So, the star shows a variation of radial velocity with an amplitude not less than 30 km s-1. A typical range of radial velocity due to pulsational motions in the atmosphere of post-AGB stars is about 10 km s-1 (Hrivnak et al., 2018). Therefore, the derived variation of radial velocity may reveal orbital motion, and moreover the semi-amplitude value of km s-1 falls into the range of for the known binary post-AGB stars (see Oomen et al. (2018) and reference therein).
4 CONCLUSION
The primary results of this work are the following:
For the first time a long-term multicolour photometry in the optical and near-IR range was acquired for the post-AGB object IRAS 07253-2001.
Based on the ASAS-SN and our data, low-amplitude quasi-periodic brightness variability with the main period of about 73 days and close periods of 68 and 70 days was found. The variation of brightness amplitude is caused by the beating of close frequencies. The colour–brightness relation shows evidence for temperature variations due to pulsations. The variability pattern and pulsational periods are in agreement with what is observed for typical post-AGB stars with F0–F8 spectral types (Arkhipova et al., 2010, 2011; Hrivnak et al., 2010, 2022).
Long-term brightness variability with a period of about 1800 days was found based on the ASAS-SN and our multicolour data and this period is likely orbital.
Based on spectroscopic data of higher resolution that previous measurements we identified spectral lines and compiled a spectral atlas. We fitted the spectrum and found the atmospheric parameters for the star: K, , km s-1, [Me/H] .
A variation of radial velocity with an amplitude of about 30 km s-1 was detected which we interpret as an evidence for binarity.
The H emission component was shown to be variable. We draw a conclusion that it originates from the stellar envelope.
Forbidden emission lines radiated by a gas envelope were detected in the spectrum. We suppose that they are excited by the hot star in the binary.
The acquired data covering a wide wavelength range from 0.35 m (the -band) to 2.2 m (the -band) can be used later for modelling the spectral energy distribution of the star and determining the dust shell parameters.
There is no doubt about the star’s evolutionary status: it is surely a post-AGB supergiant. But we are not able to assess its mass by comparing its parameters (effective temperature and luminosity) with model simulations (e.g., Miller Bertolami (2016)). We hoped to constrain the luminosity using the GAIA data. But the parallax is negative in the GAIA DR2 catalogue mas (Brown et al., 2018). The value mas from the GAIA DR3 catalogue (Brown et al., 2021) yields a distance of pc (Bailer-Jones et al., 2021) and luminosity of (Oudmaijer et al., 2022) which is out of range of the luminosities predicted for post-AGB models (Miller Bertolami, 2016). It’s worth mentioning that the parameter RUWE (Renormalised Unit Weight Error) which parametrizes the quality of astrometric solution is for IRAS 07253-2001 which indicates an extremely high uncertainty in parallax that makes it very unreliable.
ACKNOWLEDGEMENTS
This work has been supported by the M. V. Lomonosov Moscow State University Program of Development (scientific and educational school ‘‘Fundamental and applied space research’’). We are grateful to the staff of the 2.5-m telescope of the CMO SAI MSU who carried out single observations, namely B. S. Safonov, O. V. Vozyakova, O. V. Egorov, V. S. Lander.
S. G. Zheltoukhov and A. M. Tatarnikov acknowledge support from the Russian Scientific Foundation (grant No. 23-22-00182).
CONFLICT OF INTEREST
The authors declare that there is no conflict of interest.
References
- Arkhipova et al. (1993) V. P. Arkhipova, N. P. Ikonnikova and R. I. Noskova, Astronomy Letters 19, 169 (1993).
- Arkhipova et al. (2010) V. P. Arkhipova, N. P. Ikonnikova and G. V. Komissarova, Astronomy Letters 36, 269 (2010).
- Arkhipova et al. (2011) V. P. Arkhipova, N. P. Ikonnikova and G. V. Komissarova, Astronomy Letters 37, 635 (2011).
- Arkhipova et al. (2013) V. P. Arkhipova, M. A. Burlak, V. F. Esipov et al. Astronomy Letters 39, 619 (2013).
- Arkhipova et al. (2018) V. P. Arkhipova, M. Parthasarathy, N. P. Ikonnikova et al., Monthly Notices Royal Astron. Soc. 481, 3935 (2018).
- Bailer-Jones et al. (2021) C. A. L. Bailer-Jones, J. Rybizki, M. Fouesneau et al., Astron. J. 161, id. 147 (2021).
- Bautista et al. (1996) M. A. Bautista, J. Peng and A. K. Pradhan, Astrophys. J. 460, 372 (1996).
- Berdnikov et al. (2020) L. N. Berdnikov, A. A. Belinskii, N. I. Shatskii et al., Astronomy Reports 64, 310 (2020).
- Blommaert et al. (1993) J. A. D. L. Blommaert, W. E. C. J. Van Der Veen and H. J. Habing, Astron. and Astrophys. 267, 39 (1993).
- Brown et al. (2018) A. G. A. Brown et al. (Gaia Collab.), Astron. and Astrophys. 616, A1 (2018).
- Brown et al. (2021) A. G. A. Brown et al. (Gaia Collab.), Astron. and Astrophys. 649, id. A1, 20 (2021).
- Deeming (1975) T. J. Deeming, Astrophys. and Space Sci. 36, 137 (1975).
- De Ruyter et al. (2006) S. De Ruyter, H. Van Winckel, T. Maas et al., Astron. and Astrophys. 448, 641 (2006).
- Fadeev (2019) Yu. A. Fadeev Astronomy Letters 45, 521 (2019).
- Flower (1977) P. J. Flower, Astron. and Astrophys. 54, 31 (1977).
- García-Lario et al. (1990) P. García-Lario, A. Manchado, S. R. Pottasch et al., Astron. and Astrophys. Suppl. 82, 497 (1990).
- García-Lario et al. (1997) P. García-Lario, M. Parthasarathy, D. de Martino et al., Astron. and Astrophys. 326, 1103 (1997).
- Giannini et al. (2015) T. Giannini, S. Antoniucci, B. Nisini et al., Astrophys. J. 814, article id. 52 (2015).
- Gorlova et al. (2015) N. Gorlova, H. Van Winckel, N. P. Ikonnikova et al., Monthly Notices Royal Astron. Soc. 451, 2462 (2015).
- Gustafsson at el. (2008) B. Gustafsson, B. Edvardsson, K. Eriksson et al., Astron. and Astrophys. 486, 951 (2008).
- Handler et al. (1997) G. Handler, R.H. Mendez, R. Medupe et al., Astron. and Astrophys. 320, 125 (1997).
- Hrivnak et al. (1989) B. J. Hrivnak, S. Kwok and K. M. Volk Astrophys. J. 346, 265, (1989).
- Hrivnak and Lu (2000) B. J. Hrivnak and W. Lu, Proc. IAU Symp. No. 177, Ed. by Robert F. Wing (Kluwer Academic Publishers, Dordrecht, 2000), p. 293
- Hrivnak et al. (2010) B. J. Hrivnak, W. Lu, R. E. Maupin and B. D. Spitzbart, Astrophys. J. 709, id. 1042 (2010).
- Hrivnak et al. (2013) B. J. Hrivnak, W. Lu, J. Sperauskas et al., Astron. J. 766, article id. 116 (2013).
- Hrivnak et al. (2018) B. J. Hrivnak, G. Van de Steene, H. Van Winckel et al., Astron. J. 156, article id. 300 (2018).
- Hrivnak et al. (2020) B. J. Hrivnak, G. Henson, T. Hillwig et al., Astrophys. J. 901, id. 9 (2020).
- Hrivnak et al. (2022) B. J. Hrivnak, W. C. Bakke and P. J. Grimm, Astrophys. J. 939, id. 32 (2022).
- Iben and Renzini (1983) I. Iben, Jr. and A. Renzini, Annual Rev. Astron. Astrophys. 21, 271 (1983).
- Ikonnikova et al. (2020) N. P. Ikonnikova, M. Parthasarathy, A. V. Dodin et al., Monthly Notices Royal Astron. Soc. 491, 4829 (2020).
- Kiss et al. (2007) L. L. Kiss, A. Derekas, G. M. Szabo et al., Monthly Notices Royal Astron. Soc. 375, 1338 (2007).
- Kiss and Bódi (2017) L. L. Kiss and A. Bódi, Astron. and Astrophys. 608, id. A99 (2017).
- Kochanek et al. (2017) C. S. Kochanek, B. J. Shappee, K. Z. Stanek et al., Publ. Astron. Soc. Pacific 129 980 104502 (2017).
- Landolt (2009) A. U. Landolt, Astron. J. 137, 4186 (2009).
- Leggett et al. (2006) S. K. Leggett, M. J. Currie, W. P. Varricatt et al., Monthly Notices Royal Astron. Soc. 373, 781 (2006).
- Manick et al. (2021) R. Manick, B. Miszalski, D. Kamath et al. Monthly Notices Royal Astron. Soc. 508, 2226 (2021).
- Mathis and Lamers (1992) J. S. Mathis and H. J. G. L. M. Lamers Astron. and Astrophys. 259, L39 (1992).
- Miller Bertolami (2016) M. M. Miller Bertolami, Astron. and Astrophys. 588, id. 25 (2016).
- Molina (2018) R. E. Molina, Revista Mexicana Astronom. Astrofís. 54, 397 (2018).
- Nadjip et al. (2017) A. E. Nadjip, A. M. Tatarnikov, D. W. Toomey et al. Astrophysical Bulletin 72, 382 (2017).
- Oomen et al. (2018) G.-M. Oomen, H. Van Winckel, O. Pols et al. Astron. and Astrophys. 620, id. A85 (2018).
- Oudmaijer et al. (2022) R. D. Oudmaijer, E. R. M. Jones and M. Vioque, arXiv e-prints astro/ph:2208.02832v1 (2022).
- Piskunov and Valenti (2017) N. Piskunov and J. A. Valenti, Astron. and Astrophys. 597 id. A16 (2007).
- Potanin et al. (2020) S. A. Potanin, A. A. Belinski, A. V. Dodin et al. Astronomy Letters 46, 836 (2020).
- Reddy and Parthasarathy (1996) B. E. Reddy and M. Parthasarathy, Astron. J. 112, 2053 (1996).
- Ryabchikova et al. (2015) T. A. Ryabchikova, N. Piskunov, R. L. Kurucz et al., Physica Scripta, 90, id 054005 (2015).
- Sasselov (1984) D. D. Sasselov, Astrophys. and Space Sci. 102, 16 (1984).
- Shappee et al. (2014) B. J. Shappee, J. L. Prieto, D. Grupe et al., Astrophys. J. 788, id. 48 (2014).
- Simons and Tokunaga (2002) D. A. Simons and A. Tokunaga, Publ. Astron. Soc. Pacific 114, 169 (2002).
- Soszyński et al. (2017) I. Soszyński, A. Udalski, M. K. Szymański et al., Acta Astronomica 67, 297 (2017).
- Straižys (1982) V. L. Straižys, Metal-deficient stars (Mokslas, Vil’nyus, 1982) [in Russian].
- Suárez et al. (2006) O. Suárez, P. García-Lario, A. Manchado et al., Astron. and Astrophys. 458, 173 (2006).
- Suárez et al. (2007) O. Suárez, J. F. Gomez and O. Morata, Astron. and Astrophys. 467, 1085 (2007).
- Suh and Hong (2017) K. -W. Suh and J. Hong, Journal of the Korean Astronomical Society 50, 131 (2017).
- Szczerba et al. (2007) R. Szczerba, N. Siódmiak, G. Stasińska and J. Borkowski, Astron. and Astrophys. 469, 799 (2007).
- Tatarnikov et al. (2023) A. M. Tatarnikov, S. G. Zheltoukhov, N. I. Shatsky, M. A. Burlak, N. A. Maslennikova, A. A. Vakhonin, Astrophysical Bulletin (2023) (in press).
- Tokunaga et al. (2002) A. Tokunaga, D. A. Simons, W. D. Vacca, Publ. Astron. Soc. Pacific 114, 180 (2002).
- Van Winckel (2003) H. Van Winckel, Annual Rev. Astron. Astrophys. 41, 391 (2003).
- Van Winckel (2007) H. Van Winckel, Baltic Astronomy, 16, 112 (2007).
- Van Winckel (2017) H. Van Winckel, Proc. IAU Symp. No. 323, Ed. by X. Liu, L. Stanghellini and A. Karakas (Cambridge University Press, 2017), p. 231.
- Van Winckel (2018) H. Van Winckel, e-prints astro/ph:1809.00871v1 (2018).
- Vickers et al. (2015) S. B. Vickers, D. J. Frew, Q. A. Parker and I. S. Bojičić, Monthly Notices Royal Astron. Soc. 447, 1673 (2015).
- Waelkens et al. (1991) C. Waelkens, H. Van Winckel, E. Bogaert and N.R. Trams, Astron. and Astrophys. 251, 495 (1991).
- Wehrhahn et al. (2023) A. Wehrhahn, N. Piskunov and T. Ryabchikova, Astron. and Astrophys. 671, id. A171 (2023).
- Yoon et al. (2014) D.-H. Yoon, S.-H. Cho, J. Kim et al., Astrophys. J. Suppl. 211, article id. 15 (2014).