Air Traffic Controller Workload Level Prediction using Conformalized Dynamical Graph Learning
Abstract
Air traffic control (ATC) is a safety-critical service system that demands constant attention from ground air traffic controllers (ATCos) to maintain daily aviation operations. The workload of the ATCos can have negative effects on operational safety and airspace usage. To avoid overloading and ensure an acceptable workload level for the ATCos, it is important to predict the ATCos’ workload accurately for mitigation actions. In this paper, we first perform a review of research on ATCo workload, mostly from the air traffic perspective. Then, we briefly introduce the setup of the human-in-the-loop (HITL) simulations with retired ATCos, where the air traffic data and workload labels are obtained. The simulations are conducted under three Phoenix approach scenarios while the human ATCos are requested to self-evaluate their workload ratings (i.e., low-1 to high-7). Preliminary data analysis is conducted. Next, we propose a graph-based deep-learning framework with conformal prediction to identify the ATCo workload levels. The number of aircraft under the controller’s control varies both spatially and temporally, resulting in dynamically evolving graphs. The experiment results suggest that (a) besides the traffic density feature, the traffic conflict feature contributes to the workload prediction capabilities (i.e., minimum horizontal/vertical separation distance); (b) directly learning from the spatiotemporal graph layout of airspace with graph neural network can achieve higher prediction accuracy, compare to hand-crafted traffic complexity features; (c) conformal prediction is a valuable tool to further boost model prediction accuracy, resulting a range of predicted workload labels. The code used is available at .
keywords:
Air Traffic Management, Aviation Human Factors, Controller Workload, Graph Neural Network[inst1]organization=Mechanical and Aerospace Engineering, addressline=Arizona State University, city=Tempe, postcode=85287, state=AZ, country=USA
[inst2]organization=Human Systems Engineering, addressline=Arizona State University - Polytechnic, city=Mesa, postcode=85212, state=AZ, country=USA
This paper investigates the predictability of air traffic controller (ATCo) workload from spatiotemporal traffic data.
We propose a dynamic graph-learning framework for ATCo workload level prediction with evolving near-terminal traffic patterns.
Conformal prediction set is adopted to include uncertainties of predicted workload levels.
The proposed study is demonstrated and validated with in-house human-in-the-loop (HITL) simulations with retired ATCos under three real-world scenarios.
1 Introduction
The rapid advancement of intelligent systems substantially reduces the operational effort from the individual user level but escalates the system-level complexity of real-time decision-making and corporate planning, arises from the dynamically changing environments, time restrictions, and tactical constraints (Hancock and Meshkati, 1988; Sheridan et al., 2002; Nachreiner et al., 2006; Loft et al., 2007). Workload assessment and prediction of operating such complex systems have long been regarded as critical research objects (Gopher and Donchin, 1986; Gianazza, 2010; Djokic et al., 2010; Tobaruela et al., 2014; Wang et al., 2015). Workload overhead can occur when the demands exceed the human operator’s capacity and can lead to efficiency drop and operational safety concerns. Within the aviation domain, effective workload management of air traffic controllers (ATCos) is of utmost importance to maintain safety and rely on accurate ATCo workload predictions.
Air traffic control (ATC) is a crucial part of aviation safety, ensuring that aircraft are safely guided through the airspace and landed or taken off from airports. ATCos are responsible for managing the flow of aircraft, communicating with pilots, and making critical decisions in real-time to ensure the safety of all involved. As air traffic continues to increase (FAA, 2020), it puts more pressure on ATCos, who already have highly demanding and stressful daily routines (Ligda et al., 2019; Dhief et al., 2020; Lieber et al., 2021). Quantifying the effort made to meet these task requirements lead to the concept of workload as an air traffic controller, which denotes the subjective qualitative measure of perception demand placed by the current air traffic situation (Hilburn, 2004; Loft et al., 2007; Djokic et al., 2010). Moreover, proper workload management and scheduling are vital to ensure ATCos can perform their duties effectively and faultlessly without being overwhelmed. Human performance is a crucial factor in ensuring the safe operations of the National Airspace System (NAS). In the past, human operators have been identified as significant contributors to accidents involving air carrier operations governed by the 14 Code of Federal Regulations (CFR) Part 121, which covers commercial airliners frequently used by the public (Regulations, 2017). For instance, approximately 80% of the 446 air carrier accidents that occurred between 1997 and 2006 were attributed to personnel-related factors, while environmental factors were cited in approximately 40% of the accidents and aircraft-related factors in 20% (Board., 2001). Workload prediction can help in several ways, such as ensuring that enough ATCos are available to manage the traffic, preventing fatigue and burnout, optimizing shift schedules, and improving overall efficiency. By accurately predicting the workload, air traffic organizations can ensure that they have the necessary resources and personnel to maintain a safe and efficient air traffic system (Pham et al., 2020; Heng et al., 2022; Xiong et al., 2023). All of these objectives are based on reliable ATCo workload-level modeling and predictions. Moreover, artificial intelligence (AI)-enabled human factor studies in aviation have been identified as one of the core elements of AI taxonomy by related authorities (EASA, 2021, 2023), where ATCo workload management is a key dedicated objective.
A tremendous amount of research has been done to understand the impact factors and demand patterns that drive the workload of a controller, such that a better workload prediction performance can be discovered. Two types of factors are studied extensively in the literature, (a) physiological and behavioral features including ATCo mental stress, fatigue level, communication difficulties, and situation awareness (Manning et al., 2002; Hah et al., 2006; Crutchfield and Rosenberg, 2007; Edwards et al., 2012); (b) objective factors such as traffic and airspace complexity measures (i.e., operational errors (OE)), abnormal events, level of automation, and weather situations (Sridhar et al., 1998; Chatterji and Sridhar, 1999, 2001; Majumdar and Ochieng, 2002; Edwards et al., 2017; Corver et al., 2016; Sharma et al., 2022). In order to collect features for workload prediction, researchers have proposed to collect human-subject data (i.e., eye movement, communications, heartbeat rates, and Electroencephalography (EEG) signals) (Di Stasi et al., 2010; Abbass et al., 2014; Aricò et al., 2016), in an intrusive and non-intrusive sense. On the other hand, traffic-related features can be directly obtained from computer flight recordings and operational recordings. However, some specific traffic features need post-hoc processing (i.e., loss of separations (LoS), OEs). Specifically, in this work, we are interested in traffic-related objective features since it is very unlikely to collect real-time biological features (i.e., EEG/ECG signals or heartbeat rates) in the near future due to privacy concerns and regulatory requirements. Moreover, we discover that the existing model on workload prediction is mostly using handcrafted features, even if a graph data structure and simple neural networks (i.e., minimum spanning trees) have been proposed (Chatterji and Sridhar, 1999). To the best of the authors’ knowledge, there is no investigation on utilizing advanced data-driven learning techniques (i.e., graph neural networks (GNNs)) for workload prediction possibilities that directly leverage the spatiotemporal relationships contained in the traffic data and airspace layout.
In this work, we investigate the possibility of using the graph neural network to predict ATCo workload levels, with an additional post-processing technique, namely conformal prediction, to boost the accuracy with a set of prediction labels. The data is collected by conducting experiments with retired ATC participants who have experience at FAA Radar Approach Control (TRACON) facilities, under three different scenarios, (a) baseline conditions; (b) high workload nominal conditions; (c) high workload off-nominal conditions. The major difference among scenarios are the peak traffic densities and the presence of off-nominal events (i.e., runway switch, communication errors, etc). The simulation scenario is limited to a few Phoenix approach procedures for a duration of 25 minutes for each scenario. A detailed description of the experimental setup is in Section 3. Specifically, the ATCo workload we investigated is the executive (R-side) controllers’ workload (Pham et al., 2020). Predicting controller workload levels can be viewed as a pattern recognition problem (Chatterji and Sridhar, 2001) and thus is suitable for data-driven learning algorithms. In this work, the problem of predicting workload based on the spatiotemporal layout of airspace is viewed as a time-series dynamically evolving graph classification task. Being time-series classification, we propose to input multiple historical timestamp graphs into the model for the prediction of workload level at the next timestamp. Also, the spatiotemporal layout of the graph structure varies at each timestamp (i.e., number of nodes, graph edge connections), resulting in a dynamical graph classification problem.
Our contributions are summarized as,
-
1.
This paper investigates the possibility of predicting executive controller workload during approach scenarios directly from the recorded air traffic data with graph neural networks and discovers that traffic conflict is a nontrivial contributor to improving workload prediction capabilities.
-
2.
We propose to formulate the ATCo workload prediction task into a dynamical time-series graph classification problem and show that the Evolving Graph Convolutional Network (EvolveGCN) can achieve a higher prediction accuracy than both statistical (i.e., regression, handcrafted features) and classical learning methods (i.e., MLP, GCN). We show that graph neural networks have great potential for predicting controller workload with varying spatiotemporal airspace layouts.
-
3.
A moving window approach is proposed to build the correct input-output matching from the collected sparse workload data. The moving window size represents the temporal length of the historical information used in workload prediction. The selection of parameters can be alternated to fit into the operational need. The data structure formulation transfer complex structured traffic features into a lucid format for research and development purposes.
-
4.
To further improve the classification accuracy of the experimental data. We explore conformal prediction to expand the prediction as set predictions. We show that conformal prediction has better ground truth label coverage by giving multiple possible predictions as indicators of model uncertainties. We suggest that conformal prediction is a valuable machine learning post-hoc processing tool to boost performance further as well as indicate prediction uncertainties.
The rest of the paper is organized as follows. First, Section 2 reviews related studies on air traffic controller workload prediction. We first introduce the impact factors of ATCo workload in Section 2.1, then list the current practices in predicting workload Section 2.2. In Section 3, we introduce the detailed workflow of human-in-the-loop simulations to collect the traffic data and ground truth ATC workload labels, along with data analysis of the collected data. Section 4 describes the flowchart of the proposed machine learning framework, from experiment data handling to innovative modeling. The prediction performance and evaluation of the conformal prediction set are discussed in Section 5. Section 6 concludes this paper by giving limitations of this study and provides future insights.
2 Related Works
Due to the surging number of daily aviation operations, the aviation industry is in urgent need of advanced decision support tools that can accommodate the rapid annual air traffic growth. Numerous studies have investigated ATCo workload. It’s an aviation researchers’ consensus that understanding the impact factors that drive mental workload can help improve airspace capacity, thus reducing aviation safety concerns (Hilburn and Flynn, 2004; Loft et al., 2007; Durso and Alexander, 2010). With meaningful impact factors collected or modeled, predictive modeling is critical to building an accurate workload prediction algorithm. In this section, we discuss the related works from two aspects, (1) understand the impact factors that drive the mental workload in Section 2.1; (2) discuss the current practice in predicting ATCo workload from open literature with a focus on predicting workload from traffic factors Section 2.2.
2.1 Task Demands and Impact Factors to ATCo Workload
In air traffic control, task demand refers to the level of mental and physical effort required for ATCos to complete their duties effectively. High task demand leads to increased workload, which negatively impacts aviation safety. Therefore, understanding the level of task demand and appropriately managing workload is essential for ensuring that ATCos can perform their duties effectively and safely. Correctly modeling task demand is viewed as the prerequisite for workload prediction for a long history. It’s noteworthy to mention that ATCos workload is not a simple function of task demands; the ATC strategy the controller adapted to meet the increased task demands also provides a feedback loop to ATCo workload (Loft et al., 2007). We discuss each of these aforementioned grouped impact factors separately.
Air traffic factors refers to both the aircraft count under the ATCo control and their spatiotemporal relationships. The number of aircraft under control is viewed as the most important factor that drives ATCo’s mental workload (Rose et al., 1978; Kopardekar and Magyarits, 2003). A high aircraft count leads to higher communication frequency and a higher possibility of safety events, resulting in a higher mental and physical workload. Traffic density is typically measured in aircraft per unit of airspace, such as aircraft in unit time and unit airspace sector area. Measurements of traffic density have been developed based on the averaged vertical/horizontal separation distances (Chatterji and Sridhar, 2001), as they directly infer loss of separations. Other research investigates the necessity to consider flight interactions and flight characteristics, which includes the changes/variability in heading, speed, or altitude, the pattern of how air traffic flows merges and separates into a set of air traffic complexity metrics (Delahaye and Puechmorel, 2000; Chatterji and Sridhar, 2001; Kopardekar and Magyarits, 2003; Gianazza and Guittet, 2006; Djokic et al., 2010). Their regression analysis shows subjective workload depends on both aircraft count and other air traffic complexity measures. Additionally, some other studies also suggest that a lower aircraft count also can lead to task overload if these aircraft are interacting in a complex fashion (Mogford et al., 1995; Kallus et al., 1999).
Airspace complexity factors include the number of routes, altitudes, and restrictions, which can also impact the workload of ATCos, as they need to monitor and manage multiple variables simultaneously. Airspace-related factors are another key contributor to ATCo mental workload (Kirwan et al., 2001). Larger airspace size indicates a higher aircraft count and higher metrics on traffic complexity, while small airspace size reduces conflict resolution options and higher traffic evolving rates. It is noteworthy to mention another work considering both the traffic factors and airspace structure complexity and proposes Structural Complexity Metric (SCM), which incorporates a measure of the organization, hierarchy, and interdependence into the complexity calculation (Histon et al., 2002). Furthermore, this paper suggests using well-defined ingress and egress points in the airspace to distinguish normal and abnormal flights based on real-time monitoring.
Operational Constraints are another major contributor that drives the ATCo workload. Operational constraints refer to the temporal variability within the operational conditions of the airspace, as well as the conditions of related technology and equipment. Several factors are viewed as operational constraints; (1) pilot-controller communications are critical for maintaining safe aviation operations. Malfunctions of communication devices can disrupt air traffic control operations. This is known as loss of ratio communication (NORDO) (2) convective weather conditions, such as thunderstorms or heavy fog. These types of objective factors can affect air traffic control operations by reducing visibility and creating unsafe flying conditions. (3) subjective airspace restriction is another type of operation constraint. The restrictions come from multiple sources, i.e., aircraft holding, no-fly zones, or special-use airspace (Loft et al., 2007). In addition, certain other off-nominal events are considered operational constraints, i.e, runway switch, and minimum fuel reported (Wickens et al., 2009; Fraccone et al., 2011).
Cognitive states directly contribute to the cognitive task demands of ATCo. To measure cognitive states, the researchers propose to measure the physiological states of the air traffic controller, including brain activities, eye movements, and heartbeat rates. These states can be quantitatively measured by sensors signals such as electrocardiography (ECG) signals, electroencephalography (EEG) signals, galvanic skin response (GSR), blood pressure (BP), and certain biochemical analysis (Crump, 1979; Vogt et al., 2006; Trapsilawati et al., 2020). However, using intrusive physiological state measurements is disruptive to controllers’ normal working conditions, as it creates additional mental stress and discomfort in maintaining ATC operations. Alternatively, computer vision (CV) based non-intrusively physiological state measurements are proposed to collect distractions, drowsiness, head poses, eye movements, and fatigue levels (Li et al., 2019a; Wee et al., 2019; Xiong et al., 2023). However, these types of measurements can lead to information security and privacy concerns (Liang et al., 2020; Berghoff et al., 2021).
2.2 Workload Prediction Algorithms
The dynamic density model builds a regression model to find the linear relationships between traffic complexity factors and ATCo workload. The Dynamic Density metric uses a combination of traffic density and complexity measures to estimate task demands in real-time, with the goal of providing a more accurate and responsive measure of controller workload from task demands (Masalonis et al., 2003). However, dynamic density metrics fail to consider human cognitive capacities, which are the primary source of ATCo workload sources in the real world. In Kopardekar and Magyarits (2003), the traffic complexity, as well as the airspace complexity of different sections, are considered. The results show that the airspace factor can actually contribute to workload prediction in a multi-sector study. Similarly, in Hah et al. (2006), the authors find that the ATCo workload is proportional to the number of aircraft controlled by the enroute sector. They conduct HITL experiments and found a linear relationship between aircraft count and workload ratings.
However, it’s still difficult to identify the most contributing impact factors to workload prediction from regression analysis. The first reason is the multi-collinearity within these factors. For instance, the number of conflicts depends on the speed, altitude, and heading variabilities. The complexity of traffic situations, such as traffic density and potential conflicts, also mediate the causal connection between traffic count and workload. The inter-relationship of these factors makes it challenging to determine the relative importance of each predictor in a regression equation. The second query is the debate on the linear relationship between these factors and workload ratings. For instance, the ATCo can alternate control strategies during a certain period to meet the increased task demands. Additionally, the online processing or post-processing of these factors only considers the current situations, and there is no inference on ATCo’s intent and air traffic intent information. Trajectory prediction from flight plans helps with estimating the workload of ATCos, where prediction and reduction of trajectory uncertainties can help alleviate ATCo workload (Knorr and Walter, 2011; Corver et al., 2016).
Machine learning algorithms have been adopted for workload prediction. In Gianazza (2017), tree-based models, and support vector machines are included for workload measurements. The authors consider both traffic complexity and operational constraints as features and show a high F1 score of over 0.9. However, these types of works are not dynamically considering the traffic pattern of the airspace, but still formulate the data as a tabular format, which fails to address the aforementioned concerns (Loft et al., 2007). On the other hand, Wang et al. (2015) proposes to use a 3-layer simple neural network to forecast ATCo workload. However, the ATCo workload in this work is assessed from voice communication data, which fails to model the task demand factors mentioned earlier. Impressively, direct prediction from the spatiotemporal air traffic layout is actually proposed decades ago. In Sridhar et al. (1998); Chatterji and Sridhar (2001), the authors propose to model air traffic at each timestamp into graph-structured data and calculate the second-order statistics of time-series of graphs as extracted air traffic complexity measurements. Then a simple neural network is adopted to do classification from these features.
In summary, understanding the factors that drive ATCo workload has been a challenging yet unresolved open question for decades. Instead of investigating the linear relationship between impact factors and workload, one should look into the dynamic properties of these factors and workload. This leads to our study on workload prediction – we model the spatiotemporal airspace layout into time-series graph structures and propose to use a time-series learning algorithm to predict workload levels, in consideration of historical dynamic variabilities contained within the air traffic data.
3 Human-In-The-Loop (HITL) Simulations
In this section, we provide an overview and the detailed simulation setup of the Human-In-The-Loop (HITL) experiment as in Figure 1. The scope and objectives will be discussed. Then, data analysis on the collected data is presented in Section 3.3.
3.1 Simulation Overview
The HITL simulation is the first human factor study of our aviation big data project, which aims at addressing the safety needs and technology solutions for future NAS (Liu and Goebel, 2018). The backbone of the project lies in information fusion and uncertainty management for real-time system-wide safety assurance, where human factors like ATCo workload play a key role. As mentioned, accurately predicting the ATCos workload can improve operational efficiency and reduce safety concerns such that aviation authorities can ensure a reasonable resource allocation and workload management.
| Speaker |
|
Transcriptions |
|
|
||||||
| … … | ||||||||||
| Speed bird 281 | 05:26.9 |
|
05:30.5 | 1 | ||||||
|
05:34.9 | speed bird two eighty-one heavy, roger | 05:37.7 | 1 | ||||||
| … … | ||||||||||
|
11:32.8 |
|
11:35.4 | 0 | ||||||
|
11:38.8 | cumpacity two fifty four thousand one hundred | 11:40.5 | 1 | ||||||
| Cumpacity 250 | 11:41.8 | cumpacity two fifty dropping down to four one hundred | 11:44.6 | 1 | ||||||
| … … | ||||||||||
| Local south | 14:29.1 |
|
14:35.9 | 1 | ||||||
|
14:38.8 | Ok…move to runway seven | 14:40.7 | 1 | ||||||
|
14:49.8 |
|
14:55.1 | 1 | ||||||
| … … | ||||||||||
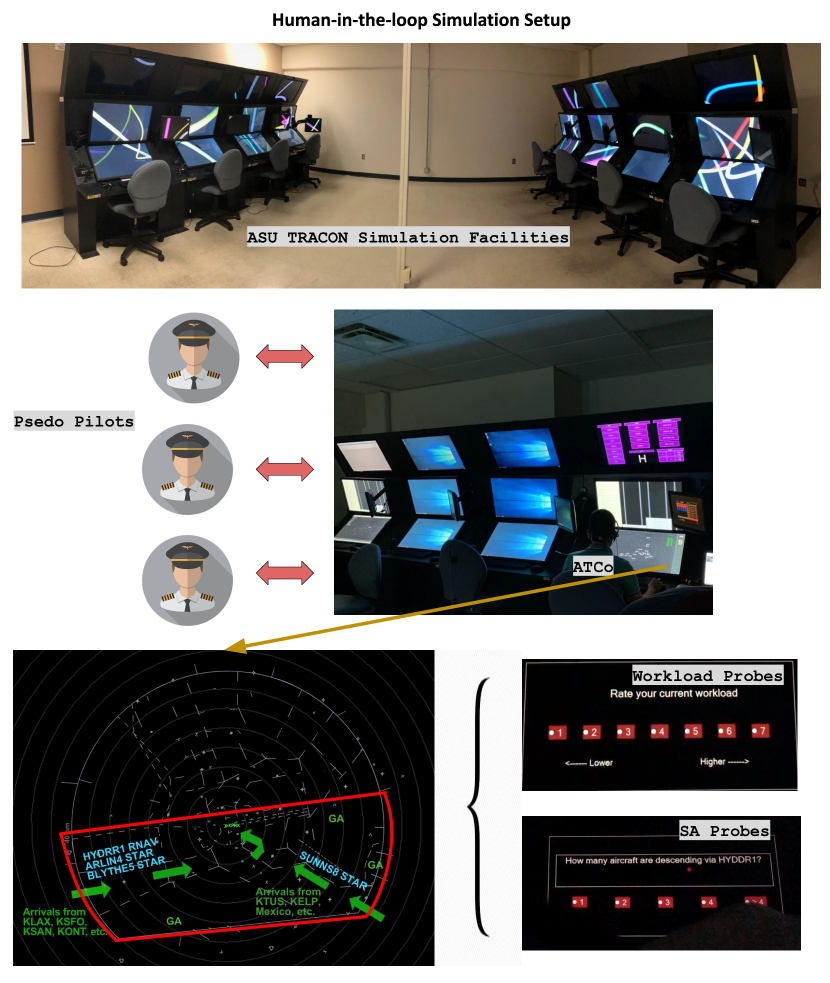
The primary objective of the HITL experiment is to investigate the correlation between communication patterns (such as content, volume, and flow patterns) and both controller workload and human performance. Figure 1 gives the overview setup of the HITL simulation process. The simulation contains two arrival flows including four Phoenix in-bound Procedures. The top panel of Figure 1 displays the layout of the ASU TRACON Simulation facility. The ASU TRACON Simulation facility boasts a total of eight advanced simulators, designed to provide an immersive training experience. Within the context of HITL (Human-in-the-Loop) experiments, the simulation involves the participation of three pseudo-pilots who assume the role of actual pilots and engage in interactive communication with Air Traffic Controllers (ATCo).
To illustrate the capabilities of the simulation, we present a captivating demonstration of the graphical user interface. The simulation places particular emphasis on the KPHX (Phoenix Sky Harbor International Airport) arrivals from two distinct directions. The first arrival flow represents flights from the west coast (KLAX, KSFO, KSAN, KONT, etc), with procedures HYDRR1, ARLIN4, and BLYTHE5. The second flow stands for arrival flights from the southeast, including KTUS, KELP, and Mexico. SUNSS8 arrival procedure is used here. These procedures challenge both pilots and ATCos to execute precise maneuvers and coordinate their actions effectively.
Throughout the experiment, the ATCo is presented with a series of thought-provoking questions displayed in a pop-up window. This window either acts as both a workload probe to test the ATCo’s ability to manage multiple tasks or a situational awareness probe, evaluating their understanding of the ongoing situation. The questions are presented at regular intervals of three minutes, ensuring a continuous evaluation of the ATCo’s performance and cognitive response. Each retired ATCo participant engaged in a within-subjects (3 simulation trials) study design. Each trial spanned 25 minutes and varies in workload level by manipulating two variables, namely traffic density, and occurrence of off-nominal events.
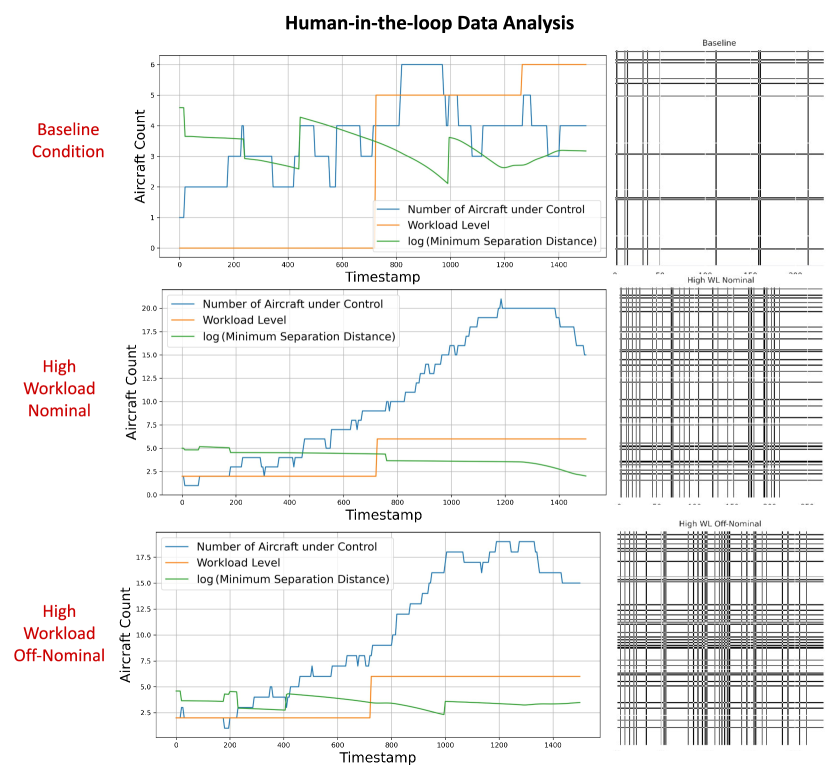
Baseline: Baseline trials contain up to 6 aircraft in the airspace at a given timestamp. There are no off-nominal events in baseline trials. Typically, a moderate workload is expected.
High Workload Nominal: High workload nominal trials can have up to 21 aircraft showing up in the current simulation environment. Again, there are no off-nominal events.
High Workload Off-Nominal: In addition to the experimental setup in high workload nominal trials, high workload off-nominal trials incorporate four off-nominal events during the 25 min duration. We list the name of these off-nominal events here,
-
1.
Turbulence: Moderate turbulence is simulated in several arrival flows. In Table 1, speed bird 281 reported experiencing turbulence at a certain altitude, starting from 05:26.9 of simulation time.
-
2.
No radio (NORDO): The pilot has no radio communication with the approach ATCo, which can happen during a radio failure. In Table 1, the KPHX approach controller repeated the order when the first order at 11:32.8 was not confirmed.
-
3.
Runway switch: In this simulation, the landing runway switch from KPHX 25L to 07R. The order is given by the local tower, as in Table 1 14:29.1.
-
4.
Minimum fuel: At the end of each simulation trial, the aircraft encountered fuel issues.
These corresponding timestamps , , , and to apply these off-nominal events is indicated in Figure 3, respectively.
3.2 Simulation Setup
HITL was conducted in eight air traffic management system Metacraft facilities located at the Arizona State University TRACON Simulation Lab, which can be operated as either ATC terminal radar positions or pseudo-pilot stations. The human controllers were retired ATCos who have experience with civilian TRACON facilities within the past 15 years but do not persist possess experience with Phoenix TRACON (Ligda et al., 2019). Six retired ATCos were involved in this study. There were also three researchers who act as pseudo-pilots to fly along the assigned arrival routes during each simulation scenario. Metacraft is the name of the TRACON radar simulation computer cluster system. It provides ATC functions to maneuver the aircraft in a simulation environment, including altitude, speed, and heading. Metacraft collects and maintains data logs such as spatiotemporal tracks, LoS events, and distance measures.
During each 25 minutes experiment trial, the pop-up window showed a questionnaire probe every 3 minutes, asking either a question on workload rating or situational awareness questions. Specifically, the workload rating questions were shown three times at exact 3 min, 12 min, and 21 min timestamps. Figure 2 visualizes the collected data for one participant of three scenarios. Features include minimum separations (traffic conflict), number of aircraft (traffic density), and workload ratings are reported. A recurrence plot indicating communication tendency is also provided, visually representing the communication efforts between the tower controller and the pseudo-pilots.
The workload rating probe was designed based on the subjective workload assessment technique (SWAT) (Reid and Nygren, 1988). The SWAT method is a situation-present assessment method that is commonly used in human factors research. It involves participants rating their perceived workload using various rating scales, such as the NASA task load index (TLX) scale (Hart and Staveland, 1988; Hart, 2006). The SWAT method also includes measures of mental effort and task difficulty to provide a more comprehensive assessment of workload. The workload probe employs a two-step process for administering questions related to situation awareness or workload. Participants first press a ready button, followed by selecting a response. The timing of both actions is recorded, following the methods used in the aforementioned studies. Another important measure of SWAT was the behavioral measure of workload, the time to respond to the ready button.
The controller workload is self-evaluated by the workload question pop-up window, and the human performance is indicated by the count of separation violations. To facilitate this investigation, we have gathered preliminary data on three types of metrics: 1) aeronautical separation violations, which are viewed as traffic conflicts existed in the airspace and an indicator of ATCo performances; 2) real-time workload ratings, taken at three different points in each 25-minute scenario; and 3) audio recordings of controller-pilot transmissions during the workload ratings. These initial settings will serve as a foundation for further analyses using additional measures, such as facial recognition, heart rate variability, situation awareness probes, and operational efficiency. Ultimately, this research provides a solution for the development of a real-time controller workload level prediction system.
|
|
|
||||||
|---|---|---|---|---|---|---|---|---|
| traffic_density | Total number of aircraft under ATC participant’s control | Integer: 0-23 | ||||||
| ready_latency |
|
Decimal: 0.01-60.00 sec | ||||||
| query_latency |
|
Decimal: 0.01-60.00sec | ||||||
| wl_rating | Workload rating select from the pop-up window | Integer: 1-7 | ||||||
| sa_correct |
|
0: no resp; 1: correct; 2: incorrect |
In this paper, we obtain the flight traffic recordings and the real-time workload ratings from real-world human-in-the-loop simulations. The subjective workload rating is collected from the question pop-up windows showing at 3 min, 12 min, and 21 min for each trial. The originally collected data and adjusted workload rating score has been discussed in the literature (Lieber, 2020). By doing this, we obtain realistic human workload levels, or the ground truth, from participants’ honest ratings of their mental status. This is the most reasonable data source for obtaining features and labels for building real-world machine-learning pipelines.
3.3 Empirical Data Analysis
Communication transcription analysis is performed based on post-processed radio recordings. There are three major components in this part, (a) use a speech recognition tool or manual transcription tool to translate voice to text; (b) identify the named entity of each communication transcript (i.e., controllers or pilots); (c) perform either statistical analysis or keyword extraction (Gorman et al., 2003; Salas and Fiore, 2004; Cooke et al., 2017). As mentioned, the deviation indicator represents the deviation in communications, also known as closed loop communication deviation (CLCD) (Lieber et al., 2021). CLCD is based on an established coding scheme derived from the expected exchange of closed loop communication (CLC). Deviations occur when consecutive pilot communications or consecutive air traffic controller communications take place. CLCs were coded using a binary system to detect CLCD based on communication patterns between pilots and ATC. An expected CLC pattern involves alternating communications between pilots and ATC. CLCD is identified when a pilot’s communication follows another pilot’s or when consecutive ATC communications occur.
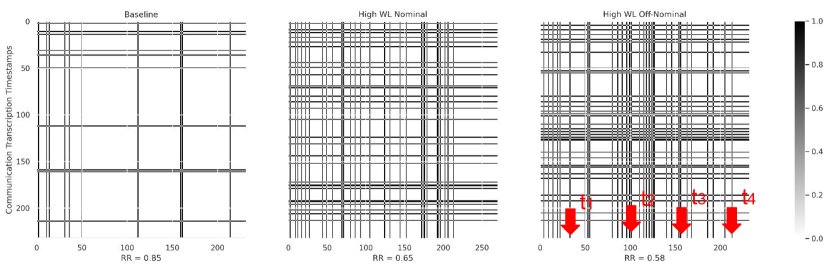
Figure 3 shows the closed loop communication deviation analysis’s recurrence plot (RP). RP was originally proposed to visualize the complexity of dynamical systems (Eckmann et al., 1995; Marwan et al., 2007b), where a detailed mathematical formulation can be found. In this work, we define the phase vector as the communication deviations and build the recurrence matrix as,
| (1) |
where N indicates the number of current states. means that they are approximately equal up to an error round defined as . In general, the recurrent matrix compares the state and indicates the state similarity across the entire series (Marwan et al., 2007b). The selection of similarity threshold is critical. Researchers have investigated the selection criterion in the literature based on the system states (Koebbe and Mayer-Kress, 1992; Zbilut and Webber Jr, 1992; Mindlin and Gilmore, 1992). In Figure 3, we choose for the visualization. Moreover, Figure 3 suggest a typical vertical and horizontal lines pattern, which is suggested to be a laminar state or state idle case, while the sparse region indicates lower system complexity and vice versa (Marwan et al., 2007b).
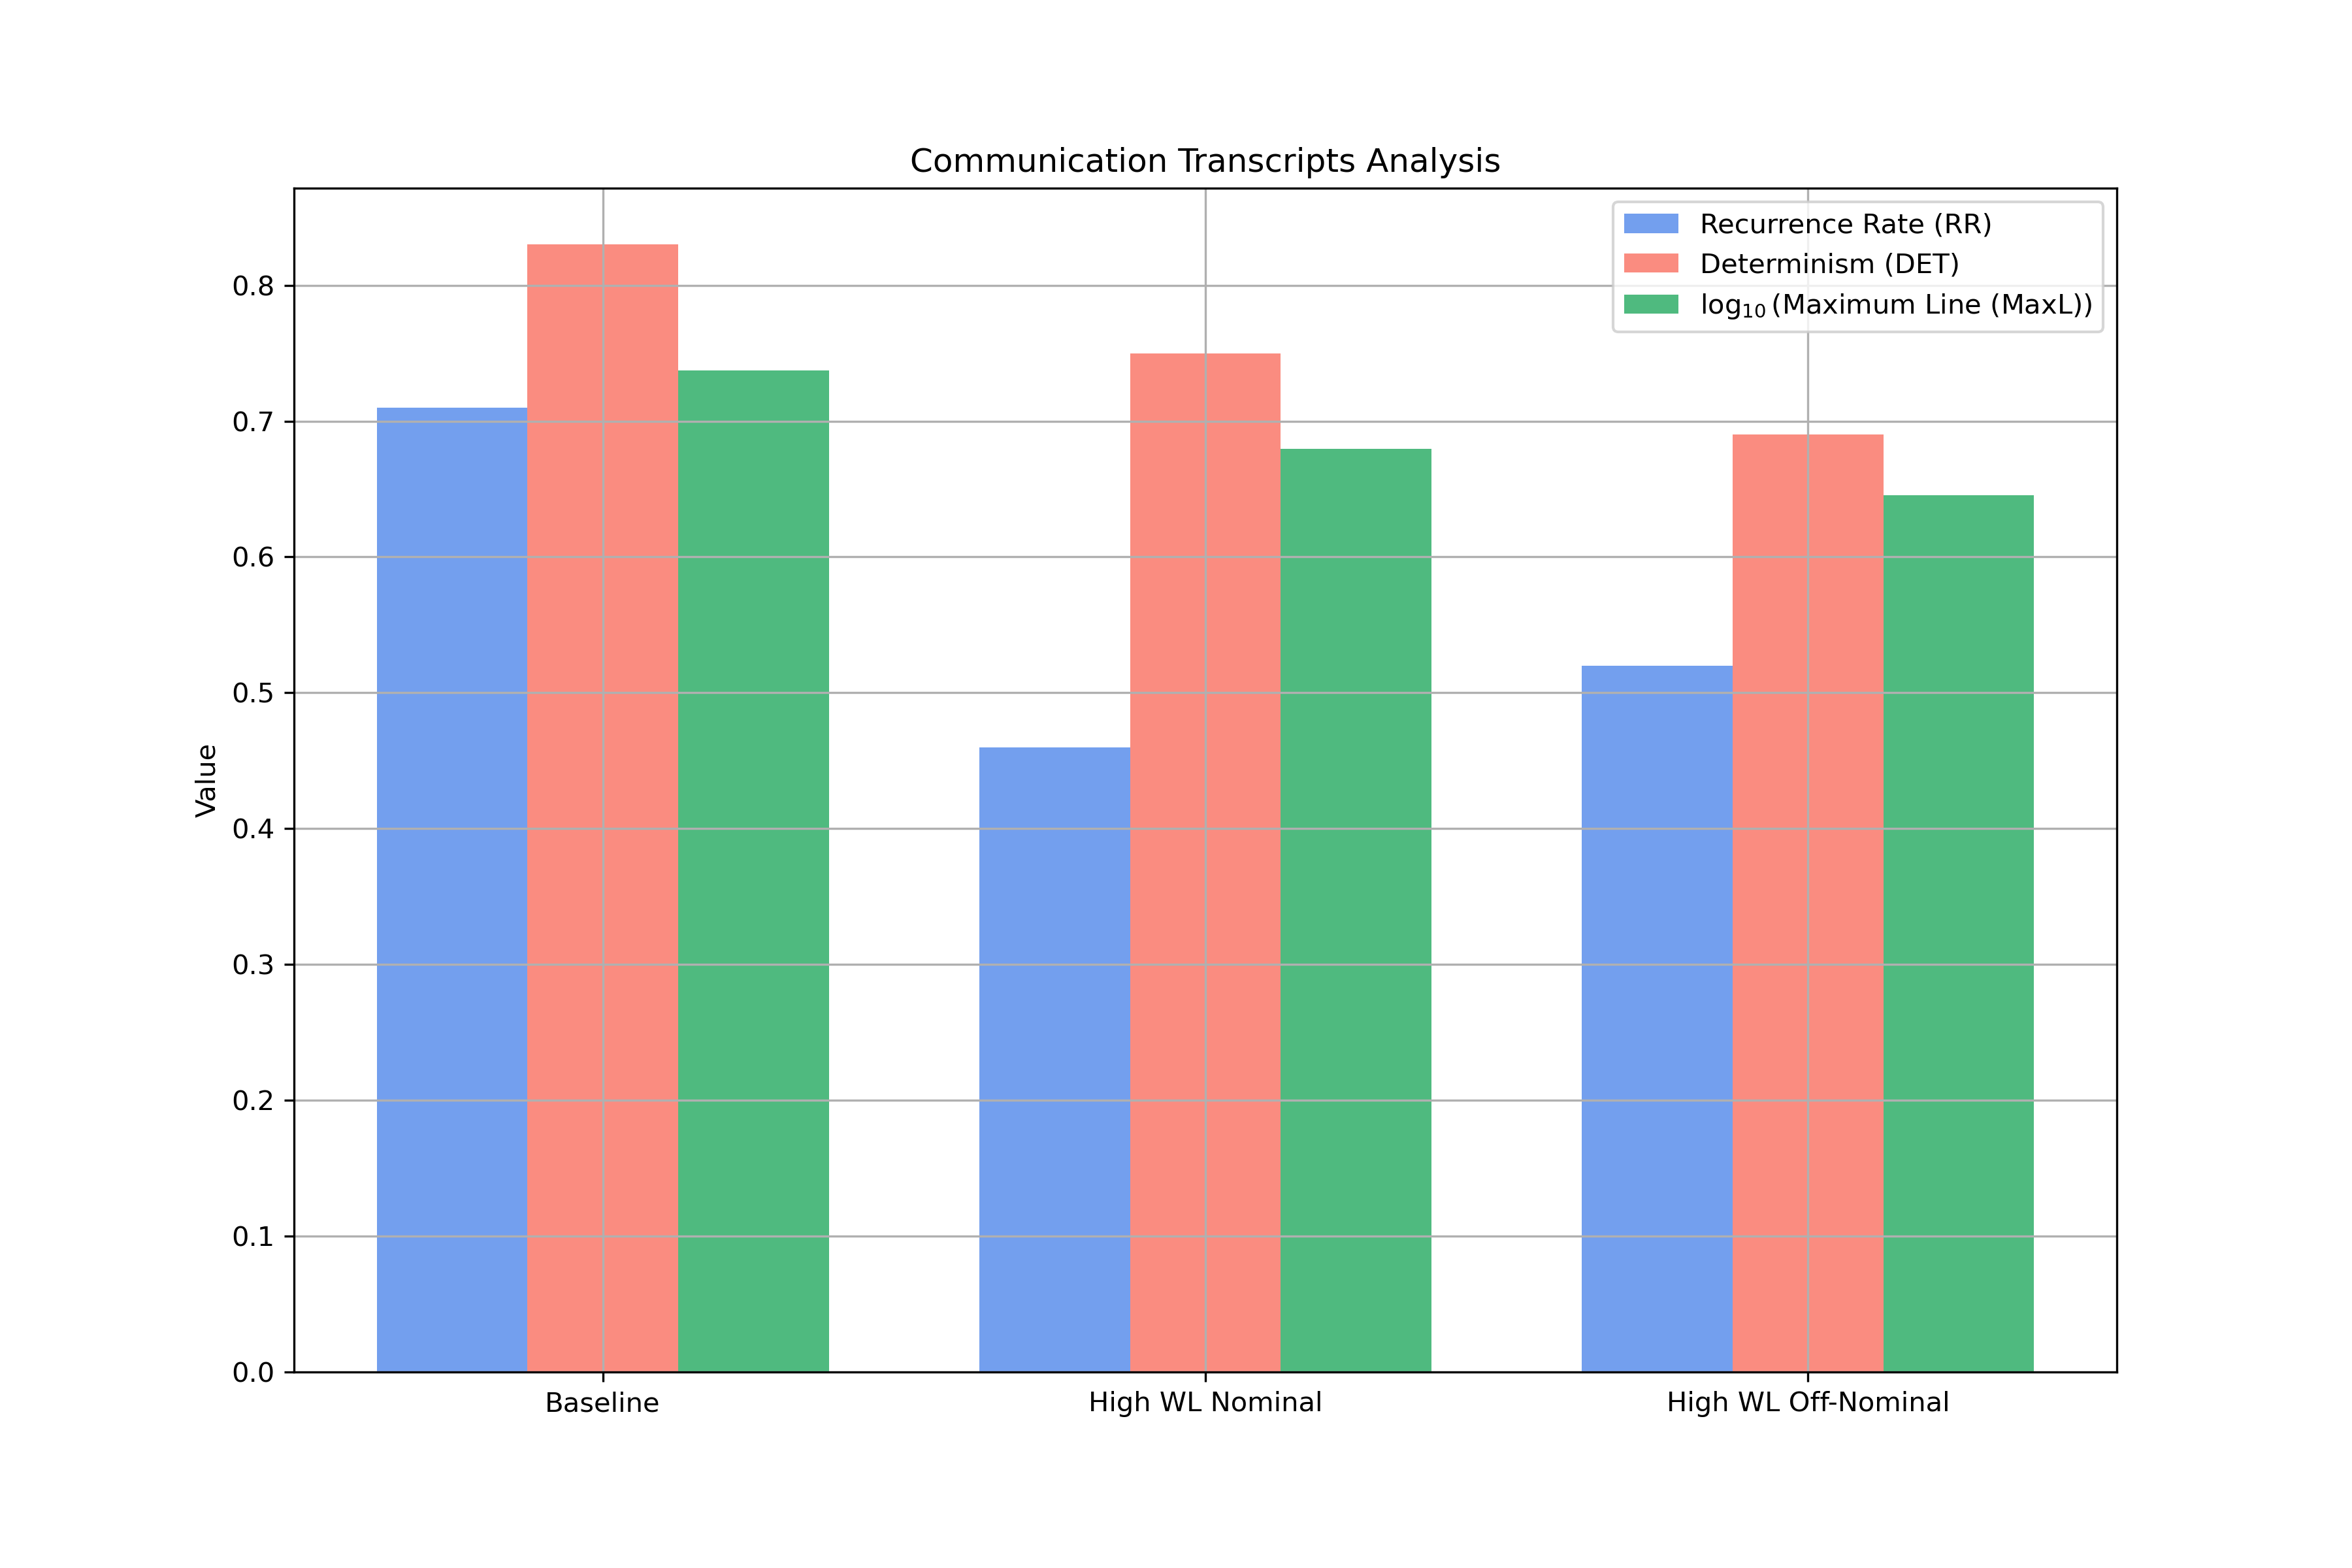
Beyond the visual approach, recurrence quantification analysis (RQA) is also widely used to measure system-level complexity (Zbilut and Webber Jr, 1992; Webber Jr and Zbilut, 1994; Marwan et al., 2002). Typically, RQA is based on the diagonal and vertical patterns of the RP. We use three types of complexity measures here.
Recurrence Rate (RR) is the simplest measure of RP, which is the averaged density of recurrence points in RP. RR represents the likelihood of a state returning to its -neighborhood in the phase space (Kantz, 1994). It’s the measure of correlations between the ATCo and pilot communications.
Determinism (DET) refers to the degree of predictability or orderliness in a system’s dynamics over time. A deterministic system is one in which future states can be precisely predicted from knowledge of the present state and the system’s dynamics. In the context of recurrence plots, a high degree of DET is indicated by the presence of diagonal lines in the plot, which represent points in the system’s trajectory that are close to each other in phase space and recur with a high degree of regularity. Conversely, a low degree of DET is indicated by a more random or chaotic pattern in the recurrence plot, with fewer or no diagonal lines. It indicates the predictability of ATCo and pilot interaction.
Maximum Line (MaxL) is a diagonal line that represents the longest connected sequence of recurrent points in the plot. It is the diagonal line that has the most points along it, and it indicates the most persistent pattern of recurrence in the system’s dynamics. The length and frequency of maximum lines can provide insights into the regularity and predictability of the system’s behavior over time. MaxL quantifies the stability of ATCo and pilot interaction.
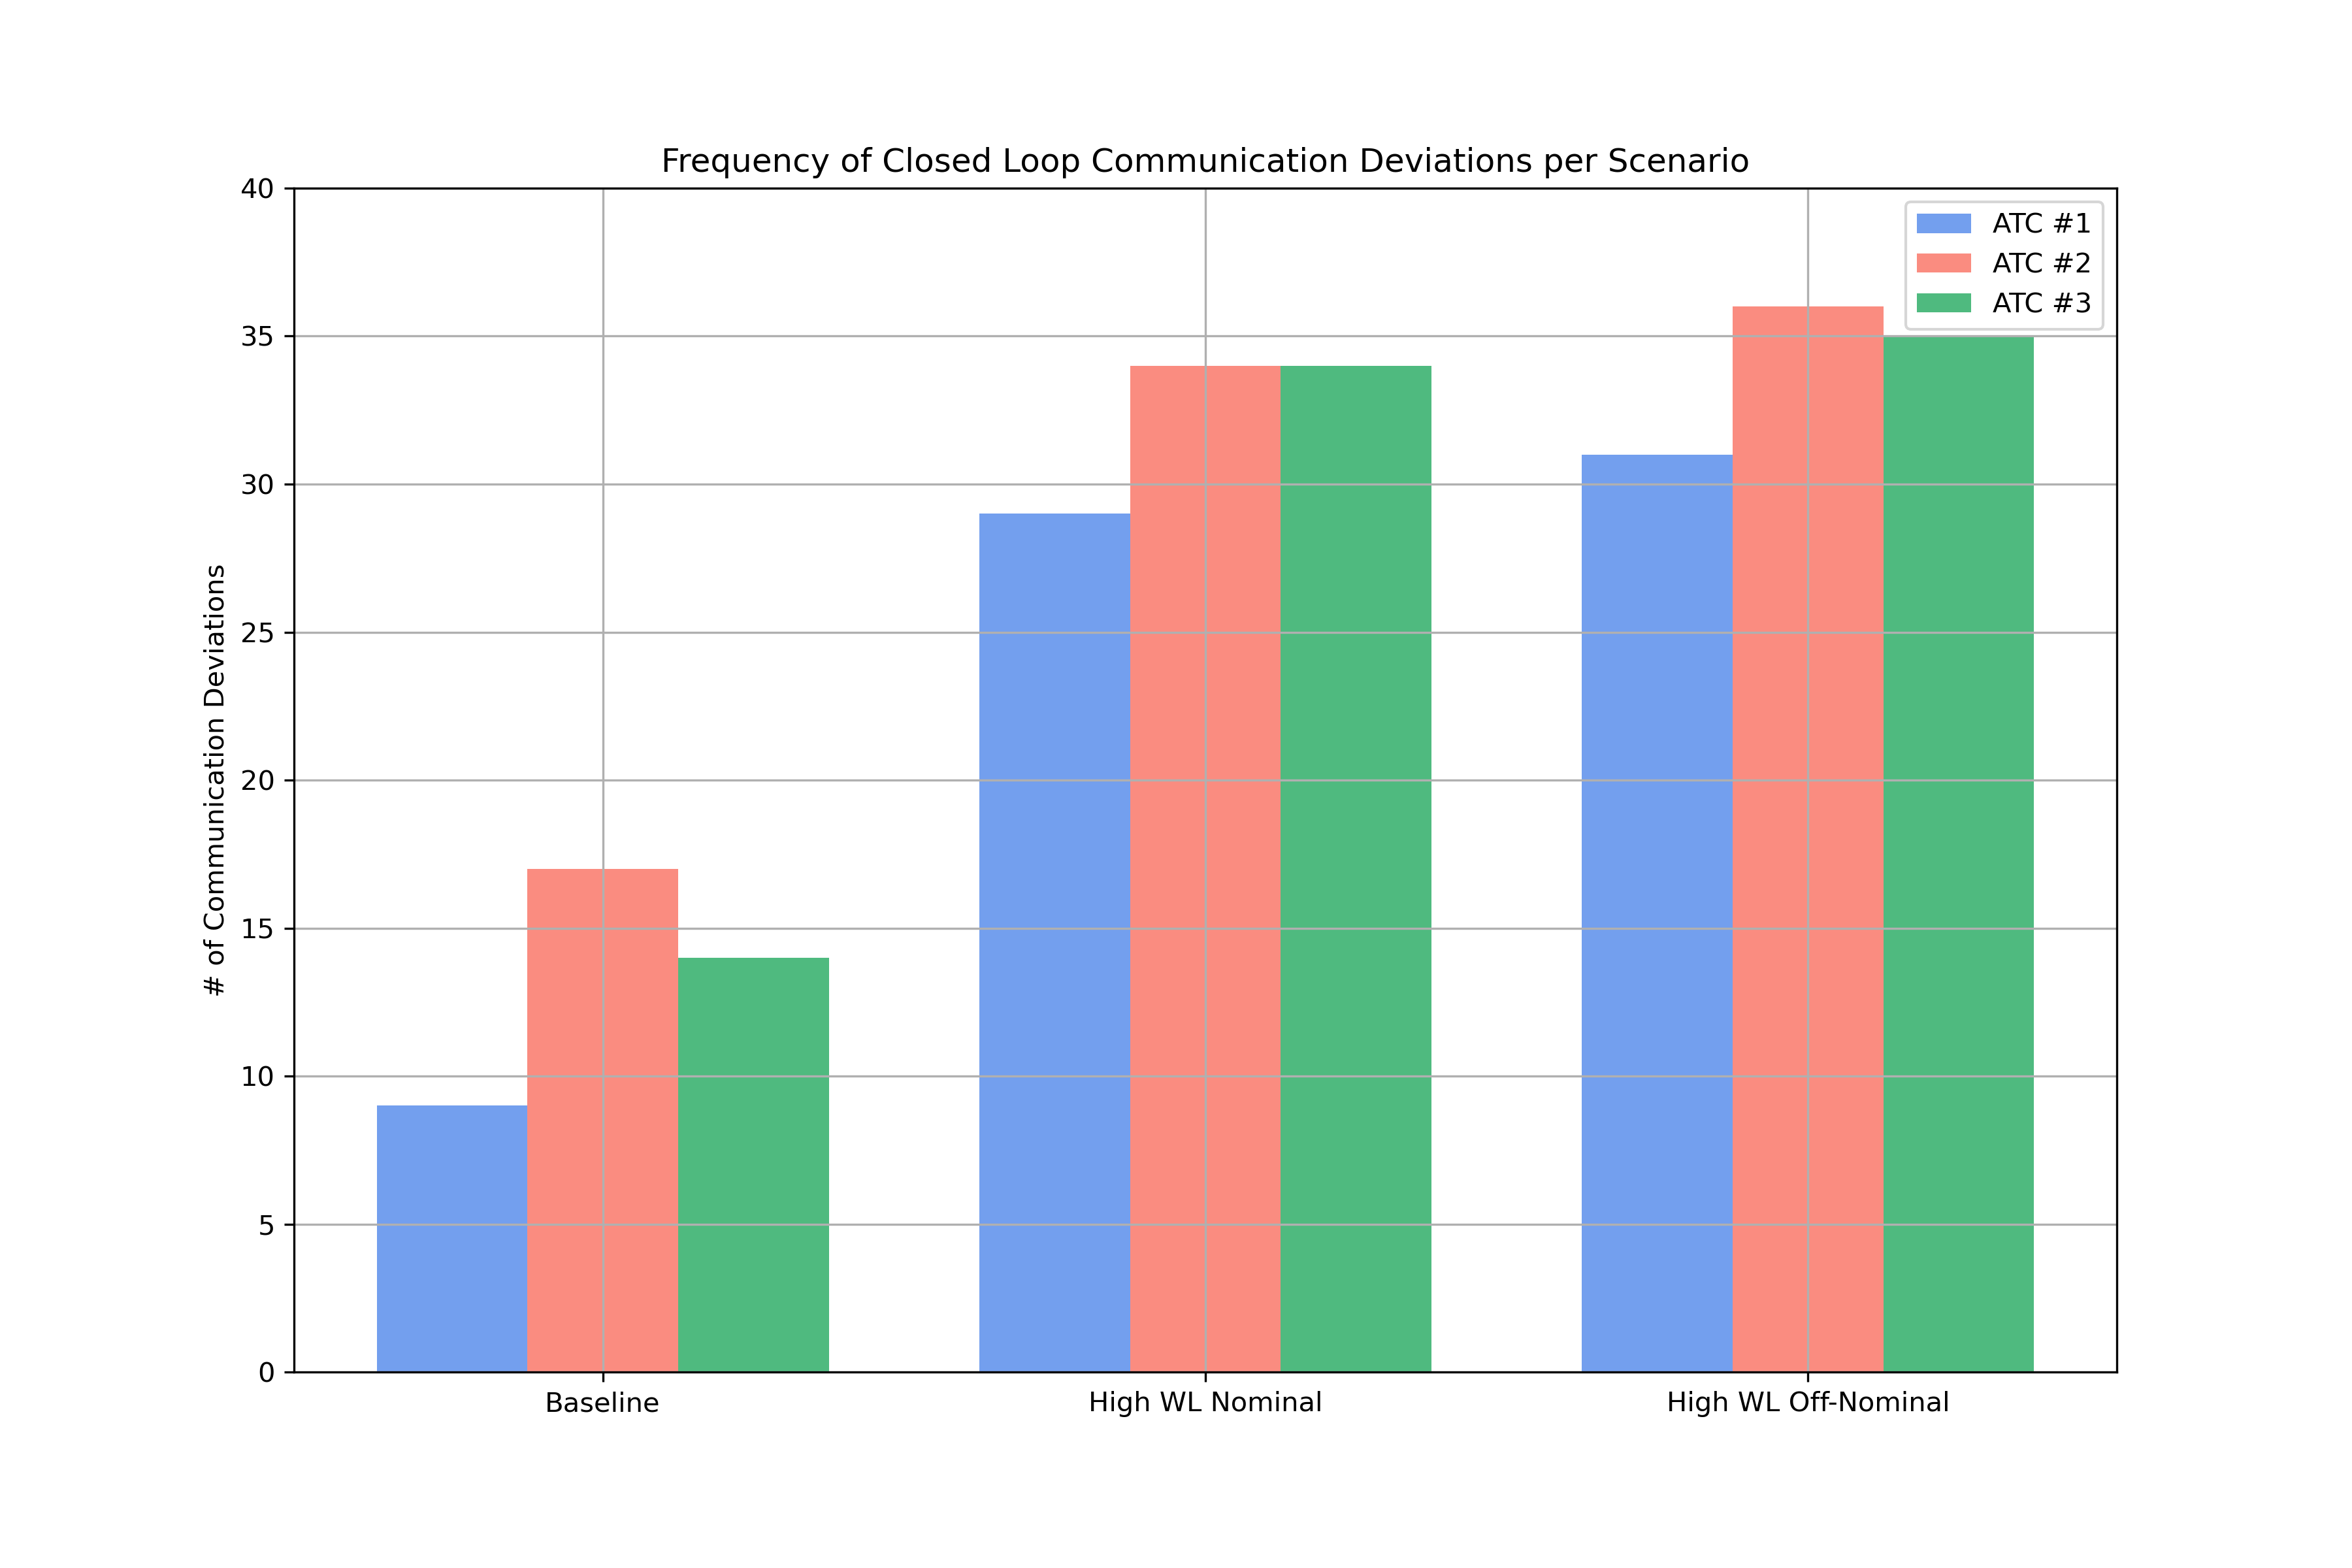
Figure 4 shows the histograms of communication deviations in (a), and the calculated measures of complexity in (b). As shown in Figure 4(a), there is a notable rise in communication challenges from the baseline scenarios to the high workload scenarios. The prolonged occurrence of off-nominal events could contribute to a slightly heightened level of complexity. Additionally, the deviations in communication patterns can differ across Air Traffic Control Officers (ATCos), possibly due to variations in individual experience and seniority. Therefore, it can be concluded that both airspace density and off-nominal events contribute to an increase in communication complexity. As depicted in Figure 4(b), it is evident that the correlation, predictability, and stability of the system all exhibit a decrease from the baseline scenarios to the high workload scenarios. These findings provide valuable insights into understanding the behavior of different scenarios and guide our further studies on workload prediction.
4 Proposed ATC Workload Prediction Framework
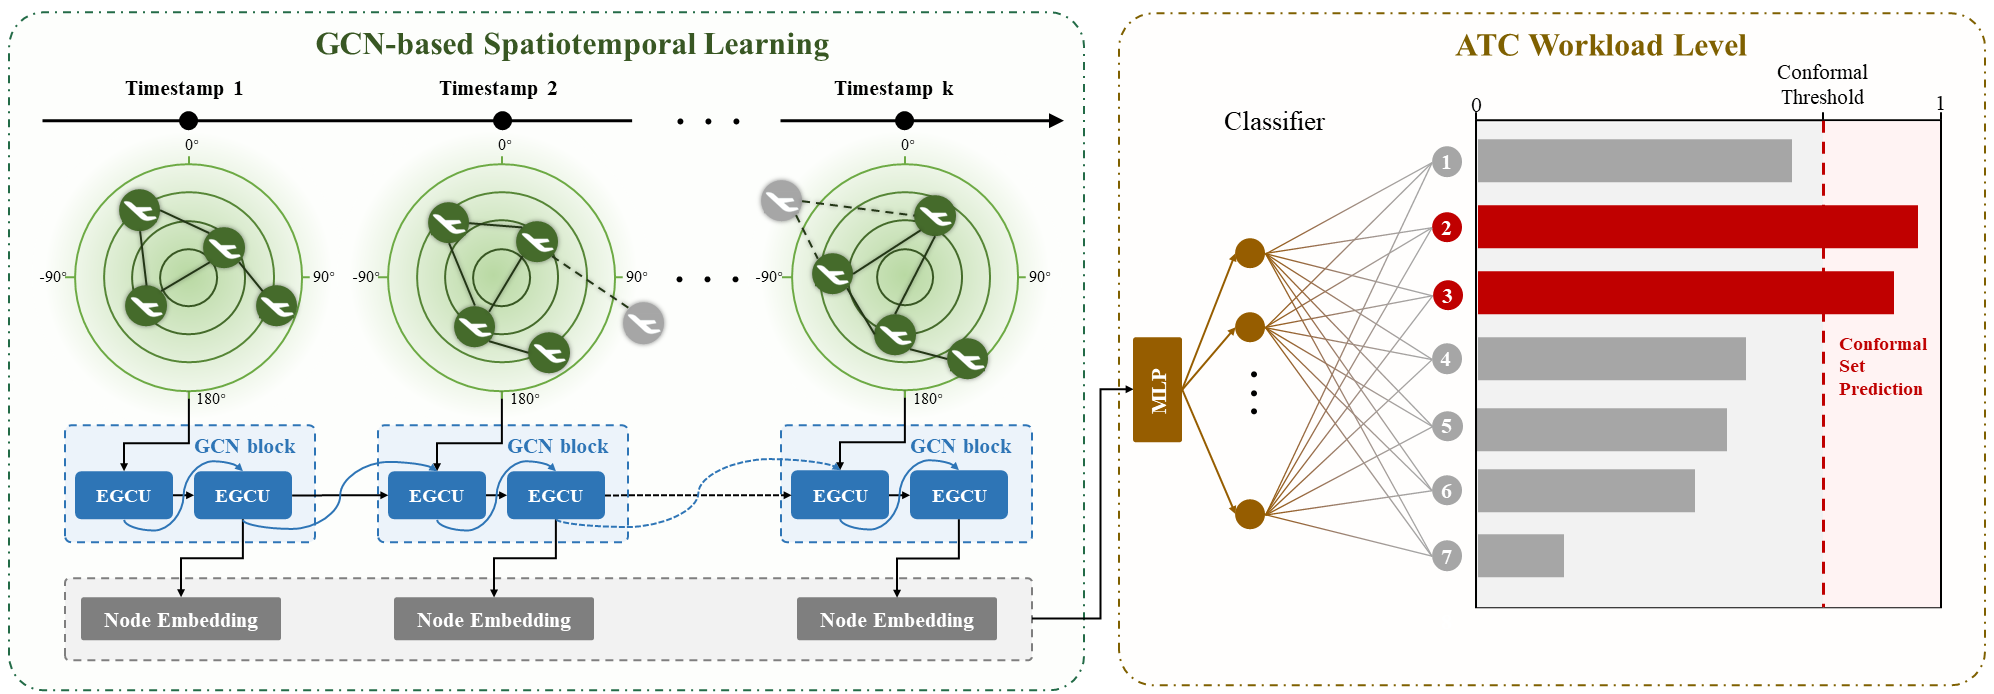
In this section, we describe the proposed workload machine learning prediction framework in Figure 5. We first demonstrate the formulation and basic concepts of the graph learning problems in Section 4.1. The dynamical graph convolution learning algorithm and conformal prediction setup are explained in Section 4.2 and Section 4.3, respectively.
4.1 Problem Formulation
As mentioned, the ATCo workload prediction task is viewed as a time-series dynamical graph classification task. In this paper, we use subscript to demonstrate the timestamp and superscript to denote the layer index. Graph neural networks (GNNs) are introduced to model the spatiotemporal layout of the airspace from the structured graph data with explicit message passing (Li et al., 2019b; Mohamed et al., 2020). We denote a graph at timestamp with vertices and edges, represented as , where the number of nodes at timestamp is and the number of edges at timestamp is . The adjacency matrix . The constructed graph structure can be either directed or undirected depending on whether the edges are directed from one node to another. The dynamic graph is mentioned when the graph topology varies with time. Especially, the graphs in our work are undirected dynamical graphs. The constructed graph inputs are and , where is the adjacency matrix at each timestamp t and is the node feature matrix.
Graph structure represents the spatial layout of the airspace. However, the dynamical graph constructed is based on the geo-distance between two aircraft pairs, resulting in geospatial graphs on a two-dimensional space. This type of graph construction is widely adopted with acceptable complexity. Consequently, in this work, we adopt a scaling formula described in minimum-spanning-tree-based workload prediction task (Sridhar et al., 1998) to scale the horizontal and vertical distance between two aircraft pairs into one distance metric. Specifically, the graph is built by calculating the distance between two aircraft pairs at the same timestamp . We use to represent the horizontal distance and to present the vertical separation distance between aircraft pairs . The scaling function is described in LABEL:{eq:_scale_distance}.
| (2) |
where is the spatial scaling factor which equalizes the separation on the horizontal and vertical dimension, as in Equation 3.
| (3) |
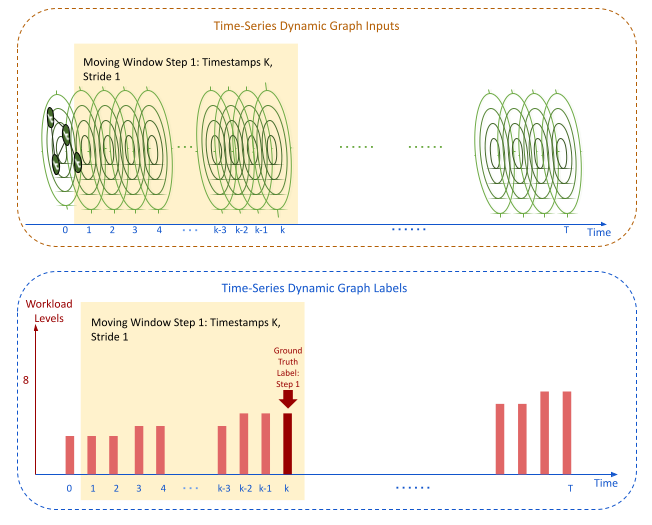
In this workload prediction task, we first obtain the constructed input and at each timestamp . In such a way, we obtain the series of graphs . Then, we fill the workload ratings into another time series based on the self-evaluated workload rating during the HITL simulations, representing the prediction labels. Last, we use a moving window approach to build the correct input-output matching for supervised machine learning. The schematic illustration of the moving window process is shown in Figure 6. We define a window of size and move the window along the time axis of the series of inputs, with a stride of 1. The time-series graph of size is denoted as . Similarly, we move the window function along the prediction labels and obtain the workload ratings by claiming the last reported workload value within the current window. Then, if denotes the ground truth workload label at timestamp , we mathematically formulate the problem into,
| (4) |
4.2 Evolving Graph Convolution Network
Spatial graph convolutional networks (GCN) (Kipf and Welling, 2016) convolve the input and using the derived compact form,
| (5) |
where is the activation function (i.e., ). is a normalized version of , to account of numerical instability. Specially, is defined as, , , . It’s clear that has the same dimension as as . is the kernel parameters. For multiple graph convolutional layer setup, stands for the updated graph embedding of convolutional layer at timestamp . Specifically, in classification problems, the activation function at the output layer is the function.
Evolving Graph Convolution Network (EvolveGCN) improves GCN by introducing recurrence layers to capture the dynamism underlying a time-series graph. Two types of EvolveGCN are presented (Pareja et al., 2020), depending on the recurrent updating architecture.
The first variant treats the GCN kernel parameter as the hidden state of recurrent learning function and updates with a gated recurrent unit (GRU), while the node embeddings of node features are still contained within the GCN hidden state tensor . EvolveGCN-H is used to denote this variant Equation 6. This requires a special design of GRU computation flows as described in (Pareja et al., 2020).
| (6) | ||||
| (7) |
Another variant of EvolveGCN is the -O version Equation 8, where the kernel parameter is treated as input of recurrent learning without considering the temporal correlations between node embeddings. The implementation of EvolveGCN-O is straightforward by extending dimensions.
| (8) | ||||
| (9) |
Either an EvolveGCN-H or EvolveGCN-O is denoted as an Evolving Graph Convolution Unit (EGCU), as shown in Figure 5. In both ways, the EGCU first updates the GCN weights and then propagates the hidden states through the layers. Several layers of EGCU form a GCN block in Figure 5. For a graph learning problem with large feature space, EvolveGCN-H is more effective since the feature embedding recurrence is also considered. Otherwise, EvolveGCN-O is more focused on learning the graph topology structure changes.
4.3 Conformal Prediction
In this section, we provide a brief overview of conformal prediction (CP). For the classification task mentioned above, we have EvolveGCN acted as the classifier , which outputs an estimated probability for each class, i.e., for classes. We reserve a small amount of data called calibration set to calculate the probability score threshold such that the following condition holds on the test set,
| (10) |
where the test dataset is the unused test set to evaluate model performance. is the pre-defined tolerated error rate. This is to guarantee that the model is confident that the model prediction set contains the correct ground truth label. This equation is also known as the marginal conformal coverage guarantee, which has been proved in the literature (Vovk et al., 1999; Angelopoulos and Bates, 2021). Notably, the calibration is the key step to find . Suppose we define the concept of the conformal score by one minus the softmax probability of the true class, is defined to be the quantile of the conformal scores. is the ceiling function to correct the quantile. Then, the prediction of a new test sample will be all classes with a softmax score higher than . The prediction set will be larger if the model is uncertain about the prediction labels or if the input is out-of-distribution. Intrinsically, the size of the prediction set is the indicator of model uncertainty.
Conformal prediction (CP) has been studied from various angles by researchers. However, the classical CP method is susceptible to coverage issues due to its tendency to produce the smallest average size of prediction sets (Sadinle et al., 2019). Specifically, CP tends to overcover hard data samples while undercover simple ones. To address this issue, researchers have proposed an approach called adaptive conformal prediction (Angelopoulos et al., 2020; Romano et al., 2020). The underlying principle of this method is to compute the conformal threshold based on the cumulative softmax score across classes.
It’s also noteworthy to discuss conformal evaluation methods, which are adopted in evaluating our model. To determine the model’s performance, a straightforward method is to examine the histogram of prediction set sizes visually. Essentially, a larger size of the prediction set implies that the model is facing certain data quality problems, while the variation in the set size can provide insights into the model’s ability to differentiate between easy and difficult input samples.
| (11) |
Conditional coverage is a feasible approach to evaluate the adaptivity of conformal prediction. For instance, in a classification setting, we seek to find the prediction sets with exactly coverage for any input data sample, as in Equation 11. The conditional coverage concept is a stronger metric than the marginal coverage mentioned above. Some literature mentioned that conditional coverage is impossible to achieve in most general cases (Angelopoulos et al., 2022). Size-stratified coverage (SSC) metric is a general metric to evaluate how close the model is able to achieve Equation 11. SSC metric is a way to evaluate the performance of conformal prediction models. It is based on the idea that prediction sets of different sizes may have different properties and should be evaluated separately. The key is to group test samples into different size strata based on the size of their prediction sets and compute the averaged empirical coverage on each size strata. SSC metric can be useful to diagnose specific issues, such as overcoverage or undercoverage, that may be related to the size of the prediction sets. In addition, another conformal prediction evaluation method has been proposed recently (Olsson et al., 2022), where a calibration plot of the prediction error versus the specified significance level () is used. Remarkably, In Section 5, we evaluate our model with these metrics.
CP provides a rigorous way to measure the uncertainty associated with the predictions made by a machine learning model and to express this uncertainty in the form of prediction intervals or regions that can be used to guide decision-making. This can be particularly useful in critical engineering applications where accurate prediction intervals or regions are essential (Balasubramanian et al., 2014). CP has been widely adopted in drug discovery (Alvarsson et al., 2021), medical diagnosis (Lu et al., 2022), and robotics (Luo et al., 2022). CP is a unified post-hoc softmax score calibration process to generate prediction sets for any classification model (Papadopoulos et al., 2002; Vovk et al., 2005; Lei and Wasserman, 2014). In this work, we propose to use CP for aviation decision support. Specifically, the prediction set comes from CP gives uncertain prediction label suggestions, i.e., workload rating of 3, 5, 7. While the isolated classification label in workload prediction is not reasonable, we propose to fill the intermediate workload ratings based on the minimum predicted rating and the maximum predicted ratings.
5 Experiments
In previous sections, we have introduced the HITL data collection process, the problem definition, the machine learning model system design, and conformal prediction for better ground truth label coverage Section 4. In this section, we present a comprehensive of experiments to test and evaluate the proposed model. We first discuss several evaluation metrics used for this classification task. Then we report the classification accuracy from the machine learning model with a few implementation details. Lastly, conformal prediction set results are reported with several conformal coverage evaluation methods mentioned in Section 4.3. The validation set is used to tune hyper-parameters, and the testing dataset results are evaluated based on the best validation epoch.
5.1 Evaluation Metrics
The F-score, or F-measure, is a binary classification metric used in statistical analysis to assess the accuracy of test samples. Specifically, the F1-score is defined as the symmetrical harmonic mean of precision and recall (Taha and Hanbury, 2015). F1-score can also be used for multi-class classification by taking either the micro-averaging (MicroF1) or the macro-averaging (MacroF1).
| (12) | ||||
| (13) | ||||
| (14) |
Equation 12 gives the mathematical formulation of MicroF1, where each sample is considered independently without considering which class this sample belongs to. MicroF1 treats each data input equally but is biased on class frequency. MicroF1 is useful when the classification task is unbalanced, meaning that some classes have many more instances than others. In this case, the MicroF1 gives equal weight to each instance, regardless of its class.
| (16) |
On the contrary, MacroF1 average the F1 score across all classes as in Equation 16, where is the number of classes, and are the F1 scores for each class. MacroF1 treats each class equally regardless of the size of samples within each class thus, it’s biased on the number of samples. MacroF1 is useful when the classification task is balanced, meaning that each class has approximately the same number of instances. In this case, MacroF1 gives equal weight to each class, regardless of its frequency.
In this work, we are encountering a highly-imbalanced classification problem Figure 2. Thus, MicroF1 is a better indicator than MacroF1. It is noteworthy to mention that in should be adjusted to exclude the class labels that are not presented in either ground truth or predictions. We report both metrics in our studies.
5.2 Implementation Details
Although the commonly adopted node-level or link-level classification objective is prevalent, the proposed workload prediction framework is instead a graph-level classification task (Pareja et al., 2020). Thus, on the output layer, we take the aggregated class probability score across each node to get a unified score of the entire graph. We adopted the grid-search strategy to search for key parameters and fine-tuned the neural network model with the data collected from three different scenarios. The key parameters used are the number of EvolveGCN layers (EGCU layers), and the dimensions of these layers. Dropout is used in the classifier to address overfitting. Table 3 lists the fine-tuned key model parameters under three simulation scenarios. Other parameters, such as the dimension of classifiers, are kept the same as the original implementation (Pareja et al., 2020). Parameter tuning on the classifiers might be useful, but it’s beyond the scope of this study.
| Baseline |
|
|
|||||||
| Number of EGCU Layers | 2 | 2 | 4 | ||||||
| EGCU Layer Dimensions | 64 | 128 | 64 | ||||||
| Dropout Ratio | 0.25 | 0.5 | 0.25 | ||||||
| Learning Rate | 0.001 | 0.0015 | 0.0005 |
Moreover, as discussed in Section 3, the first reported workload rating starts at 3 minutes of the 25 minutes duration. This corresponds to the timestamp with interval in the collected flight traffic data. Consequently, the moving window size in our experiment is 36, with a stride of 1. We separate the data into train, validation, and test sets with a ratio of . The validation set is used for deep learning model hyper-parameter tuning. Moreover, the validation set is also used as the calibration set to find the CP threshold .
5.3 Experiment Results
| ATC Workload Level Prediction | Baseline | High Workload Nominal | High Workload Off-Nominal | |||||
| MicroF1 | MacroF1 | MicroF1 | MacroF1 | MicroF1 | MacroF1 | |||
|
0.306 | 0.218 | 0.307 | 0.198 | 0.323 | 0.195 | ||
|
0.331 | 0.236 | 0.383 | 0.263 | 0.350 | 0.255 | ||
|
0.364 | 0.283 | 0.455 | 0.386 | 0.459 | 0.367 | ||
| GCN | 0.404 | 0.218 | 0.580 | 0.401 | 0.526 | 0.352 | ||
| EvolveGCN-O | 0.545 | 0.277 | 0.740 | 0.632 | 0.695 | 0.472 | ||
| EvolveGCN-H | 0.413 | 0.221 | 0.593 | 0.474 | 0.581 | 0.414 | ||
In this work, we compare our model with both classical methods (i.e., linear regressions (LRs)) and simple data-driven learning methods (i.e., fully-connected neural networks/multilayer perceptrons (MLPs)). In Hah et al. (2006), the authors also conducted high-fidelity human-in-the-loop simulations to study the impact of traffic density features on controller workload. They found that the workload rating of the enroute center controller is proportional to the number of aircraft with a slope of and bias of . They also identified the primary sources of workload for controllers, including airspace and traffic management, communication, and coordination tasks with workload management suggestions. In Sridhar et al. (1998); Chatterji and Sridhar (2001), the authors create graph-structured airspace data structure – minimum-spanning trees but propose several handcraft features based on the histogram of node features. Then a two-layer fully-connected neural network is used for prediction based on handcrafted features and shows remarkable performance. However, the workload ratings are directly generated from the traffic density, where thresholds of 7 and 17 separate workload ratings into low, medium, and high scenarios. Likewise, inspired by this work, our proposed method adopts a graph structure to represent the spatiotemporal layout. We utilize the recent advancement in graph learning and learn from the graph structure without handcrafted features.
In Table 4, comparing the first two rows, we first show that including additional graph node features can achieve higher prediction accuracy, even for simple LRs. Despite the traffic density features, additional graph node features are traffic conflict features (i.e., horizontal/vertical minimum separation to nearby aircraft). For the MLP with handcraft features, we generate second-order statistics of the sum and difference histograms introduced in (Sridhar et al., 1998). As a reference to EvolveGCN, we also conduct an experiment on vanilla GCN. This can be easily achieved by removing the LSTM layer in Equation 8. We show that EvolveGCN can achieve significantly higher MicroF1 and MacroF1 than LP, MLP, and GCN. Moreover, the -O variant EvolveGCN outperforms the -H variant. One of the major reasons is the selection of top K indices reduces the hidden dimension of EGCU, due to the low node feature dimensions and a small number of nodes in graphs (i.e., only one aircraft showing up at the first timestamp) at certain timestamps.
5.4 Conformal Prediction Results
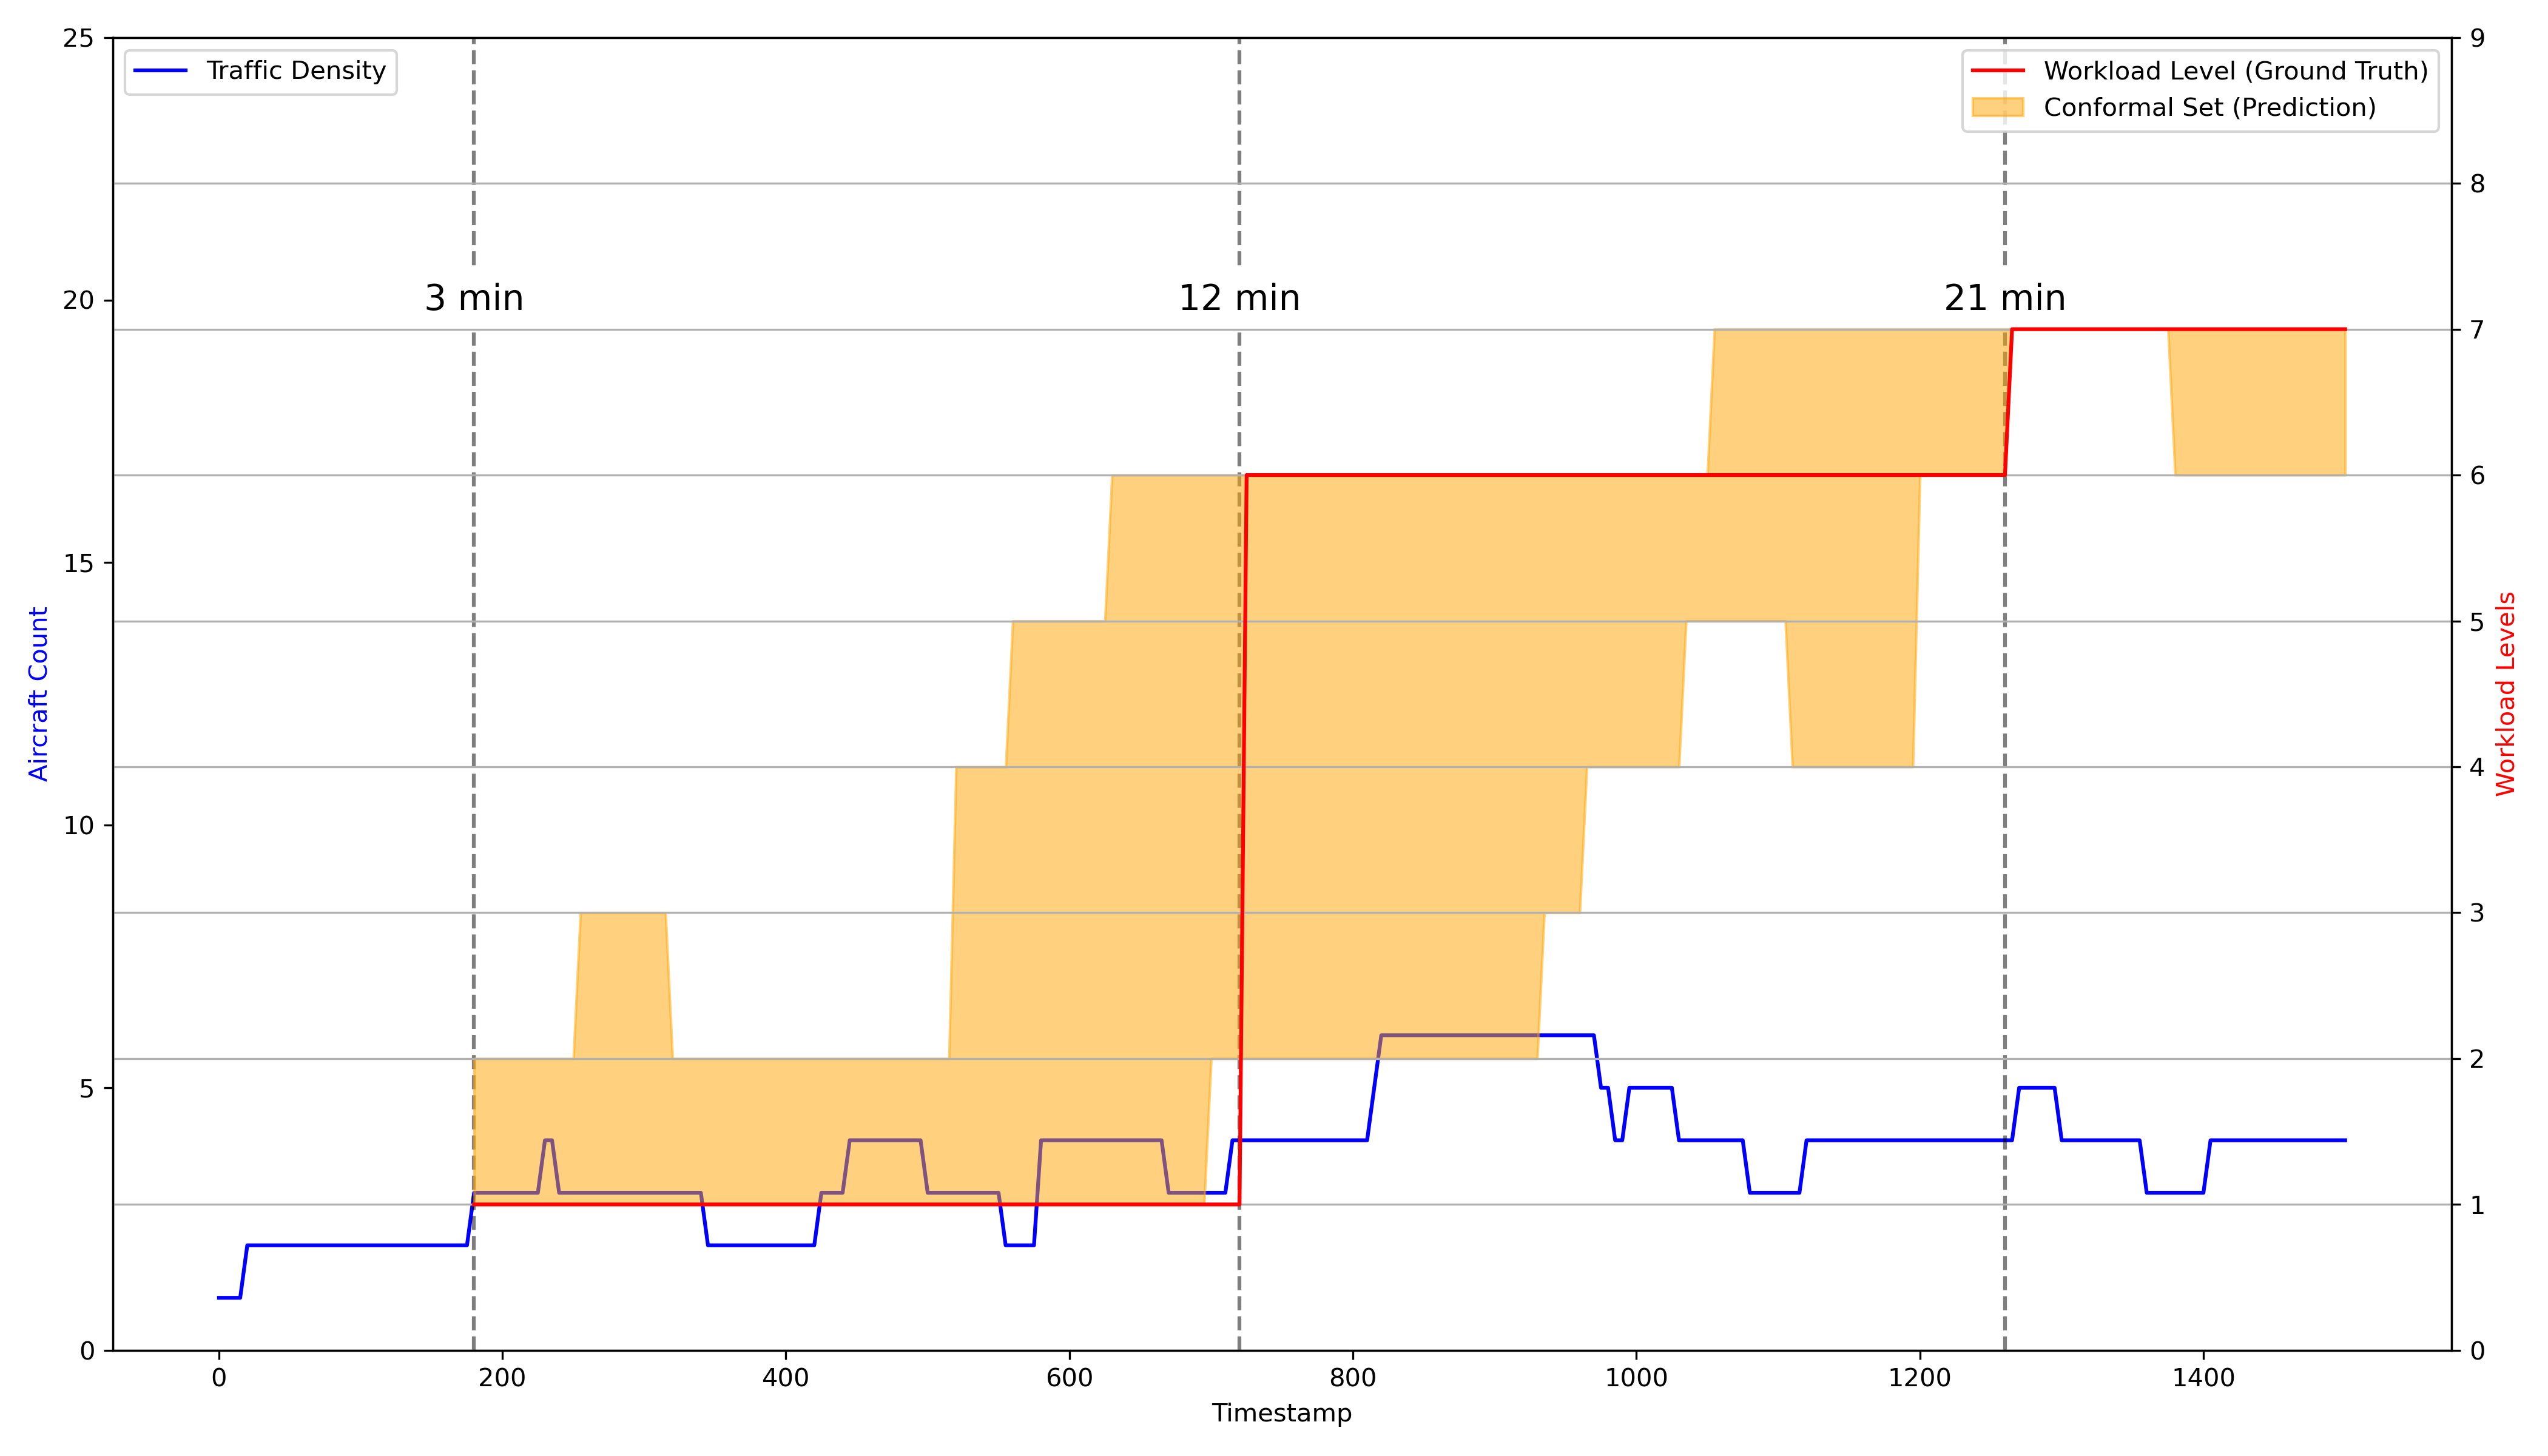
As mentioned, we use conformal prediction to improve prediction accuracy further. In Figure 7, the prediction on one test participant is shown. The conformal prediction set coverage is the shaded region. The conformal prediction is generated with a tolerated error rate of . The blue solid lines show the real-time aircraft density (left axis) in the simulation, and the red lines are the interpolated workload ratings. At 3 min, 12 min, and 21 min, the participants are required to submit their workload rating to the computer. The ground truth workload ratings are colored in red (right axis). The conformal prediction set covers most of the ground truth but is undercover at several spots. As discussed in Section 4.3, we further evaluate the conformal prediction coverage.


5.5 Conformal Coverage Evaluation
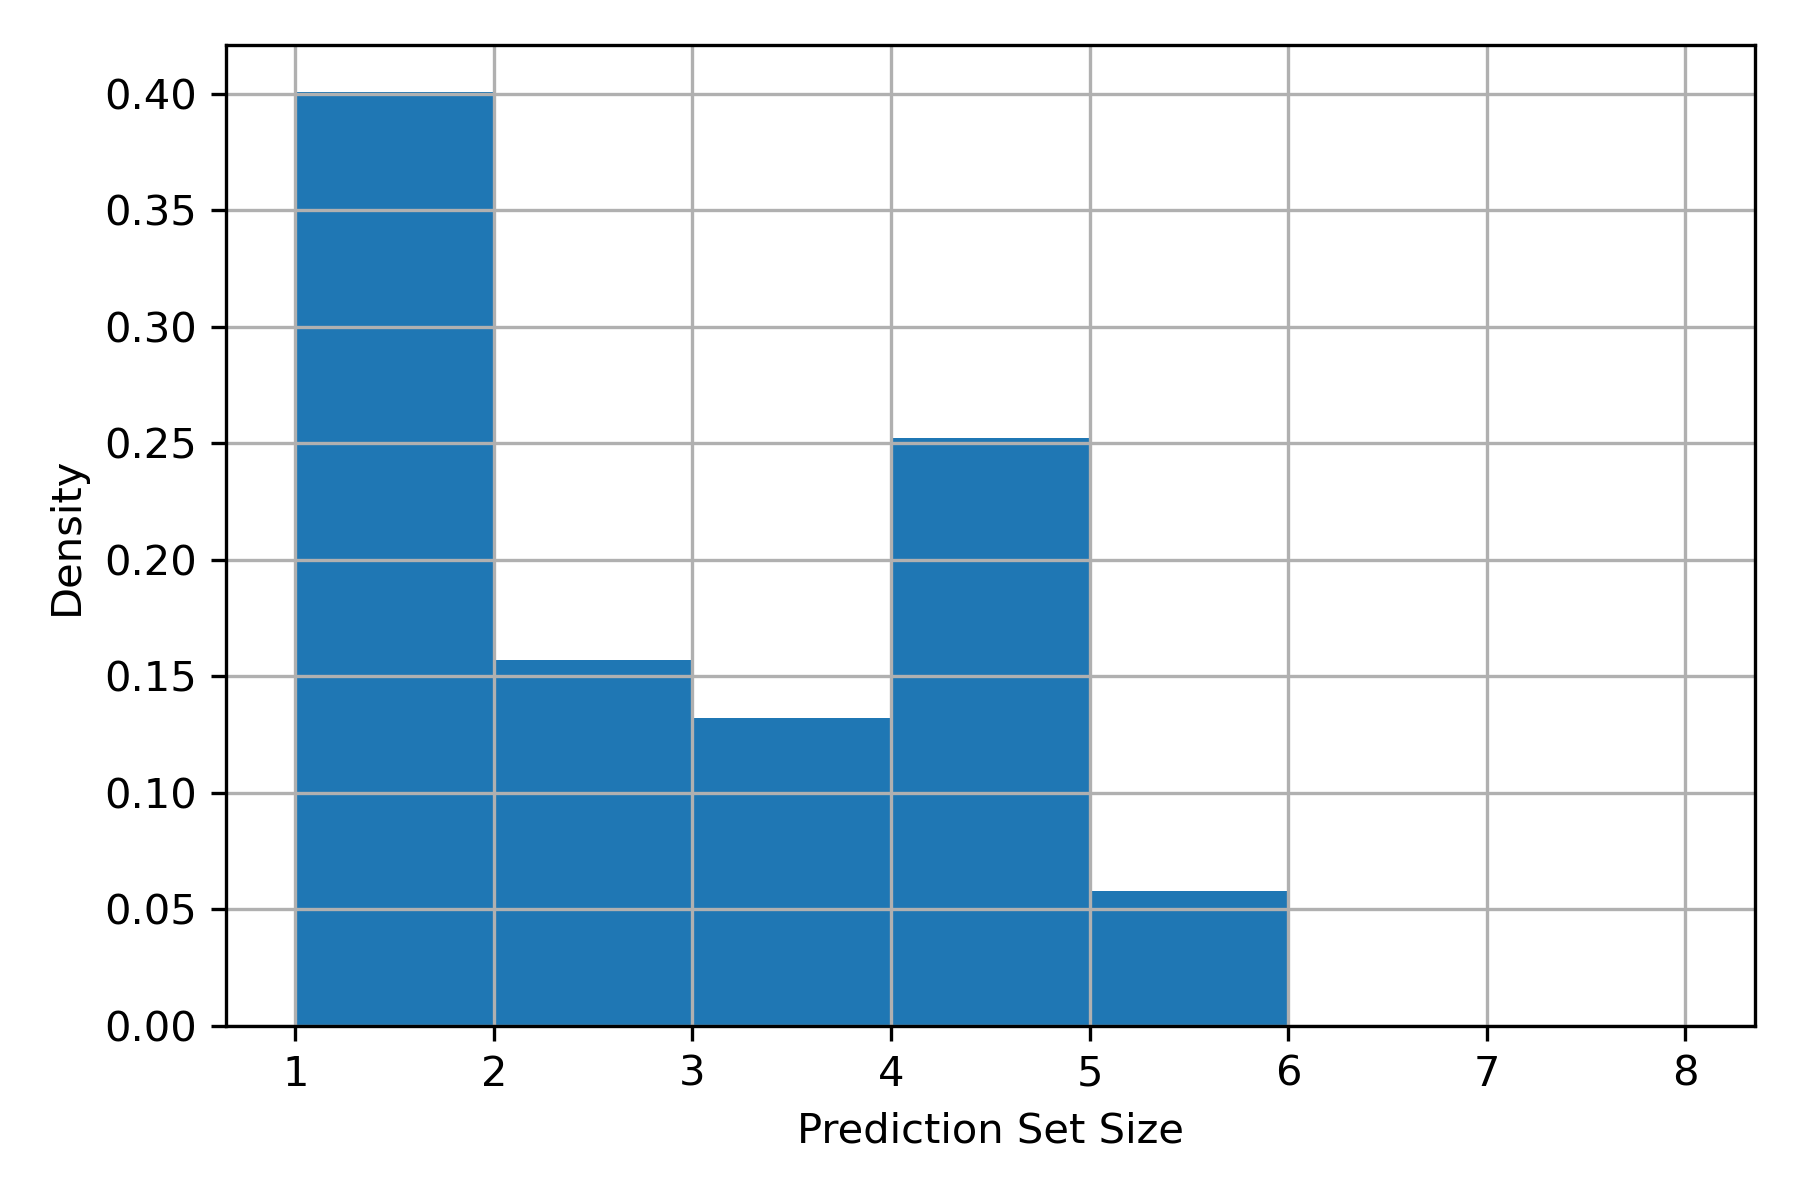
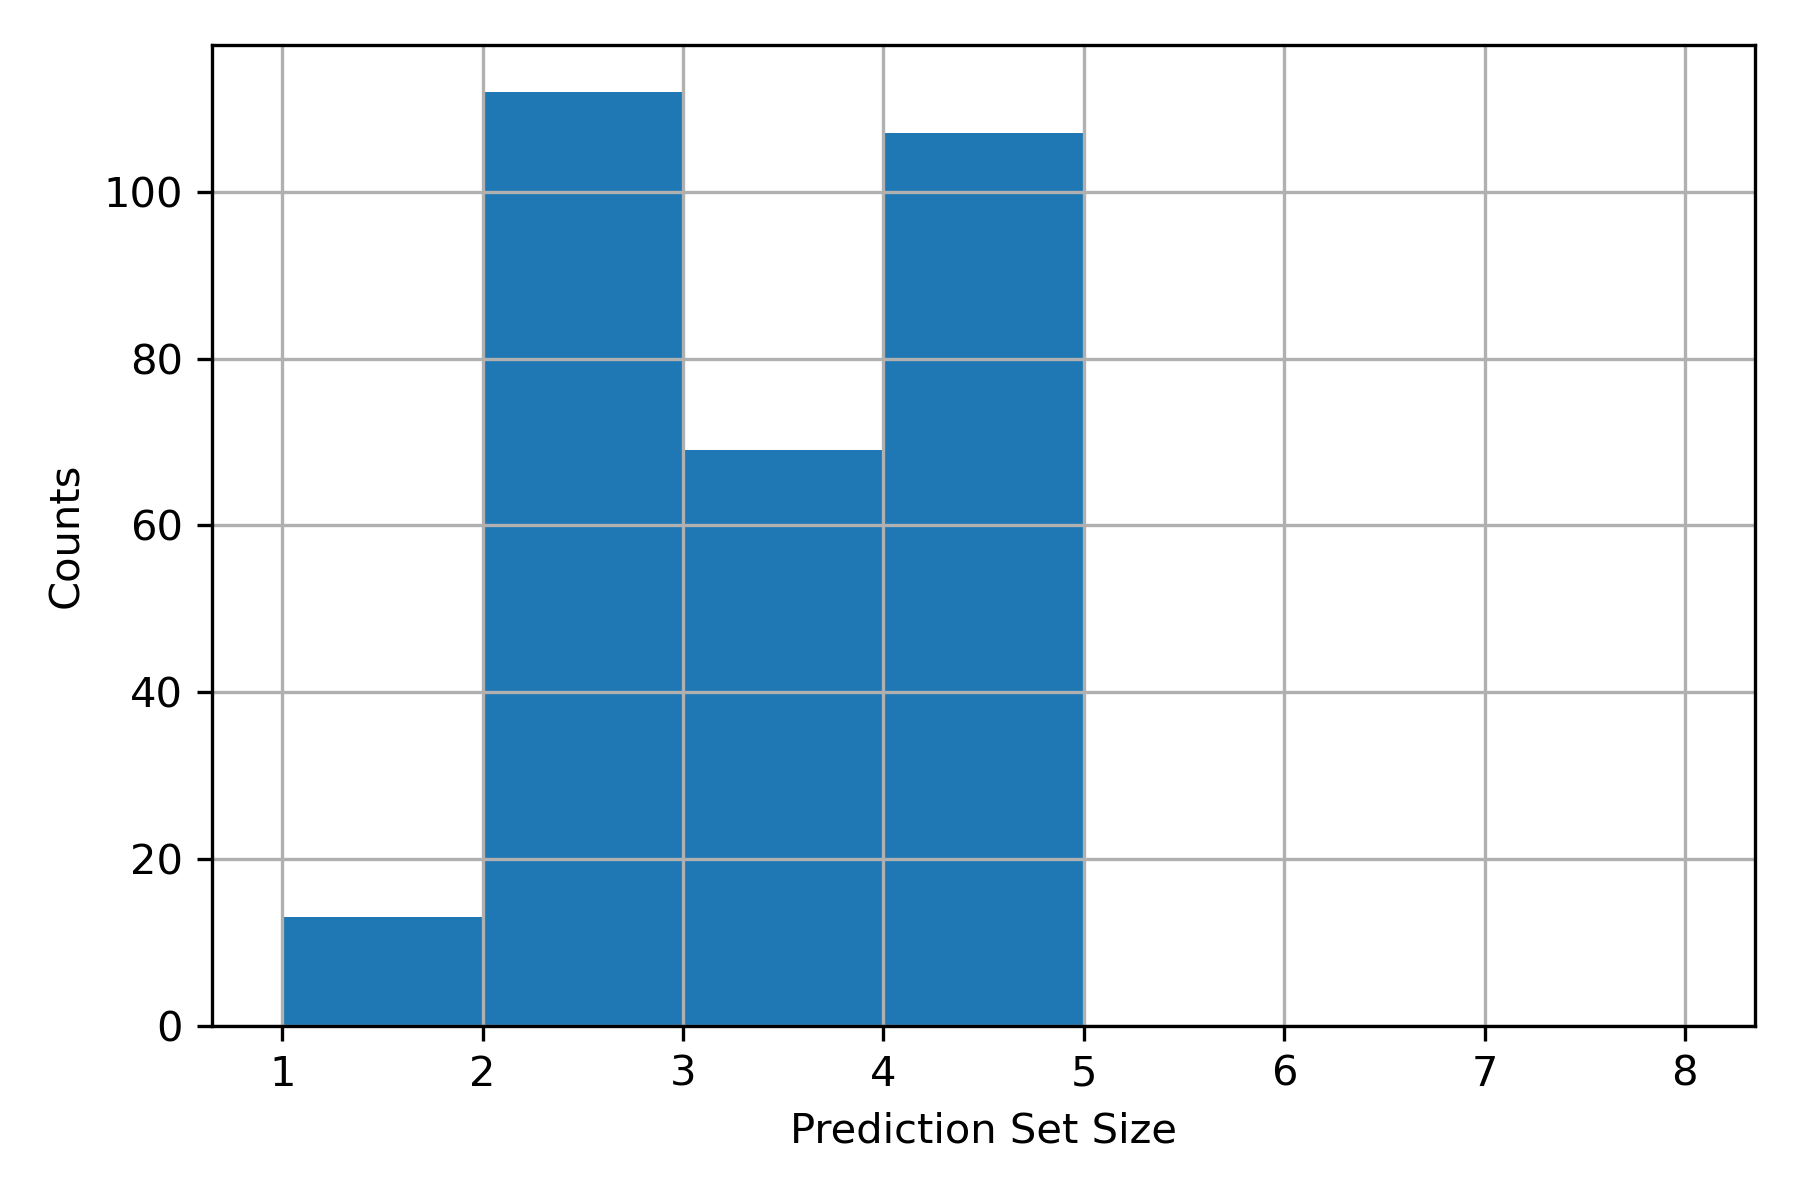
We adopt different conformal coverage evaluation metrics to examine the performance of our conformal set. Firstly, we plot the histogram of set sizes. A high average set size suggests that the conformal prediction procedure is imprecise, which could indicate issues with the score or underlying model. Secondly, the range of set sizes indicates whether the prediction sets adapt properly to the complexity of examples. A wider range is typically preferred because it implies that the procedure accurately differentiates between simple and challenging inputs. We show the histograms in Figure 8. The size of conformal prediction is typically around 5. The spread for baseline and high workload nominal conditions looks reasonable. The model is able to distinguish hard and easy samples. However, the spread for high workload off-nominal conditions indicates potential scoring issues or simply difficult data (Angelopoulos and Bates, 2021).

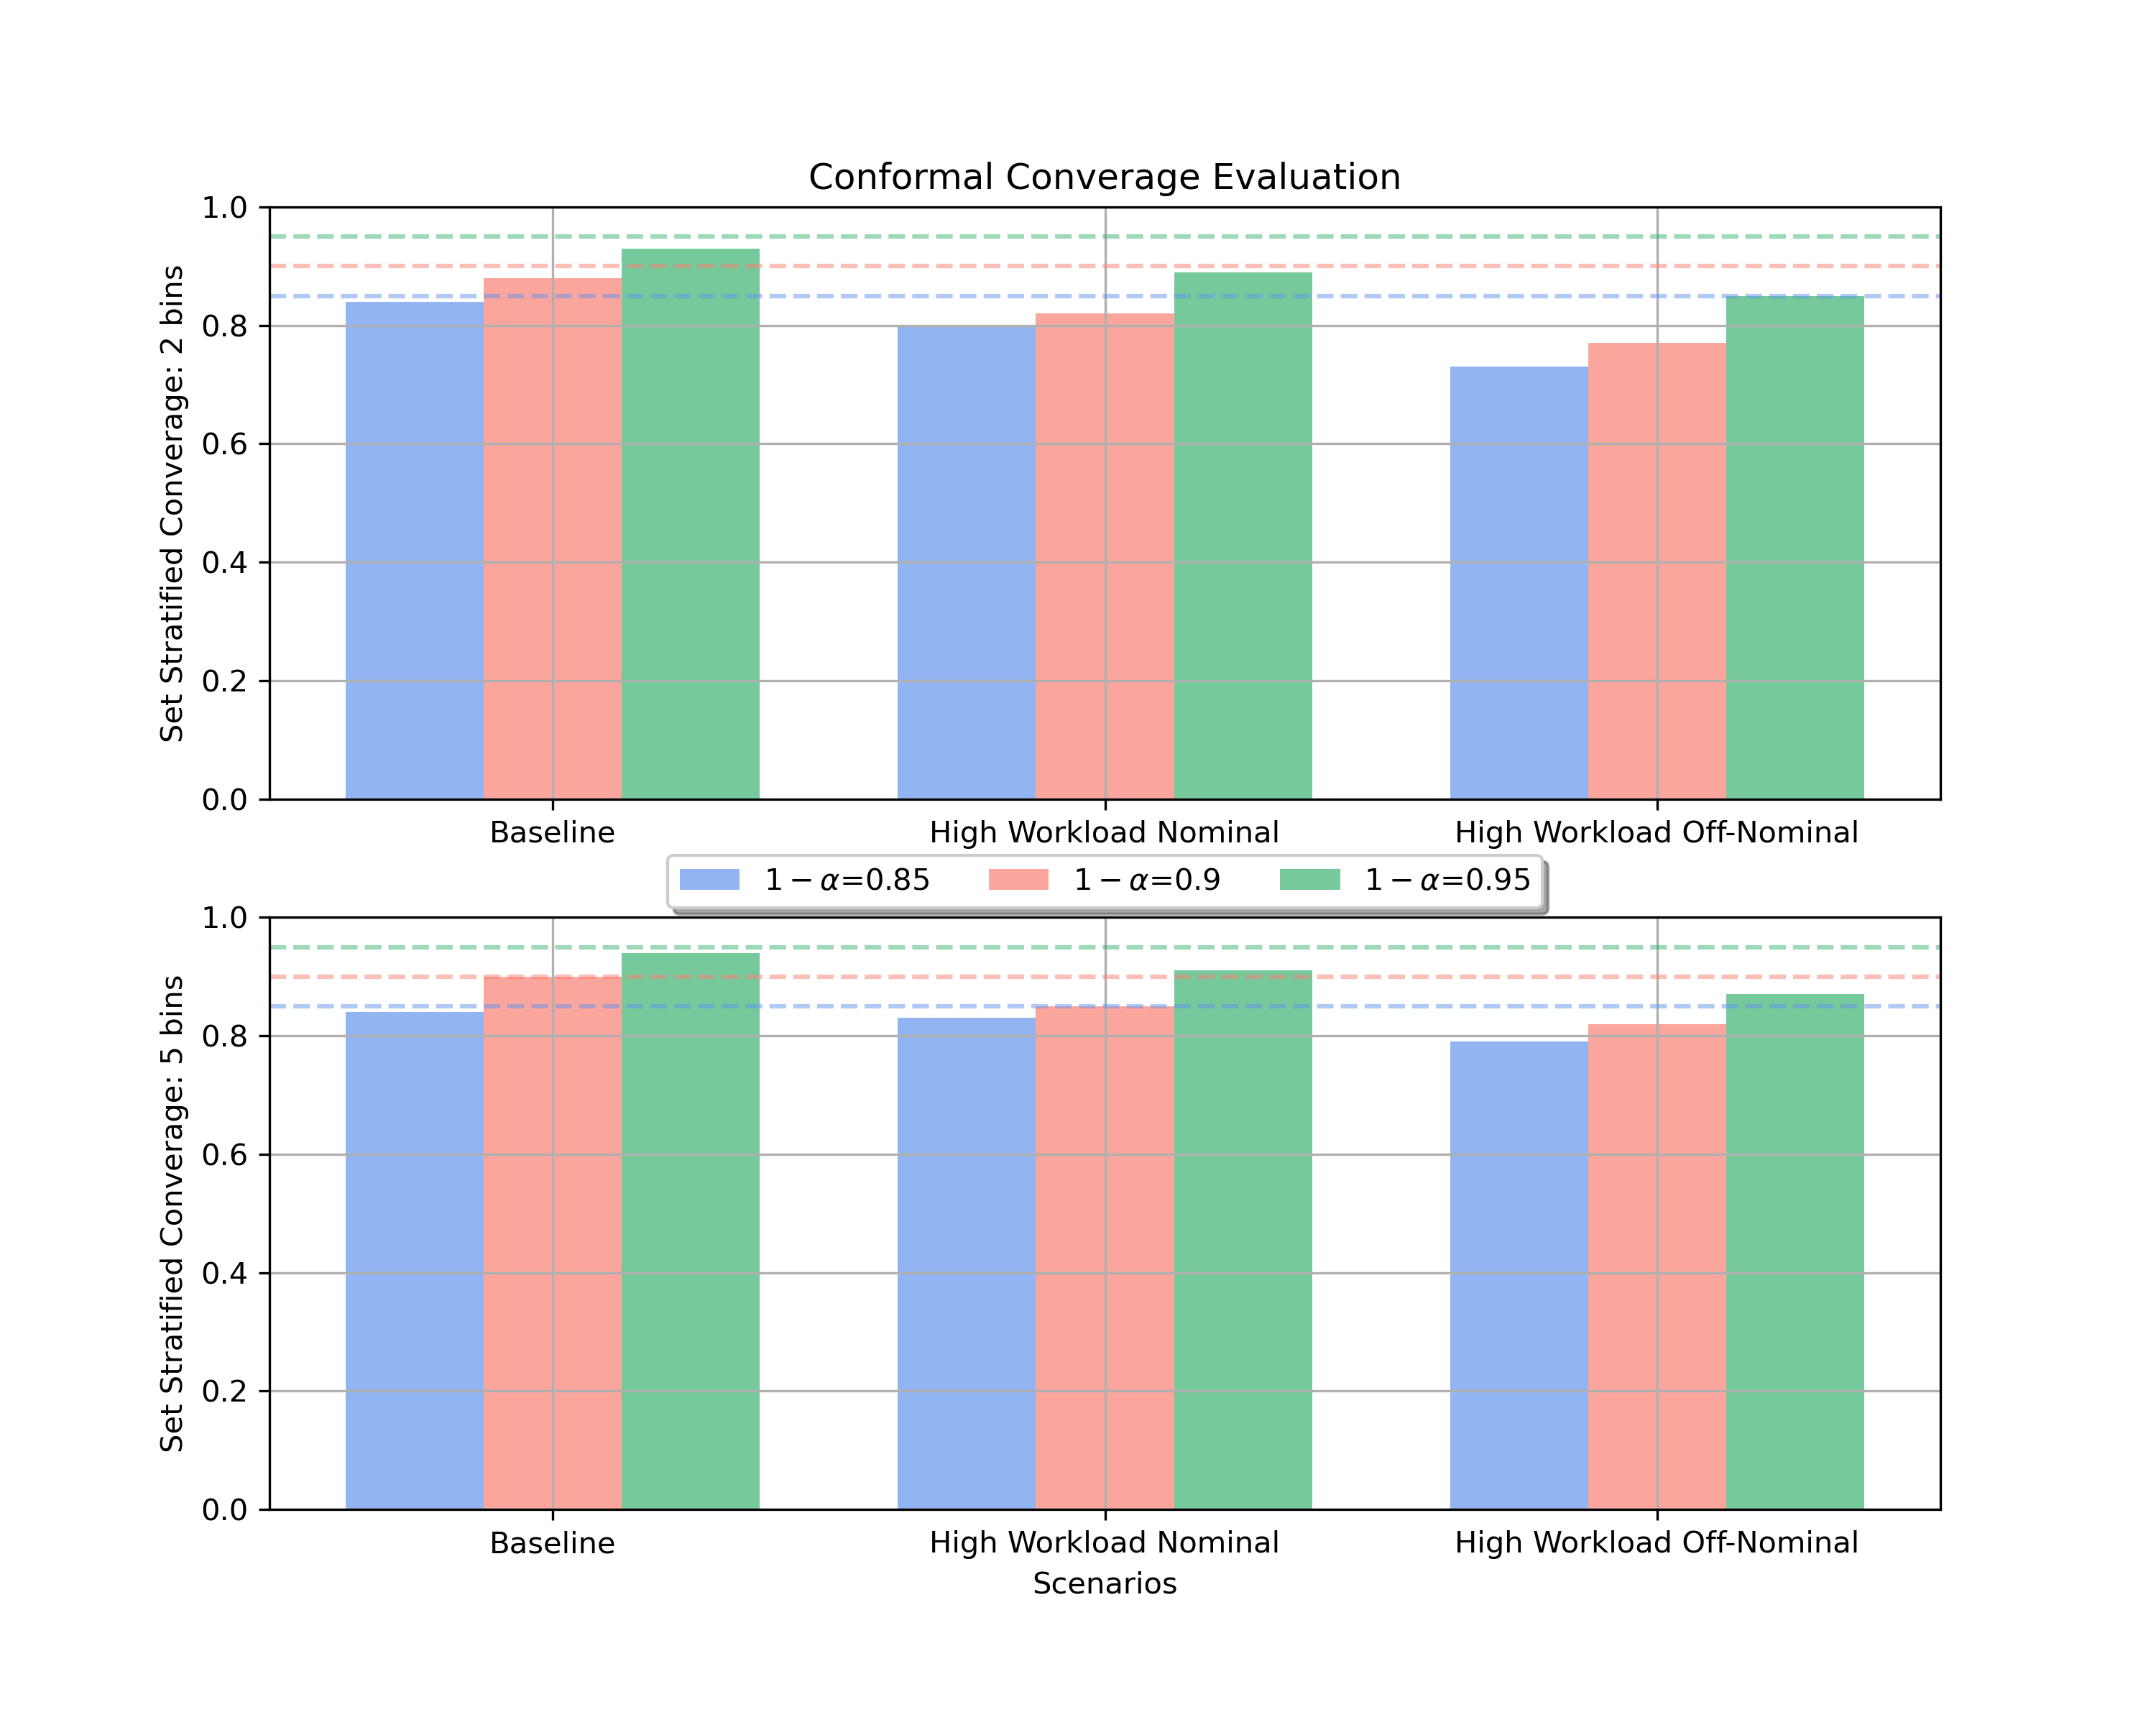
Following the discussion in Section 4.3, we investigate the size-stratified coverage (SSC) to evaluate the condition coverage and plot the figures in Figure 9. The dash lines are desired coverage values. In this figure, we consider three desired error rates, , for three scenarios. We use two possible cardinalities of two bins and five bins. In other words, we divide the predicted sets into different size categories (e.g., sets of size 2, sets of size 5.) and calculate the percentage of times that the true value falls within each category. We discover that the prediction coverage of baseline conditions shows a good sign, but the two high workload scenarios tend to under-coverage. Again, the reasons still come from the unsatisfactory of the collected data, which leads to lower reported F1 values.
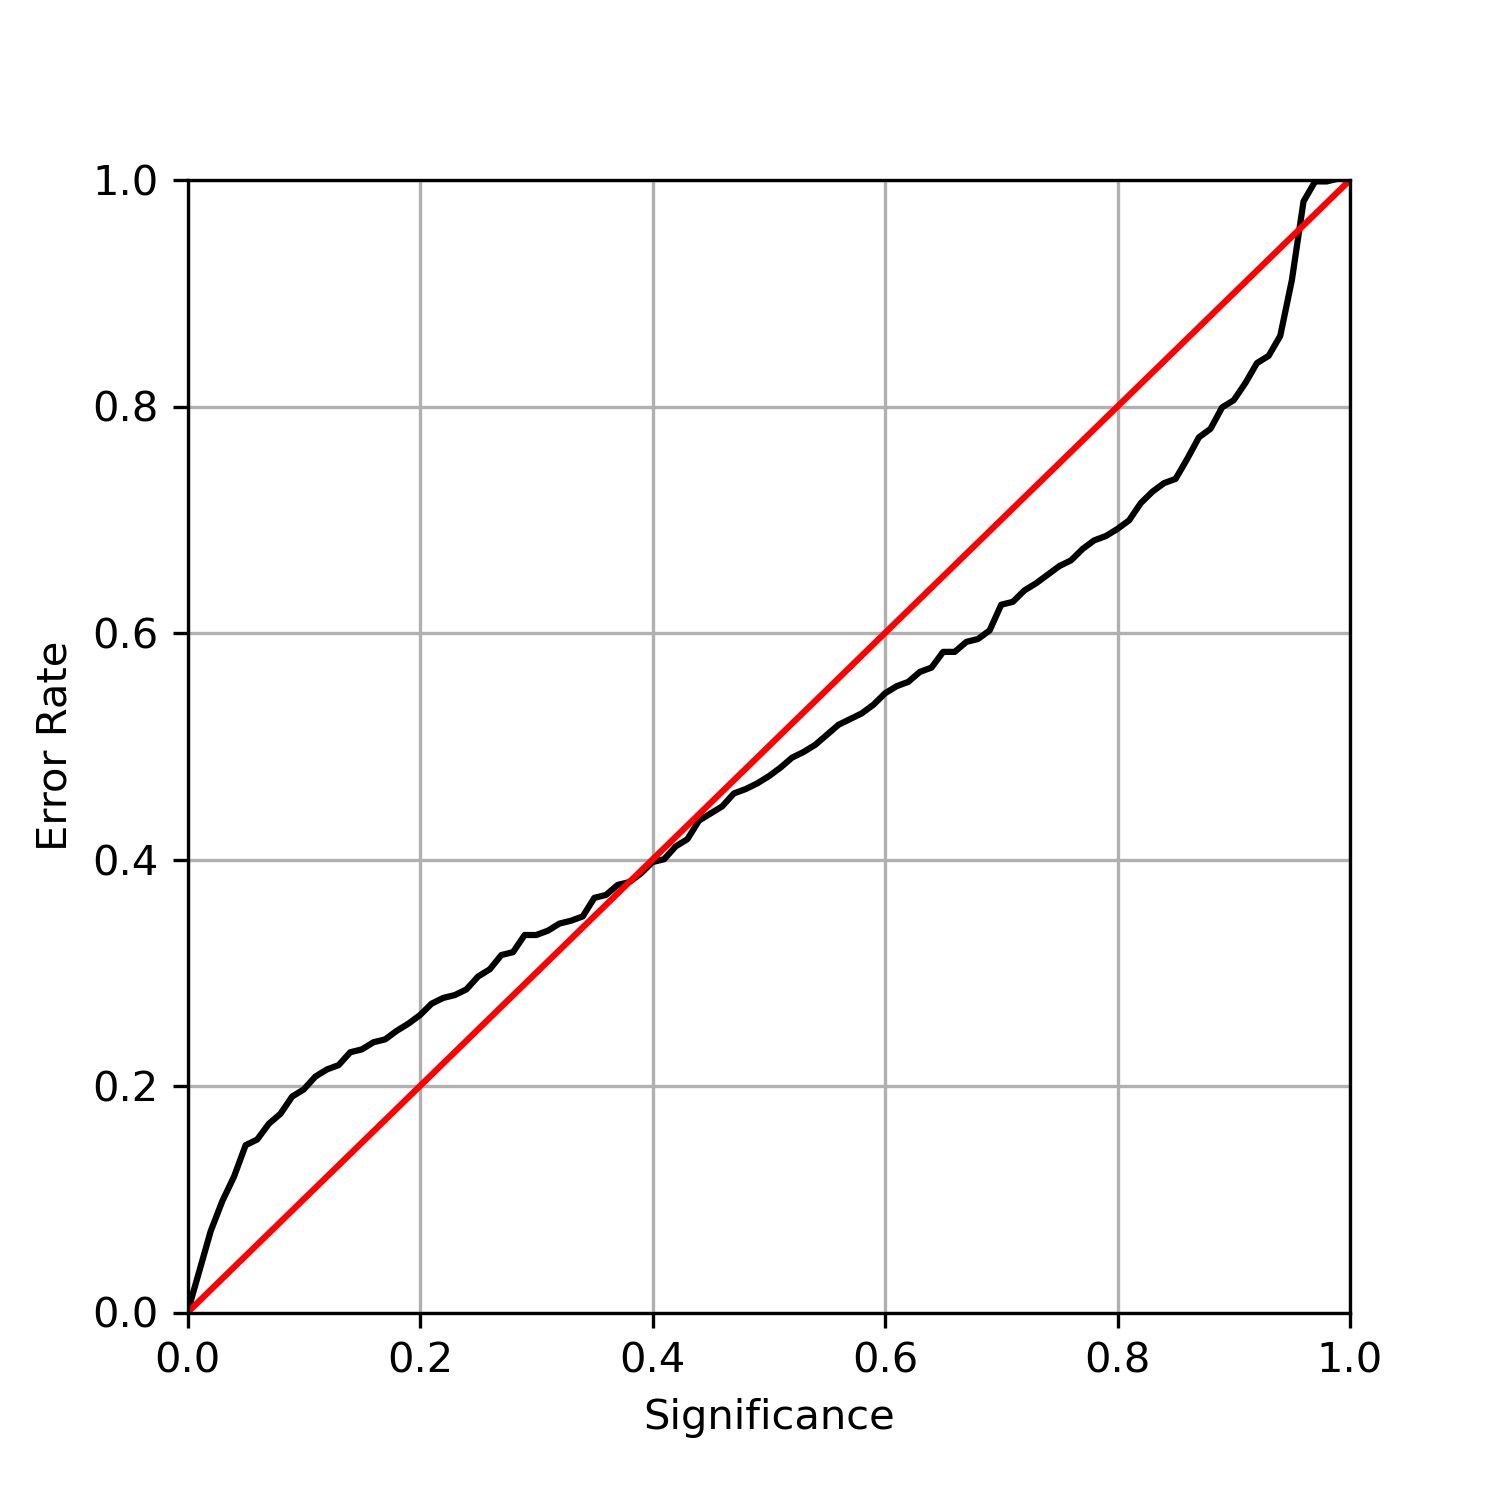
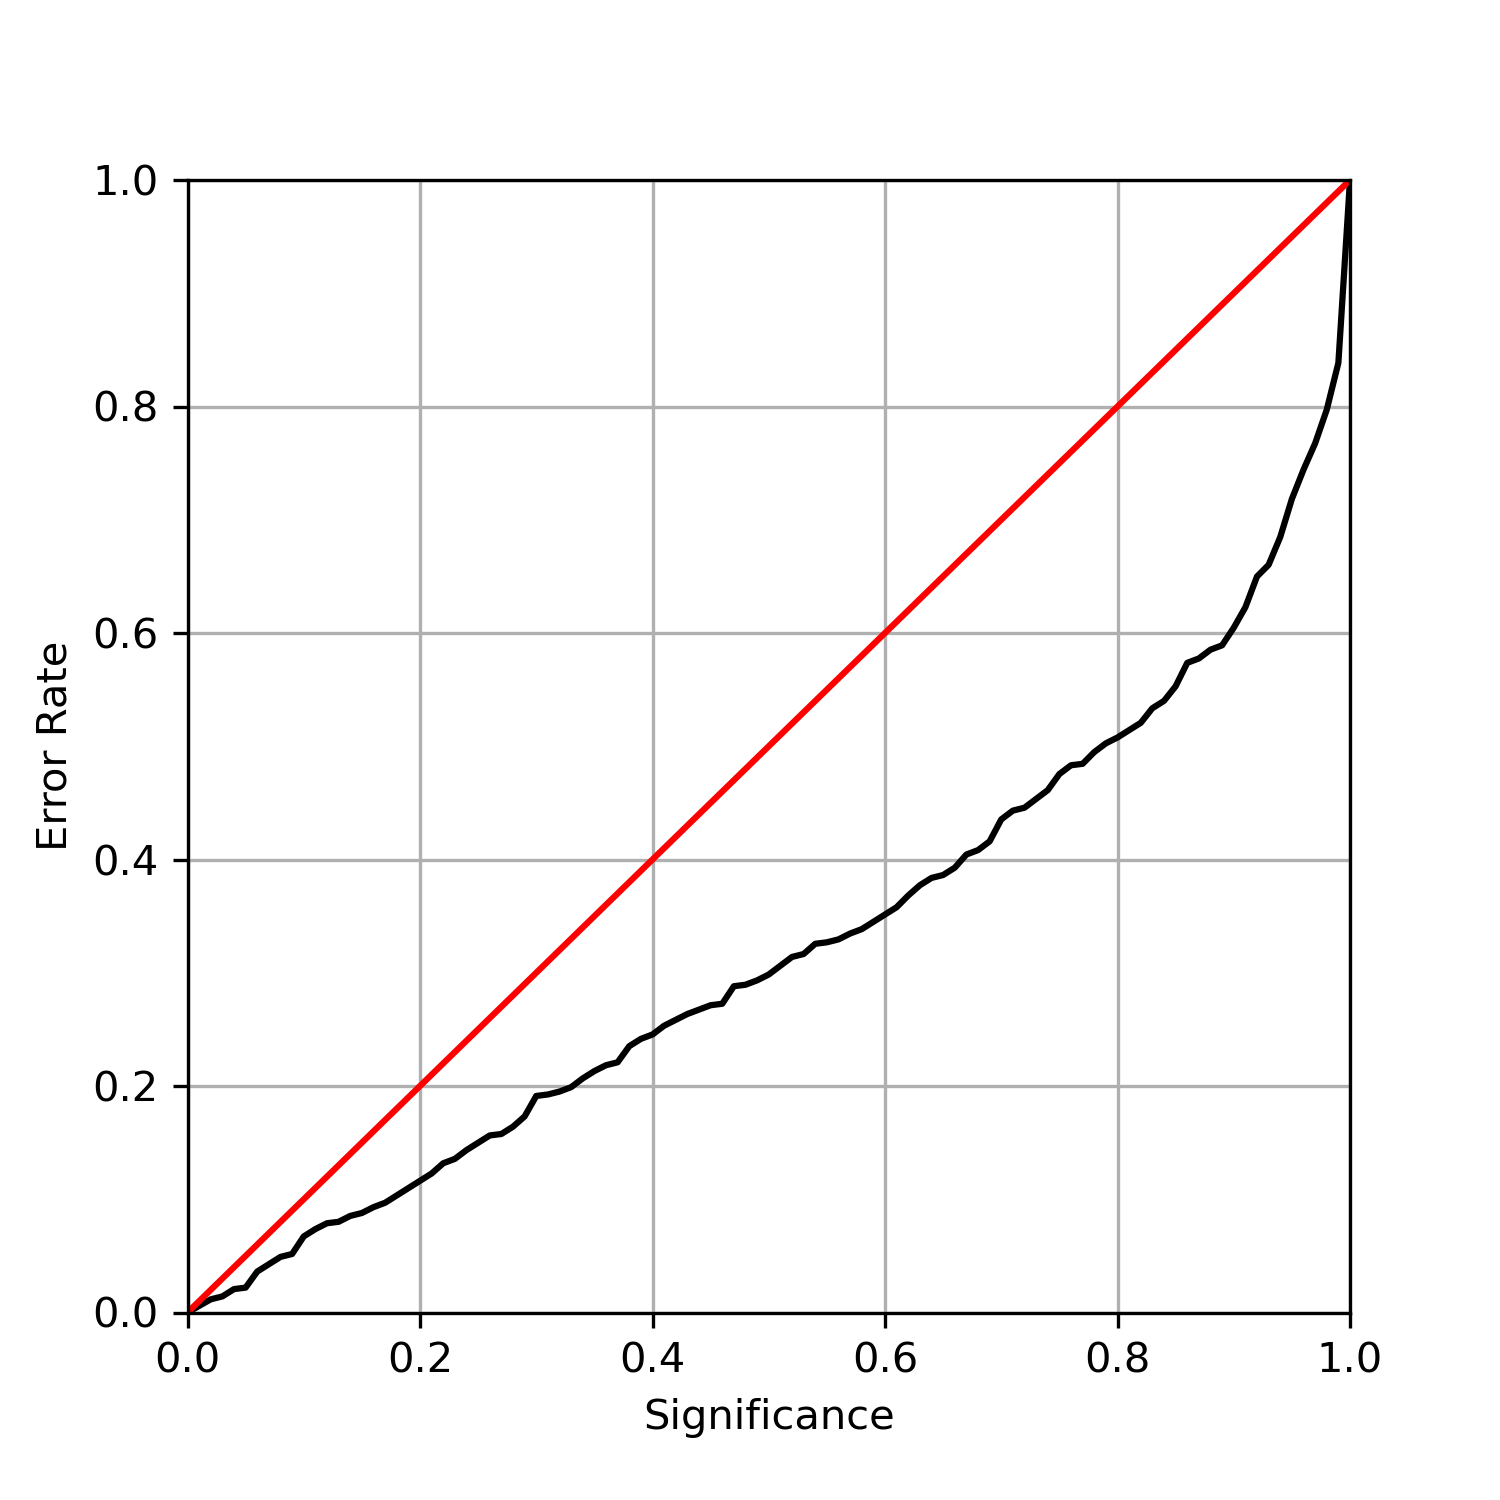
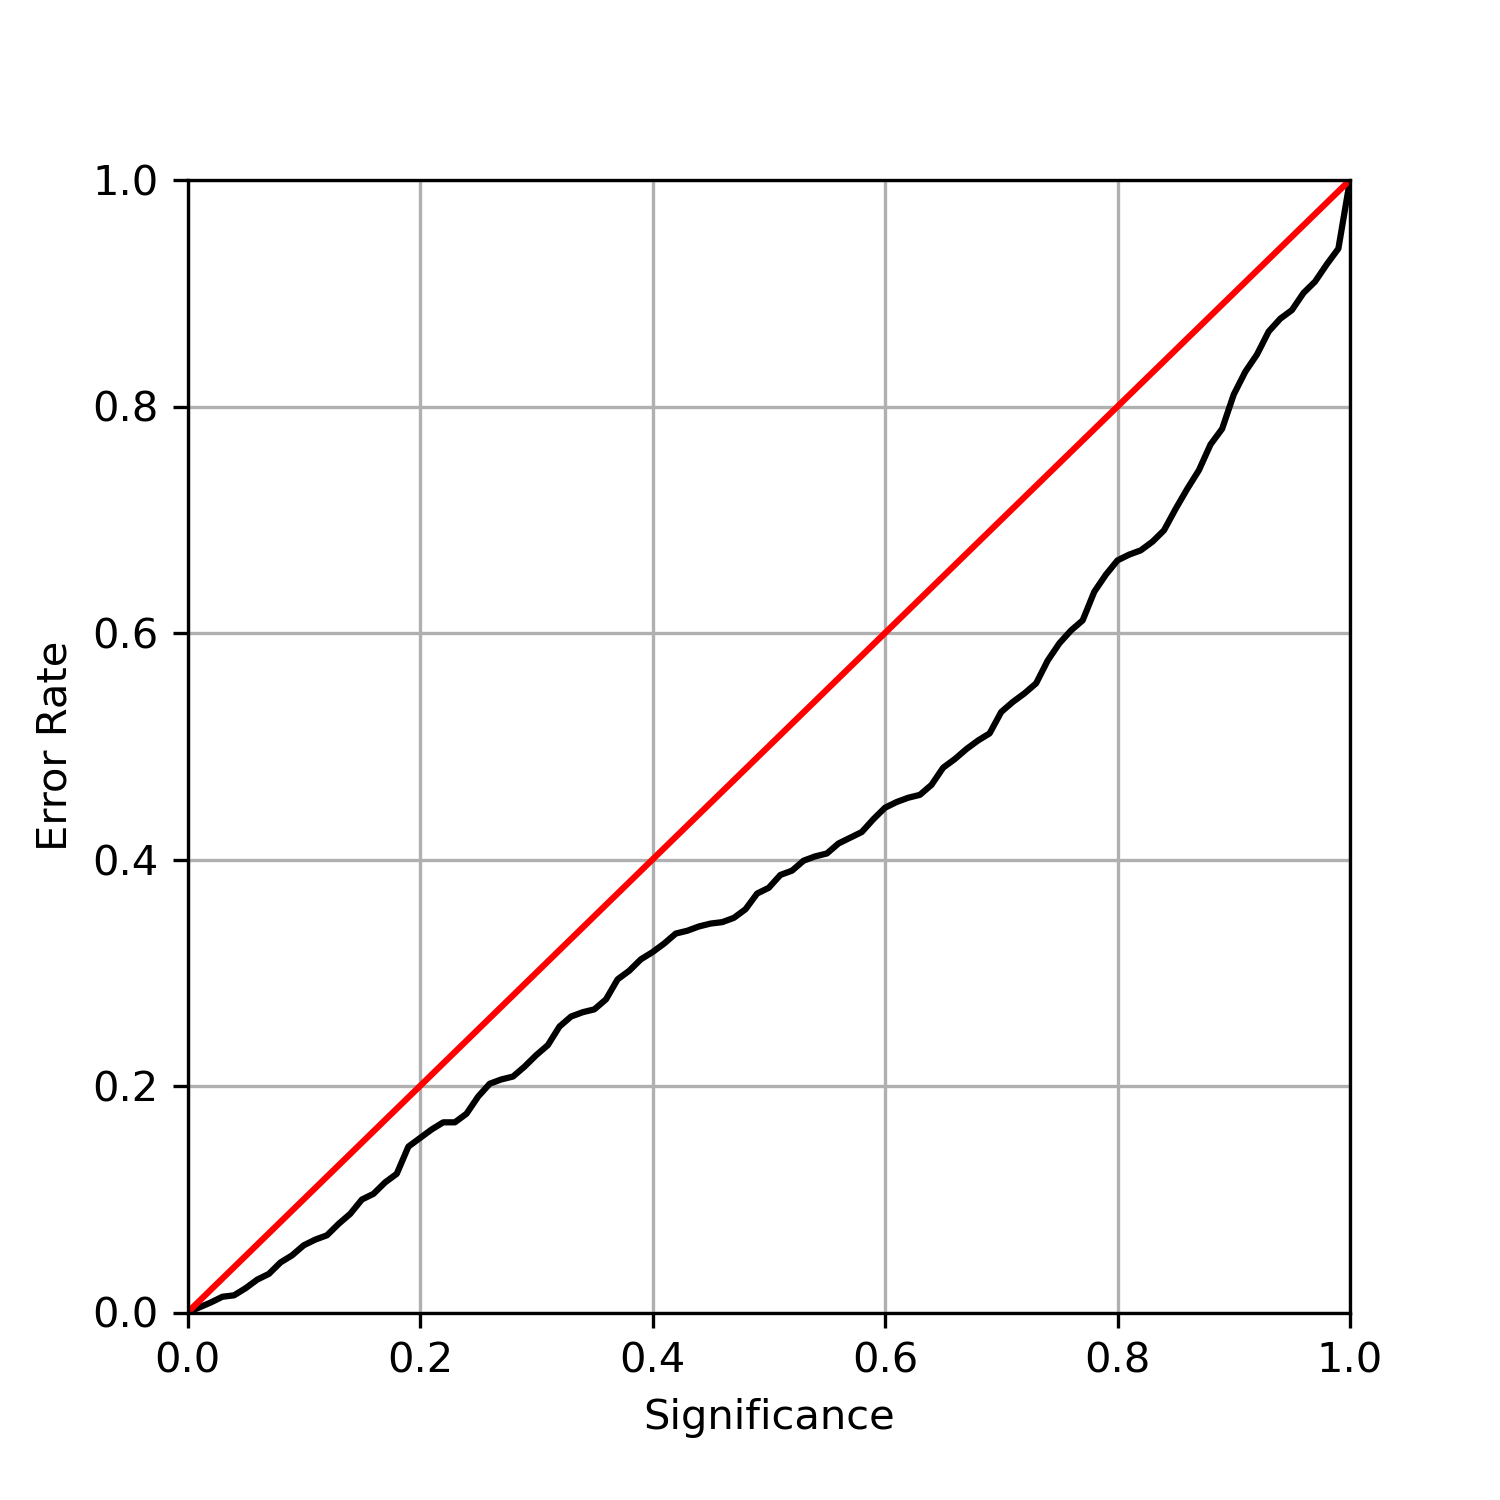
To further look at the coverages, we adopt another recently proposed figure to better show the prediction coverage violations (Olsson et al., 2022). In Figure 10, we show three figures for three simulation scenarios. The x-axis shows the tolerated error rate (the specified significant level), and the y-axis shows the fractions of failed prediction sets (the number of prediction samples where the ground truth label is not in the conformal prediction set). This property holds true in high workload scenarios but not in the baseline scenarios when the significance level is lower than or higher than .
6 Conclusions
In this paper, we investigate the workload prediction problem. We formulate the problem into a time-series dynamic graph classification task with changing graph topologies. We demonstrate the effectiveness of this proposed method from real-world human-in-the-loop air traffic control simulations, in which participants are retired air traffic controllers. We show that traffic density features and traffic conflict features have a positive influence on workload predictions. Algorithm-wise, the graph-structured data-driven learning model outperforms the existing practices in workload prediction research literature (i.e., simple regressions, simple neural networks with handcrafted features).
6.1 Limitations
There are several limitations. Firstly, we only have limited resources to conduct the HITL experiments in a simulation environment. Real-world scenarios can be immensely different from simulation scenarios, with either fewer or more deviations. Secondly, data quality is critical for developing a successful machine-learning algorithm. In this work, we have to use the corrected workload rating data due to the poor quality of the originally collected workload ratings, with only six retired ATCo participants (Lieber, 2020). Another critical part is modeling the different ATC strategies adopted by different controllers, which can result in a multi-modal machine learning setup. The benefit of including ATCo strategies has also been discussed in the literature (Loft et al., 2007). Lastly, better algorithm development can help with improved workload prediction performance. The single prediction label made by either EGCU-O or EGCU-H can be improved, despite the data quality issue.
6.2 Insights
This work is beneficial for the non-intrusive, uninterrupted executive controller workload prediction, and it is purely based on the flight traffic data. First, we show that both traffic density and traffic conflict features contribute to higher prediction accuracy. Then, we show that model of the spatiotemporal airspace layout as a dynamic time-series graph learning problem has great potential for ATC workload level predictions. Additionally, we explore the possibility of further accuracy improvement by introducing a post-hoc classification score processing process, namely conformal prediction, which can be used to generate multiple classification labels adaptively.
Based on these insights, we propose several research directions that might be interesting to researchers,
-
1.
We are expecting a significant performance improvement by conducting more HITL simulations or real-world ATC experiments, collecting additional high-quality data, and data-driven model refinement. Spatiotemporal graph learning is a popular theoretical research direction, and better graph learning model architecture is expected, which results in better workload prediction performances.
-
2.
The window function setup for input-output data matching is flexible for any practical requirement in the real world. The length of the window determines the history length to be considered, while the stride size defines the prediction horizon.
-
3.
The workload prediction problem formulation can be alternated from workload rating classification to workload rating regression task. This setup is algorithm-wise more reasonable for uncertainty calibration with conformal prediction but requires significant experiment setup change. For instance, the current rating-based question prob in modified SWAT and NASA TLX will be modified to continuous variables. A considerable modification of the HITL simulations is desired.
-
4.
There are still several important questions that remain unanswered, such as how to incorporate real-time data and feedback into the prediction model and how to adapt the model to different types of air traffic control systems. Future research in this area could also explore the impact of other factors, such as weather conditions and aircraft type, on controller workload and safety.
-
5.
Several works of literature quires the validity of only using traffic-related factors to predict mental workload, where a significant part of pilot-controller interactions and feedback are missing (Loft et al., 2007). In further studies, we propose to build a predictive model that can consider reciprocal feedback interactions (i.e., the communication deviations (Djokic et al., 2010) in Section 3) from a learning perspective.
-
6.
Further studies can also combine trajectory prediction models such that the task demands can be predicted first and then perform workload forecast in real-time. In such a way, either deterministic or probabilistic trajectory prediction models can act as moderators of workload models (Corver et al., 2016; Pang et al., 2019, 2021, 2022).
We believe the above discussions have practical implications for aviation authorities, airlines, and air traffic management providers. Specifically, our workload prediction model could be used to inform scheduling and staffing decisions, optimize resource allocation, and support proactive safety management. However, it is important to note that successfully implementing such interventions will require collaboration and communication across stakeholders.
Acknowledgment
The research reported in this paper was supported by funds from NASA University Leadership Initiative program (Contract No. NNX17AJ86A, PI: Yongming Liu, Technical Officer: Anupa Bajwa). The support is gratefully acknowledged.
References
- Abbass et al. (2014) Abbass, H.A., Tang, J., Amin, R., Ellejmi, M., Kirby, S., 2014. Augmented cognition using real-time eeg-based adaptive strategies for air traffic control, in: Proceedings of the human factors and ergonomics society annual meeting, SAGE Publications Sage CA: Los Angeles, CA. pp. 230–234.
- Alvarsson et al. (2021) Alvarsson, J., McShane, S.A., Norinder, U., Spjuth, O., 2021. Predicting with confidence: using conformal prediction in drug discovery. Journal of Pharmaceutical Sciences 110, 42–49.
- Angelopoulos et al. (2020) Angelopoulos, A., Bates, S., Malik, J., Jordan, M.I., 2020. Uncertainty sets for image classifiers using conformal prediction. arXiv preprint arXiv:2009.14193 .
- Angelopoulos and Bates (2021) Angelopoulos, A.N., Bates, S., 2021. A gentle introduction to conformal prediction and distribution-free uncertainty quantification. arXiv preprint arXiv:2107.07511 .
- Angelopoulos et al. (2022) Angelopoulos, A.N., Bates, S., Fisch, A., Lei, L., Schuster, T., 2022. Conformal risk control. arXiv preprint arXiv:2208.02814 .
- Aricò et al. (2016) Aricò, P., Borghini, G., Di Flumeri, G., Colosimo, A., Bonelli, S., Golfetti, A., Pozzi, S., Imbert, J.P., Granger, G., Benhacene, R., et al., 2016. Adaptive automation triggered by eeg-based mental workload index: a passive brain-computer interface application in realistic air traffic control environment. Frontiers in human neuroscience 10, 539.
- Balasubramanian et al. (2014) Balasubramanian, V., Ho, S.S., Vovk, V., 2014. Conformal prediction for reliable machine learning: theory, adaptations and applications. Newnes.
- Berghoff et al. (2021) Berghoff, C., Neu, M., von Twickel, A., 2021. The interplay of ai and biometrics: Challenges and opportunities. Computer 54, 80–85.
- Board. (2001) Board., N.T.S., 2001. Annual review of aircraft accident data, us air carrier operations: Calendar year 2001 (rep. no. arc-06–01).
- Chatterji and Sridhar (2001) Chatterji, G., Sridhar, B., 2001. Measures for air traffic controller workload prediction, in: 1st AIAA, aircraft, technology Integration, and operations Forum, p. 5242.
- Chatterji and Sridhar (1999) Chatterji, G.B., Sridhar, B., 1999. Neural network based air traffic controller workload prediction, in: Proceedings of the 1999 American Control Conference (Cat. No. 99CH36251), IEEE. pp. 2620–2624.
- Cooke et al. (2017) Cooke, N.J., Gorman, J.C., Kiekel, P.A., 2017. Communication as team-level cognitive processing, in: Macrocognition in teams. CRC Press, pp. 51–64.
- Corver et al. (2016) Corver, S.C., Unger, D., Grote, G., 2016. Predicting air traffic controller workload: trajectory uncertainty as the moderator of the indirect effect of traffic density on controller workload through traffic conflict. Human factors 58, 560–573.
- Crump (1979) Crump, J.H., 1979. Review of stress in air traffic control: Its measurement and effects. Aviation, Space, and Environmental Medicine .
- Crutchfield and Rosenberg (2007) Crutchfield, J., Rosenberg, C., 2007. Predicting subjective workload ratings: A comparison and synthesis of operational and theoretical models. Technical Report. FEDERAL AVIATION ADMINISTRATION OKLAHOMA CITY OK CIVIL AEROMEDICAL INST.
- Delahaye and Puechmorel (2000) Delahaye, D., Puechmorel, S., 2000. Air traffic complexity: Towards an intrinsic metric, in: Proceeding of the 3rd USA/Europe Air Traffic Management R and D Seminar.
- Dhief et al. (2020) Dhief, I., Wang, Z., Liang, M., Alam, S., Schultz, M., Delahaye, D., 2020. Predicting aircraft landing time in extended-tma using machine learning methods, in: ICRAT 2020, 9th International Conference for Research in Air Transportation.
- Di Stasi et al. (2010) Di Stasi, L.L., Marchitto, M., Antolí, A., Baccino, T., Cañas, J.J., 2010. Approximation of on-line mental workload index in atc simulated multitasks. Journal of Air Transport Management 16, 330–333.
- Djokic et al. (2010) Djokic, J., Lorenz, B., Fricke, H., 2010. Air traffic control complexity as workload driver. Transportation research part C: emerging technologies 18, 930–936.
- Durso and Alexander (2010) Durso, F.T., Alexander, A.L., 2010. Managing workload, performance, and situation awareness in aviation systems, in: Human factors in aviation. Elsevier, pp. 217–247.
- EASA (2021) EASA, 2021. Easa concept paper: Artificial intelligence roadmap: A human-centric approach to ai in aviation. https://www.easa.europa.eu/en/downloads/109668/en Accessed: 3-20-2023.
- EASA (2023) EASA, 2023. Easa concept paper: First usable guidance for level 1&2 machine learning applications: A deliverable of the easa ai roadmap. https://www.easa.europa.eu/en/downloads/137631/en Accessed: 3-20-2023.
- Eckmann et al. (1995) Eckmann, J.P., Kamphorst, S.O., Ruelle, D., et al., 1995. Recurrence plots of dynamical systems. World Scientific Series on Nonlinear Science Series A 16, 441–446.
- Edwards et al. (2017) Edwards, T., Martin, L., Bienert, N., Mercer, J., 2017. The relationship between workload and performance in air traffic control: exploring the influence of levels of automation and variation in task demand, in: Human Mental Workload: Models and Applications: First International Symposium, H-WORKLOAD 2017, Dublin, Ireland, June 28-30, 2017, Revised Selected Papers 1, Springer. pp. 120–139.
- Edwards et al. (2012) Edwards, T., Sharples, S., Wilson, J.R., Kirwan, B., 2012. Factor interaction influences on human performance in air traffic control: The need for a multifactorial model. Work 41, 159–166.
- FAA (2020) FAA, 2020. Air traffic by the numbers. https://www.faa.gov/air_traffic/by_the_numbers/media/Air_Traffic_by_the_Numbers_2020.pdf.
- Fraccone et al. (2011) Fraccone, G.C., Volovoi, V., Colón, A.E., Blake, M., 2011. Novel air traffic procedures: investigation of off-nominal scenarios and potential hazards. Journal of Aircraft 48, 127–140.
- Gianazza (2010) Gianazza, D., 2010. Forecasting workload and airspace configuration with neural networks and tree search methods. Artificial intelligence 174, 530–549.
- Gianazza (2017) Gianazza, D., 2017. Learning air traffic controller workload from past sector operations, in: ATM Seminar, 12th USA/Europe Air Traffic Management R&D Seminar.
- Gianazza and Guittet (2006) Gianazza, D., Guittet, K., 2006. Selection and evaluation of air traffic complexity metrics, in: 2006 ieee/aiaa 25TH Digital Avionics Systems Conference, IEEE. pp. 1–12.
- Gopher and Donchin (1986) Gopher, D., Donchin, E., 1986. Workload: An examination of the concept. .
- Gorman et al. (2003) Gorman, J.C., Foltz, P.W., Kiekel, P.A., Martin, M.J., Cooke, N.J., 2003. Evaluation of latent semantic analysis-based measures of team communications content, in: Proceedings of the Human Factors and Ergonomics Society annual meeting, Sage Publications Sage CA: Los Angeles, CA. pp. 424–428.
- Hah et al. (2006) Hah, S., Willems, B., Phillips, R., 2006. The effect of air traffic increase on controller workload, in: Proceedings of the Human Factors and Ergonomics Society Annual Meeting, SAGE Publications Sage CA: Los Angeles, CA. pp. 50–54.
- Hancock and Meshkati (1988) Hancock, P.A., Meshkati, N., 1988. Human mental workload. North-Holland Amsterdam.
- Hart (2006) Hart, S.G., 2006. Nasa-task load index (nasa-tlx); 20 years later, in: Proceedings of the human factors and ergonomics society annual meeting, Sage publications Sage CA: Los Angeles, CA. pp. 904–908.
- Hart and Staveland (1988) Hart, S.G., Staveland, L.E., 1988. Development of nasa-tlx (task load index): Results of empirical and theoretical research, in: Advances in psychology. Elsevier. volume 52, pp. 139–183.
- Heng et al. (2022) Heng, Y., Wu, M., Wen, X., et al., 2022. Identifying key risk factors in air traffic controller workload by seir model. Mathematical Problems in Engineering 2022.
- Hilburn (2004) Hilburn, B., 2004. Cognitive complexity in air traffic control: A literature review. EEC note 4, 1–80.
- Hilburn and Flynn (2004) Hilburn, B., Flynn, G., 2004. Toward a non-linear approach to modeling air traffic complexity, in: 2nd Human Performance Situation Awareness and Automation Conference.
- Histon et al. (2002) Histon, J.M., Hansman, R.J., Aigoin, G., Delahaye, D., Puechmorel, S., 2002. Introducing structural considerations into complexity metrics. Air Traffic Control Quarterly 10, 115–130.
- Kallus et al. (1999) Kallus, K., Van Damme, D., Dittman, A., 1999. Integrated job and task analysis of air traffic controllers: Phase 2. Task analysis of en-route controllers (European Air Traffic Management Programme Rep. No. HUM. ET1. ST01. 1000-REP-04). EUROCONTROL, Brussels, Belgium .
- Kantz (1994) Kantz, H., 1994. Quantifying the closeness of fractal measures. Physical Review E 49, 5091.
- Kipf and Welling (2016) Kipf, T.N., Welling, M., 2016. Semi-supervised classification with graph convolutional networks. arXiv preprint arXiv:1609.02907 .
- Kirwan et al. (2001) Kirwan, B., Scaife, R., Kennedy, R., 2001. Investigating complexity factors in uk air traffic management. Human Factors and Aerospace Safety 1.
- Knorr and Walter (2011) Knorr, D., Walter, L., 2011. Trajectory uncertainty and the impact on sector complexity and workload. SESAR Innovation Days 29.
- Koebbe and Mayer-Kress (1992) Koebbe, M., Mayer-Kress, G., 1992. Use of recurrence plots in the analysis of time-series data, in: SANTA FE INSTITUTE STUDIES IN THE SCIENCES OF COMPLEXITY-PROCEEDINGS VOLUME-, Citeseer. pp. 361–361.
- Kopardekar and Magyarits (2003) Kopardekar, P., Magyarits, S., 2003. Measurement and prediction of dynamic density, in: Proceedings of the 5th usa/europe air traffic management r & d seminar.
- Lei and Wasserman (2014) Lei, J., Wasserman, L., 2014. Distribution-free prediction bands for non-parametric regression. Journal of the Royal Statistical Society: Series B: Statistical Methodology , 71–96.
- Li et al. (2019a) Li, F., Lee, C.H., Chen, C.H., Khoo, L.P., 2019a. Hybrid data-driven vigilance model in traffic control center using eye-tracking data and context data. Advanced Engineering Informatics 42, 100940.
- Li et al. (2019b) Li, X., Ying, X., Chuah, M.C., 2019b. Grip: Graph-based interaction-aware trajectory prediction, in: 2019 IEEE Intelligent Transportation Systems Conference (ITSC), IEEE. pp. 3960–3966.
- Liang et al. (2020) Liang, Y., Samtani, S., Guo, B., Yu, Z., 2020. Behavioral biometrics for continuous authentication in the internet-of-things era: An artificial intelligence perspective. IEEE Internet of Things Journal 7, 9128–9143.
- Lieber (2020) Lieber, C., 2020. Communications Between Air Traffic Controllers and Pilots During Simulated Arrivals: Relation of Closed Loop Communication Deviations to Loss of Separation. Ph.D. thesis. Arizona State University.
- Lieber et al. (2021) Lieber, C.S., Demir, M., Cooke, N., Ligda, S., 2021. Deviations in closed loop communications between air traffic controllers and pilots as a predictor of loss of separation, in: AIAA AVIATION 2021 FORUM, p. 2320.
- Ligda et al. (2019) Ligda, S.V., Seeds, M.L., Harris, M.J., Lieber, C.S., Demir, M., Cooke, N., 2019. Monitoring human performance in real-time for nas safety prognostics, in: AIAA Aviation 2019 Forum, p. 3411.
- Liu and Goebel (2018) Liu, Y., Goebel, K., 2018. Information fusion for national airspace system prognostics: A nasa uli project, in: Proceedings of the 10th Annual Conference of the Prognostics and Health Management Society, PHM, Philadelphia Center City, Philadelphia, PA, USA, pp. 24–27.
- Loft et al. (2007) Loft, S., Sanderson, P., Neal, A., Mooij, M., 2007. Modeling and predicting mental workload in en route air traffic control: Critical review and broader implications. Human factors 49, 376–399.
- Lu et al. (2022) Lu, C., Lemay, A., Chang, K., Höbel, K., Kalpathy-Cramer, J., 2022. Fair conformal predictors for applications in medical imaging, in: Proceedings of the AAAI Conference on Artificial Intelligence, pp. 12008–12016.
- Luo et al. (2022) Luo, R., Zhao, S., Kuck, J., Ivanovic, B., Savarese, S., Schmerling, E., Pavone, M., 2022. Sample-efficient safety assurances using conformal prediction, in: Algorithmic Foundations of Robotics XV: Proceedings of the Fifteenth Workshop on the Algorithmic Foundations of Robotics, Springer. pp. 149–169.
- Majumdar and Ochieng (2002) Majumdar, A., Ochieng, W.Y., 2002. Factors affecting air traffic controller workload: Multivariate analysis based on simulation modeling of controller workload. Transportation Research Record 1788, 58–69.
- Manning et al. (2002) Manning, C.A., Mills, S.H., Fox, C.M., Pfleiderer, E.M., Mogilka, H.J., 2002. Using air traffic control taskload measures and communication events to predict subjective workload. Technical Report. FEDERAL AVIATION ADMINISTRATION OKLAHOMA CITY OK CIVIL AEROMEDICAL INST.
- Marwan et al. (2007a) Marwan, N., Carmen Romano, M., Thiel, M., Kurths, J., 2007a. Recurrence plots for the analysis of complex systems. Physics Reports 438, 237–329. URL: https://www.sciencedirect.com/science/article/pii/S0370157306004066, doi:https://doi.org/10.1016/j.physrep.2006.11.001.
- Marwan et al. (2007b) Marwan, N., Romano, M.C., Thiel, M., Kurths, J., 2007b. Recurrence plots for the analysis of complex systems. Physics reports 438, 237–329.
- Marwan et al. (2002) Marwan, N., Wessel, N., Meyerfeldt, U., Schirdewan, A., Kurths, J., 2002. Recurrence-plot-based measures of complexity and their application to heart-rate-variability data. Physical review E 66, 026702.
- Masalonis et al. (2003) Masalonis, A.J., Callaham, M.B., Wanke, C.R., 2003. Dynamic density and complexity metrics for realtime traffic flow management, in: Proceedings of the 5th USA/Europe Air Traffic Management R & D Seminar, Budapest, Hungary. p. 139.
- Mindlin and Gilmore (1992) Mindlin, G.M., Gilmore, R., 1992. Topological analysis and synthesis of chaotic time series. Physica D: Nonlinear Phenomena 58, 229–242.
- Mogford et al. (1995) Mogford, R.H., Guttman, J., Morrow, S., Kopardekar, P., 1995. The complexity construct in air traffic control: A review and synthesis of the literature. .
- Mohamed et al. (2020) Mohamed, A., Qian, K., Elhoseiny, M., Claudel, C., 2020. Social-stgcnn: A social spatio-temporal graph convolutional neural network for human trajectory prediction, in: Proceedings of the IEEE/CVF Conference on Computer Vision and Pattern Recognition, pp. 14424–14432.
- Nachreiner et al. (2006) Nachreiner, F., Nickel, P., Meyer, I., 2006. Human factors in process control systems: The design of human–machine interfaces. Safety Science 44, 5–26.
- Olsson et al. (2022) Olsson, H., Kartasalo, K., Mulliqi, N., Capuccini, M., Ruusuvuori, P., Samaratunga, H., Delahunt, B., Lindskog, C., Janssen, E.A., Blilie, A., et al., 2022. Estimating diagnostic uncertainty in artificial intelligence assisted pathology using conformal prediction. Nature communications 13, 7761.
- Pang et al. (2019) Pang, Y., Yao, H., Hu, J., Liu, Y., 2019. A recurrent neural network approach for aircraft trajectory prediction with weather features from sherlock, in: AIAA Aviation 2019 Forum, p. 3413.
- Pang et al. (2022) Pang, Y., Zhao, X., Hu, J., Yan, H., Liu, Y., 2022. Bayesian spatio-temporal graph transformer network (b-star) for multi-aircraft trajectory prediction. Knowledge-Based Systems 249, 108998.
- Pang et al. (2021) Pang, Y., Zhao, X., Yan, H., Liu, Y., 2021. Data-driven trajectory prediction with weather uncertainties: A bayesian deep learning approach. Transportation Research Part C: Emerging Technologies 130, 103326.
- Papadopoulos et al. (2002) Papadopoulos, H., Proedrou, K., Vovk, V., Gammerman, A., 2002. Inductive confidence machines for regression, in: Machine Learning: ECML 2002: 13th European Conference on Machine Learning Helsinki, Finland, August 19–23, 2002 Proceedings 13, Springer. pp. 345–356.
- Pareja et al. (2020) Pareja, A., Domeniconi, G., Chen, J., Ma, T., Suzumura, T., Kanezashi, H., Kaler, T., Schardl, T., Leiserson, C., 2020. Evolvegcn: Evolving graph convolutional networks for dynamic graphs, in: Proceedings of the AAAI conference on artificial intelligence, pp. 5363–5370.
- Pham et al. (2020) Pham, D.T., Alam, S., Duong, V., 2020. An air traffic controller action extraction-prediction model using machine learning approach. Complexity 2020, 1–19.
- Regulations (2017) Regulations, F.A., 2017. Title 14-aeronautics and space. US government Printing Office, Washington, USA .
- Reid and Nygren (1988) Reid, G.B., Nygren, T.E., 1988. The subjective workload assessment technique: A scaling procedure for measuring mental workload, in: Advances in psychology. Elsevier. volume 52, pp. 185–218.
- Romano et al. (2020) Romano, Y., Sesia, M., Candes, E., 2020. Classification with valid and adaptive coverage. Advances in Neural Information Processing Systems 33, 3581–3591.
- Rose et al. (1978) Rose, R.M., Jenkins, C.D., Hurst, M.W., et al., 1978. Air traffic controller health change study: a prospective investigation of physical, psychological and work-related changes. Technical Report. Civil Aerospace Medical Institute.
- Sadinle et al. (2019) Sadinle, M., Lei, J., Wasserman, L., 2019. Least ambiguous set-valued classifiers with bounded error levels. Journal of the American Statistical Association 114, 223–234.
- Salas and Fiore (2004) Salas, E.E., Fiore, S.M., 2004. Team cognition: Understanding the factors that drive process and performance. American Psychological Association.
- Sharma et al. (2022) Sharma, K., Iyer, H., Pant, R., 2022. Cognitive ability criterion for expertise in air traffic control task, in: AIAA SCITECH 2022 Forum, p. 2449.
- Sheridan et al. (2002) Sheridan, T.B., Sheridan, T.B., Maschinenbauingenieur, K., Sheridan, T.B., Sheridan, T.B., 2002. Humans and automation: System design and research issues. volume 280. Human Factors and Ergonomics Society Santa Monica, CA.
- Sridhar et al. (1998) Sridhar, B., Sheth, K.S., Grabbe, S., 1998. Airspace complexity and its application in air traffic management, in: 2nd USA/Europe Air Traffic Management R&D Seminar, Federal Aviation Administration Washington, DC. pp. 1–6.
- Taha and Hanbury (2015) Taha, A.A., Hanbury, A., 2015. Metrics for evaluating 3d medical image segmentation: analysis, selection, and tool. BMC medical imaging 15, 1–28.
- Tobaruela et al. (2014) Tobaruela, G., Schuster, W., Majumdar, A., Ochieng, W.Y., Martinez, L., Hendrickx, P., 2014. A method to estimate air traffic controller mental workload based on traffic clearances. Journal of Air Transport Management 39, 59–71.
- Trapsilawati et al. (2020) Trapsilawati, F., Herliansyah, M.K., Nugraheni, A.S.A.N.S., Fatikasari, M.P., Tissamodie, G., 2020. Eeg-based analysis of air traffic conflict: Investigating controllers’ situation awareness, stress level and brain activity during conflict resolution. The Journal of Navigation 73, 678–696.
- Vogt et al. (2006) Vogt, J., Hagemann, T., Kastner, M., 2006. The impact of workload on heart rate and blood pressure in en-route and tower air traffic control. Journal of psychophysiology 20, 297–314.
- Vovk et al. (1999) Vovk, V., Gammerman, A., Saunders, C., 1999. Machine-learning applications of algorithmic randomness .
- Vovk et al. (2005) Vovk, V., Gammerman, A., Shafer, G., 2005. Algorithmic learning in a random world. volume 29. Springer.
- Wang et al. (2015) Wang, H., Gong, D., Wen, R., 2015. Air traffic controllers workload forecasting method based on neural network, in: The 27th Chinese control and decision conference (2015 CCDC), IEEE. pp. 2460–2463.
- Webber Jr and Zbilut (1994) Webber Jr, C.L., Zbilut, J.P., 1994. Dynamical assessment of physiological systems and states using recurrence plot strategies. Journal of applied physiology 76, 965–973.
- Wee et al. (2019) Wee, H.J., Lye, S.W., Pinheiro, J.P., 2019. An integrated highly synchronous, high resolution, real time eye tracking system for dynamic flight movement. Advanced Engineering Informatics 41, 100919.
- Wickens et al. (2009) Wickens, C.D., Hooey, B.L., Gore, B.F., Sebok, A., Koenicke, C.S., 2009. Identifying black swans in nextgen: Predicting human performance in off-nominal conditions. Human Factors 51, 638–651.
- Xiong et al. (2023) Xiong, R., Wang, Y., Tang, P., Cooke, N.J., Ligda, S.V., Lieber, C.S., Liu, Y., 2023. Predicting separation errors of air traffic controllers through integrated sequence analysis of multimodal behaviour indicators. Advanced Engineering Informatics 55, 101894.
- Zbilut and Webber Jr (1992) Zbilut, J.P., Webber Jr, C.L., 1992. Embeddings and delays as derived from quantification of recurrence plots. Physics letters A 171, 199–203.