Measuring Online Emotional Reactions to Offline Events
Abstract
The rich and dynamic information environment on social media provides researchers, policy makers, and entrepreneurs with opportunities to learn about social phenomena in a timely manner. However, using this data to understand human affect and behavior poses multiple challenges, such as heterogeneity of topics and events discussed in the highly dynamic online information environment. To address these challenges, we present a methodology for systematically detecting and measuring emotional reactions to offline events using change point detection on the time series of collective affect, and further explaining these reactions using a transformer-based topic model. We demonstrate the utility of the methodology on a corpus of tweets collected from a large US metropolitan area between January and August, 2020, covering a period of great social change, including the COVID-19 pandemic and racial justice protests. We demonstrate that our method is able to disaggregate topics to measure population’s emotional and moral reactions to events. This capability allows for better monitoring of population’s reactions to offline events using online data.
Index Terms:
emotional reaction, social media data, change point detection, topic modelingI Introduction
Social media platforms connect billions of people worldwide, enabling them to exchange information and opinions, express emotions [1, 2], and to respond to others [3, 4]. Researchers, policy makers, and entrepreneurs have grown interested in learning what the unfettered exchange of information reveals about current social conditions [5, 6]. Social scientists rely on social media data to track public opinion on socially important issues [7, 8], monitor the well-being of populations at an unprecedented spatial scale and temporal resolution [9, 2], and investigate the psychology of hard-to-reach groups [10].
Using social media data to learn about human behavior, however, poses significant challenges. Social media represents a heterogeneous, highly dynamic information environment where some topics are widely discussed while others are barely mentioned [11]. It includes people’s self-reports of their own lives, as well as their reactions to a continuous stream of external events. Researchers have developed methods to track shifts in discussion topics in response to events [12] and even detect events from online discussions [13, 14]. However, social media data provides evidence for learning about human behavior beyond shifts in topics. For example, it can also shed light on human affect, emotions, and morality, important drivers of individual attitudes, beliefs, psychological well-being, and social interactions [15, 16, 17, 18]. To study the collective affect, some works investigated emotional engagement with news [19, 20], while others studied collective reactions to specific types of events, such as elections [21] or natural disasters [22]. These works, however, leave a gap in our understanding of collective emotional reactions to a broad spectrum of socio-political events, which could shed light on opinion dynamics, emergence of polarization emergence, and even help identify online influence campaigns.
To bridge these gaps, we present a methodology for detecting, measuring and explaining the collective emotional reactions to offline events. Using state-of-the-art transformer-based models, we construct the time series of aggregate affect from social media posts. We detect emotional reactions as discontinuities in these time series, and then explain the associated offline events using topic modeling.
We demonstrate the utility of the methodology on a corpus of tweets collected from a large US metropolitan area between January and August, 2020. This time span represents a complex period in American history with important social, political and cultural changes. We successfully detect the simultaneous crises of the COVID-19 pandemic and racial justice reckoning, and other important events like political primaries. We show how these developments had profound impact on the psychological state of the population in our data. For example, as the COVID-19 pandemic began to unfold, people expressed more anger, significantly more fear, and more moral sentiments like care and authority. Furthermore, we disaggregate COVID-related tweets by topic to more accurately measure how a population’s emotions and moral sentiments change regarding different subtopics. We identify stronger reactions to daily-life issues, such as grocery panics and leisure activities, than topics directly mentioning the Coronavirus.
Our results suggest that studying the collective emotional reactions on social media can provide valuable insights into understanding people’s opinions and responses to timely socio-political events, and aid policy makers in crafting messages that align with the values and concerns of the population.
II Related Works
Event Detection: With the rich and dynamic information on social media that is tightly related to offline events, researchers have developed methods for event detection on online platforms, including topic detection techniques such as Latent Dirichlet Allocation (LDA) [23] and Topic2Vec [24], clustering documents based on their textual similarity [25], studying term co-occurrence and performing term frequency analysis [13] and detecting bursty terms [25, 14]. Recent methods also incorporate deep learning techniques [26, 27]. Although these methods help detect events from social media data, we also want to understand the dynamics of emotions and moral sentiments in the aggregate online population, as opinions and emotions expressed online have a complex interplay that can impact and manifest in offline behaviors.
Sentiments and Emotions: Early research on quantifying online emotions relied on dictionary-based approaches to measure sentiment of messages by counting the occurrences of positive or negative words [1, 28]. Researchers found that the sentiment of tweets in aggregate revealed hourly, diurnal and weekly patterns of mood variations [1, 9]. Some studies demonstrated the feasibility of monitoring subjective wellbeing of populations [2] at unprecedented temporal scale and resolution [29]. Other works used social media sentiment analysis to study user reactions to political campaigns [28], or as an alternative to costly public opinion polls [7], predict stock market prices [30] and results of elections [31].
In terms of studying emotional reactions to offline events, Hauthal et al. [19] used emojis to analyze the online reaction to Brexit. A recent work conducted emotion analysis of user reactions to online news [20], focusing on the relationship among news content, emotions and user engagement reactions. Another study investigates the user reactions to news articles by predict emotional audience reactions before and after publishing the posts [32]. These works utilize user reactions such as comments, likes and shares to pre-defined specific news articles, and they focus more on how social media contents and news articles influence emotional user engagement online.
Different from above studies, we are interested in understanding the online dynamics of emotions and moral sentiments in response to the continuous stream of real-life events, because affect is tightly related to opinions and induces offline actions, providing us valuable information to study human behavior. We incorporate both event detection and emotion analysis techniques to detect, measure and explain emotional and moral reactions on social media.
III Methods and Materials
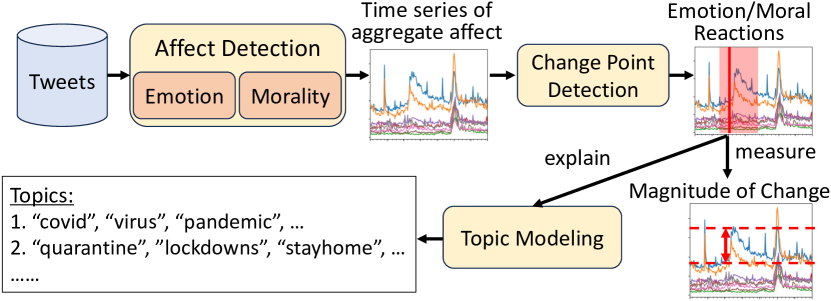
To understand the dynamics of online emotions, we propose a pipeline (Fig. 1) that detects, measures and explains online emotional reactions to offline events. With a set of timestamped texts, such as a collection of tweets, we first perform emotion and morality detection on each tweet. We then calculate the daily fractions of tweets with each emotion and moral category to construct the time series of the aggregate affect. Next, to detect reactions, i.e., changes in affect in response to offline events, we perform change point detection on each emotion and morality time series. We measure the magnitude of the change at each detected change point and perform topic modeling to explain what offline event triggered the specific online reaction.
III-A Data
The data used in this study was collected using Twitter’s Filter API by specifying a geographic bounding box over a large metropolitan area. This method collects every tweet that is either geotagged within the bounding box (using the device’s coordinates with the user’s permission), or by using the Twitter “place” feature, where the user tags their location with a point of interest in a large US metropolitan area. The data was collected in real time, with the crawler operating during the entirety of the analysis period. We collected 16,912,165 tweets from 344,638 unique users. While we perform analyses on Twitter data, the proposed pipeline is generalizable to other social media platforms and news.
III-B Emotion and Morality Detection
We first measure emotions and moral sentiments expressed in an individual tweet. For emotion detection, we use a state-of-the-art language model SpanEmo [33], fine-tuned on the SemEval 2018 Task 1e-c [34] dataset. This transformer-based model outperforms prior methods by learning the correlations among the emotions. Given the text of a tweet, the model returns the confidence of each emotion being present in the text. The model can measure a wide range of emotions at scale, including anticipation, joy, love, trust, optimism, anger, disgust, fear, sadness, pessimism and surprise.
In addition to emotions, we also quantify the moral sentiments of tweets using the moral foundations theory [17] along five dimensions, which are related to dislike of suffering (care/harm), dislike of cheating (fairness/cheating), group loyalty (loyalty/betrayal), respect of authority and tradition (authority/subversion), and concerns with purity and contamination (purity/degradation). We use the transformer-based pretrained language model BERT [35], and train it with a large amount of data from different sources, including the Moral Foundation Twitter Corpus dataset [22], the dataset of political tweets published by US congress members [36], a manually annotated COVID dataset [37], and the Extended Moral Foundations Dictionary data [38]. The large amount and the variety of topics in our training data helps mitigate the data distribution shift when applying the model to our test data [39]. After labeling each tweet with different emotion and moral categories, we calculate the daily fractions of tweets to construct the time series.
We evaluate the effectiveness of emotion and morality detection on a random subset of 850 tweets, which were annotated by five trained annotators. Table I shows the cross-annotator agreement measured by Fleiss’ Kappa, which is comparable to those in prior works [34, 22]. We compare our emotion and morality detection methods with widely used dictionary-based methods, namely keyword matching using Emolex (does not include “love” category) for emotions and Distributed Dictionary Representations (DDR) [40] for morality. Our methods outperforms baselines for most categories (Table I), although the performance inevitably varies with support for different categories, as also observed in previous studies [22, 41]. Despite the variation in model performance, prior research has validated that when aggregating on the collective level, the time series of sentiments constructed with supervised deep learning detection and dictionary-based methods have strong correlations with those from self-reports [42].
| Emotiona/Morality | Fleiss’s Kappa | F1-Score | Support | |
| Baseline | Ours | |||
| anger | 0.49 | 0.28 | 0.45 | 93 |
| anticipation | 0.32 | 0.12 | 0.40 | 43 |
| disgust | 0.46 | 0.33 | 0.53 | 116 |
| fear | 0.22 | 0.00 | 0.37 | 113 |
| joy | 0.48 | 0.25 | 0.37 | 113 |
| love | 0.66 | N/A | 0.71 | 122 |
| optimism | 0.37 | 0.15 | 0.34 | 58 |
| pessimism | 0.26 | 0.20 | 0.08 | 82 |
| sadness | 0.53 | 0.15 | 0.45 | 66 |
| surprise | 0.51 | 0.06 | 0.44 | 33 |
| trust | 0.30 | 0.00 | 0.43 | 22 |
| care | 0.29 | 0.54 | 0.47 | 63 |
| harm | 0.28 | 0.18 | 0.36 | 60 |
| fairness | 0.17 | 0.17 | 0.25 | 10 |
| cheating | 0.28 | 0.20 | 0.43 | 31 |
| loyalty | 0.18 | 0.00 | 0.05 | 8 |
| betrayal | 0.01 | 0.00 | 0.00 | 1 |
| authority | 0.45 | 0.00 | 0.32 | 24 |
| subversion | 0.60 | 0.15 | 0.37 | 78 |
| purity | 0.49 | 0.27 | 0.56 | 35 |
| degradation | 0.22 | 0.21 | 0.33 | 23 |
III-C Change Point Detection
The time series of emotions and moral sentiments reveal the dynamics of aggregate affect on social media, including how people react to social phenomena. We define an emotional reaction as a change point in the corresponding time series. To detect such change points, we combine two popular methods. The first, cumulative sum (CUSUM) method [43], aims to detect a shift of means in a time series. This method is good at detecting change points like the COVID-19 outbreak which shifted the baseline of emotions and moral sentiments. To detect multiple change points, we use the sliding window strategy to scan the whole time series. We set the window size to be four weeks and slide the window with a stride of five days for the best precision and recall. Another type of event, such as Valentine’s Day, which manifests as a sharp, short-lived surge of emotions, can be better detected with Bayesian Online Change Point Detection (BOCPD) [44]. This method uses Bayesian inference to determine if the next data point is improbable, which is good at detecting sudden changes. We combine the results from both CUSUM and BOCPD. As a rule of thumb, we consider a change point to be significant if its confidence is higher than . We perform change point detection separately for each time series of emotion or morality, because different types of events may elicit different reactions.
III-D Measuring the Magnitude of Reactions
For each detected change point, we quantify the magnitude of the collective reaction as percent change before and after it. We compute the baseline level before the change point as the mean of the time series over the two week period before. Then, we measure two types of changes: short-term and long-term changes. To calculate the short-term change, we compare the baseline to the extremum of the time series (peak or dip value) in the two weeks after the change point and compute percent change. To calculate the long-term change, we compare the baseline to the time series value two weeks after the event (we take a five-day average around the two-week mark). The size of the window is chosen to be two weeks so that enough observations are made, but it would not be affected by another event earlier or later.
III-E Topic Modeling
|
Emotion | Event | Topics Before Change Point | Topics After Change Point | |||||||||||||||
| 1 | 2020-05-26 | Betrayal |
|
“president”, “wearing, masks, mask” |
|
||||||||||||||
| 2 | 2020-05-29 | Care |
|
|
|
||||||||||||||
| 3 | 2020-06-01 | Pessimism | Unknown |
|
|
||||||||||||||
| 4 | 2020-07-03 | Joy |
|
|
|
||||||||||||||
We try to explain changes in emotions detected by our method using topic modeling. We choose BERTopic [45], a transformer-based language model that extracts highly coherent topics compared to traditional topic model LDA [46]. We evaluate both methods on a set of 10% randomly selected tweets from our data, using a different numbers of topics ranging from 10 to 50 in steps of 10. Over different runs, BERTopic gives higher NPMI [47] coherence scores () compared to LDA (), and similar diversity [48] scores () compared to LDA ().
For each emotional reaction, we extract the topics of tweets that are tagged with that emotion or morality category. We apply BERTopic to tweets within the three-day time window [12] before and after the change point separately. For example, for the Black Lives Matter protests starting on 2020-05-26, we extract the topics from tweets posted between 05-23 to 05-25 to develop a baseline and then separately extract the topics from tweets posted between 05-26 to 05-28. By comparing the top 10 baseline topics before the change point with the top 10 appearing after the change point, we determine the new topics that emerged after the change points that are possibly relevant to the event associated with this change point.
BERTopic uses transformer-based models that take in whole sentences to account for contextual information. We first preprocess the tweets to remove URLs and name mentions, transform emojis to their textual descriptions, and split hashtags into individual words. We use the Sentence-BERT “all-MiniLM-L6-v2” model [49] to directly embed the processed tweets. After topic modeling, we remove English stopwords in the learned topic keywords.
Table II shows some example topics associated with different events. For each topic we show the top three keywords. The newly emerged topics are highlighted in bold. With each emerging topic, we manually verify if there is an associated offline event by examining the tweets belonging to this topic and by searching related news articles. Such manual verification is a necessary and common practice event detection literacture [14]. For most reactions, regardless of how small or impactful, the identified topics clearly relate to an offline event (e.g. Table II row 1, 4). For the second change points, the newly emerged topics point us to several different events. However, by examining the tweets belonging to these topics, we found the Black Lives Matter protests were the most predominant event, and other emerging topics such as “america, vote, trump” and “covid, coronavirus, tested” were related to the protests. Finally, there are also some change points for which we cannot identify meaningful emerging topics (e.g. row 3). We decide whether it is a false positive through further inspection of tweets (see section IV-B).
IV Results
IV-A Online emotional reactions to Offline Events
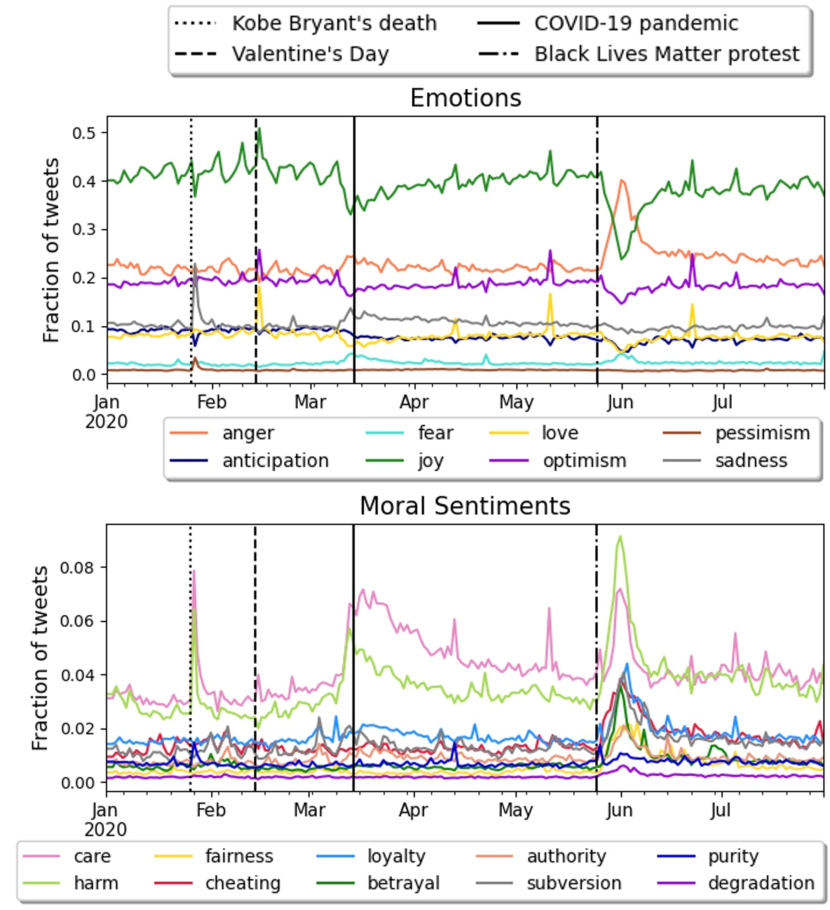
Times series of the aggregate affect from January to August 2020 (Fig. 2) shows complex dynamics with seasonal variation (weekly cycles in joy), short-term bursts (spike in love on Valentine’s Day), and long-term changes in emotions and moral sentiment. This time span represents a difficult period in the life of the city. In addition to the world-wide pandemic, which led to lockdowns all over the country by the middle of March, political primaries were also taking place during this time period, which also saw one of the largest social justice protests triggered by the murder of George Floyd in police custody, as well as the death of a beloved sports figure. These developments had profound impact on the city’s population, as demonstrated by the many inflection points, rises and dips in emotions and moral sentiments.
(Impact represented by the number of emotions/moral sentiments changed).
| Event | Date |
|
|
|
Relevant Topics | |||||||||||||
| 1 |
|
05-26 | 05-25 to 05-30 |
|
|
|
||||||||||||
| 2 | COVID-19 pandemic | 03-10 | 03-09 to 03-11 |
|
|
|
||||||||||||
| 3 | Kobe Bryant’s death | 01-26 | 01-26 |
|
joy |
|
||||||||||||
| 4 | Valentine’s Day | 02-14 | 02-14 | love | anger, disgust | “valentine, valentines, happy” | ||||||||||||
| 5 |
|
01-20 | 01-17 to 01-20 | joy, loyalty, fairness |
|
|||||||||||||
| 6 |
|
02-03 | 02-03 | anger, disgust, authority |
|
|||||||||||||
| 7 |
|
01-20 | 01-20 to 01-21 | betrayal, subversion |
|
|||||||||||||
| 8 |
|
03-03 | 03-02 to 03-03 | fairness, subversion |
|
|||||||||||||
| 9 |
|
05-07 | 05-07 | cheating | “flynn, cheated, cheating” | |||||||||||||
| 10 |
|
06-27 | 06-27 | betrayal |
|
|||||||||||||
| 11 |
|
05-11 | 05-11 | subversion | “obama, trump, president” | |||||||||||||
| 12 |
|
07-23 | 07-23 | joy | “dodgers, mlb, giants” | |||||||||||||
| 13 | Earthquake | 01-20 | 01-20 | fear | “earthquake, usgs, km” | |||||||||||||
| 14 | Earthquake | 04-03 | 04-03 | fear | “usgs, reports, quake” | |||||||||||||
We run the proposed pipeline to detect and explain the online emotional reactions to various offline events. Table III shows that our method is able to not only identify larger and impactful events such as the COVID-19 pandemic and the Black Lives Matter protests, but also smaller events such as earthquakes and baseball playoffs. We see the complex reactions to the COVID-19 pandemic in multiple dimensions of emotions and morality. The unsupervised method also enables us to discover reactions to smaller events that might be easily missed, such as a rise in subversion in response to Trump’s tweets about Obamagate (event 11). We also show that running BERTopic on tweets posted near the event reveals the relevant topics very well. Furthermore, because we detect changes separately in each emotion, we can disentangle events based on different emotional reactions, even when they take place on the same day. For example, Trump’s impeachment trial was associated with an increase in betrayal and subversion, MLK Day with joy, loyalty and fairness, and earthquake was associated with fear (events 6, 8 and 14 in table III).
IV-B Evaluation of the Proposed Pipeline
Our method is unsupervised and can automatically discover even small events that might be missed in the news. For the purpose of evaluation, however, we formulate detecting emotional reactions as a binary task. We consider a successfully detected change point (true positive) in a time series of emotion or moral sentiments to be one that we can successfully link to an offline event via at least one relevant topic (Section III-E). We detected 54 change points in total. Their confidence given by the change point detection method ranged from 0.65 to 1.00, with 85% having confidence score above 0.9. In table III we also show the date range of the change points for one event if detected in more than one emotion/moral categories. Most detected change points are close to the actual event date.
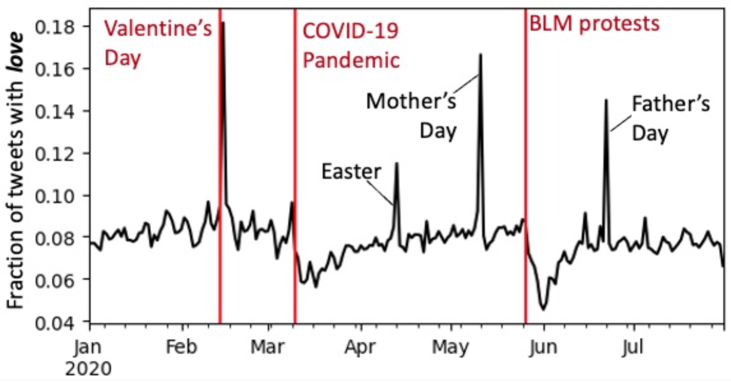
We consider a false positive to be a change point that cannot be explained by any topic (e.g. Table II row 3). We found 10 false positives, giving the precision of 0.84. We searched news articles at these time points to investigate whether these false positives are due to the failure of BERTopic to identify meaningful topics or whether there were indeed no newsworthy real-life events. For all 10 false positives, we are not able to find significant news events. We consider a false negative to be an emotional reaction that shows up as an obvious peak or dip in the time series and can also be related to an offline event, but is not detected by the change point detection methods. Figure 3 shows examples of false negatives, which are related to Easter, Mother’s Day, Father’s Day, and an earthquake. There are 14 false negatives, giving recall of 0.79. In future, we plan to combine change point detection and anomaly detection to mitigate these false negative cases.
IV-C Short-term and Long-term Changes in Affect
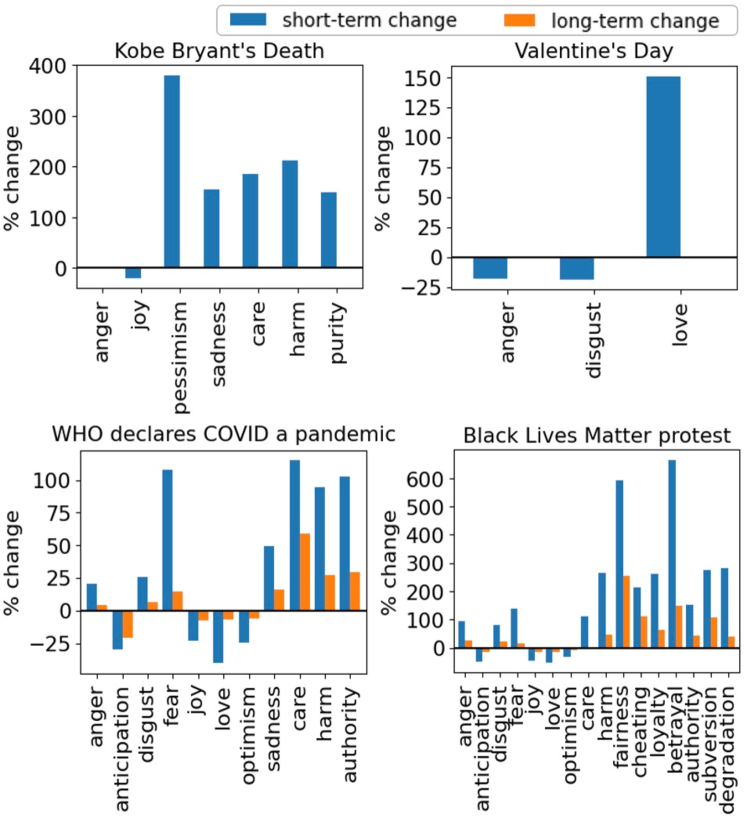
Our proposed method enables us to study collective reactions to an event along multiple dimensions of affect. For example, the Black Lives Matter protests were associated with 16 different emotional and moral changes. We quantify the change in emotions and moral sentiments around different events as percent change in the corresponding collective affect before and after the event. Figure 4 shows these changes for four of the more impactful events. Consistent with our intuition, Kobe Bryant’s Death was associated with a short-term increase in negative emotions like pessimism and sadness and a decrease in joy, as well as a short-term rise in moral language related to care and harm. On the other hand, Valentine’s Day brought a short-term increase of positive emotions like love and a decrease in negative emotions anger and disgust. There were no long-term changes associated with these events.
The COVID-19 outbreak triggered a cascade of events aimed at mitigating the pandemic that were associated with complex short-term and long-term changes in emotions and moral sentiments. People expressed more negative emotions such as anger, disgust, sadness, and more significantly, fear, both in the short-term and the long-term. Positive emotions like joy and love simultaneously decreased. People also expressed more moral sentiments like care in tweets such as “Stay safe. We thank you”, as well as more harm blaming the virus. Interestingly, the moral concerns about authority also increased, possibly because new policies including lockdowns to mitigate the pandemic were put in place (e.g. “I think governor Newsom is doing a great job. we are complying with his guidance and the CDC at my hospital. Thank you governor”), and some were critical of government’s response, e.g., “we need leadership not a politician”.
The Black Lives Matter protests was also associated with complex short- and long-term emotional and moral reactions. We observe increases in negative emotions and decreases in positive emotions. In addition, compared to other three events, we observe greater increases in different moral sentiments associated with the BLM protests. The moral concerns about fairness and betrayal had especially increased much. People keenly felt the injustice and betrayal in George Floyd’s murder.
IV-D Disentangling COVID-related Emotions
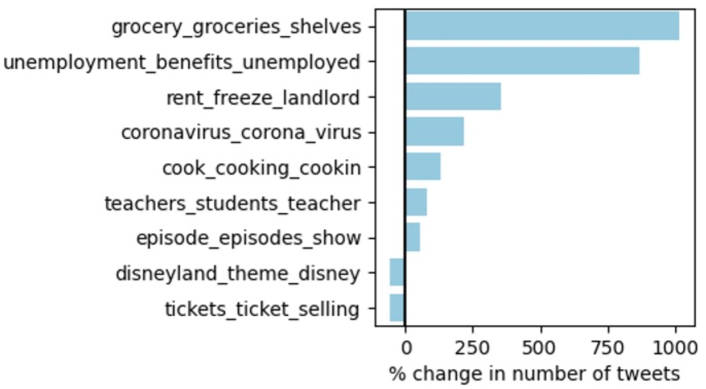
The COVID-19 pandemic was associated with complex and long-term emotional changes. Here we use this example to further show the benefit of disentangling emotional reactions by disaggregating topics. From the BERTopic model, we discover topics that are directly related to COVID-19, for example the topic “coronavirus, corona, covid”. More interestingly, we discover many other topics that reflect the impact of COVID-19 on people’s lives. Figure 5 shows some of these topics and the change of their tweet frequencies two weeks before and after the WHO pandemic announcement on March 11, 2020. People not only talked about the negative aspects of the pandemic, such as grocery shortages, unemployment, housing and rent issues, but also about leisure activities during quarantine. Because large gatherings were fobidden during lockdowns, the Disneyland and ticket selling topics decreased in frequency, but some at-home activities like cooking and watching TV increased in frequency. Other discussions include school closure and the switch to remote learning.
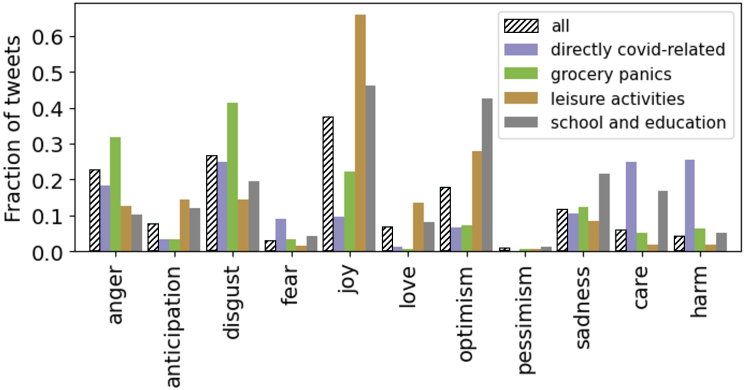
We select four top categories discussed and group related topics into these categories: directly covid-related topics, grocery panics, leisure activities and school and education. We study emotions and moral expressions aggregated in all the tweets, as well as in these topic categories. Figure 6 shows the fraction of tweets in all tweets and in each of these four categories that express each emotion or moral sentiment. We find that aggregating emotions from all tweets can give misleading impressions. Positive emotions like joy were highly expressed in all tweets (aggregated), but in fact they were mostly dominated by people talking about leisure activities. In COVID-related tweets, few positive emotions were expressed. Anger and disgust were higher in topics about grocery panics than in topics directly related to COVID. Another example is the expression of care and harm moral sentiments. Their expressions were diluted by other topics in aggregate tweets. By disaggregating, we see that they were highly expressed in directly COVID-related tweets. These results suggest that during times of maximal crisis and uncertainty, people find outlets for positive emotions. They also demonstrate the importance of disaggregating by topics when studying specific issues.
V Conclusion
In this work, we have demonstrated the effectiveness of an unsupervised method to detect and measure public reactions to newsworthy events. We applied our method to a large Twitter corpus of tweets drawn from the population of a large metropolitan area, disentangled the dynamics of online emotions during a time period punctuated by complex social, health, and political events. We showed that our method can discover significant and less significant events and measure emotional and moral reactions to these events. To further understand the complex impact of the COVID-19 outbreak, we disaggregated COVID-related tweets and discovered topics directly related to the virus and topics related to changes in life style, including unemployment, grocery panics and education. The emotions expressed on these different topics suggest that people had negative feelings and thoughts during the height of the pandemic, but were also searching for the positive and holding on to optimism. Together, these results suggests the potential of using social media data fortracking of public reactions to events, as well as discovering significant events that may have been missed by traditional news sources.
Limitations and Future Works: When there is a change point that is a dip, we cannot use topic modeling to explain it, as a dip in the emotion or moral sentiment indicates a decrease of discussion related to an event. However, usually the decrease of some emotions is accompanied by the increase of some other emotions, and we can study the tweets tagged with the surged emotions to understand the topics. Another improvement to make is on how we verify an offline event from the relevant topics obtained from BERTopic. Currently we rely on manual verification by reading tweets and searching for related news articles. This is still a common practice in the event detection area. In the future, we plan to incorporate a more automated method, such as obtaining relevant news articles through a Google Search API.
In future works we also plan to move forward to causal analysis. In principle, the offline events cause the online emotional and moral reactions. However, there are many confounding factors in this causal process. For example, the same event might pose very different effects on heterogeneous online populations. We plan to expand this work by performing causal analysis to further disentangle the causal relationships between offline events and online emotions, and to measure the heterogeneous effects on different online populations.
References
- [1] S. A. Golder and M. W. Macy, “Diurnal and seasonal mood vary with work, sleep, and daylength across diverse cultures,” Science, vol. 333, no. 6051, pp. 1878–1881, 2011.
- [2] K. Jaidka, S. Giorgi, H. A. Schwartz, M. L. Kern, L. H. Ungar, and J. C. Eichstaedt, “Estimating geographic subjective well-being from twitter: A comparison of dictionary and data-driven language methods,” PNAS, vol. 117, no. 19, pp. 10 165–10 171, 2020.
- [3] A. D. Kramer, J. E. Guillory, and J. T. Hancock, “Experimental evidence of massive-scale emotional contagion through social networks,” PNAS, vol. 111, no. 24, pp. 8788–8790, 2014.
- [4] W. J. Brady, J. A. Wills, J. T. Jost, J. A. Tucker, and J. J. Van Bavel, “Emotion shapes the diffusion of moralized content in social networks,” PNAS, vol. 114, no. 28, pp. 7313–7318, 2017.
- [5] V. Lampos, T. De Bie, and N. Cristianini, “Flu detector-tracking epidemics on twitter,” in Joint European conference on machine learning and knowledge discovery in databases. Springer, 2010, pp. 599–602.
- [6] Z. M. Nia, A. Asgary, N. Bragazzi, B. Mellado, J. Orbinski, J. Wu, and J. Kong, “Nowcasting unemployment rate during the covid-19 pandemic using twitter data: The case of south africa,” Frontiers in Public Health, vol. 10, 2022.
- [7] E. M. Cody, A. J. Reagan, L. Mitchell, P. S. Dodds, and C. M. Danforth, “Climate change sentiment on twitter: An unsolicited public opinion poll,” PloS one, vol. 10, no. 8, p. e0136092, 2015.
- [8] M. Klašnja, P. Barberá, N. Beauchamp, J. Nagler, and J. A. Tucker, “Measuring Public Opinion with Social Media Data,” in The Oxford Handbook of Polling and Survey Methods. Oxford University Press, 09 2018.
- [9] P. S. Dodds, K. D. Harris, I. M. Kloumann, C. A. Bliss, and C. M. Danforth, “Temporal patterns of happiness and information in a global social network: Hedonometrics and twitter,” PloS one, vol. 6, no. 12, p. e26752, 2011.
- [10] M. Alizadeh, I. Weber, C. Cioffi-Revilla, S. Fortunato, and M. Macy, “Psychology and morality of political extremists: evidence from twitter language analysis of alt-right and antifa,” EPJ Data Science, vol. 8, no. 1, pp. 1–35, 2019.
- [11] P. Dodds, J. Minot, M. Arnold, T. Alshaabi, J. Adams, D. Dewhurst, A. Reagan, and C. Danforth, “Fame and ultrafame: Measuring and comparing daily levels of ‘being talked about’ for united states’ presidents, their rivals, god, countries, and k-pop.” Journal of Quantitative Description: Digital Media, vol. 2, Feb. 2022.
- [12] J. Leskovec, L. Backstrom, and J. Kleinberg, “Meme-tracking and the dynamics of the news cycle,” in Proceedings of the 15th ACM SIGKDD international conference on Knowledge discovery and data mining, 2009, pp. 497–506.
- [13] J. Weng and B.-S. Lee, “Event detection in twitter,” in In ICWSM-2011, vol. 5, no. 1, 2011, pp. 401–408.
- [14] K. Morabia, N. L. Bhanu Murthy, A. Malapati, and S. Samant, “SEDTWik: Segmentation-based event detection from tweets using Wikipedia,” in In NACCL-2019 workshop, Jun. 2019, pp. 77–85.
- [15] T. Brader and G. E. Marcus, “Emotion and political psychology.” 2013.
- [16] G. A. vanKleef, A. Cheshin, A. H. Fischer, and I. K. Schneider, “Editorial: The social nature of emotions,” Frontiers in Psychology, vol. 7, p. 896, 2016.
- [17] J. Haidt, C. Joseph et al., “The moral mind: How five sets of innate intuitions guide the development of many culture-specific virtues, and perhaps even modules,” The innate mind, vol. 3, pp. 367–391, 2007.
- [18] J. Graham, J. Haidt, and B. A. Nosek, “Liberals and conservatives rely on different sets of moral foundations.” J Pers Soc Psychol, vol. 96, no. 5, p. 1029, 2009.
- [19] E. Hauthal, D. Burghardt, and A. Dunkel, “Analyzing and visualizing emotional reactions expressed by emojis in location-based social media,” ISPRS International Journal of Geo-Information, vol. 8, no. 3, p. 113, 2019.
- [20] M. B. Babac, “Emotion analysis of user reactions to online news,” Information Discovery and Delivery, no. ahead-of-print, 2022.
- [21] D. Gayo-Avello, ““i wanted to predict elections with twitter and all i got was this lousy paper”–a balanced survey on election prediction using twitter data,” arXiv preprint arXiv:1204.6441, 2012.
- [22] J. Hoover, G. Portillo-Wightman, L. Yeh, S. Havaldar, A. M. Davani, Y. Lin, B. Kennedy, M. Atari, Z. Kamel, M. Mendlen, G. Moreno, C. Park, T. E. Chang, J. Chin, C. Leong, J. Y. Leung, A. Mirinjian, and M. Dehghani, “Moral foundations twitter corpus: A collection of 35k tweets annotated for moral sentiment,” Social Psychological and Personality Science, vol. 11, no. 8, pp. 1057–1071, 2020.
- [23] D. M. Blei, A. Y. Ng, and M. I. Jordan, “Latent dirichlet allocation,” JMLR, vol. 3, no. Jan, pp. 993–1022, 2003.
- [24] L. Niu, X. Dai, J. Zhang, and J. Chen, “Topic2vec: Learning distributed representations of topics,” in 2015 International conference on asian language processing (IALP). IEEE, 2015, pp. 193–196.
- [25] M. Malik, W. Aslam, Z. Aslam, A. Alharbi, B. Alouffi, and H. T. Rauf, “A performance comparison of unsupervised techniques for event detection from oscar tweets,” Computational Intelligence and Neuroscience, vol. 2022, 2022.
- [26] Z. Rezaei, B. Eslami, M. A. Amini, and M. Eslami, “Event detection in twitter by deep learning classification and multi label clustering virtual backbone formation,” Evolutionary Intelligence, pp. 1–15, 2022.
- [27] Y. Cao, H. Peng, J. Wu, Y. Dou, J. Li, and P. S. Yu, “Knowledge-preserving incremental social event detection via heterogeneous gnns,” in In WWW-2021, 2021, pp. 3383–3395.
- [28] R. Sandoval-Almazan and D. Valle-Cruz, “Sentiment analysis of facebook users reacting to political campaign posts,” Digital Government: Research and Practice, vol. 1, no. 2, pp. 1–13, 2020.
- [29] L. Mitchell, M. R. Frank, K. D. Harris, P. S. Dodds, and C. M. Danforth, “The geography of happiness: Connecting twitter sentiment and expression, demographics, and objective characteristics of place,” PloS one, vol. 8, no. 5, p. e64417, 2013.
- [30] J. Bollen, H. Mao, and X. Zeng, “Twitter mood predicts the stock market,” Journal of computational science, vol. 2, no. 1, pp. 1–8, 2011.
- [31] A. Tumasjan, T. Sprenger, P. Sandner, and I. Welpe, “Predicting elections with twitter: What 140 characters reveal about political sentiment,” in In ICWSM-2010, vol. 4, no. 1, 2010, pp. 178–185.
- [32] K. K. Aldous, J. An, and B. J. Jansen, “Measuring 9 emotions of news posts from 8 news organizations across 4 social media platforms for 8 months,” ACM Transactions on Social Computing (TSC), vol. 4, no. 4, pp. 1–31, 2022.
- [33] H. Alhuzali and S. Ananiadou, “SpanEmo: Casting multi-label emotion classification as span-prediction,” in ECACL. ACL, Apr. 2021, pp. 1573–1584.
- [34] S. Mohammad, F. Bravo-Marquez, M. Salameh, and S. Kiritchenko, “SemEval-2018 task 1: Affect in tweets,” in Proc. 12th Int. Workshop on Semantic Evaluation, Jun. 2018, pp. 1–17.
- [35] J. Devlin, M.-W. Chang, K. Lee, and K. Toutanova, “Bert: Pre-training of deep bidirectional transformers for language understanding,” 2019.
- [36] K. Johnson and D. Goldwasser, “Classification of moral foundations in microblog political discourse,” in In ACL-2018, Jul. 2018, pp. 720–730.
- [37] A. Rojecki, E. Zheleva, and L. Levine, “The moral imperatives of self-quarantining,” Annual meeting of the American Political Science Association, 2021.
- [38] F. R. Hopp, J. T. Fisher, D. Cornell, R. Huskey, and R. Weber, “The extended moral foundations dictionary (emfd): Development and applications of a crowd-sourced approach to extracting moral intuitions from text,” Behavior Research Methods, vol. 53, no. 1, pp. 232–246, 2021.
- [39] S. Guo, N. Mokhberian, and K. Lerman, “A data fusion framework for multi-domain morality learning,” in In ICWSM-2023, vol. 17, 2023, pp. 281–291.
- [40] J. Garten, J. Hoover, K. Johnson, R. Boghrati, C. Iskiwitch, and M. Dehghani, “Dictionaries and distributions: Combining expert knowledge and large scale textual data content analysis: Distributed dictionary representation,” Behavior Research Methods, Instruments, and Computers, vol. 50, no. 1, pp. 344–361, Feb. 2018.
- [41] J. Trager, A. S. Ziabari, A. M. Davani, P. Golazazian, F. Karimi-Malekabadi, A. Omrani, Z. Li, B. Kennedy, N. K. Reimer, M. Reyes et al., “The moral foundations reddit corpus,” arXiv preprint arXiv:2208.05545, 2022.
- [42] M. Pellert, H. Metzler, M. Matzenberger, and D. Garcia, “Validating daily social media macroscopes of emotions,” Scientific Reports, vol. 12, no. 1, p. 11236, 2022.
- [43] D. V. Hinkley, “Inference about the change-point from cumulative sum tests,” Biometrika, vol. 58, no. 3, pp. 509–523, 1971.
- [44] R. P. Adams and D. J. MacKay, “Bayesian online changepoint detection,” arXiv preprint arXiv:0710.3742, 2007.
- [45] M. Grootendorst, “Bertopic: Neural topic modeling with a class-based tf-idf procedure,” arXiv preprint arXiv:2203.05794, 2022.
- [46] D. M. Blei, A. Y. Ng, and M. I. Jordan, “Latent dirichlet allocation,” J. Mach. Learn. Res., vol. 3, no. null, p. 993–1022, mar 2003.
- [47] G. Bouma, “Normalized (pointwise) mutual information in collocation extraction,” 2009.
- [48] A. B. Dieng, F. J. R. Ruiz, and D. M. Blei, “Topic modeling in embedding spaces,” TACL, vol. 8, pp. 439–453, 2020.
- [49] N. Reimers and I. Gurevych, “Sentence-bert: Sentence embeddings using siamese bert-networks,” in In EMNLP-2019. ACM, 11 2019.