Observation of Kekulé vortices induced in graphene by hydrogen adatoms
Fractional charges are one of the wonders of the fractional quantum Hall effect, a liquid of strongly correlated electrons in a large magnetic fieldLaughlin (1983); Reznikov et al. (1997); Saminadayar et al. (1997). Fractional excitations are also anticipated in two-dimensional crystals of non-interacting electrons under time-reversal symmetry, as bound states of a rotating bond order known as Kekulé vortexHou et al. (2007); Seradjeh & Franz (2008). However, the physical mechanisms inducing such topological defects remain elusive, preventing experimental realisations. Here, we report the observation of Kekulé vortices in the local density of states of graphene under time-reversal symmetry. The vortices result from intervalley scattering on chemisorbed hydrogen adatoms and have a purely electronic origin. Their winding is reminiscent of the Berry phase of the massless Dirac electrons. Remarkably, we observe that point scatterers with different symmetries such as divacancies can also induce a Kekulé bond order without vortex. Therefore, our local-probe study further confirms point defects as versatile building blocks for the control of graphene’s electronic structure by Kekulé orderCheianov et al. (2009a, b); Gutierrez & et al. (2016); Bao et al. (2021); Qu & et al. (2022).
Introduction
Real-space topological defects in crystals exhibit exotic electronic propertiesMermin (1979); Nelson (2002), especially when combined with the reciprocal-space topological phase hosted by the bulkJuričić et al. (2012); Teo & Hughes (2017). In two-dimensional hexagonal lattices, a vortex in the Kekulé order parameter is of particular interest for charge fractionalisation without breaking time-reversal symmetryHou et al. (2007); Seradjeh & Franz (2008). It is a two-dimensional extension of the charge fractionalisation at domain-wall solitons in the one-dimensional spinless model of polyacetyleneSu et al. (1979, 1980). Introducing the twofold spin degeneracy, a charged topological defect carries zero spin, while the neutral defect carries spin . The fractionalisation mechanism is therefore manifested by this unusual spin-charge relation. Similar to the dimerisation in one-dimensional polyacetylene, the Kekulé order in graphene corresponds to the unit cell tripling, with a distinct bond order within one of the three equivalent hexagonal rings. These three degenerate states define an angular order parameter space as shown in Figure 1a. A Kekulé vortex of winding corresponds to the alternation of the three Kekulé domains upon encircling a singularity, which could be implemented in opticalMenssen et al. (2020); Gao et al. (2020) and acousticalGao et al. (2019); Ma et al. (2020) metamaterials. In graphene, recent experiments have demonstrated that a Kekulé bond order emerges from the intervalley coherent quantum Hall ferromagnet states in the zeroth Landau levelLi et al. (2019); Coissard & et al (2022); Liu et al. (2022). These states can host skyrmionic topological excitations appearing as Kekulé vorticesLian & Goerbig (2017); Atteia et al. (2021); Liu et al. (2022). However, these schemes require a strong magnetic field and the Kekulé vortex without breaking time-reversal symmetry remains out of reach. At zero magnetic field, theory shows that a missing electronic site provides a fractionalisation mechanism analogous to that of the Kekulé vortex.Ovdat et al. (2020); Ducastelle (2013) Such point defects can scatter electrons from one valley to another, thereby connecting the two valleys and offering a way to stabilize the Kekulé bond order Cheianov et al. (2009a, b); Gutierrez & et al. (2016); Bao et al. (2021); Qu & et al. (2022). We now demonstrate that they also induce Kekulé vortices in graphene.
Observation of a Kekulé vortex near an H atom on graphene.
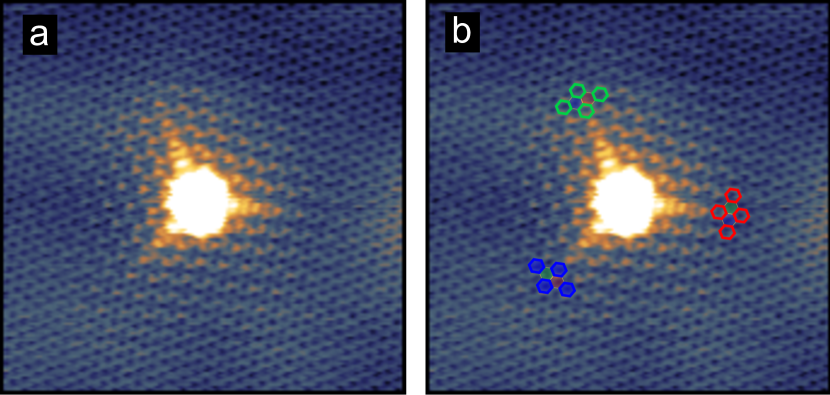
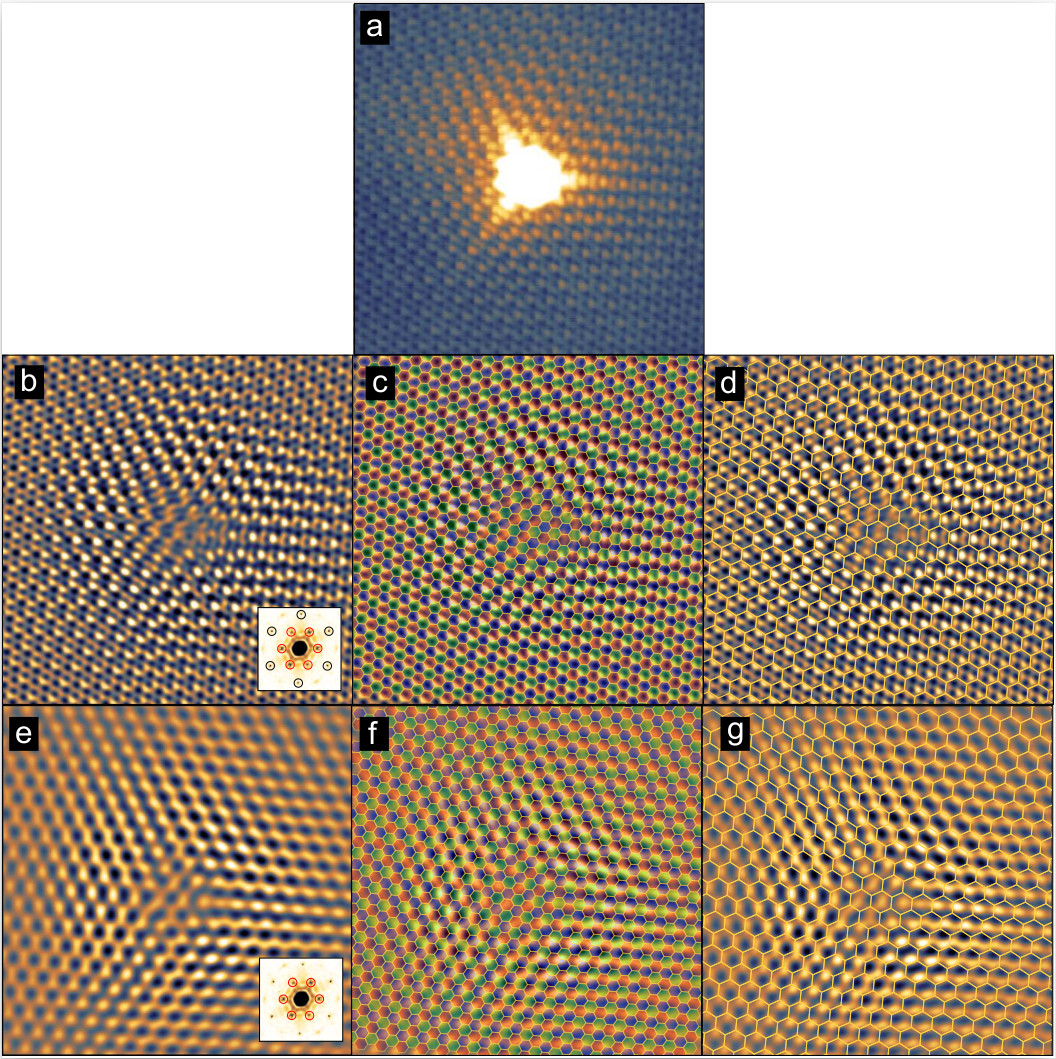
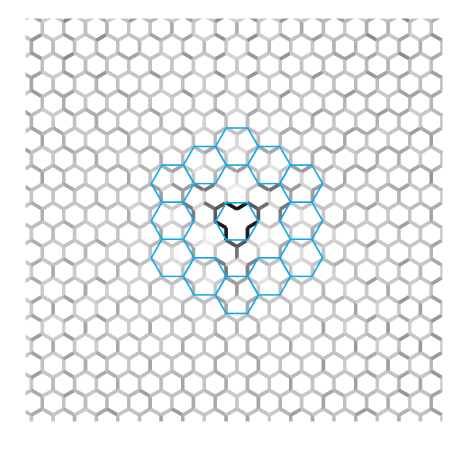
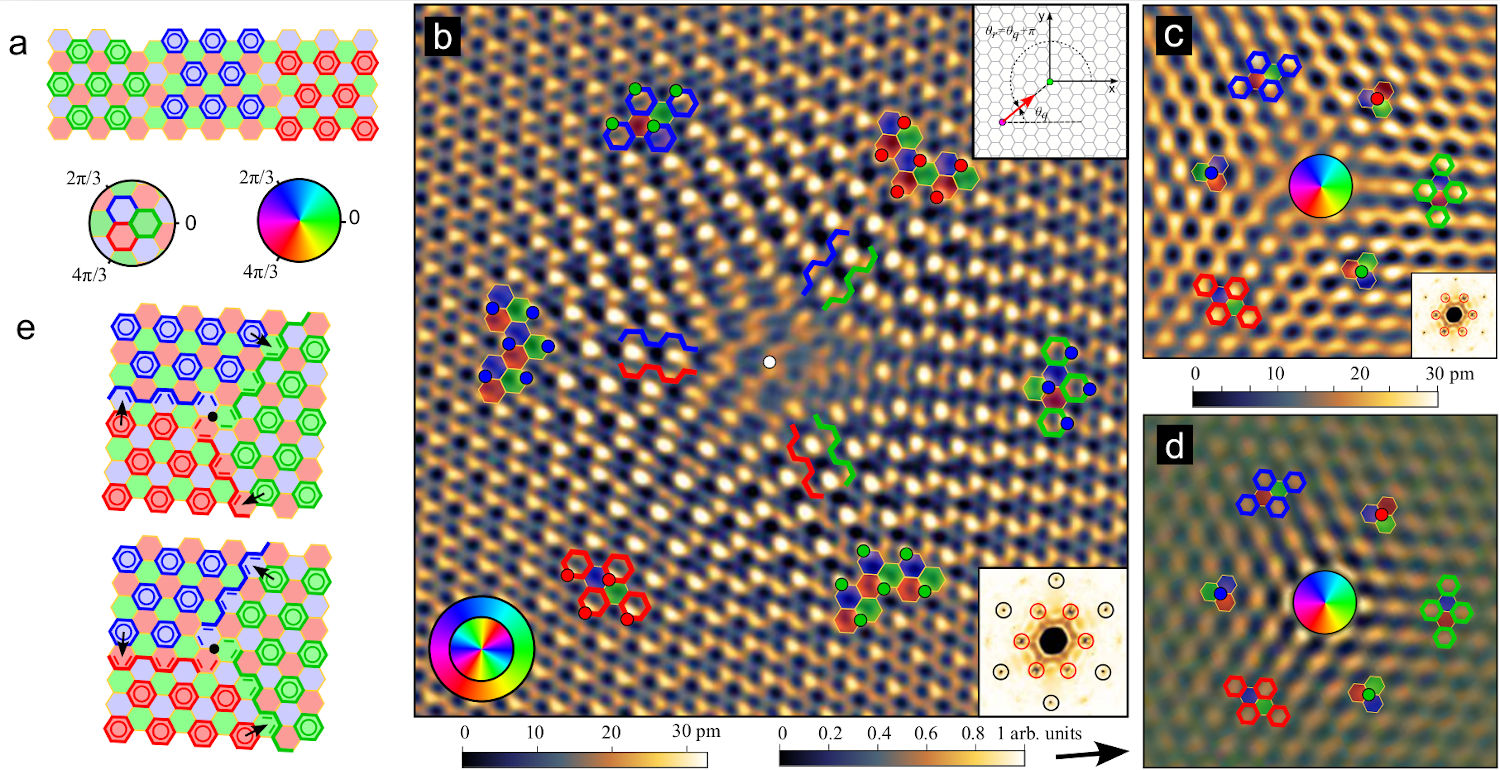
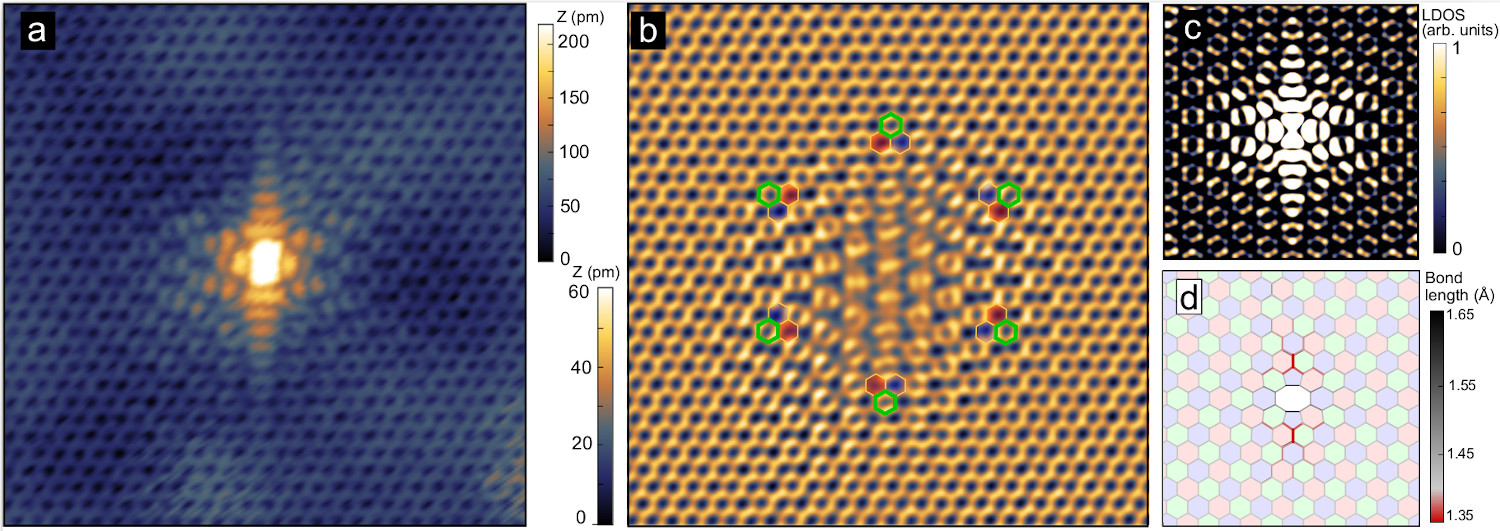
Figure 1b shows a scanning tunneling microscopy (STM) image of graphene with a single chemisorbed hydrogen adatom (see Methods for experimental details and Extended data Fig. 1 for another example.). In this image, we have filtered out the intense signal of the close-to-zero-energy state induced by the adatomPereira et al. (2006); Yazyev & Helm (2007); Wehling et al. (2007), in order to highlight the result of elastic intervalley scattering of the massless relativistic electrons by the adatomBrihuega et al. (2008). The image reveals a hexagonal superlattice commensurate with that of graphene but with a unit cell three times larger, as emphasised by the three-colour tiling (See Extended data Fig. 2 for details). The pattern is dominated by the onsite signal on sublattice B (assuming the H adatom is on sublattice A), which alternates between the three nonequivalent B sites. The coloured dots and the inner colour wheel in Fig. 1b highlights that this onsite signal winds when circling around the adatom, consistent with previous studiesDutreix & Katsnelson (2016); Dutreix & et al (2019); Dutreix et al. (2021). A closer inspection of the interference pattern further reveals the underlying signal on graphene bonds, which is consistent with the Kekulé ordering. In Figure 1b, bold coloured hexagons identify three distinct Kekulé domains separated from one another by domain walls along the armchair direction. Remarkably, the Kekulé bond order shows a winding when circling around the adatom. This demonstrates that the chemisorbed H adatom induces a Kekulé vortex on the surrounding graphene bonds.
Establishing the electronic origin of the Kekulé vortex
We will now show that the Kekulé vortex has a purely electronic origin related to the band topology of graphene rather than to defect-induced atomic displacements. The bond ordering of the Kekulé type relates to the electron density between carbon atoms, which are no longer equivalent due to the presence of the hydrogen adatom. Intervalley scattering resolved at the tip position yields the following bond contribution to the local density of states (LDOS):
| (1) |
where and is a scattering wavevector between the valleys responsible for the hexagonal superlattice pattern (see Supplementary Information). This bond contribution can be understood as a two-path loop interference allowed by the overlap of neighbouring orbitals of carbon atoms. The vortex originates from the polar angle indexing the tip orientation, which is known to be a real-space representation of the electron pseudospin defined from a Dirac point in momentum space (see inset in Fig. 1b and Ref. Dutreix & et al, 2019). Thus, the bond contribution to the LDOS exhibits a vortex centered on the adatom as a reminiscence of the topological pseudospin vortex, or equivalently the topological Berry phase, which characterizes the band topology of the massless Dirac electronsKatsnelson (2020). The usual onsite LDOS modulations and due to interference also contribute to the STM signalDutreix & et al (2019). Adding all contributions leads to the energy-integrated LDOS modulations in Fig. 1d, which shows very good agreement with the filtered experimental image shown in Fig. 1c. We would like to point out that the experimentally observed vortex is additionally reproduced by both our tight-binding and density functional theory (DFT) calculations (see Methods, Fig. 2 and extended data Fig. 5). While the Fourier filtering of experimental data does not allow to separate onsite and bond contributions to the LDOS, this can be readily achieved in calculations (see Extended Data Figs. 3). We note that the vortices are not affected by the energy integration of the LDOS, since the scattering wave-vectors are energy independent. Energy-resolved STM images shown in Extended Data Fig. 4 confirm this conclusion.
The Kekulé vortex in the LDOS derives from an intrinsic topological property of the massless Dirac (that is, chiral in pseudospin Katsnelson (2020)) wavefunctions scattered by the adatom. Therefore, we name it a Berry-Kekulé vortex. At this point, the following two fundamental questions arise: i) Is the Berry-Kekulé vortex necessarily accompanied by a structural Kekulé distortion that would lead to opening a spectral gap? ii) If not, is the Berry-Kekulé vortex accompanied by zero-energy fractional excitations despite the absence of a spectral gap?
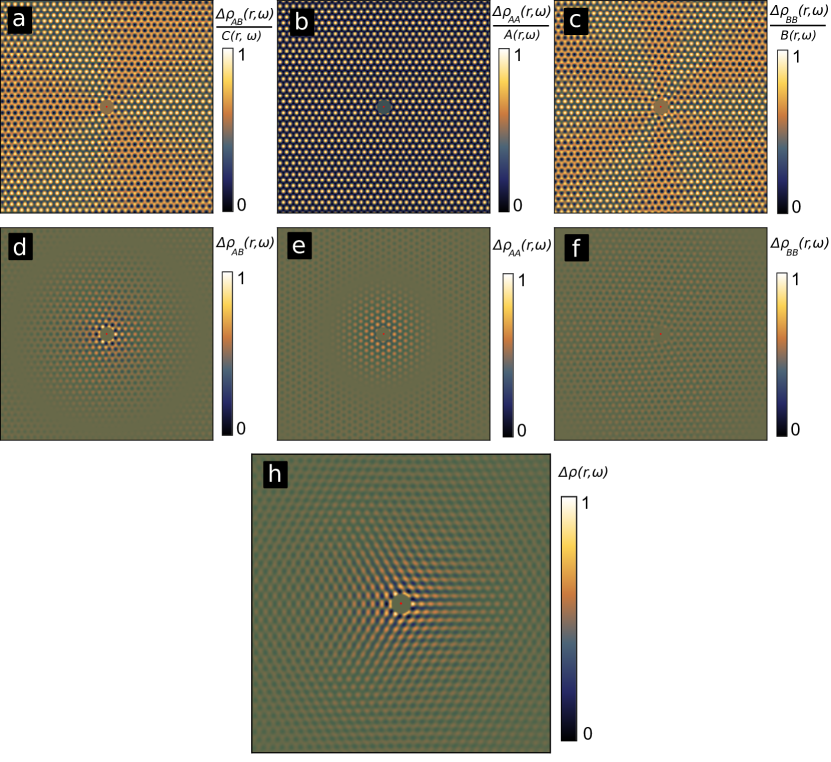
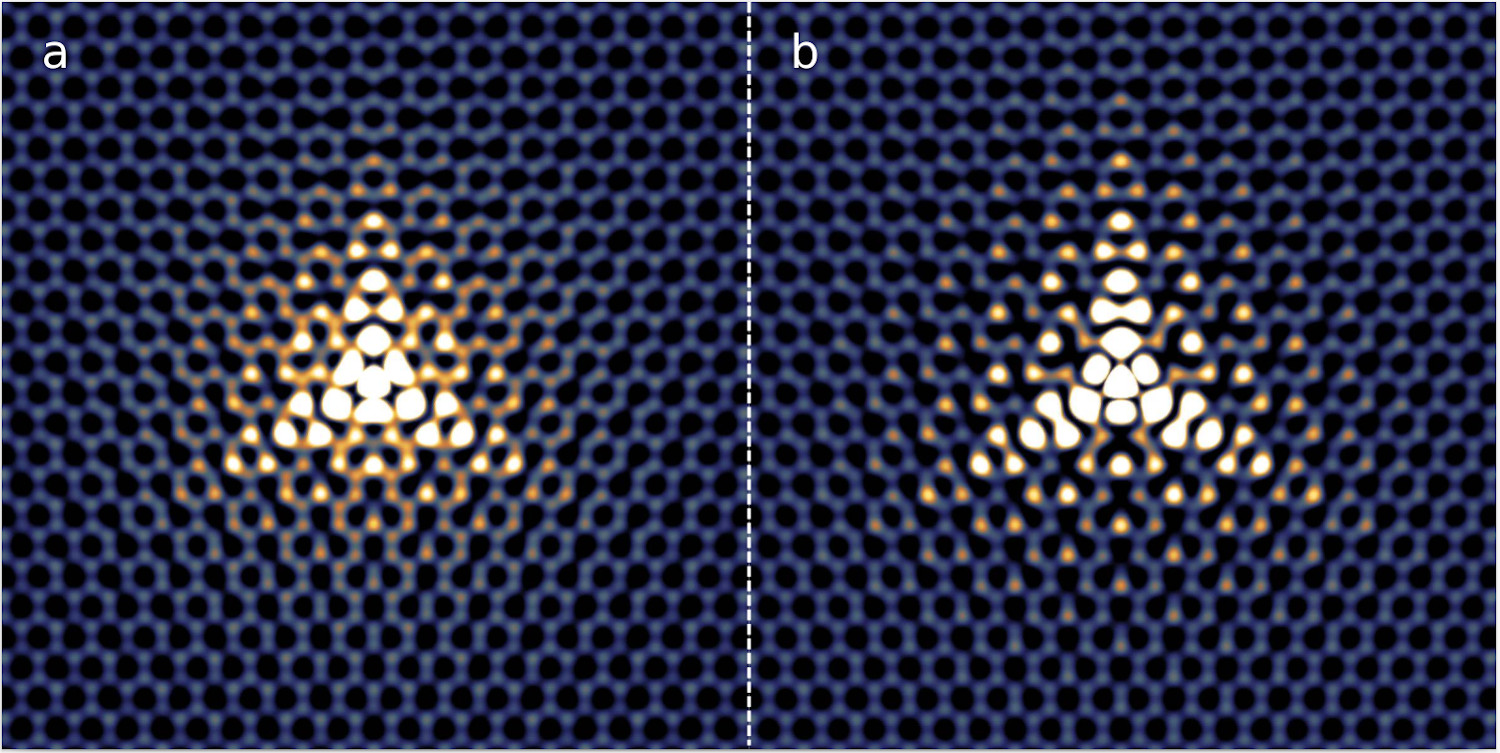
To answer the first question, we perform DFT calculations that intrinsically take into account lattice relaxation effects (see Methods). The simulated STM image (Fig. 2a) reproduces accurately the experiment, and in particular the vortex. While the presence of the hydrogen adatom does induce minor lattice distortions that are consistent with the winding of the structural Kekulé distortion (Fig. 2b,c), the results are essentially the same as the ones provided by our analytical description in Eq. 1 and tight-binding calculations (Extended Data Fig. 5) that do not include any lattice distortion effects whatsoever. Furthermore, performing DFT calculation without any relaxation does not affect the presence of the vortex (Extended Data Fig. 6). This further confirm the electronic origin of the Berry-Kekulé vortex.
Interestingly, the Kekulé vortex can be interpreted in terms of Clar’s sextet theoryClar (1983), a set of empirical rules widely used in the chemistry community that explains graphically the stability of aromatic molecules. The sextet representation depicts the six resonantly delocalized electrons by a circle. Clar’s rules state that adjacent hexagons can never be aromatic sextets simultaneously, and that the most stable bond configuration maximizes the number of Clar’s sextets. Graphene admits three equivalent resonant Clar configurations corresponding to three Kekulé orders (Fig. 1a)Balaban (2009). In the presence of a hydrogen adatom that effectively removes one site from the lattice, the circulation of delocalized electrons in the adjacent benzene rings is obstructed, which lifts the degeneracy of Clar’s resonant configurations allowed in its surrounding. We then find two possible configurations shown in Fig. 1e. The only freedom lies in the positions of the double covalent bonds along the boundaries between two Kekulé domains. Clar’s sextet representation leads to the same conclusion: a hydrogen adatom induces a Kekulé vortex in graphene. In supplementary infomation, we formalize the relation between these two pictures.
We will now answer question ii) with regard to fractional excitations accompanying Kekulé vortices, first for spinless electrons. The hydrogen adatom forms a covalent bond with a carbon atom in graphene lattice, eliminating the atomic orbital as a result of rehybridization into the state of carbon atomYazyev & Helm (2007). In this sense, a hydrogen adatom is equivalent to a single-atom vacancy in graphene except for stronger structural reconstruction in the latter case. Such a strong potential promotes half a state from the valence band to zero energy, and half a state from the conduction band if the spectrum is particle-hole symmetric. The zero-energy state is fully polarized on the sublattice opposite to that of the removed orbital and presents an algebraic decay due to the gapless relativistic spectrumPereira et al. (2006); Yazyev & Helm (2007); Wehling et al. (2007). This quasi-localised state at zero energy has the fractional charge , which corresponds to the charge difference of the occupied valence band with and without the hydrogen adatomOvdat et al. (2020). The number of quasi-bound states relates directly to the pseudospin real-space representation encoded in the scattering wavefunctionsOvdat et al. (2020). Therefore, the topological winding of the Berry-Kekulé vortex we observe at higher energy and the number of fractional excitations at zero energy are intrinsically intertwined.
Introducing the spin degeneracy doubles the number of zero-energy states, one per spin. At half filling, this implies that one of the two spin-polarised states is fully occupied. Since each bound state is a hybrid superposition of valence-conduction half states of and fractional charges, the quasi-bound state around the hydrogen adatom must be neutral with spin . Remarkably, this very unusual spin-charge relation appears to be supported by two independent experimental observations, one bringing evidence of the neutral chargeMao & et al. (2016), and the other of the magnetic momentGonzález-Herrero et al. (2016). It is also consistent with Lieb’s theoremLieb (1989).
Kekulé order near divacancies
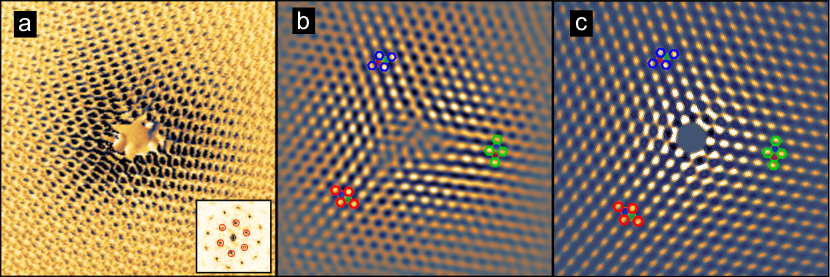
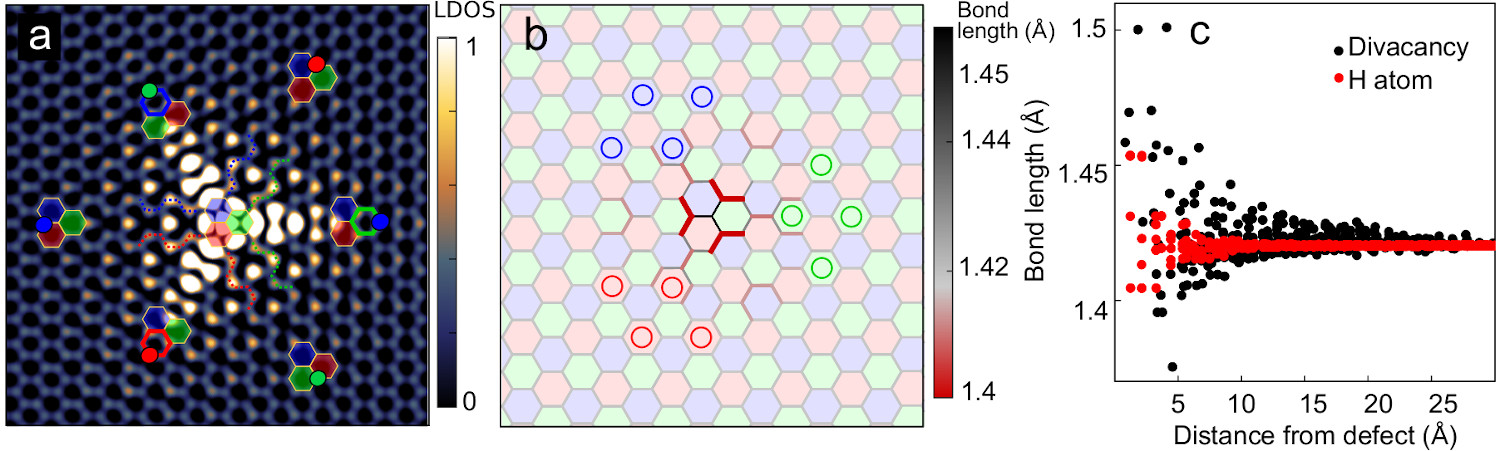
The existence of the Kekulé vortex and the quasi-bound states induced by the hydrogen adatom defect is related to the symmetries of this scattering center. While a hydrogen adatom breaks the symmetry and sublattice balance of graphene, a divacancy preserves these symmetries. Figure 3a shows an STM image of such divacancy in graphene. The divacancy also induces locally a Kekulé order. Importantly, this Kekulé order is exempt of any winding, with the Kelulé domain being defined by one of the three orientations of the chemical bond linking the two removed atoms. This is confirmed by DFT calculations (Fig. 3c) which show that the defect also creates significant lattice distortion originating from structural reconstruction due of the formation of two pentagonal rings (Figs. 2c and Fig. 3d).
A local Kékulé order with or without vortex can therefore be induced in graphene by the specific distribution of atomic defects. Harnessing experimentally these building blocks in a novel type of defect engineering could lead to the long-awaited macroscopic Kekulé order from the cooperative effect of atomic defectsCheianov et al. (2009a, b).
References
- Laughlin (1983) Laughlin, R. B. Anomalous Quantum Hall Effect: An Incompressible Quantum Fluid with Fractionally Charged Excitations. Phys. Rev. Lett. 50, 1395–1398 (1983). URL https://link.aps.org/doi/10.1103/PhysRevLett.50.1395.
- Reznikov et al. (1997) Reznikov, M., Heiblum, M. & et al. Direct observation of a fractional charge. Nature 389, 162–164 (1997).
- Saminadayar et al. (1997) Saminadayar, L., Glattli, D. C., Jin, Y. & Etienne, B. Observation of the Fractionally Charged Laughlin Quasiparticle. Phys. Rev. Lett. 79, 2526–2529 (1997).
- Hou et al. (2007) Hou, C.-Y., Chamon, C. & Mudry, C. Electron Fractionalization in Two-Dimensional Graphenelike Structures. Phys. Rev. Lett. 98, 186809 (2007).
- Seradjeh & Franz (2008) Seradjeh, B. & Franz, M. Fractional Statistics of Topological Defects in Graphene and Related Structures. Phys. Rev. Lett. 101, 146401 (2008).
- Cheianov et al. (2009a) Cheianov, V., Fal’ko, V., Syljuåsen, O. & Altshuler, B. Hidden Kekulé ordering of adatoms on graphene. Solid State Communications 149, 1499–1501 (2009a).
- Cheianov et al. (2009b) Cheianov, V. V., Syljuåsen, O., Altshuler, B. L. & Fal’ko, V. Ordered states of adatoms on graphene. Phys. Rev. B 80, 233409 (2009b).
- Gutierrez & et al. (2016) Gutierrez, C. & et al. Ubiquitous defect-induced density wave instability in monolayer graphene. Nature Phys. 12, 950 (2016).
- Bao et al. (2021) Bao, C. et al. Experimental Evidence of Chiral Symmetry Breaking in Kekulé-Ordered Graphene. Phys. Rev. Lett. 126, 206804 (2021).
- Qu & et al. (2022) Qu, A. C. & et al. Ubiquitous defect-induced density wave instability in monolayer graphene. Sci. Adv 8, eabm5180 (2022).
- Mermin (1979) Mermin, N. D. The topological theory of defects in ordered media. Rev. Mod. Phys. 51, 591–648 (1979).
- Nelson (2002) Nelson, D. R. Defects and Geometry in Condensed Matter Physics (Cambridge University Press, 2002).
- Juričić et al. (2012) Juričić, V., Mesaros, A., Slager, R.-J. & Zaanen, J. Universal Probes of Two-Dimensional Topological Insulators: Dislocation and Flux. Phys. Rev. Lett. 108, 106403 (2012).
- Teo & Hughes (2017) Teo, J. C. & Hughes, T. L. Topological defects in symmetry-protected topological phases. Annual Review of Condensed Matter Physics 8, 211–237 (2017).
- Su et al. (1979) Su, W. P., Schrieffer, J. R. & Heeger, A. J. Solitons in Polyacetylene. Phys. Rev. Lett. 42, 1698–1701 (1979). URL https://link.aps.org/doi/10.1103/PhysRevLett.42.1698.
- Su et al. (1980) Su, W. P., Schrieffer, J. R. & Heeger, A. J. Soliton excitations in polyacetylene. Phys. Rev. B 22, 2099–2111 (1980). URL https://link.aps.org/doi/10.1103/PhysRevB.22.2099.
- Menssen et al. (2020) Menssen, A. J., Guan, J., Felce, D., Booth, M. J. & Walmsley, I. A. Photonic Topological Mode Bound to a Vortex. Phys. Rev. Lett. 125, 117401 (2020).
- Gao et al. (2020) Gao, X., Yang, L., Lin, H. & et al. Dirac-vortex topological cavities. Nat. Nanotechnol. 15, 1012–1018 (2020).
- Gao et al. (2019) Gao, P. et al. Majorana-like Zero Modes in Kekulé Distorted Sonic Lattices. Phys. Rev. Lett. 123, 196601 (2019).
- Ma et al. (2020) Ma, J., Xi, X. & Li, Y. t. Nanomechanical topological insulators with an auxiliary orbital degree of freedom. Nat. Nanotechnol. 15, 576–583 (2020).
- Li et al. (2019) Li, S.-Y., Zhang, Y., Yin, L.-J. & He, L. Scanning tunneling microscope study of quantum Hall isospin ferromagnetic states in the zero Landau level in a graphene monolayer. Phys. Rev. B 100, 085437 (2019).
- Coissard & et al (2022) Coissard, A. & et al. Imaging tunable quantum Hall broken-symmetry orders in graphene. Nature 605, 51–56 (2022).
- Liu et al. (2022) Liu, X. et al. Visualizing broken symmetry and topological defects in a quantum Hall ferromagnet. Science 375, 321–326 (2022).
- Lian & Goerbig (2017) Lian, Y. & Goerbig, M. O. Spin-valley skyrmions in graphene at filling factor . Phys. Rev. B 95, 245428 (2017). URL https://link.aps.org/doi/10.1103/PhysRevB.95.245428.
- Atteia et al. (2021) Atteia, J., Lian, Y. & Goerbig, M. O. Skyrmion zoo in graphene at charge neutrality in a strong magnetic field. Phys. Rev. B 103, 035403 (2021). URL https://link.aps.org/doi/10.1103/PhysRevB.103.035403.
- Ovdat et al. (2020) Ovdat, O., Don, Y. & Akkermans, E. Vacancies in graphene: Dirac physics and fractional vacuum charges. Phys. Rev. B 102, 075109 (2020).
- Ducastelle (2013) Ducastelle, F. Electronic structure of vacancy resonant states in graphene: A critical review of the single-vacancy case. Phys. Rev. B 88, 075413 (2013).
- Dutreix & et al (2019) Dutreix, C. & et al. Measuring the Berry phase of graphene from wavefront dislocations in Friedel oscillations. Nature 574, 219–222 (2019).
- Pereira et al. (2006) Pereira, V. M., Guinea, F., Lopes dos Santos, J. M. B., Peres, N. M. R. & Castro Neto, A. H. Disorder Induced Localized States in Graphene. Phys. Rev. Lett. 96, 036801 (2006). URL https://link.aps.org/doi/10.1103/PhysRevLett.96.036801.
- Yazyev & Helm (2007) Yazyev, O. V. & Helm, L. Defect-induced magnetism in graphene. Phys. Rev. B 75, 125408 (2007). URL https://link.aps.org/doi/10.1103/PhysRevB.75.125408.
- Wehling et al. (2007) Wehling, T. O. et al. Local electronic signatures of impurity states in graphene. Phys. Rev. B 75, 125425 (2007).
- Brihuega et al. (2008) Brihuega, I. et al. Quasiparticle Chirality in Epitaxial Graphene Probed at the Nanometer Scale. Phys. Rev. Lett. 101, 206802 (2008).
- Dutreix & Katsnelson (2016) Dutreix, C. & Katsnelson, M. I. Friedel oscillations at the surfaces of rhombohedral -layer graphene. Phys. Rev. B 93, 035413 (2016). URL https://link.aps.org/doi/10.1103/PhysRevB.93.035413.
- Dutreix et al. (2021) Dutreix, C. et al. Measuring graphene’s Berry phase at T. Comptes Rendus. Physique 22, 133–143 (2021).
- Katsnelson (2020) Katsnelson, M. I. The Physics of Graphene (Cambridge University Press, 2020), 2 edn.
- Clar (1983) Clar, E. The Aromatic Sextet (Springer Netherlands, Dordrecht, 1983).
- Balaban (2009) Balaban, Alexandru and Klein, D. J. Claromatic Carbon Nanostructures. J. Phys. Chem. C 100, 19123–19133 (2009).
- Mao & et al. (2016) Mao, J. & et al. Realization of a tunable artificial atom at a supercritically charged vacancy in graphene. Nat. Physics 12, 545–550 (2016).
- González-Herrero et al. (2016) González-Herrero, H. et al. Atomic-scale control of graphene magnetism by using hydrogen atoms. Science 352, 437–441 (2016).
- Lieb (1989) Lieb, E. H. Two Theorems on the Hubbard model. Phys. Rev. Lett. 62, 1201 (1989).
- Varchon et al. (2008) Varchon, F. m. c., Mallet, P., Magaud, L. & Veuillen, J.-Y. Rotational disorder in few-layer graphene films on : A scanning tunneling microscopy study. Phys. Rev. B 77, 165415 (2008). URL http://link.aps.org/doi/10.1103/PhysRevB.77.165415.
- SM (????) our supplementray materials (????).
- Soler et al. (2002) Soler, J. M. et al. The SIESTA method for ab initio order-N materials simulation. J. Phys.: Condens. Matter 14, 2745 (2002). URL https://doi.org/10.1088/0953-8984/14/11/302.
- Perdew & Zunger (1981) Perdew, J. P. & Zunger, A. Self-interaction correction to density-functional approximations for many-electron systems. Phys. Rev. B 23, 5048–5079 (1981). URL https://link.aps.org/doi/10.1103/PhysRevB.23.5048.
Methods
Samples and STM measurements
The samples were grown by thermal decomposition of the carbon-face SiC at temperatures close to 1150∘ in ultrahigh vacuum.Varchon et al. (2008) Silicon evaporation results in several graphene layers decoupled by rotational disorder. Hydrogen atoms were then deposited by thermal dissociation of hydrogen gas in a custom atomic hydrogen source as described previously.González-Herrero et al. (2016) STM images were obtained in the constant current mode in a custom ultrahigh vacuum setup at 5 K.
Tight-binding calculations
The nearest-neighbor tight-binding Hamiltonian of graphene is expressed as
| (2) | ||||
where the nearest-neighbor hopping integral eV. The TB calculation is carried out with periodic boundary conditions, with the hydrogen adatom modelled as a large on-site potential (). The supercell size of unit cells of graphene was used to reduce the spurious effects due to the mutual interference between the periodic images of adatoms.
The information about the phase difference between wavefunction amplitudes on the nearest-neighbor sites, that is the bond order, is needed in order to describe the Kekulé order. We define the bond parameter as the LDOS between two neighboring atoms . On the basis of TB model, we consider the wave function as the product of the TB eigenvector and an envelope function , taking the middle point between the atoms LDOS writes
| (3) |
in which the inner product governs the modulation of bond order. Therefore, we use the orbital overlap as the bond-order operators in the TB calculation. In the presence of a scattering center, is perturbed by the inter-sublattice Green’s functions and (See SM SM (????)), since the atoms connected by the bond are in different sublattices. The bond order is plotted by integrating the LDOS from 0 to 300 meV.
DFT calculations
First-principles calculations were performed using the SIESTA code Soler et al. (2002). We use the double- plus polarization localized orbital basis set combined with the local density approximation exchange-correlation functional Perdew & Zunger (1981). The energy shift for constructing the localized orbital basis functions was set to 275 meV, and the real-space cutoff to 250 Ry. The structural relaxation was performed using the conjugate gradient method.
The simulated STM images were produced using the plstm module of the SIESTA package, as a post-processing step following the DFT calculations. The images were simulated from LDOS at a constant height of 2.5 Bohrs above the graphene plane.
Acknowledgements
V.T.R. acknowledges the support from the ANR Flatmoi project (ANR-21-CE30-0029). Y.G. and O.V.Y. acknowledge support from the Swiss National Science Foundation (grant No. 204254). Computations were performed at the Swiss National Supercomputing Centre (CSCS) under projects No. s1146 and the facilities of the Scientific IT and Application Support Center of EPFL. C.D. acknowledges the support from Quantum Matter Bordeaux and the SMR department under the projects TED and CDS-QM. I.B. acknowledges the support from the “(MAD2D-CM)-UAM” project funded by Comunidad de Madrid, by the Recovery, Transformation and Resilience Plan, and by NextGenerationEU from the European Union, the Spanish Ministry of Science and Innovation (Grant PID2020-115171GB-I00) and the Comunidad de Madrid NMAT2D-CM program under grant S2018/NMT-4511
Author contributions
H.G.-H., M.M.U. and I.B. performed the experiments under the supervision of I.B.. V.T.R. discovered the Kekulé vortex. Y.G. performed DFT and TB calculations under the supervision of O.V.Y. Y.G. and C.D. performed Green’s function calculations. M.I.K. gave technical support and conceptual advice. Y.G., C.D., O.V.Y. and V.T.R. wrote the manuscript with the input of all authors. V.T.R. coordinated the collaboration.