Our Model Achieves Excellent Performance on MovieLens: What Does it Mean?
Abstract.
A typical benchmark dataset for recommender system (RecSys) evaluation consists of user-item interactions generated on a platform within a time period. The interaction generation mechanism partially explains why a user interacts with (e.g., like, purchase, rate) an item, and the context of when a particular interaction happened. In this study, we conduct a meticulous analysis on the MovieLens dataset and explain the potential impact on using the dataset for evaluating recommendation algorithms. We make a few main findings from our analysis. First, there are significant differences in user interactions at the different stages when a user interacts with the MovieLens platform. The early interactions largely define the user portrait which affect the subsequent interactions. Second, user interactions are highly affected by the candidate movies that are recommended by the platform’s internal recommendation algorithm(s). Removal of interactions that happen nearer to the last few interactions of a user leads to increasing difficulty in learning user preference, thus deteriorating recommendation accuracy. Third, changing the order of user interactions makes it more difficult for sequential algorithms to capture the progressive interaction process. Based on these findings, we further discuss the discrepancy between the interaction generation mechanism that is employed by the MovieLens system and that of typical real world recommendation scenarios. In summary, models that achieve excellent recommendation accuracy on the MovieLens dataset may not demonstrate superior performance in practice for at least two kinds of differences: (i) the differences in the contexts of user-item interaction generation, and (ii) the differences in user knowledge about the item collections.
1. Introduction
The rapid growth of digital platforms and data-driven services in recent years has given rise to a thriving recommendation system landscape, fueled by the continuous development and refinement of algorithms to meet the diverse needs of users. With an ever-increasing volume of data at their disposal, these algorithms leverage sophisticated techniques, such as collaborative filtering (Deshpande and Karypis, 2004; Cremonesi et al., 2010), sequence-aware recommendation (Kang and McAuley, 2018a; Hidasi et al., 2016), and deep learning (Liang et al., 2018; Wu et al., 2016; He et al., 2017), to provide users with highly personalized and relevant content.
However, alongside the undeniable benefits, concerns surrounding the proper evaluation of recommendation algorithms remain vital issues to address as the technology continues to advance. The evaluation of recommendation algorithms faces a multitude of challenges, primarily arising from the difficulties in reproducing results and the lack of uniform standards for comparison. For reproducibility, Ferrari Dacrema et al. (2019) report that many algorithms have difficulty reproducing the results they show in their original papers, and some algorithms can be defeated by simpler algorithms. The absence of a unified set of evaluation metrics and methodologies compounds these challenges, as it hampers the ability to conduct fair and accurate comparisons between different algorithms. For example, to speed up assessment, sampled metrics evaluate algorithms based on selected negative samples. However, the results obtained from sampled metrics may be misleading, as it is inconsistent with the results of full rank (Krichene and Rendle, 2022). Accordingly, the community has witnessed a number of efforts (Sun et al., 2020; Zhao et al., 2022) to establish standardized evaluation protocols and to ensure that advancements in the field are grounded in reliable and reproducible research. However, standardized evaluation protocols are meaningful only if the datasets used for the evaluations are meaningful and representative. In other words, a good understanding of each benchmark dataset used for evaluation is critical, e.g., to what extent a benchmark dataset represents a recommendation scenario, and what scenario. If a dataset well represents a practical recommendation setting, then we can expect the algorithm stands for a good chance of achieving similar performance in practice as on the dataset.
Indeed, researchers recently start to focus on an often overlooked aspect of the recommender system evaluation: the benchmark dataset. Specifically, the characteristics of a dataset can significantly impact the performance of various algorithms obtained on the dataset (Chin et al., 2022). Schnabel et al. (2016) explore the selection bias in implicit feedback datasets, which arises from users’ selective exposure to items. Our study expands on previous studies on dataset analysis and attempts to explore a different perspective: to what extent do we understand the user-item interaction generation mechanisms of a dataset? The findings made along this perspective help us to better understand model performance on the dataset, and make better expectations of model performance in practical settings.
To this end, we have conducted a comprehensive and in-depth case study on the MovieLens dataset, arguably the most widely used benchmark dataset in the recommendation research community (Sun et al., 2020; Chin et al., 2022). Our analysis is conducted in three steps.
First, we conduct a literature survey, combined with our own user experiences interacting with the MovieLens platform, to gain insights into the user-item interaction generation mechanisms of the platform. The movie ratings are collected through a progressive interaction process. In particular, interactions for most users on MovieLens are collected within a very short time period (e.g., within a single day for about half of all users). The interactions from every user are much affected by the candidate movies listed on the recommended web pages at different stages during this progressive interaction collection process. The pool of candidate movies in the recommended page expands along the deepening of user interaction, thus causing differences in the recorded user interactions in different stages. Among them, the initial set of user interactions largely defines a user portrait, which affects the types of movies to be rated by this user.
Second, based on our comprehension of the user-item interaction generation mechanism, we design experiments to capture the potential impact of the data characteristics to the performance of recommendation algorithms. Specifically, we conduct ablation experiments on the raw data by masking out interactions at different stages of user interactions, and observe the performance changes of recommendation algorithms. The performance drop of the algorithm is most pronounced when we mask out the interactions that are closer to the predicted interaction. Following early studies, we also perform data shuffling on the rating sequences. The signal of causality between interactions introduced by the internal data collection mechanism of MovieLens is the main reason why sequential recommendation algorithms perform well on this dataset.
Finally, based on the findings, we discuss the discrepancy between the user-item interaction generation mechanisms of the MovieLens dataset and that of practical scenarios. Specifically, we discuss two kinds of differences. The first type of difference is the contexts of user-item interaction generation. On a typical practical recommendation platform, a user may consider many factors before an interaction happens, e.g., the monetary cost for purchasing a product or the time cost of watching a video. However, on MovieLens, the rating interaction is a record of what happened in the past e.g., watched a movie at somewhere on someday. That’s why nearly half of the users are able to record a good number of ratings within a single day on MovieLens. The decision-making process is very different. The second type of difference is the user knowledge about the item collections. We would expect most users to have a reasonable understanding of different movie genres like action, comedy, and romance, as well as a few key attributes like director and actors. The same applies to recommendation settings for books and music. However, it is unreasonable to assume that most users have a good understanding of all kinds of products available on Amazon or eBay. The information gap between users and the item collection may affect user behavior. Accordingly, models that achieve good performance on MovieLens may not show the same under a recommendation scenario where users have limited knowledge about the item collections.
In summary, our work highlights the non-negligible role of datasets for model generalization and evaluation. To the best of our knowledge, this is the first attempt to design evaluation experiments and explain algorithm performance from the perspective of the interaction generation mechanism of a dataset. Based on our findings, we argue that the context of decision makings for users when interacting with the MovieLens platform could be very different from many other kinds of decision makings when users interact with a recommender platform. As a model is trained to learn the underlying patterns from a given dataset, the recommenders that achieve excellent performance on the MovieLens dataset may not show a competitive advantage in many real-world settings.
2. The MovieLens Interaction Generation Mechanism
In this section, we first brief the process of collecting user-movie ratings on the MovieLens platform, then provide an initial analysis on the dataset.
2.1. Data Collection Mechanism
The MovieLens dataset was initially introduced by the GroupLens research team in 1998. The interactions (i.e., user ratings on movies) originate from the MovieLens recommendation platform, which aims to offer personalized movie recommendations based on users’ preferences and viewing history. Over the years, the MovieLens platform has gone through a few versions to incorporate new features, improve user experience, and adapt to advancements in technology and recommender systems research. In 2015, the team published a paper (Harper and Konstan, 2015) detailing the key transformations the platform underwent, which subsequently impact the resultant datasets. Specifically, the platform’s intrinsic recommendation mechanism comprises two primary components: preference elicitation (Chang et al., 2015), and recommendation algorithm selection (Ekstrand et al., 2015). To ensure the consistency in user-item interaction collection context (hence the sampled data used in our experiments), we focus on the latest version (V4) of the MovieLens platform.
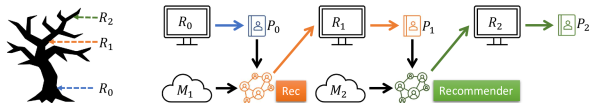
The core user feedback on MovieLens is user ratings of movies that are recommended by the platform. The platform updates a user’s portrait by capturing the user’s ratings on a list of recommended movies in a web page. Then, the platform generates a new list of recommended movies in the next page for the user to rate, and the process repeats. The interaction generation mechanism between a user and the platform can be divided into three main stages: group-based preference elicitation (), item-based preference elicitation (), and recommendation with preferred algorithm (). Figure 1 provides an illustration of the three stages.
2.1.1. Group-based preference elicitation
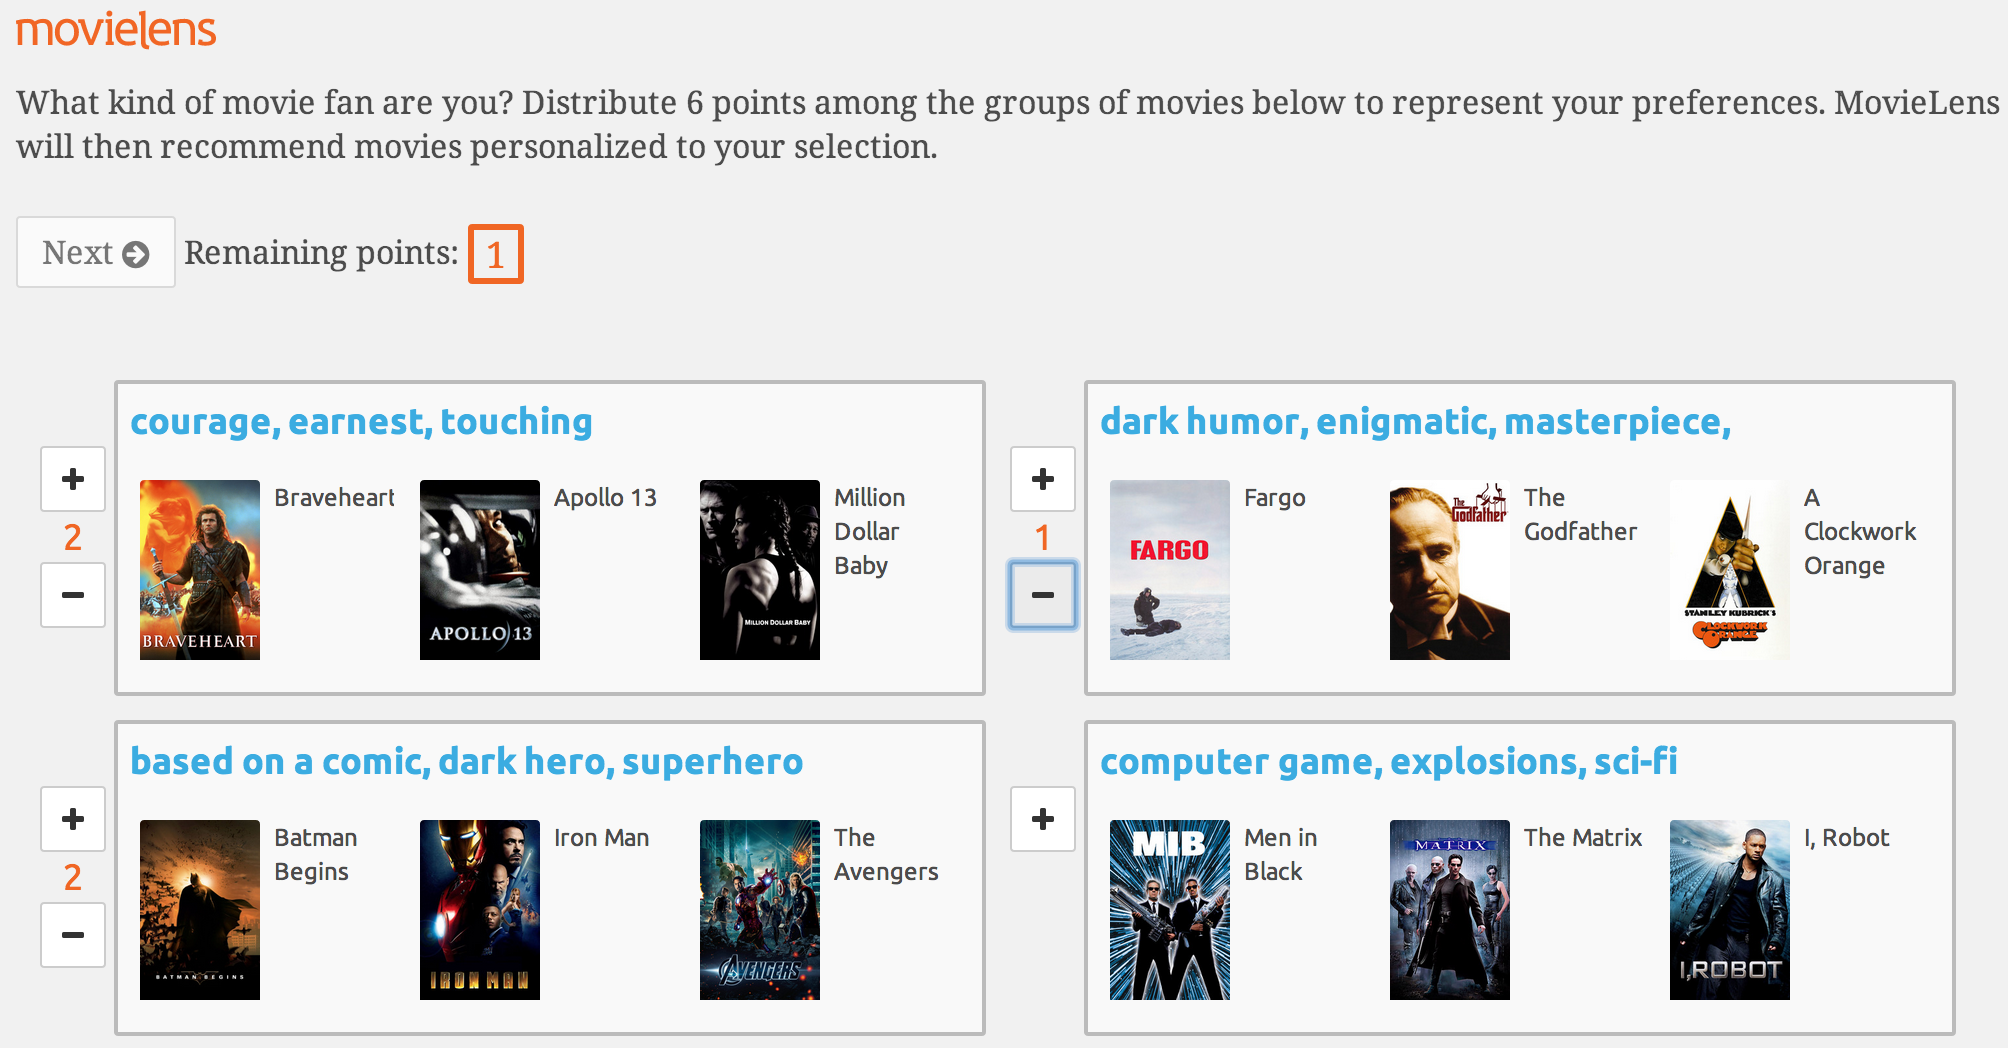
In the initial phase (), when a new user registers on the platform, he/she is prompted to express his/her preferences on different movie groups by assigning points to each group (see Figure 2(a)). The assigned points help to establish the initial pseudo-rating profile of a user e.g., a user likes action movies more than documentary movies. Utilizing the pseudo-rating profile, the MovieLens main page displays a list of personalized recommendations from a restricted pool of representative movies, denoted by , mostly well-known movies.
2.1.2. Item-based preference elicitation
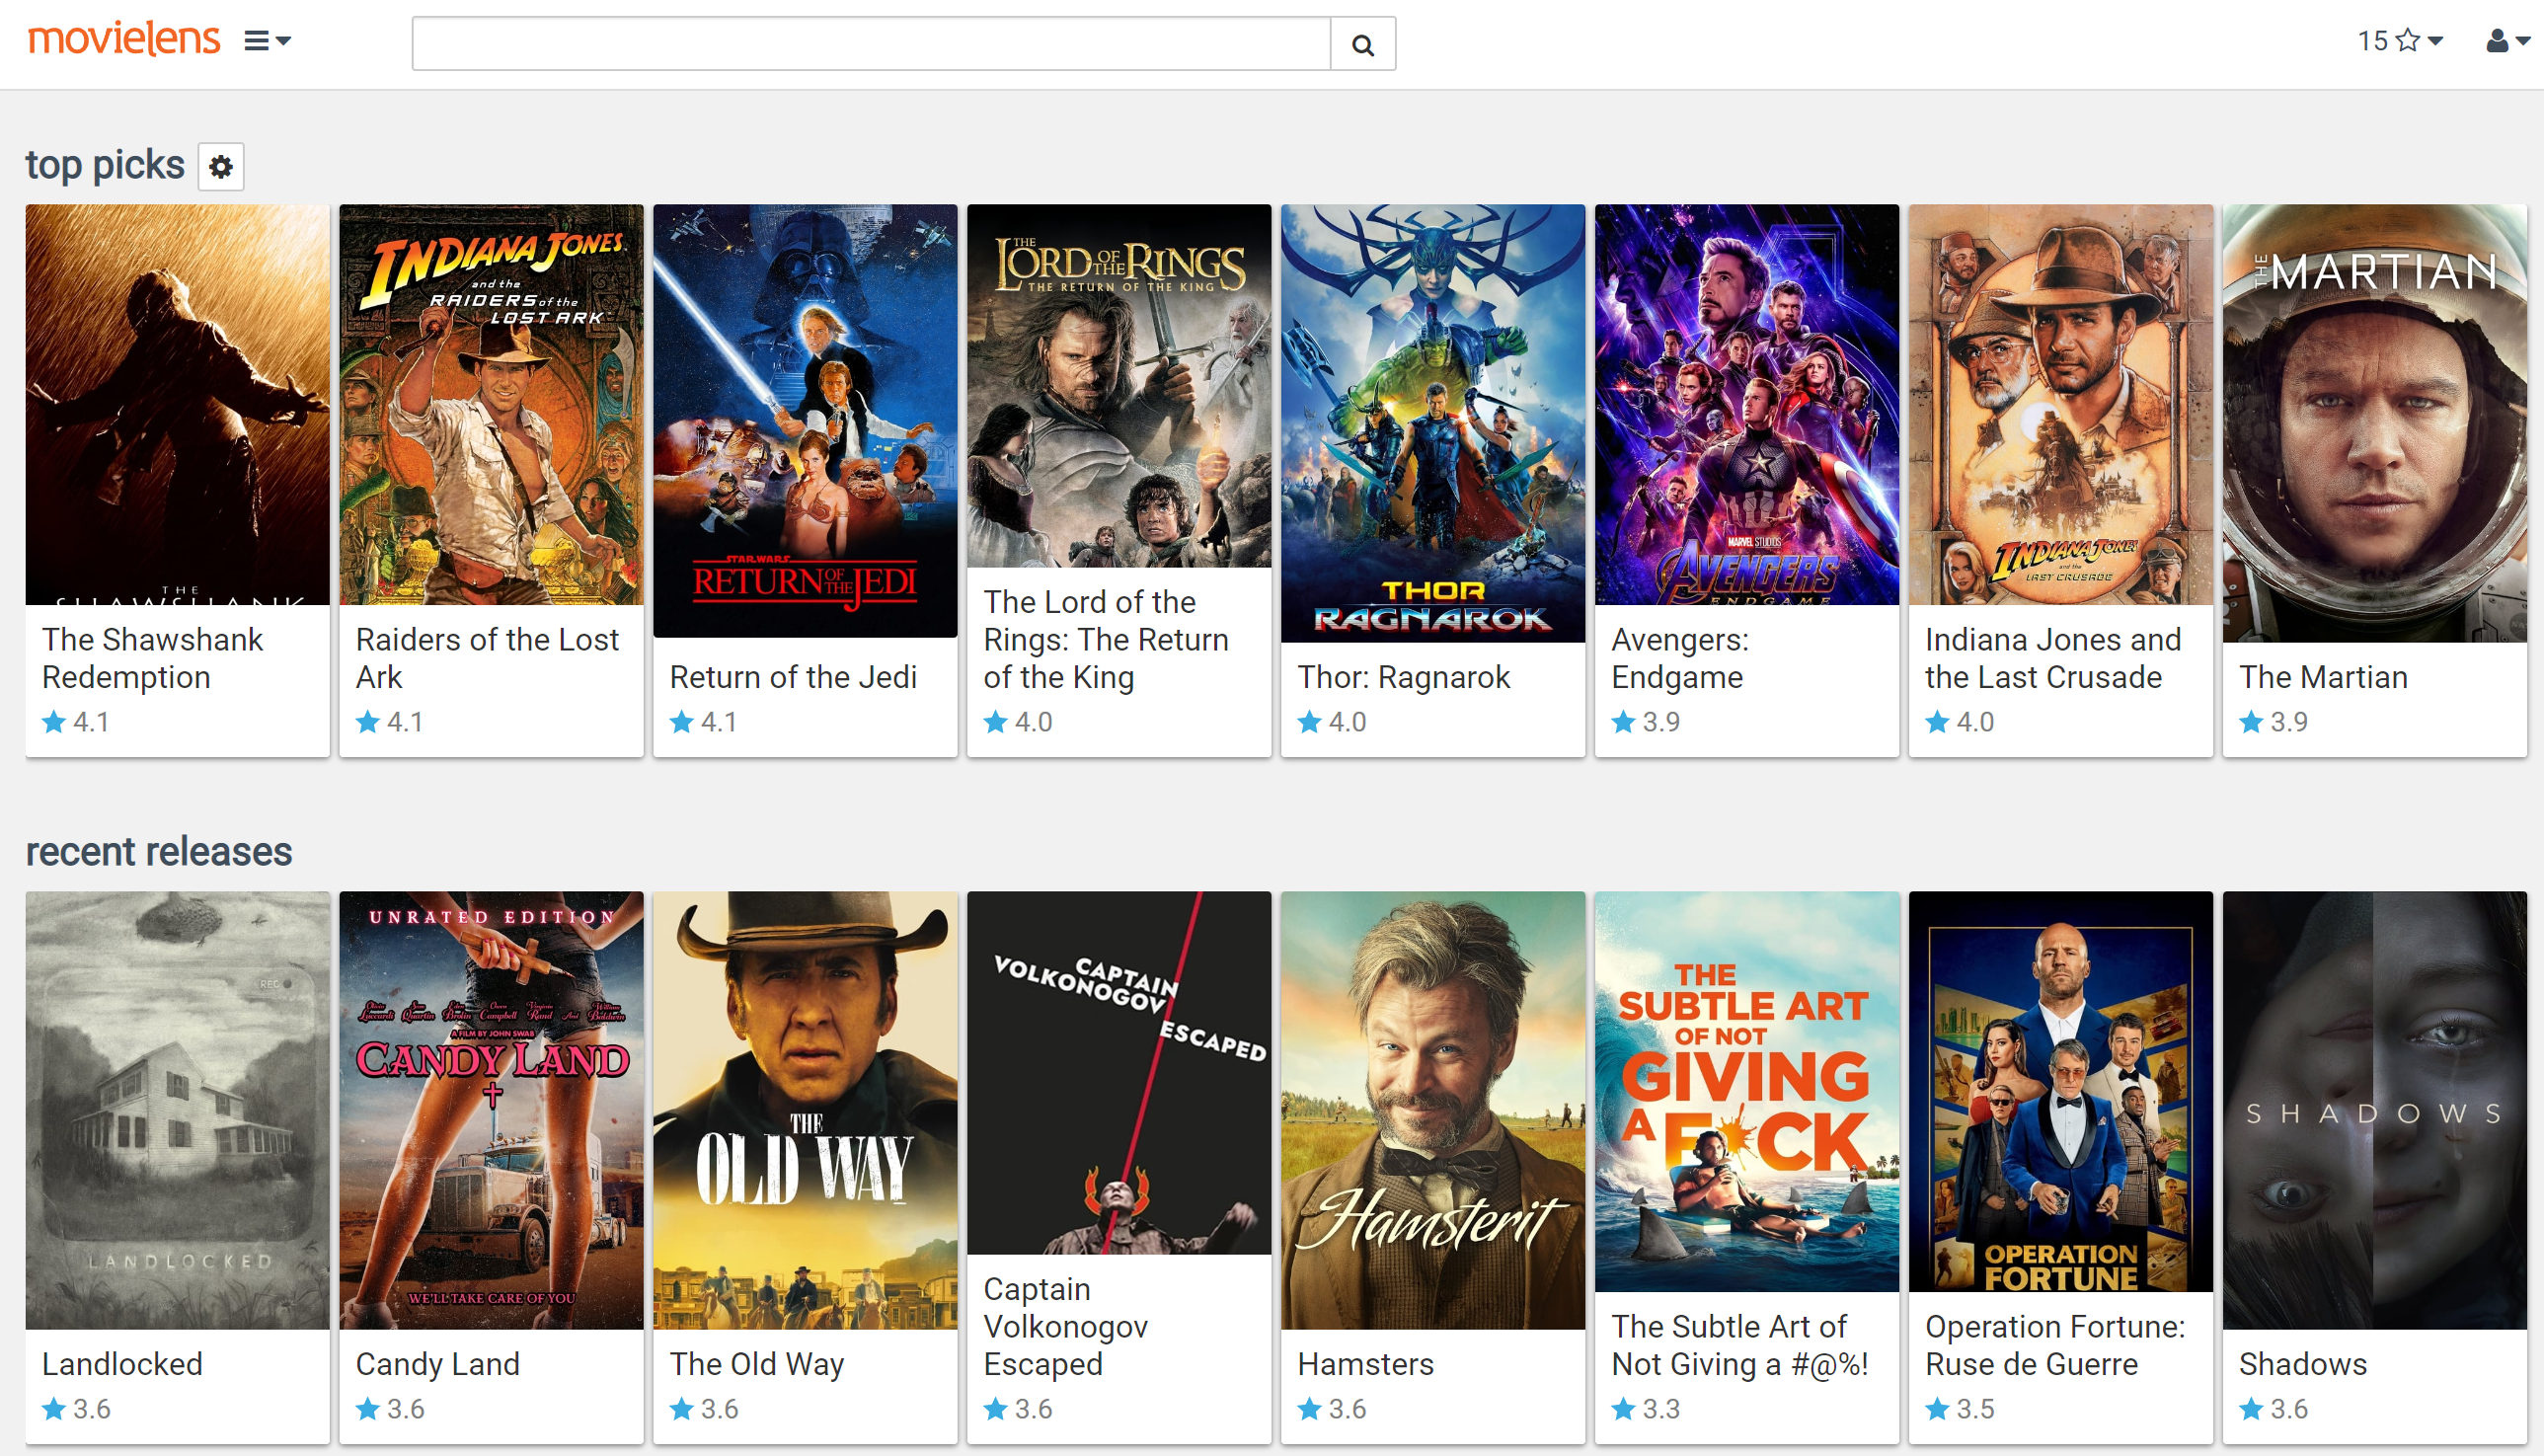
In the second stage (), the platform seeks to obtain more fine-grained user preferences by prompting users to rate individual movies from the initial personalized recommendation list (see Figure 2(b)). MovieLens requires users to surpass a certain number of ratings (i.e., 15 movies) before they can access the full-scaled system ().
2.1.3. Recommendation with preferred algorithm
At stage , MovieLens allows users to choose their preferred recommendation algorithm; consequently users can continue to rate movies among the recommended titles in an iterative manner e.g., submitting ratings of recommended movies shown on the current web page, and receiving the next list of recommended movies to rate on the next web page. The movies recommended are from , a much larger pool of movies than .
The platform offers four distinct algorithms: (1) a non-personalized algorithm to recommend movies with the highest average ratings; (2) the same Pick-Groups recommender in ; (3) an Item-Item recommender to use cosine similarity on item-mean-centered rating vectors for recommendations; (4) an SVD recommender which utilize the FunkSVD algorithm (Paterek, 2007) to capture latent patterns among the collected user-item interaction data. If a user does not choose any preferred recommendation algorithm, the default choice is Algorithm (3), i.e., an item-item recommender.
Note that, prior to Version 4, MovieLens recommended movies for users to rate strictly based on user-personalized predicted values, by its underlying collaborative filtering algorithms. With Version 4, the platform incorporates a popularity factor alongside the predicted values, in the final recommendations.
| (1) |
Specifically, the final rank score of a movie is a linear combination of its predicted rank score by a recommender and its popularity score , where is derived based on the number of ratings a movie received in the past year. Here, the function normalizes its input to with 1 being highest rank.
2.2. The MovieLens1518 Dataset
As aforementioned, the MovieLens platform went through different versions. Hence, the interaction mechanism between users and the platform changes accordingly, which may affect the resultant data collected. To minimize the potential impact of different versions, we extract user interaction data from the last four years (2015-2018) in the MovieLens-25M dataset, then remove duplicates. Note that, MovieLens-25M was released in 2019 and is currently the most recent and largest dataset ever released by GroupLens.111https://grouplens.org/datasets/movielens/ The reason for selecting the interactions that happened in 2015-2018 is that the new UI design and new recommendation engine (i.e., Version V4) were deployed on MovieLens in 2015. Since then, the MovieLens platform’s version consistency is maintained. As a result, from the released MovieLens-25M dataset, we curate a subset for this study and we name it the MovieLens1518 dataset, for having user-item interactions that were recorded during the four years from 2015 to 2018. Th MovieLens1518 dataset contains about 4.2 million user-item interactions (see Table 1).
In the curated MovieLens1518 dataset, we only retain ratings from the users whose entire rating history falls within the 4-year period. This is to guarantee a comprehensive view of every user in this newly curated dataset. In addition, we remove the less active users who have fewer than 35 interactions with MovieLens, from the collected data. By setting 35 interactions as a threshold, we have good information about users’ behaviors in the stage (i.e., 15 movie ratings) and also the subsequent stages (i.e., at least another 20 movie ratings). Note that, in the original MovieLens-25M dataset, each user has at least 20 ratings. In our analysis, we consider the first 15 ratings to be different from the rest because these 15 ratings obtained in stage are from a smaller pool of candidate movies (i.e., in Figure 1).
| Dataset | #Users | #Items | Avg #Ratings per user | Avg #Ratings per item | #Interactions |
|---|---|---|---|---|---|
| MovieLens1518 | 24,812 | 36,378 | 170.3 | 116.2 | 4.2M |
The four yearly subsets.
In a typical RecSys evaluation, a dataset is used as a whole without considering when the user-item interactions occur, in other words, the global timeline of user-item interactions (Ji et al., 2023). The internal recommendation considers the popularity score of movies in the past year. We follow the same time scale and set the evaluation time window as one year and conduct independent comparative experiments year by year, from 2015 to 2018. That is, we divide the MovieLens1518 into 4 subsets according to the global timeline, each subset for ratings made in one year, from 2015 to 2018. The data partition is based on a user’s last rating. That is, if a user’s last rating is in Year 2016, then all of this user’s ratings belong to the 2016 subset, regardless of whether some of the earlier ratings are made in 2016 or earlier. As most users complete all their ratings in a few days, most ratings are indeed made in the indicated year. For the completeness of the experiments, we also report the results obtained on the entire 4-year data when necessary.
3. Analysis on the MovieLens1518 Dataset
We start with the analysis on the MovieLens1518 dataset from user perspective.
Finding 1.
On MovieLens platform, a user typically complete all movie ratings within a very short time period, from a single day to a few days.
We observe that 49.19%, or nearly half of all users, complete all their ratings within a single day. More than 85.6% of all users complete all their ratings within 5 days. And in many cases, a few ratings from the same user are recorded within a few seconds. In some extreme cases, the ratings are recorded with the same timestamp, making it difficult to determine the order of interactions. Specifically, in MovieLens1518, 7.53% of interactions share the same timestamp as another interaction in the same user rating sequence.
Note that, this observation is not new. Similar observations on MovieLens dataset temporal patterns are also made by Woolridge et al. (2021). In fact, the creators of the dataset also expressed concerns about the value of timestamps in their 2015 paper (Harper and Konstan, 2015). While this observation is not new, it is worth mentioning here that MovieLens only records user ratings of movies, but not when or where the user interacts with a particular movie. In other words, the rating of a movie is based on a user’s memory after he/she has watched the movie before interacting with MovieLens.
3.1. Item-based Receptive Field Expansion
| Year | #User | Receptive field (#Movies) at different stages | |||||
|---|---|---|---|---|---|---|---|
| 1-15 | 16-30 | 31-45 | 46-60 | 61-75 | 76-90 | ||
| 2015 | 2544 | 2240 | 2919 | 3470 | 3851 | 4136 | 4468 |
| 2016 | 3619 | 2799 | 3385 | 3898 | 4173 | 4503 | 4811 |
| 2017 | 3529 | 3312 | 3876 | 4257 | 4415 | 4694 | 4919 |
| 2018 | 3599 | 3690 | 4088 | 4491 | 4692 | 4937 | 5250 |
| Year | Intersection over Union | ||||
|---|---|---|---|---|---|
| 15 vs 30 | 30 vs 45 | 45 vs 60 | 60 vs 75 | 75 vs 90 | |
| 2015 | 0.4050 | 0.4735 | 0.4950 | 0.5251 | 0.5269 |
| 2016 | 0.4035 | 0.4610 | 0.5016 | 0.5112 | 0.5211 |
| 2017 | 0.3866 | 0.4456 | 0.4693 | 0.4848 | 0.4936 |
| 2018 | 0.3850 | 0.4296 | 0.4653 | 0.4821 | 0.4854 |
From the data collection mechanism shown in Figure 1, for a given user, the pool of candidate movies that a user can rate changes at different stages. We borrow the concept of ”receptive field” to understand the MovieLens dataset. In Convolutional Neural Networks (CNNs), the receptive field of a neuron refers to the size or extent of the region in the input that affects the output of that neuron. Essentially, it’s the area of the image that a neuron ”sees” or processes. In our context, we can think of the ”receptive field” as the pool of candidate movies that a user interacts with at different stages during their interaction with MovieLens.
To facilitate meaningful comparisons across different user interaction stages, it’s important to maintain a constant number of interactions at each stage, analogous to one layer in CNN. We fix the number to 15. Based on the median number of interactions per user is 98, we use 90 (the closest multiple of 15) as a filter, to ensure we have a good number of users to be included in this study. Accordingly, users who have at least 90 interactions are used in this study.
Table 2 reports users’ receptive fields in a matrix format. The reported ”receptive field” is the number of unique movies that are ever rated by all users during that stage (e.g., from the 16th rating to the 30th rating for stage 16-30).
Finding 2.
Along the interaction progresses, e.g., from the stage of 1-15 to the stage of 76-90, users are provided with a broader range of movies to rate, leading to continually expanding their receptive field.
This observation holds on all four years. Further, for a given stage e.g., 1-15, the receptive field increases over time from 2015 to 2018, as more movies are released over time. We further use Intersection over Union (IoU) as the similarity metric to measure the overlap between two receptive fields, reported in Table 3.
Finding 3.
There is a growing degree of overlap of receptive fields among different stages of user interactions, from the initial stage of 1-15 to the last stage of 76-90. This signifies that the divergence in user preferences is more prominent in the initial and intermediary stages of the interactions.
The later stages of user interactions are gradually approaching the threshold of the system’s candidate items. From 2015 to 2018, the receptive field increases for any given particular stage from 1-15 to 76-90. Accordingly, the IoU of receptive fields at consecutive stages drops slightly along the year dimension.
3.2. Group-based Preference Invariance
We now focus on the possible user preference changes during the interaction.
Finding 4.
While the user’s receptive field expands during the interaction process, their group-based preferences are relatively fixed.
Recall that in , user assigns points to different movie groups, based on which, users complete the first 15 ratings in . Accordingly, the genres of these 15 movies are expected to be highly focused, e.g., similar to the groups of movies assigned with higher points. Among the first 15 ratings of each user, we derive the top 3 genres that the user is most interested in. The result shows that nearly 90% of the first 15 rated movies belong to 3 genres they are most interested in, across the four years from 2015 to 2018 (see Table 4).
| Year | First 15 ratings | Last 15 ratings |
|---|---|---|
| 2015 | 0.8961 | 0.7464 |
| 2016 | 0.9072 | 0.7435 |
| 2017 | 0.8957 | 0.7322 |
| 2018 | 0.8912 | 0.7253 |
Further, we calculate the probability of each user’s last 15 ratings having movies belonging to the same three genres, to find out the possible preference changes after so many more ratings. Note that, the pool of movies that appear in the last 15 ratings is nearly double the size of that in the first 15 ratings. Reported in Table 4, more than 70% of the last 15 rated movies fall in the top 3 genres that users are initially interested in.222We have also conducted experiments to study the impact of the number of ratings a user has, to the ratio of the last 15 movies belonging to the top 3 genres. The results show that the ratios range from 67.4% to 70.7% in different years, for the top 25% users having the most number of ratings. These numbers are not far away from the 70% reported in Table 4. In other words, the number of ratings a user has does not impact user conformity to the top interested genres.
4. Experiments
In this section, we design experiments to investigate the impact of the interaction collection process to recommender models. We first present the baseline models and evaluation metrics used in our empirical analysis. Note that, as the train/test instances change as required by the experimental setting, we will detail the train/test split under each set of experiments.
4.1. Baseline and Evaluation Metric
We select five widely used baselines from four categories: (1) memory-based methods i.e., MostPop and ItemKNN (Deshpande and Karypis, 2004); (2) latent factor method PureSVD (Cremonesi et al., 2010) ; (3) non-sampling deep learning method Multi-VAE (Liang et al., 2018); and (4) sequence-aware deep learning method SASRec (Kang and McAuley, 2018b). More specifically, MostPop is a non-personalized method that recommends items based solely on their popularity. In our experiments, we follow the widely adapted popularity definition, to indicate an item’s popularity by the number of interactions it receives in training set, i.e., within one year in the four yearly datasets, and within four years for the entire dataset. ItemKNN is a collaborative filtering algorithm that focuses on finding similar items based on users’ past interactions. It is an extension of the K-Nearest Neighbors (KNN) algorithm, specifically tailored for recommendation systems. PureSVD is a matrix factorization technique used for recommendation systems, which decomposes a user-item interaction matrix into three smaller matrices: user factors, singular values, and item factors. MultiVAE is a deep learning-based recommendation algorithm that leverages the power of variational autoencoders (VAEs) to learn latent representations of users and items. Lastly, the self-attention-based sequential model (SASRec) is chosen as a representative model to discover meaningful sequential patterns.
Implementation and Parameter Setting
Non-sequential recommendation algorithms are supported by the open-source recommendation library DaisyRec 2.0 (Sun et al., 2022), enabling the reproduction of all running details and studied settings. We used the implementation in DaisyRec. To search for optimal hyper-parameters for all non-sequential recommendation algorithms, Bayesian HyperOpt is employed to optimize the hyper-parameters concerning NDCG@10 for each non-sequential baseline on the dataset over the course of 30 trials (Ferrari Dacrema et al., 2019).
For SASRec, the only sequential recommendation model, our implementation is based on a PyTorch version,333https://github.com/pmixer/SASRec.pytorch and we follow the hyperparameter settings in the original SASRec paper (Kang and McAuley, 2018b). We terminate SASRec training if validation performance does not further improve for 20 epochs.
Evaluation Metrics.
HR@ and NDCG@ are the two metrics used to evaluate the effectiveness of ranked results in our experiments. HR@k focuses solely on whether the relevant items present among the top recommended items, while NDCG@k takes into account both the presence and ranking of the relevant items within the top- results. As suggested by (Krichene and Rendle, 2022), we use the full-rank version of both metrics. That is, we rank all candidate items, instead of sampling a fixed number of negative items for ranking. The number of the top recommended items is set to 10.
4.2. Impact of Interaction Context at Different Stages
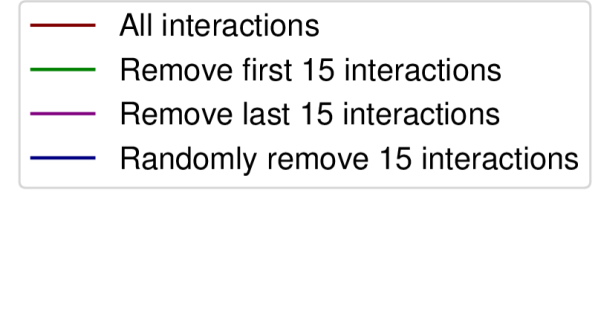
In view of the observations made from our earlier analysis, the first ratings of a user shall be treated differently from the subsequent interactions, when exploring recommendation models on MovieLens dataset. Accordingly, we conduct an ablation experiment with the removal of the first ratings of each user in the MovieLens1518 dataset. For comparison, we also report the results of removing randomly sampled ratings, and the removal of the last ratings from a user’s training instances, respectively. For the experiments that randomly remove ratings, we repeat the experiments three times with different seeds and get the average recommendation performance to reduce random error. In this set of experiments, we follow the leave-last-one-out data partition scheme. The removal of ratings only applies to the training set, for all three types of removal. We keep the validation set (the penultimate interaction) and the test set (the last interaction) unchanged for a fair comparison.
Finding 5.
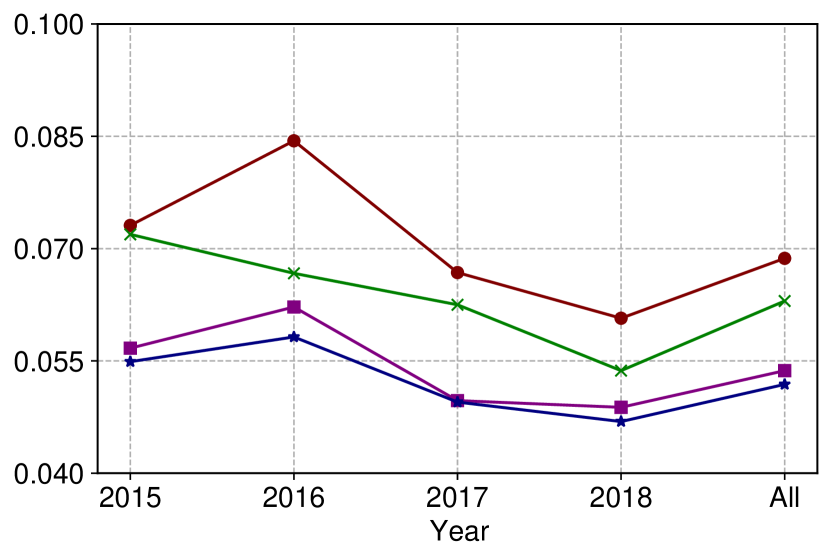
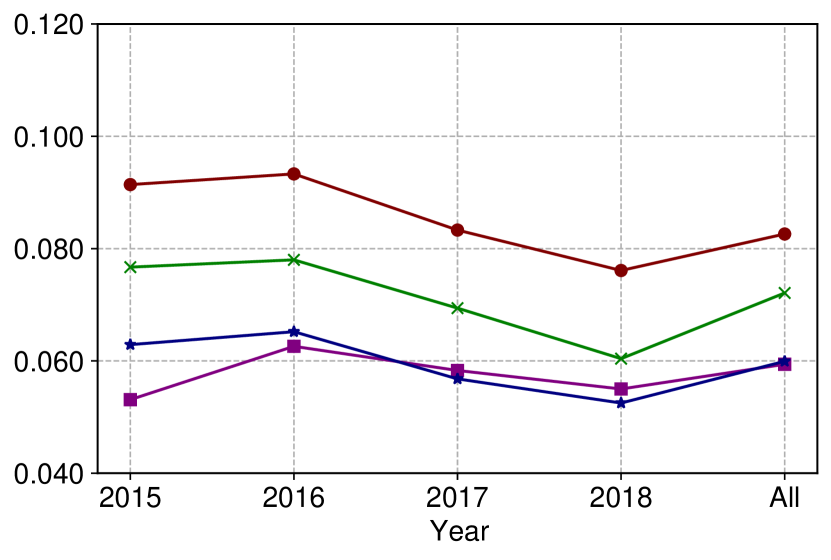
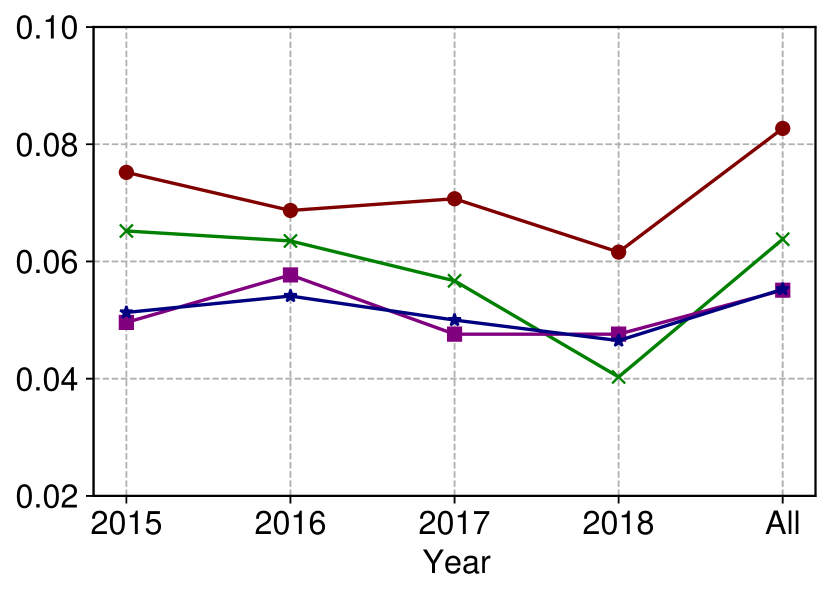
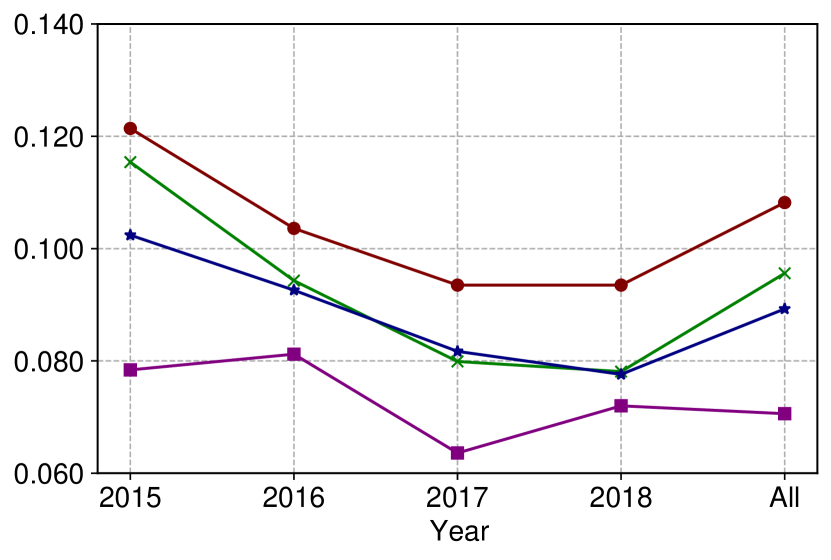
In general, recommendation accuracy drops when interactions are removed from the training set. The amount of drops in performance vary, depending on the types of interactions removed.
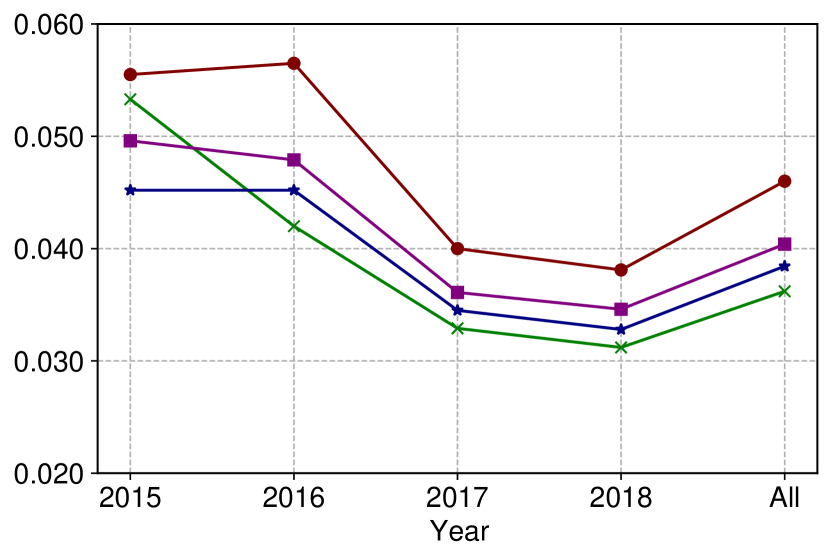
According to the HR@10 scores plotted in Figure 3, the removal of interactions leads to a decrease in recommendation accuracy on all baselines. It is understandable, because partial information is lost due to the removal of training data. For ItemKNN, SVD and Multi-VAE, the drops in HR@10 are larger for the removal of the last interactions and the removal of the randomly sampled interactions, compared to the removal of the first interactions. Meanwhile, the drops in recommendation accuracy is comparable for the removal of the last and that of the random interactions. When it comes to SASRec, the drop in HR@10 when removing the last 15 interactions is more pronounced.
Observe that, in Figure 3, we plot the results on the four yearly subsets, as well as the full dataset denoted by ”All”. In general, on the yearly subsets, all baselines show a degradation trend in performance, as the candidate movie pool becomes larger from 2015 to 2018. For most baselines, except Multi-VAE, results on the full dataset are close to the average of the four yearly subsets. Multi-VAE achieves the best results on the full dataset.
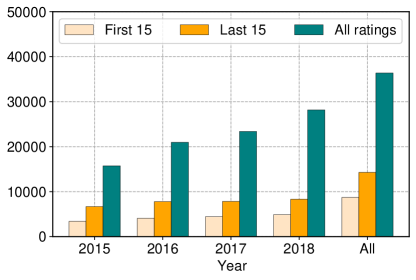
In Figure 4, we plot the number of unique movies that ever appear in a user’s first 15 ratings, last 15 ratings, and all ratings, by year, in the MovieLens1518 dataset. The number of movies in each category is an indication of the ”receptive field” in the recommendation. The significant differences in size between the pools of movies for the first 15 ratings and the last 15 ratings are consistent with the previous observation of receptive field inflation. It also corroborates the MovieLens platform operator’s description of the ”Item-based Preference Elicitation” stage (): The recommender for new MovieLens users, which uses movie group selection at to determine which movies to recommend, only recommends from a restricted pool of movies.
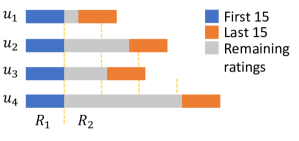
Before we further analyze the impact of stage on recommendation system evaluation, it is necessary to revisit the problem of interaction context misalignment that existed in the previous ablation experiments. In Figure 5, we highlight the first and the last 15 movies (in different colors) rated by four example users. Note that, all the first 15 movies are rated in stage , and the last 15 movies could be the results of the different number of runs of the selected recommendation algorithms. Each run of the algorithm will update what users see in the web page, and these will become candidate movies for user interaction and constitute the interaction context. Therefore, the interaction context of the test instance of each user is not aligned. In fact, when a user has enough interactions with the platform, the user is able to explore more recommended candidate movies which are more personalized along his/her preference, as illustrated in the big tree on the left hand side of Figure 1, from a common root to more personalized preferences.
The relatively fixed pool of candidate items set by the MovieLens platform for users in the stage makes the first interactions of users concentrate on the most popular items (most of them are also well-known classic movies). However, the context of the user’s last interaction (the last interactions in our case) becomes more personalized and cold as multiple rounds of updates by the internal engine. Thus, the removal of the last interactions makes it more difficult to predict the test instance correctly, especially for sequential recommendation algorithms. From experiments with ItemKNN, SVD, and Multi-VAE, we can easily see that users’ ratings of high-popularity items in the stage are of limited help to the detailed classification of users’ preferences.
Further, we also observe the popularity dilemma posed by the first interactions. When the first interactions are included, the recommendation algorithm tends to treat the highly popular movies in the first interactions as the correct test items, which in turn affects the recommendation performance. When the first interactions are removed, the information about the user’s primary interests embedded in the highly popular movies is lost, and the final result declines.
To address the popularity dilemma of MovieLens, we note that Pellegrini et al. (2022) have proposed a modification: considering the co-occurrence probability of test samples with the most popular items as the objective function under popularity-sampled metrics. This inadvertently exploits group interest invariance in MovieLens: users’ test items are essentially identical in group-based interest to the most popular items they rate in their first interactions. Thus, the probability of co-occurrence with the most popular items allows for the determination of the preference backbone to which test items are attributed.
4.3. Impact of Interaction Sequence
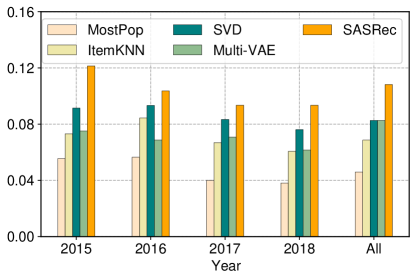
The plots in Figure 3 do not provide a direct comparison of model performance. Figure 6 provides a direct comparison of the five baselines without training data removal. Observe that SASRec is the best performer followed by SVD and Multi-VAE. In general, there is a degradation trend for all models from the 2015 subset to 2018 subset.
Recall that movies rated by users in the MovieLens dataset are from a list of candidate movies recommended by an internal recommendation engine, in an iterative manner. Therefore, it is easy to see that user interactions under the MovieLens interaction mechanism are highly sequential. On the other hand, there is no significant changes in user preference based on the study on the ratio of rated movies in the top 3 genres, which denotes that user interaction sequences are based on a high degree of conformity to the MovieLens interaction generation mechanism.
As previously stated in Section 3, MovieLens records the user’s choices and evaluations based on his or her memory among the candidate items, rather than the user’s actual movie-watching behavior. Driven by the interaction generation mechanism, the exposure of a movie at different stages of user interaction is not uniformly distributed, which in turn may introduce an implicit bias in the user sequence.
To further analyze the impact of potential biases introduced into the user interaction sequence by the interaction generation mechanism, our final experiment changes the order in the original sequence by data shuffling. We keep the validation set and test set unchanged, get new pseudo-sequences by disrupting the order of user interaction sequences in the training set, and observe the performance changes of the sequence recommendation algorithm. For experiments that randomly shuffle the interactions, we repeat the experiment three times with different seeds. Again, we follow the leave-last-one-out scheme, and changes are only made on the training set for a fair comparison. The results are reported in Table 5.
| Dataset | Metric | Original | Shuffled | %decrease after shuffling |
|---|---|---|---|---|
| MovieLens1518 First 15 | HR@10 | 0.3049 | 0.2153 | 33.07% |
| NDCG@10 | 0.1386 | 0.0959 | 33.54% | |
| MovieLens1518 All | HR@10 | 0.1082 | 0.0581 | 43.59% |
| NDCG@10 | 0.0506 | 0.0289 | 38.12% |
Finding 6.
After data shuffling, the performance of the sequential recommendation algorithm, which originally performed well on MovieLens1518 First 15 and All, dropped significantly. The drop in the First 15 is slightly smaller.
Our results are partially consistent with that reported in (Woolridge et al., 2021), which suggests that the sequences in MovieLens are pseudo-sequences because a large part of SASRec’s performance comes from modeling the internal recommendation engine of the MovieLens system rather than true sequence information. The difference is that our results are based on full-rank evaluation while the results in (Woolridge et al., 2021) are based on sampled evaluation.
In terms of interaction contexts, data shuffling mixes candidate movies at different interaction stages. Actually, the overlap between the candidate movie pools in two adjacent interaction phases is less than 50% (see Table 3), which implies a significant difference between the different stages. Therefore, data shuffling increases the difficulty of interaction context simulation and accurate recommendations. Also, data shuffling destroys most of the potential information provided by the internal recommendation engine.
In different ranges of interaction sequences, we can observe different implicit signals introduced by the internal recommendation engine. Considering only the interaction on the recommended initial page (First 15), this order may come from the relative position of the movies on the recommended interface (exposure bias (Liu et al., 2020)). Taking the complete interaction sequence into account, the sequential recommendation algorithm captures more of the leap pattern of the candidate interface driven by the intrinsic recommender.
5. Discussion
To summarize, what we have learned from the MovieLens user-item interaction generation mechanism and the MovieLens1518 dataset are the followings. (i) The movie ratings on MovieLens are collected from users through interactions at different stages. The movies for rating are recommended by an internal recommendation algorithm. Along the interactions at different stages, the receptive fields of users expand. (ii) Nearly half of the users complete all their ratings in a single day and more than 85% of users complete all ratings within 5 days. (iii) Users likely maintain their preferences reflected by nearly 90% of movies in the first 15 ratings fall into the top 3 genres of most interest, and above 70% of last 15 ratings fall into the same genres. (iv) Removal of training instances (e.g., the first 15, the last 15, and randomly sampled 15) leads to decreases in recommendation accuracy, and larger drops are observed for removal of training instances nearer (e.g., the last 15 ratings) to the test instances. (v) The best-performing model SASRec benefits from the sequential pattern of the internal recommendation, and data shuffle leads to a large drop in performance. (vi) All baseline models show a degradation trend on the yearly subsets from 2015 to 2018 due to the increase in movie candidates.
Our main focus here is how to explain these findings, and the implications of using the MovieLens dataset for model evaluation. In other words: are similar findings expected on a typical recommendation scenario in practice? To answer this question, we focus on the similarities and differences between the user-item interaction generation mechanisms on MovieLens and on typical recommendation platforms, from two perspectives.
5.1. The Two Types of User-Item Interactions
In our understanding, we consider that the MovieLens platform is an effective platform for collecting user preferences on movies (or similar items like books, music, video games, poetry, TV shows ) at a large scale. The website is well designed to provide a small (such as 50 movies in one selection page) but personalized list of titles for a user to choose from, as a ”guide” to help him/her to recall the movies watched earlier and then give ratings. There are two forms of user-item interactions, as illustrated in Figure 7.
-
•
The interaction is between users and the individual movies which happened in the past, and is accumulative over time. A user may spend 10 years to complete the watching of Harry Potter series as these movies were released in a 10-year time frame. The decision-making to watch every Harry Potter movie could be different. In other words, a user may decide to watch a movie because of its actors and directors, simply because he/she receives a free ticket, or by following the recommendation of NetFlix or other platforms. For each of such decision, there could be consideration of the monetary and time cost of watching a movie.
-
•
The interaction between the users and the MovieLens platform. Following the ”guidance” of the MovieLens’ internal recommendation, the user recalls the movies that he/she had watched before and records his/her ratings.
The two types of interactions are completely different. In particular, when interacting with the MovieLens platform, a user has watched a good number of movies. It is not difficult to summarize the kinds of movies (e.g., the top three genres) he/she likes. Hence, this rating collection process can be completed within a short time, and the process of recalling the movie titles is likely from the small pool of more famous movies (in stage ) to a much larger pool of movies of similar kinds (in stage ). There are also no preference changes along time as users usually complete all ratings within a short time based on their developed preferences on movies over the time before the interaction with MovieLens. More importantly, the sequential pattern among the ratings from a user does not necessarily reflect the actual sequence of a user watching these movies. Rather, the sequence is the result of the guidance through the rating and recommendation iterative process on MovieLens. Even if there were personal preference changes when the user watched these movies along time, such changes cannot be reflected in the rating sequence.
As a user has already watched a movie, there is no decision-making process on whether a new movie shall be watched with either monetary or time cost. However, for a typical online recommender platform, a user often needs to make a judgment before interacting with a ”new” item being recommended. In other words, in a typical recommendation platform, we expect the model to recommend ”new” items of the user’s interest that the user has not interacted with before. The MovieLens dataset does not reflect such a setting.
Yu and Sun (2022) argue that ”a model is trained to answer the same information need for which the training dataset is created”. That is, a model learns user behaviour all from the training data, with the assumption that similar user behaviour will happen when the model is applied in a different or real-world setting. In our discussion, we consider that the contexts for the interactions and the interactions to be very different. Hence, a model that achieves excellent performance on MovieLens may not show superior performance in many practical recommendation scenarios.
5.2. The Information Mismatch between User and Item Collection
In MovieLens, both users and the system have a clear understanding of the collection of items, i.e., the movies. A typical user would have a basic comprehension of how to characterize a movie with its actors, directors, genre and so on. The same applies to music, books, hotels and flights. However, in many other recommendation scenarios, users may not have a clear understanding of the organization and distribution of all items, e.g., all products available for purchase on e-commerce sites, and the different kinds of advertisements to be recommended to users. Under such settings, users may not know the existence of certain types of items and do not have a full picture of all possible types of items that are available for recommendation. The degree of information mismatch between the user and the item collection of the MovieLens dataset and that of other recommendation scenarios could be very different. Hence, a model that is good at learning certain patterns from the MovieLens dataset may not be good at learning patterns from datasets obtained from other platforms.
In short, there are two perspectives to understanding the MovieLens data. First, the MovieLens dataset does capture user preferences on movies e.g., the types of movies a user prefers to watch. Second, the MovieLens dataset is more of a collection of the results of user-item interactions, where users have good knowledge about the item properties. Hence, the model performance made on the MovieLens dataset could be a good reflection of to what extent the model matches the underlying recommendation algorithm well (e.g., item-item similarity used to power MovieLens); the performance may not be a good reflection of what the model would achieve in real-world settings where a user need to make a judgment when facing newly recommended items of little knowledge, and the user has never interacted with these items before, and there could be cost to interact with these items.
6. Related Work
Our research focuses on the analysis of the MovieLens dataset with an aim to identify its implications on recommender evaluations. Accordingly, we review the related studies on RecSys dataset analysis, the study of biases in RecSys, and the common issues in RecSys evaluation.
6.1. Recommender System Dataset Analysis
Existing dataset related studies in recommender systems have placed their focuses on dataset analysis. Deldjoo et al. (2020) emphasize that the user-item rating matrix structure and the rating distribution largely affect the robustness of the collaborative filtering model in the case of shilling attacks. Luca (2016) examine the causal impact of Yelp consumer ratings on restaurant demand with a regression discontinuity approach. The authors then test whether consumers use Yelp reviews in a way that is consistent with standard Bayesian learning models. The results suggest that consumers show selectivity in using reviews, being more responsive to visible quality changes and ratings with more information. Leino and Räihä (2007) explore user behaviors in the Amazon online store using on-location interviewing and observation. They are especially interested in what kind of strategies users had developed for utilizing algorithm-based recommendations and customer reviews to discover items of interest. Steck et al. (2021) discuss the challenges and lessons learned in using deep learning for recommender systems at Netflix. It highlights that deep learning models show significant improvements only when combined with additional heterogeneous features like timestamps and by addressing issues of offline-online metric alignment. In (Woolridge et al., 2021), the authors demonstrate that the interaction history in the MovieLens dataset is pseudo-sequential because the actual order of these interactions is unknowable. Similar to our study, these papers mostly focus on one specific dataset. Considering the arbitrary use of various datasets, the dataset dilemma in recommender systems has been raised in (Chin et al., 2022). The authors cluster datasets from different domains based on structural and distributional characteristics, and examine the performance rankings of algorithms across different clusters.
6.2. Biases in Recommender Systems
The recommendation system can be abstracted as a feedback loop among three key components: User, Data, and Model (Chen et al., 2023). Biases occur in different stages including data collection (User to Data), model learning (Data to Model), and final recommendation (Model to User). Our study pays more attention to biases in collected data and recommendation results. Specifically, Chen et al. (2017) formally present four common pitfalls in training and evaluating recommendation algorithms. Among them, two pitfalls are highly relevant to this study: (1) popularity bias: trained models could be biased toward highly reachable products because these items are more likely to be treated as positive training instances. (2) exposure bias: interactions collected from an online platform are influenced by its deployed recommender system. Hence, the distribution of interactions is fundamentally different from the interactions with no exposure to a recommender system.
The long-tail distribution of user interactions is frequently observed in recommendation system data, where a small portion of highly popular items tends to dominate user interactions. When trained on such data, models often have the propensity to recommend popular items over less unpopular ones. MovieLens datasets, as a typical long-tail dataset, is often used as an experimental dataset for popularity bias and debiasing. Abdollahpouri et al. (2020) have empirically verified the impacts of popularity bias on different stakeholders such as users and suppliers. Further, they propose metrics to measure the average deviation of the recommendations in terms of item popularity. Steck et al. (2021) investigate the effects of four factors, namely inherent audience size imbalance, model bias, position bias, and closed feedback loop, on popularity bias in recommender systems by simulating dynamic recommendation experiments. They conclude that audience size imbalance and model bias are the main factors contributing to popularity bias. Apart from this, a dynamic debiasing strategy and a novel False Positive Correction method are proposed to remove popularity bias in dynamic scenarios. Exposure bias arises when users have only seen a subset of specific items and unobserved interactions are not necessarily dislikes. Liu et al. (2020) point out that exposure is affected by the policy of intrinsic recommendation engines, which determine which items to show to users. Schnabel et al. (2016) emphasize that users’ active search behavior is also a factor of exposure and introduce a debiasing method employing inverse propensity weighting to correct bias in observed data.
Our analysis in this paper offers another perspective to understand bias in the MovieLens dataset. The ratings on MovieLens are naturally biased due to two reasons. First, all users start with the 15 ratings from a small pool of representative movies, and the number of ratings per user varies significantly. Second, as the ratings are based on user memory of the movies that they have watched before, more ratings are expected to more successful movies.
6.3. Evaluation Issues in Recommender Systems
In the burgeoning field of recommender systems, evaluation has been an important research topic. In (Ferrari Dacrema et al., 2019) and (Dong et al., 2023), the authors highlight the importance of establishing benchmark evaluation to avoid unfair comparisons and to ensure the reproducibility of recommendation algorithms. With that in consideration, multiple toolkits have been released to benchmark the recommendation tasks, and facilitate the development and evaluation of recommendation models (Sun et al., 2022; Zhao et al., 2021; Graham et al., 2019; Anelli et al., 2021).
Apart from the development of toolkits, recent years have witnessed an increasing number of research papers discussing offline evaluation options for recommender systems. Sun et al. (2020) categorize the offline evaluation options into eight steps, including dataset selection, dataset filtering techniques, baseline model selection, objective function selection, negative sampling method selection, dataset splitting options, evaluation metric options and hyperparameter tuning techniques. Among these options, dataset splitting options have garnered significant research interests. In (Cañamares et al., 2020; Meng et al., 2020), the authors demonstrate the varying outcomes due to different data splitting strategies. They argue that varying outcomes could lead to misinterpretation of results. Ji et al. (2023) further explain the varying outcomes from a global timeline perspective. The key finding is, the data splitting strategies that ignore the global timeline, e.g., leave-one-out split, suffer from the data leakage issue, thus leading to unpredictable recommendation performance. Other studies focus on the options of evaluation metric: accuracy metric and beyond-accuracy metric (Zangerle and Bauer, 2023; Silveira et al., 2019; Herlocker et al., 2004). Furthermore, the authors in (Zhao et al., 2022; Krichene and Rendle, 2022) delve into the research of sampled metric, and show the potential bias induced when using incomplete candidate list in evaluation.
Although dataset selection has been listed as an important step of offline evaluation in (Sun et al., 2020), it does not receive much research attention compared to data splitting strategies and evaluation metrics. In many studies (Sun et al., 2020; Zhao et al., 2022), it is suggested that researchers should select research datasets considering their popularity (whether they are frequently used by recent academic papers) as well as domain diversity. There is a lack of study that delves into the collection and construction process of a dataset to facilitate the dataset selection in offline evaluation. In this work, we zoom in on a particular recommender system dataset: MovieLens. Specifically, we understand the MovieLens dataset from its collection process.
7. Conclusion
In this study, we conduct a thorough analysis of the extremely popular MovieLens dataset in the field of recommender systems from the perspective of interaction generation mechanisms. We demonstrate the interaction generation mechanism of the latest version of the MovieLens dataset, including the detailed user interaction process and the built-in recommendation algorithm at different stages. In addition, we designed targeted experiments based on the interactive generation mechanism to observe whether the special data characteristics caused by the interactive generation mechanism of the MovieLens dataset actually lead to different observations or conclusions drawn from empirical studies. Our results demonstrate that interaction generation mechanisms can have a significant impact on data characteristics, which in turn can cause profound and unpredictable perturbations to experimental results. By contrasting the user-item interactions collected in MovieLens and the user-item interactions that are expected from practical recommendation scenarios, we argue that the recommendation models that achieve excellent performance on the MovieLens dataset may not show the same in reality. We strongly encourage researchers to review the mechanisms by which the user-item interactions were generated when using these datasets as benchmarks for recommenders beyond their initial scope.
References
- (1)
- Abdollahpouri et al. (2020) Himan Abdollahpouri, Masoud Mansoury, Robin Burke, and Bamshad Mobasher. 2020. The connection between popularity bias, calibration, and fairness in recommendation. In ACM Conference on Recommender Systems. 726–731.
- Anelli et al. (2021) Vito Walter Anelli, Alejandro Bellogín, Antonio Ferrara, Daniele Malitesta, Felice Antonio Merra, Claudio Pomo, Francesco Maria Donini, and Tommaso Di Noia. 2021. Elliot: A Comprehensive and Rigorous Framework for Reproducible Recommender Systems Evaluation. In ACM SIGIR Conference on Research and Development in Information Retrieval. ACM, 2405–2414. https://doi.org/10.1145/3404835.3463245
- Cañamares et al. (2020) Rocío Cañamares, Pablo Castells, and Alistair Moffat. 2020. Offline evaluation options for recommender systems. Information Retrieval Journal 23, 4 (2020), 387–410.
- Chang et al. (2015) Shuo Chang, F Maxwell Harper, and Loren Terveen. 2015. Using groups of items for preference elicitation in recommender systems. In ACM Conference on Computer Supported Cooperative Work & Social Computing. 1258–1269.
- Chen et al. (2017) Hung-Hsuan Chen, Chu-An Chung, Hsin-Chien Huang, and Wen Tsui. 2017. Common pitfalls in training and evaluating recommender systems. ACM SIGKDD Explorations Newsletter 19, 1 (2017), 37–45.
- Chen et al. (2023) Jiawei Chen, Hande Dong, Xiang Wang, Fuli Feng, Meng Wang, and Xiangnan He. 2023. Bias and debias in recommender system: A survey and future directions. ACM Transactions on Information Systems 41, 3 (2023), 1–39.
- Chin et al. (2022) Jin Yao Chin, Yile Chen, and Gao Cong. 2022. The Datasets Dilemma: How Much Do We Really Know About Recommendation Datasets?. In ACM International Conference on Web Search and Data Mining. 141–149.
- Cremonesi et al. (2010) Paolo Cremonesi, Yehuda Koren, and Roberto Turrin. 2010. Performance of recommender algorithms on top-n recommendation tasks. In ACM Conference on Recommender Systems, Xavier Amatriain, Marc Torrens, Paul Resnick, and Markus Zanker (Eds.). ACM, 39–46. https://doi.org/10.1145/1864708.1864721
- Deldjoo et al. (2020) Yashar Deldjoo, Tommaso Di Noia, Eugenio Di Sciascio, and Felice Antonio Merra. 2020. How dataset characteristics affect the robustness of collaborative recommendation models. In ACM SIGIR conference on research and development in information retrieval. 951–960.
- Deshpande and Karypis (2004) Mukund Deshpande and George Karypis. 2004. Item-based top-N recommendation algorithms. ACM Trans. Inf. Syst. 22, 1 (2004), 143–177. https://doi.org/10.1145/963770.963776
- Dong et al. (2023) Yushun Dong, Jundong Li, and Tobias Schnabel. 2023. When Newer is Not Better: Does Deep Learning Really Benefit Recommendation From Implicit Feedback? CoRR abs/2305.01801 (2023). https://doi.org/10.48550/arXiv.2305.01801 arXiv:2305.01801
- Ekstrand et al. (2015) Michael D Ekstrand, Daniel Kluver, F Maxwell Harper, and Joseph A Konstan. 2015. Letting users choose recommender algorithms: An experimental study. In Proceedings of the 9th ACM Conference on Recommender Systems. 11–18.
- Ferrari Dacrema et al. (2019) Maurizio Ferrari Dacrema, Paolo Cremonesi, and Dietmar Jannach. 2019. Are we really making much progress? A worrying analysis of recent neural recommendation approaches. In ACM conference on recommender systems. Association for Computing Machinery, New York, NY, USA, 101–109.
- Graham et al. (2019) Scott Graham, Jun-Ki Min, and Tao Wu. 2019. Microsoft recommenders: tools to accelerate developing recommender systems. In ACM Conference on Recommender Systems. ACM, 542–543. https://doi.org/10.1145/3298689.3346967
- Harper and Konstan (2015) F Maxwell Harper and Joseph A Konstan. 2015. The movielens datasets: History and context. ACM transactions on interactive intelligent systems 5, 4 (2015), 1–19.
- He et al. (2017) Xiangnan He, Lizi Liao, Hanwang Zhang, Liqiang Nie, Xia Hu, and Tat-Seng Chua. 2017. Neural collaborative filtering. In International conference on world wide web. International World Wide Web Conferences Steering Committee, Republic and Canton of Geneva, CHE, 173–182.
- Herlocker et al. (2004) Jonathan L. Herlocker, Joseph A. Konstan, Loren G. Terveen, and John Riedl. 2004. Evaluating collaborative filtering recommender systems. ACM Trans. Inf. Syst. 22, 1 (2004), 5–53. https://doi.org/10.1145/963770.963772
- Hidasi et al. (2016) Balázs Hidasi, Alexandros Karatzoglou, Linas Baltrunas, and Domonkos Tikk. 2016. Session-based Recommendations with Recurrent Neural Networks. In International Conference on Learning Representations, Yoshua Bengio and Yann LeCun (Eds.).
- Ji et al. (2023) Yitong Ji, Aixin Sun, Jie Zhang, and Chenliang Li. 2023. A critical study on data leakage in recommender system offline evaluation. ACM Transactions on Information Systems 41, 3 (2023), 1–27.
- Kang and McAuley (2018a) Wang-Cheng Kang and Julian J. McAuley. 2018a. Self-Attentive Sequential Recommendation. In IEEE International Conference on Data Mining, ICDM. IEEE Computer Society, 197–206. https://doi.org/10.1109/ICDM.2018.00035
- Kang and McAuley (2018b) Wang-Cheng Kang and Julian McAuley. 2018b. Self-attentive sequential recommendation. In IEEE international conference on data mining (ICDM). IEEE, 197–206.
- Krichene and Rendle (2022) Walid Krichene and Steffen Rendle. 2022. On sampled metrics for item recommendation. Commun. ACM 65, 7 (2022), 75–83.
- Leino and Räihä (2007) Juha Leino and Kari-Jouko Räihä. 2007. Case amazon: ratings and reviews as part of recommendations. In ACM conference on Recommender systems. 137–140.
- Liang et al. (2018) Dawen Liang, Rahul G Krishnan, Matthew D Hoffman, and Tony Jebara. 2018. Variational autoencoders for collaborative filtering. In The World Wide Web Conference. 689–698.
- Liu et al. (2020) Dugang Liu, Pengxiang Cheng, Zhenhua Dong, Xiuqiang He, Weike Pan, and Zhong Ming. 2020. A general knowledge distillation framework for counterfactual recommendation via uniform data. In ACM SIGIR Conference on Research and Development in Information Retrieval. 831–840.
- Luca (2016) Michael Luca. 2016. Reviews, reputation, and revenue: The case of Yelp. com. Com (March 15, 2016). Harvard Business School NOM Unit Working Paper 12-016 (2016).
- Meng et al. (2020) Zaiqiao Meng, Richard McCreadie, Craig Macdonald, and Iadh Ounis. 2020. Exploring data splitting strategies for the evaluation of recommendation models. In ACM Conference on Recommender Systems. 681–686.
- Paterek (2007) Arkadiusz Paterek. 2007. Improving regularized singular value decomposition for collaborative filtering. In Proceedings of KDD cup and workshop, Vol. 2007. 5–8.
- Pellegrini et al. (2022) Roberto Pellegrini, Wenjie Zhao, and Iain Murray. 2022. Don’t recommend the obvious: estimate probability ratios. In ACM Conference on Recommender Systems. 188–197.
- Schnabel et al. (2016) Tobias Schnabel, Adith Swaminathan, Ashudeep Singh, Navin Chandak, and Thorsten Joachims. 2016. Recommendations as treatments: Debiasing learning and evaluation. In International Conference on Machine Learning. PMLR, 1670–1679.
- Silveira et al. (2019) Thiago Silveira, Min Zhang, Xiao Lin, Yiqun Liu, and Shaoping Ma. 2019. How good your recommender system is? A survey on evaluations in recommendation. Int. J. Mach. Learn. Cybern. 10, 5 (2019), 813–831. https://doi.org/10.1007/s13042-017-0762-9
- Steck et al. (2021) Harald Steck, Linas Baltrunas, Ehtsham Elahi, Dawen Liang, Yves Raimond, and Justin Basilico. 2021. Deep learning for recommender systems: A Netflix case study. AI Magazine 42, 3 (2021), 7–18.
- Sun et al. (2022) Zhu Sun, Hui Fang, Jie Yang, Xinghua Qu, Hongyang Liu, Di Yu, Yew-Soon Ong, and Jie Zhang. 2022. DaisyRec 2.0: Benchmarking Recommendation for Rigorous Evaluation. IEEE Transactions on Pattern Analysis and Machine Intelligence (2022).
- Sun et al. (2020) Zhu Sun, Di Yu, Hui Fang, Jie Yang, Xinghua Qu, Jie Zhang, and Cong Geng. 2020. Are we evaluating rigorously? benchmarking recommendation for reproducible evaluation and fair comparison. In ACM Conference on Recommender Systems. 23–32.
- Woolridge et al. (2021) Daniel Woolridge, Sean Wilner, and Madeleine Glick. 2021. Sequence or Pseudo-Sequence? An Analysis of Sequential Recommendation Datasets.. In Perspectives@ RecSys.
- Wu et al. (2016) Yao Wu, Christopher DuBois, Alice X Zheng, and Martin Ester. 2016. Collaborative denoising auto-encoders for top-n recommender systems. In ACM international conference on web search and data mining. 153–162.
- Yu and Sun (2022) Mengying Yu and Aixin Sun. 2022. Dataset vs Reality: Understanding Model Performance from the Perspective of Information Need. CoRR abs/2212.02726 (2022). https://doi.org/10.48550/arXiv.2212.02726 arXiv:2212.02726
- Zangerle and Bauer (2023) Eva Zangerle and Christine Bauer. 2023. Evaluating Recommender Systems: Survey and Framework. ACM Comput. Surv. 55, 8 (2023), 170:1–170:38. https://doi.org/10.1145/3556536
- Zhao et al. (2022) Wayne Xin Zhao, Zihan Lin, Zhichao Feng, Pengfei Wang, and Ji-Rong Wen. 2022. A revisiting study of appropriate offline evaluation for top-N recommendation algorithms. ACM Transactions on Information Systems 41, 2 (2022), 1–41.
- Zhao et al. (2021) Wayne Xin Zhao, Shanlei Mu, Yupeng Hou, Zihan Lin, Yushuo Chen, Xingyu Pan, Kaiyuan Li, Yujie Lu, Hui Wang, Changxin Tian, et al. 2021. Recbole: Towards a unified, comprehensive and efficient framework for recommendation algorithms. In ACM International Conference on Information & Knowledge Management. 4653–4664.