From Ukraine to the World: Using LinkedIn Data to Monitor Professional Migration from Ukraine
Abstract.
Highly skilled professionals’ forced migration from Ukraine was triggered by the conflict in Ukraine in 2014 and amplified by the Russian invasion in 2022. Here, we utilize LinkedIn estimates and official refugee data from the World Bank and the United Nations Refugee Agency, to understand which are the main pull factors that drive the decision-making process of the host country. We identify an ongoing and escalating exodus of educated individuals, largely drawn to Poland and Germany, and underscore the crucial role of pre-existing networks in shaping these migration flows. Key findings include a strong correlation between LinkedIn’s estimates of highly educated Ukrainian displaced people and official UN refugee statistics, pointing to the significance of prior relationships with Ukraine in determining migration destinations. We train a series of multilinear regression models and the SHAP method revealing that the existence of a support network is the most critical factor in choosing a destination country, while distance is less important. Our main findings show that the migration patterns of Ukraine’s highly skilled workforce, and their impact on both the origin and host countries, are largely influenced by pre-existing networks and communities. This insight can inform strategies to tackle the economic challenges posed by this loss of talent and maximize the benefits of such migration for both Ukraine and the receiving nations.
1. Introduction
The global movement of highly skilled professionals has gained significant attention in recent years, as the international labor market continues to witness the exodus of talented individuals from their home countries. Ukraine, a nation rich in intellectual capital, has experienced a notable surge in emigration, particularly among its highly skilled workforce, following the recent conflicts that unfolded in the country (Berte et al., 2023; State et al., 2014; Heo et al., 2023).
The phenomenon of migration from Ukraine to other European countries, in particular for employment reasons, is not new (Mulska et al., 2021; Libanova, 2019). The 2014 conflict in Ukraine resulted in a protracted and devastating crisis that significantly impacted various aspects of the nation’s social, economic, and political landscape. The nature and dynamics of internal migration among Ukrainians have been significantly altered due to the annexation of Crimea in March 2014 (Jaroszewicz, 2015) affecting around 5 million individuals (OHCHR, 2014). By the end of 2021, the number of Ukrainian citizens who had obtained a valid residence permit and were authorized to reside in the EU had reached 1.57 million. This group of people accounted for the third largest group of non-EU citizens residing in the EU (EUROSTAT, 2022; OECD, 2022).
More recently, in 2022 the Russian invasion of Ukraine led to further political instability, economic challenges, and a sense of uncertainty, catalyzing the migration of highly skilled professionals seeking better opportunities and stability abroad. Referring to the Ukrainian forced migration wave that started on February 2022 Lloyd et al (Lloyd and Sirkeci, 2022) state that “the most recent exodus from Ukraine should be seen as the continuation of a legacy of human insecurity in the country”.
The phenomenon of skilled migration, often referred to as “brain drain,” has far-reaching implications for both the sending and receiving countries. For Ukraine, the loss of highly skilled professionals poses significant challenges to its economic development, as the country struggles to retain its human capital and nurture innovation within its borders. Conversely, the countries that attract these talented individuals benefit from their expertise, fueling economic growth and fostering innovation in various sectors. Here, we draw on a combination of quantitative and qualitative research methodologies, utilizing mainly the LinkedIn platform, shown to provide critical demographic estimates that facilitate the study of various topics relating to labor dynamics (Verkroost et al., 2020; Kashyap and Verkroost, 2021). We also incorporate Meta’s social connectedness index, and sociodemographic data from official sources to comprehensively analyze the migration trends and their implications. We explore the role of major determining factors, including economic opportunities, political stability, but also social networks in shaping the decision-making process of highly skilled professionals for the choice of the destination country. By gaining a deeper understanding of the motivations and consequences of the migration of highly skilled professionals from Ukraine to foreign countries, this research aims to inform policy interventions and initiatives that can help address the challenges faced by Ukraine while harnessing the potential of its human capital. We hope that this study will contribute to the development of evidence-based strategies that foster sustainable economic growth, improve social stability and create an environment conducive to the retention and global collaboration of highly skilled professionals.
This paper aims to investigate and predict not the migration flow patterns of highly skilled professionals from Ukraine to European countries, but the determinant factors in the choice of the host country, with a specific focus on the post-war period. In light of the humanitarian emergency, it is important to estimate not only the proportions of the displacement but also the migration preferences to be able to support host countries in prioritizing aid and efforts.
2. Related work
Scientists endeavored to enhance the official estimates of various countries by incorporating diverse data sources, enabling them to anticipate and gather figures more promptly and flexibly. Many of these approaches had previously demonstrated consistency and significance in different subject areas.
The “Operational Data Portal” (UNHCR (UNHCR, 2023)) provided by the United Nations High Commissioner for Refugees offers reports on ongoing emergencies and presents the latest estimates obtained from authoritative sources. However, the collection and centralization of such precise data pose significant challenges, especially in emergencies. The need for up-to-date data has become indispensable in our rapidly progressing world, often taken for granted. The current challenge lies in ethically and constructively integrating slow yet reliable data from authoritative sources with more volatile, easily accessible data. Leveraging on traditional macro-data from the European Statistical Office and national statistics, Mulska et al. (Mulska et al., 2021) highlighted the migration patterns of Ukraine’s population after the aggravation of the political situation due to the Russian aggression of 2014. They further showed how several European countries introduced active policies to attract foreign labor in particular student-age populations. Such policies established the countries’ attractiveness for external migrants, largely determined by medical and demographic stability, better labor market values and employment indicators, living standards, and economic growth.
In addressing this challenge, the inclusion of non-traditional data support and integration becomes crucial. For studying migration and mobility patterns, various data sources are utilized, including geolocated Twitter (Mazzoli et al., 2020), Facebook advertising data (Zagheni et al., 2017; Mazzoli et al., 2020; Fatehkia et al., 2022; Palotti et al., 2020; Capozzi et al., 2021), ORCID data (Urbinati et al., 2019), LinkedIn ad estimates (Vieira et al., 2022; Alexander et al., 2022; Heo et al., 2023), and bibliometric measures (Zhao et al., 2023). Sirbu et al. (Sîrbu et al., 2021) examined the three phases of migration, namely, the journey, stay, and return, by reviewing existing research and enriching insights through the utilization of both big data and traditional data sources. Focusing on the recent Ukrainian conflict, Juric (Jurić, 2022), demonstrated how Google Trends can provide early indications of the besieged Ukrainian population using simple keywords like “border crossing”. Leasure et al. (Leasure et al., 2022) assessed the population displacement by comparing Facebook advertising estimates data collected before and after the Russian invasion on February 24, 2022, while Minora et al. (Minora et al., 2022) examined migratory flows to external countries. Minora et al. (Minora et al., 2023) employing Meta’s Social Connectedness Index (SCI) and Ukrainian stocks, demonstrated the role of the “network effect” in displacement trajectories of Ukrainian people during the Russian invasion.
Here we contribute by a thorough study of the driving factors that influence the choice of the destination country, which despite the efforts, remains an open research question. Putting together traditional and non-traditional data, i.e. LinkedIn estimates, Meta’s SCI, and national migration surveys, we provide a holistic view of the ongoing migration phenomenon, while identifying the major pull factors. Our aim is, therefore, not to predict flow numbers, but to help reveal trends in the choice of destination country combining both digital and traditional data.
3. Data Collection
Official Population and Migration Estimates
We obtained the official population data for each country from the World Bank report (WB (Bank, 2023a)) for 2021111The 2021 report is the most recent available collection. Additionally, we retrieved data from the UN Refugee Agency (UNHCR, 2023), which tracks the migratory flows throughout the world and supplies aid and support. It monitors the crisis in Ukraine after the Russian invasion providing an up-to-date share of the official data of Ukrainian refugees provided by the authorities in different European countries. The official monitoring site claims that the reported numbers are estimates and regarding the collection method, states: when an official estimate is not available, the figure provided corresponds to the sum of registrations for Temporary Protection or similar national protection scheme and the number of asylum applications lodged by refugees from Ukraine. For our study, we considered the estimates reported on 13 March 2023 for all European countries under investigation, except the United Kingdom (data of 12/04/2023). In addition, for the United States and Canada, the estimates were reported on 24/02/2023 by NBC News (Ainsley, 2023) and 17/03/2023 by the Canadian government (of Canada, 2023), respectively. Data are not reported with gender or age resolution, rather, the total estimates are provided per country.
Socioeconomic Indicators
Inspired by the work of (Mulska et al., 2021) and the method of (Goglia et al., 2022), we considered a series of socioeconomic metrics. In particular, we include information about the distance as reported in the GeoDist database (Mayer and Zignago, 2012), and a country’s wealth in terms of the Gross Domestic Product (GDP) expressed in US$, provided by the World Bank (Bank, 2023b). Regarding safety, we considered data from the Institute for Economics & Peace (IEP222https://www.economicsandpeace.org/research/), which released the Global Peace Index (GPI) (for Economics & Peace, 2023). The GPI covers 163 countries, using 23 qualitative and quantitative indicators, and measures the state of peace across three domains: the level of societal Safety and Security; the extent of Ongoing Domestic and International Conflict; and the degree of Militarisation. The scores for each indicator are normalized on a scale of 1 to 5, where qualitative indicators are ranked into five groups and quantitative indicators are scored from 1 to 5, with the third decimal place. A weight for each area is applied when computing the final score. To measure the levels of connection and the presence of existing ties between the host country and Ukraine, we used the META Social Connectedness Index (SCI, (Meta, 2023)) computed in October 2021. Specifically, it measures the relative probability that two individuals across two locations are friends with each other on Facebook.
LinkedIn ad estimates
We collected the sizes of the LinkedIn audiences that attended a university in Ukraine but that are associated with a geographical location different from Ukraine, following the methodology proposed by Viera et al. (Vieira et al., 2022) for mobility assessment using LinkedIn audiences. Querying the ad campaign manager via the official application programming interface (API)333We were based on the open source code by Lucio Melito https://worldbank.github.io/connectivity_mapping/intro.html, we obtained estimates in line with the sociodemographic criteria of the audience of choice. In case the estimated value is lower than 300 members, the platform indicates 0 as a result. Our focus is on the movements of the Ukrainian population with a university degree, so firstly we obtained a list of the Ukrainian universities (Wikipedia, 2022) and aligned those schools to the ones present in the LinkedIn platform (Member School feature). Then we queried by location (38 nearby countries), gender (female or male 444Gender is only provided in a binary form.), age range (18-24, 25-34, 35-54, 55+, NO AGE), member school, i.e., the university that a member claims to have attended. For each combination of gender and age range, we obtain the number of LinkedIn members who attended a University in Ukraine and now work or study in a different country. Finally, we also queried for each host country targeting only by location, getting the size of the LinkedIn community for each destination. Our data collection captures all estimates of LinkedIn members dislocated at the time of data collection (27/02/2023), not just the estimates of those who have moved since the displacement caused by Russia’s invasion on February 24, 2022.
4. Methods
To compare the collected estimates among the host countries, we must first consider the penetration of LinkedIn per country. To assess this, we obtained the LinkedIn estimated number of users per country without age and gender distinction (Total population ). For the ground-truth data, (Total population ), we used the figures reported by the WB in 2021 regarding the population estimates.
We define the LinkedIn penetration measure in each country as:
| (1) |
Finally, we scaled the LinkedIn estimate collected in each host country () for all queries by dividing them by this factor.
| (2) |
To understand the evolution of estimates in time, we repeated the entire data collection process in five distinct periods (on February 27, 2023; on April 28, 2023; on May 5, 2023; on May 12, 2023, and on May 19, 2023). We then computed the difference of two estimates for each country between two periods and , with (chronological order).
| (3) |
where is the collected estimates for the country at time . To frame the magnitude of the change and to compare them among countries, we computed the percentage difference with respect to the older estimate.
| (4) |
| Model name | Predictors |
|---|---|
| Model 1 | LinkedIn estimates |
| Model 2 | SCI |
| Model 3 | distance |
| Model 4 | GPI |
| Model 5 | GDP |
| Model 6 | LinkedIn estimates, SCI |
| Model 7 | LinkedIn estimates, distance |
| Model 8 | LinkedIn estimates, GPI |
| Model 9 | LinkedIn estimates, GDP |
| Model 10 | LinkedIn estimates, SCI, distance |
| Model 11 | LinkedIn estimates, SCI, GPI |
| Model 12 | LinkedIn estimates, SCI, GDP |
| Model 13 | LinkedIn estimates, SCI, GDP, GPI |
| Model 14 | LinkedIn estimates, SCI, distance, GPI |
Modelling Migration
To identify the main pull factors influencing the choice of the destination, we postulated the question as a classification task. We trained a series of multi-linear regression models (see Table 1) where for each host country (38 in total) we aimed to predict the number of refugees estimated by UNHCR. To avoid multicollinearity among the independent variables, we used different sets of variables. The independent variables include the LinkedIn estimates, the geographic distance from the host country to Ukraine, the SCI between Ukraine and the host country in 2021, the GDP of 2021, and the GPI of the host countries in 2022. Finally, we normalize the features to directly compare their regression coefficients. Namely, as a common procedure, we computed the standard score of sample as , where is the mean of the samples, and is the standard deviation of the samples. To further highlight the importance of certain factors in driving the migrants’ host country preference, we apply the SHAP (SHapley Additive exPlanations) method. The goal of SHAP is to explain the result of an instance by computing the contribution of each feature to the prediction to increase the transparency and interpretability of the machine learning model.
5. Results & Discussion
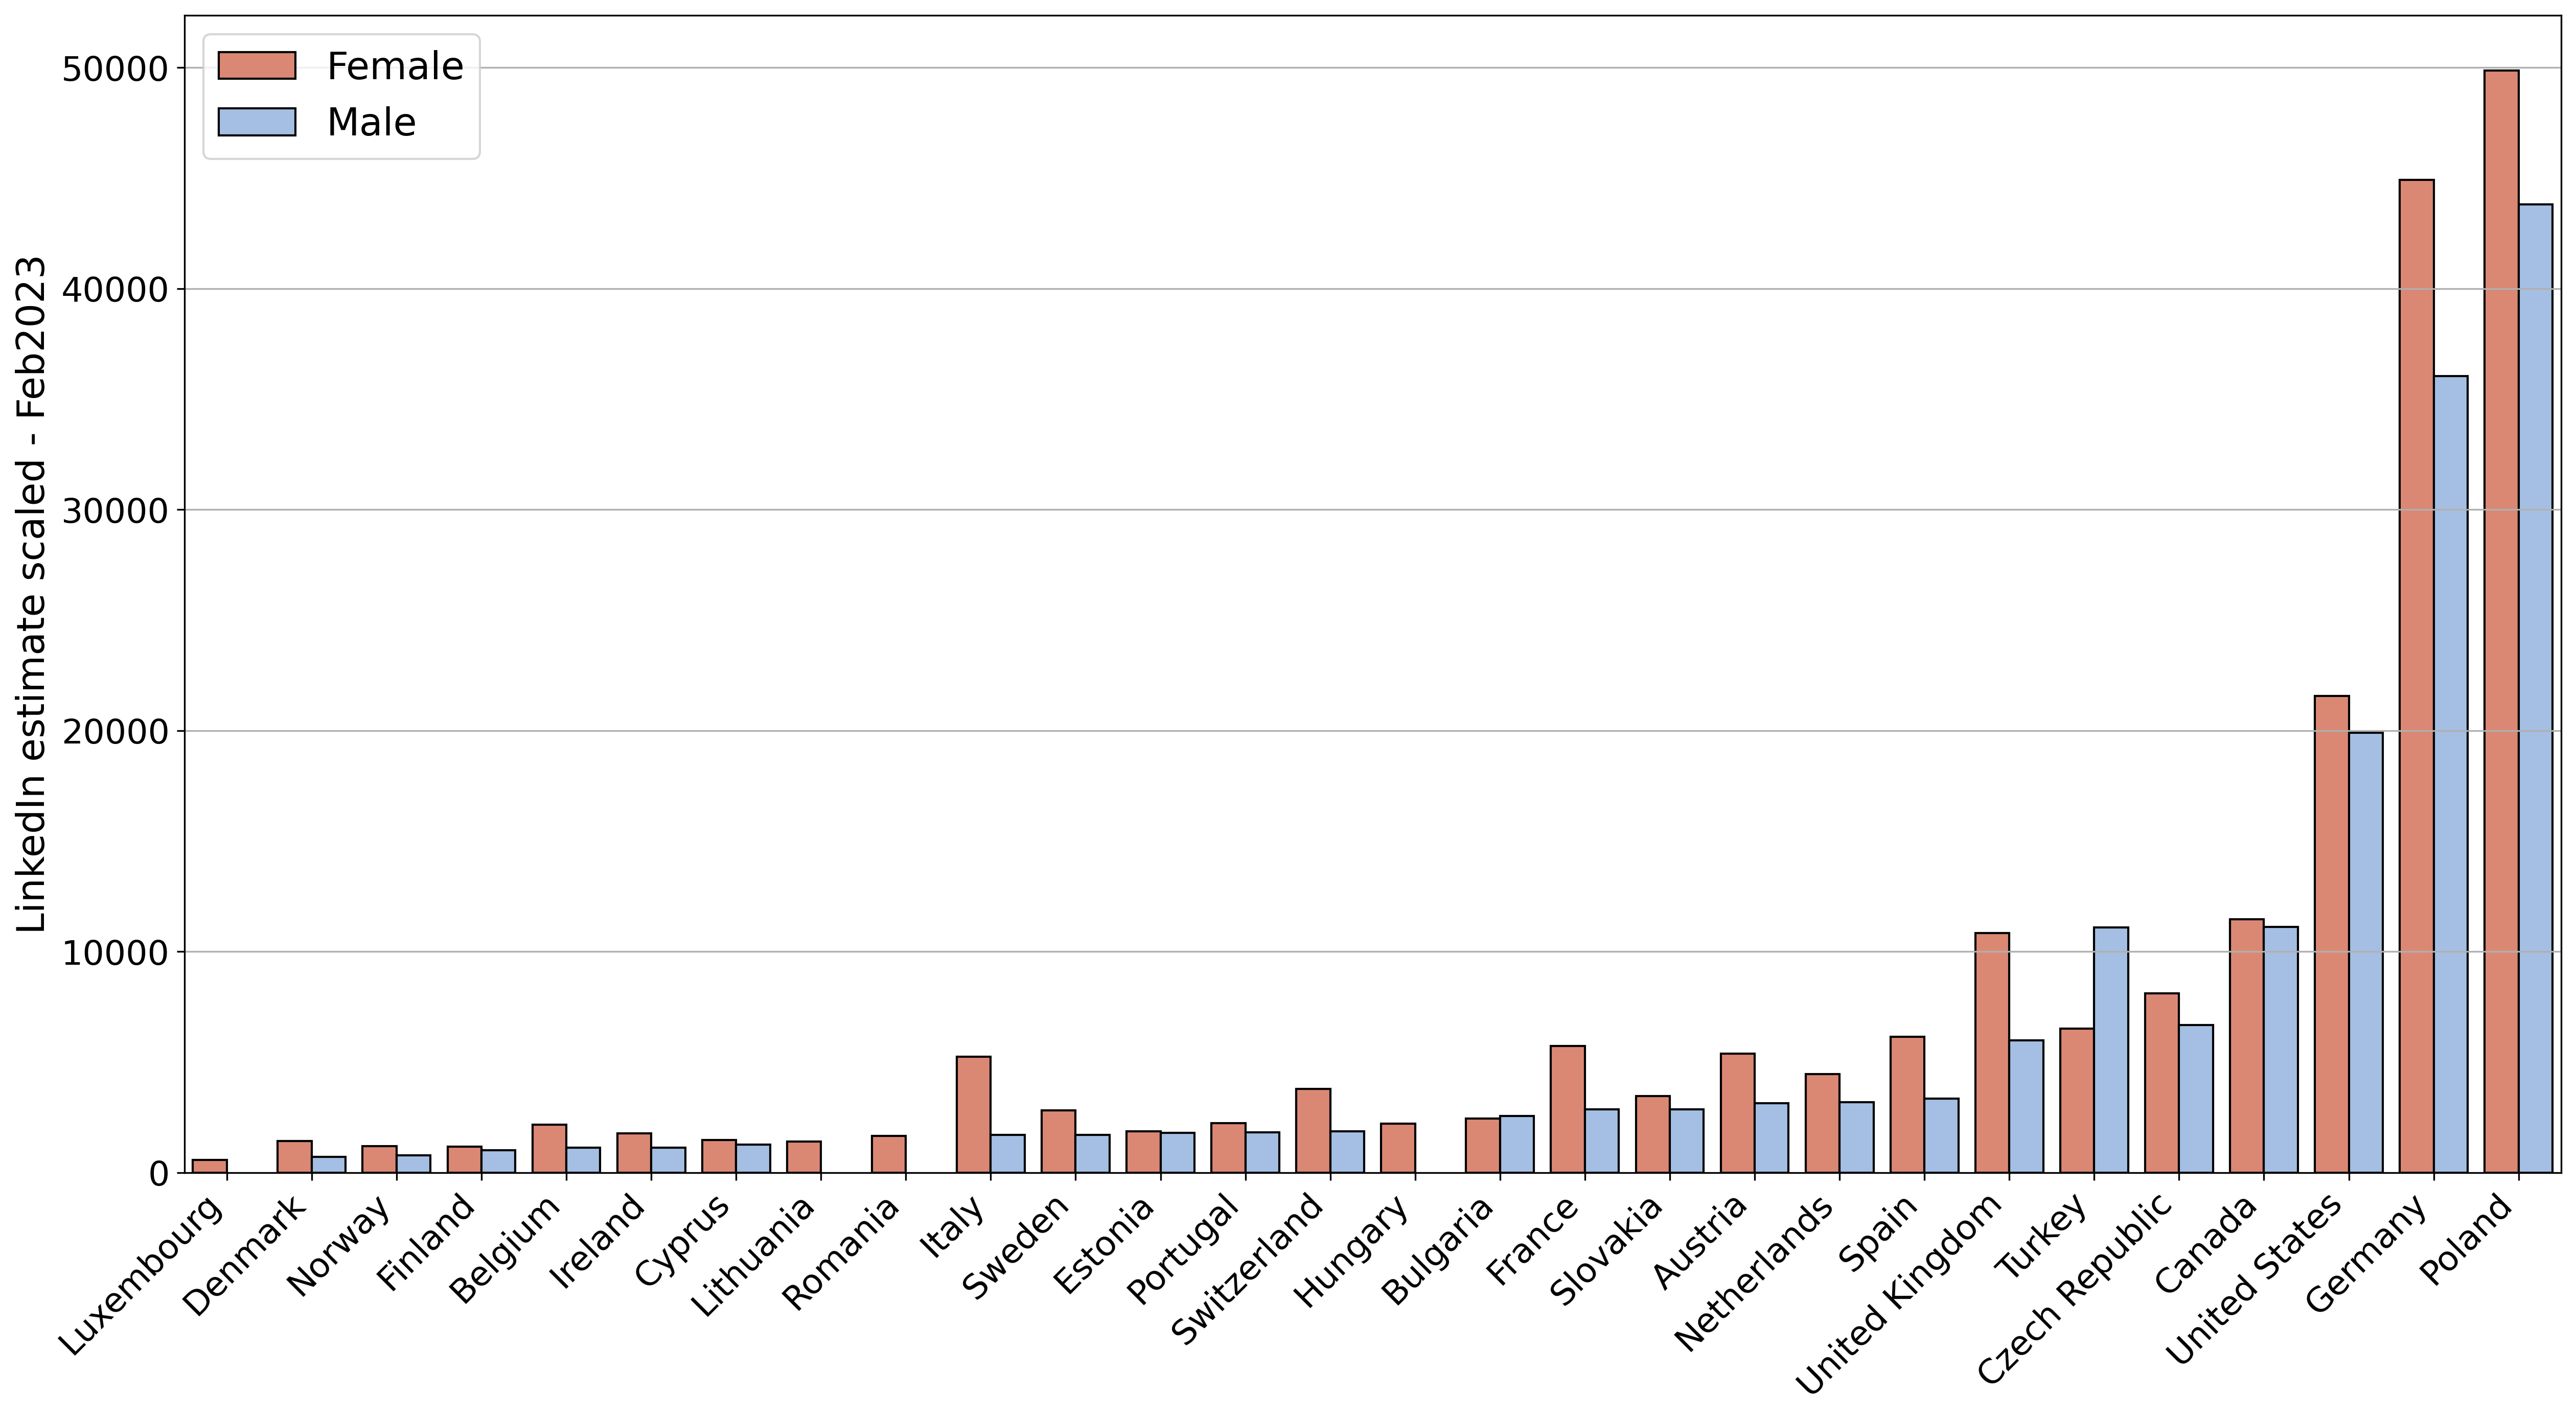
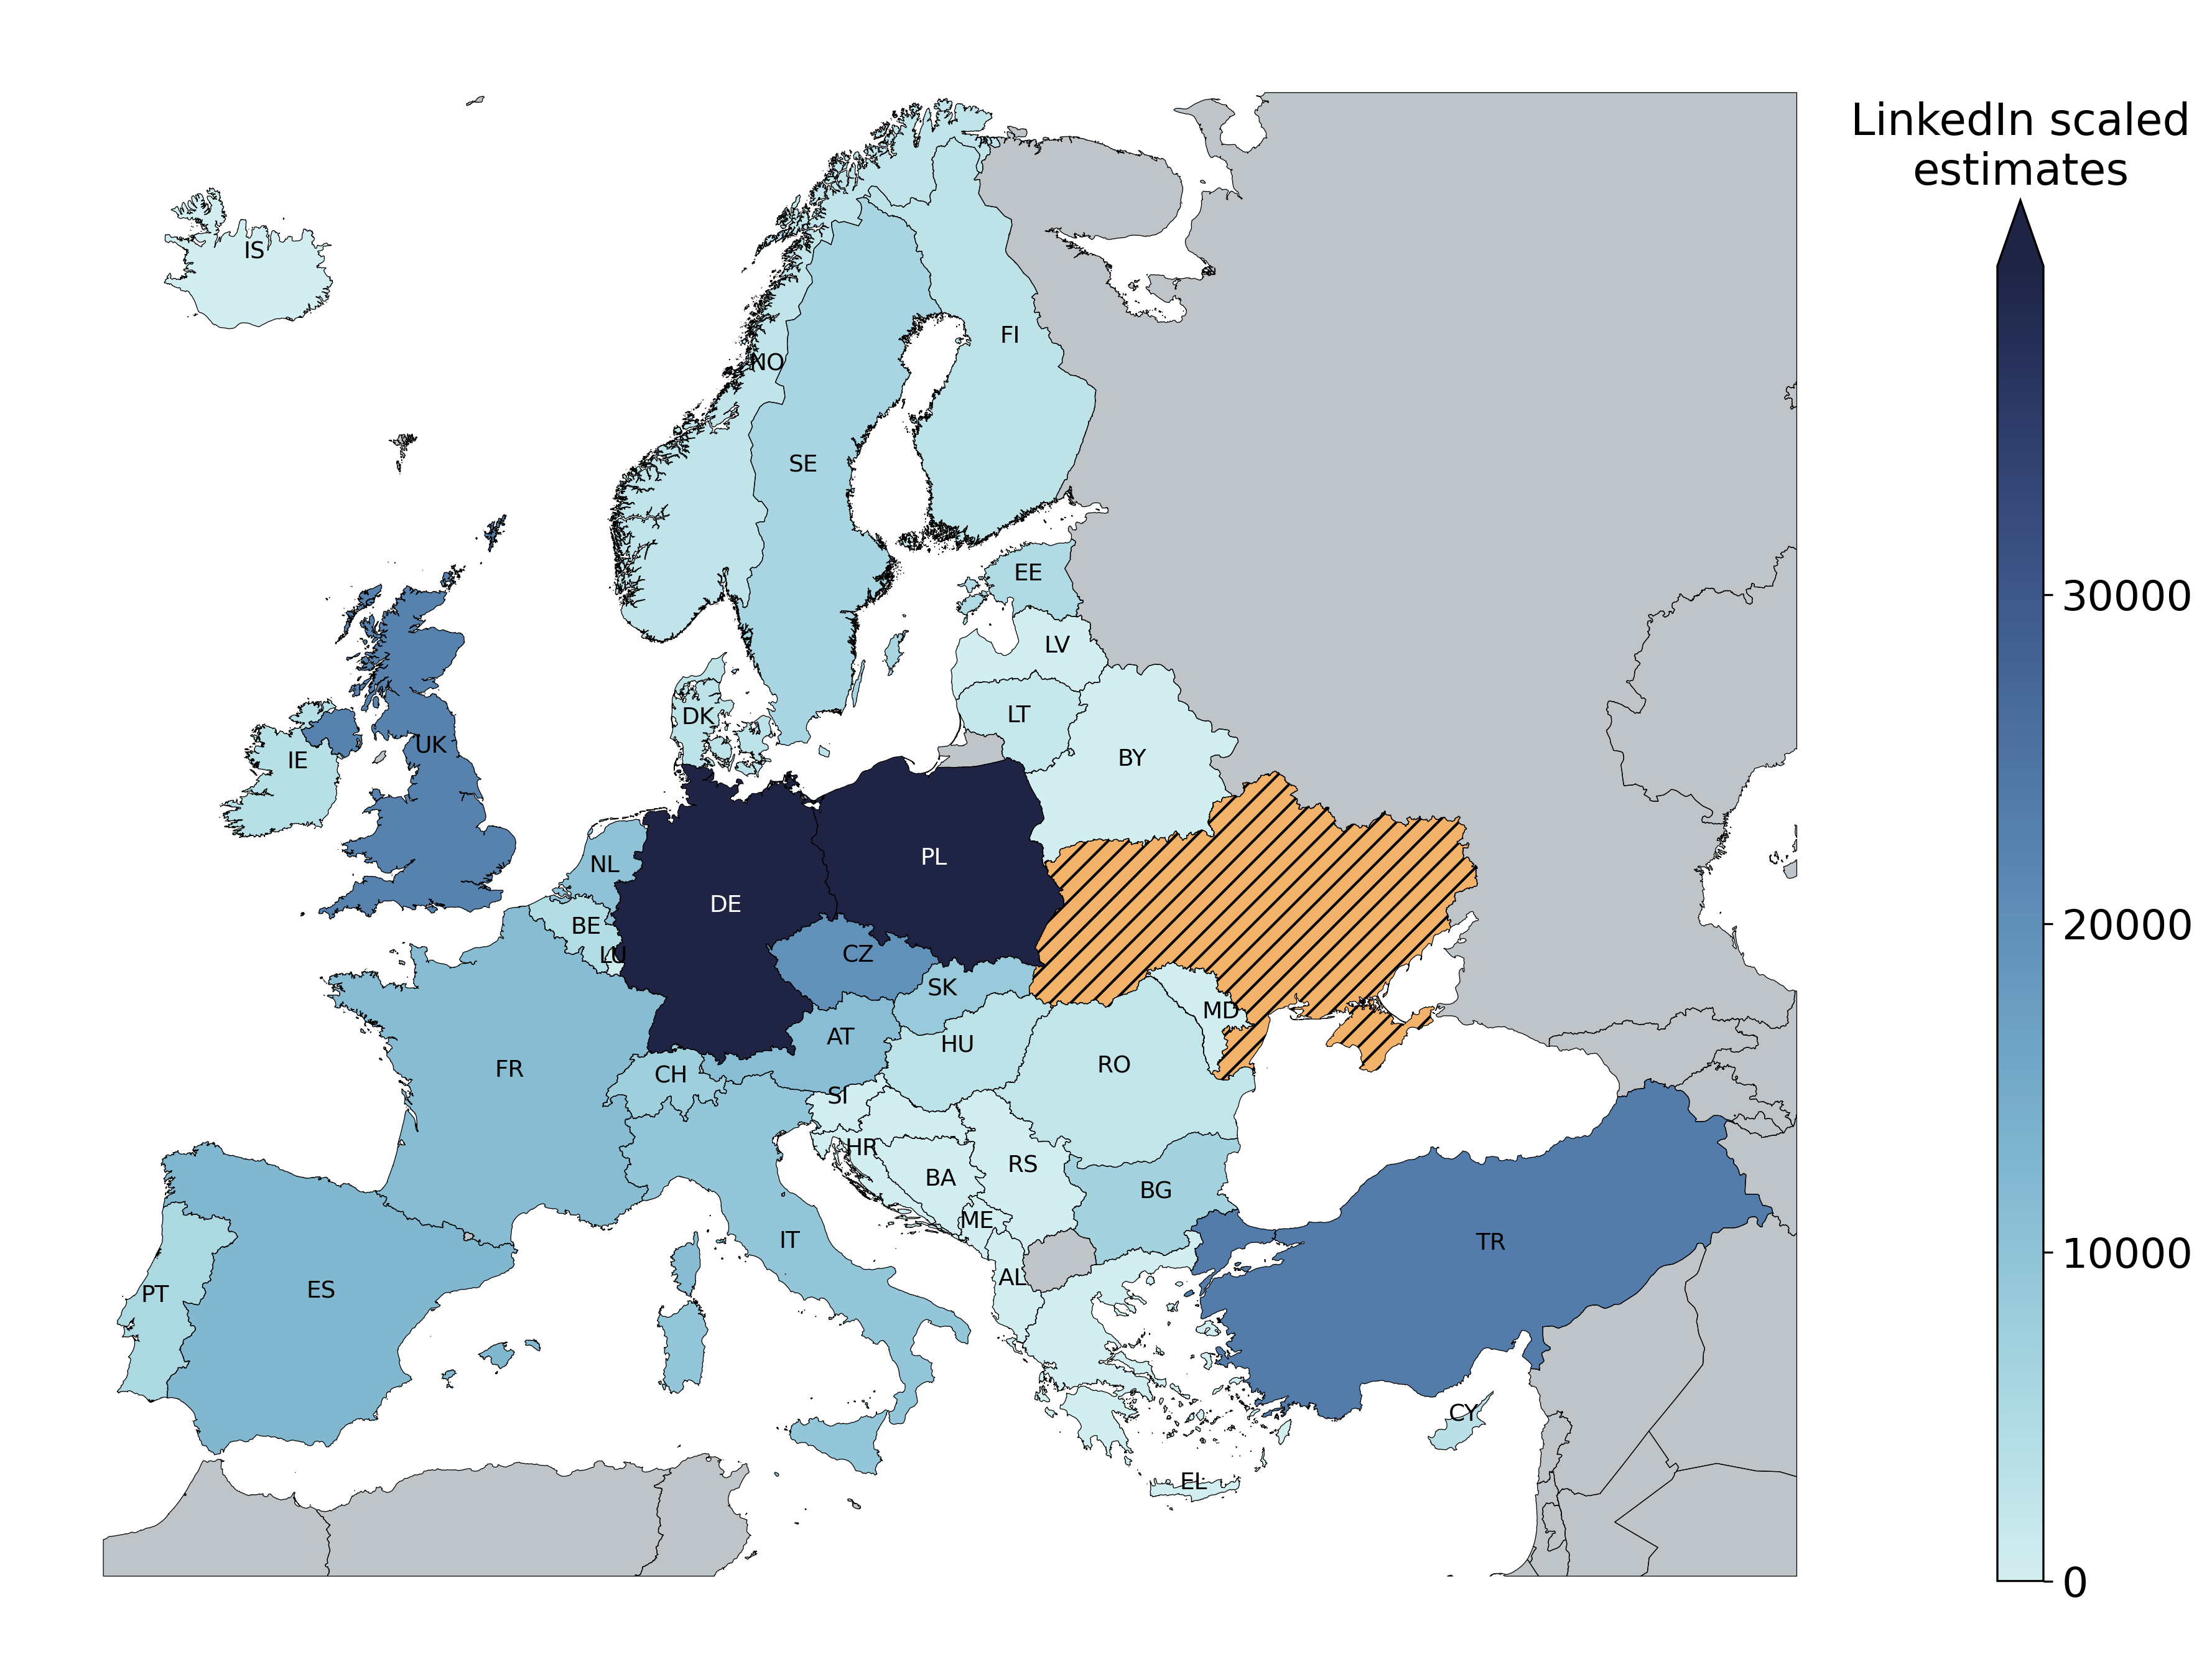
Overall we collected data from 38 countries; we have positive estimates for females for 28 countries, while for male mobility we have positive estimates for 24 countries. The two most represented age groups are the ones covering the active labor market, namely, 25-34 and 35-54 years old. Taking age into account, overall, we have the highest estimates for women compared to men, having attended a Ukrainian university and now residing in a different country. Exceptions are the 35-54 age group in the United States, Canada, Poland, the Czech Republic, and Germany, and the 55+ age group in Canada and the United States. Finally, in Turkey and Bulgaria, more men than women are estimated, regardless of age group. Among the 10 most preferred destination countries, the top eight out of ten and the tenth are common for men and women (Poland, Germany, the United States, Canada, the United Kingdom, the Czech Republic, Turkey, Spain, and Austria). Figure 1 depicts the Ukrainian migrants per European country by gender, while Figure 2 shows the geographic distribution of migration with darker areas to be highly preferred by the migrants.
Firstly, we assess the representativity of our data, showing that LinkedIn estimates can be used to support official data in monitoring migration trends. To do so, we compared LinkedIn data (without gender distinction) by the host country with the official estimates reported by UNHCR about the number of Ukrainian refugees across Europe.
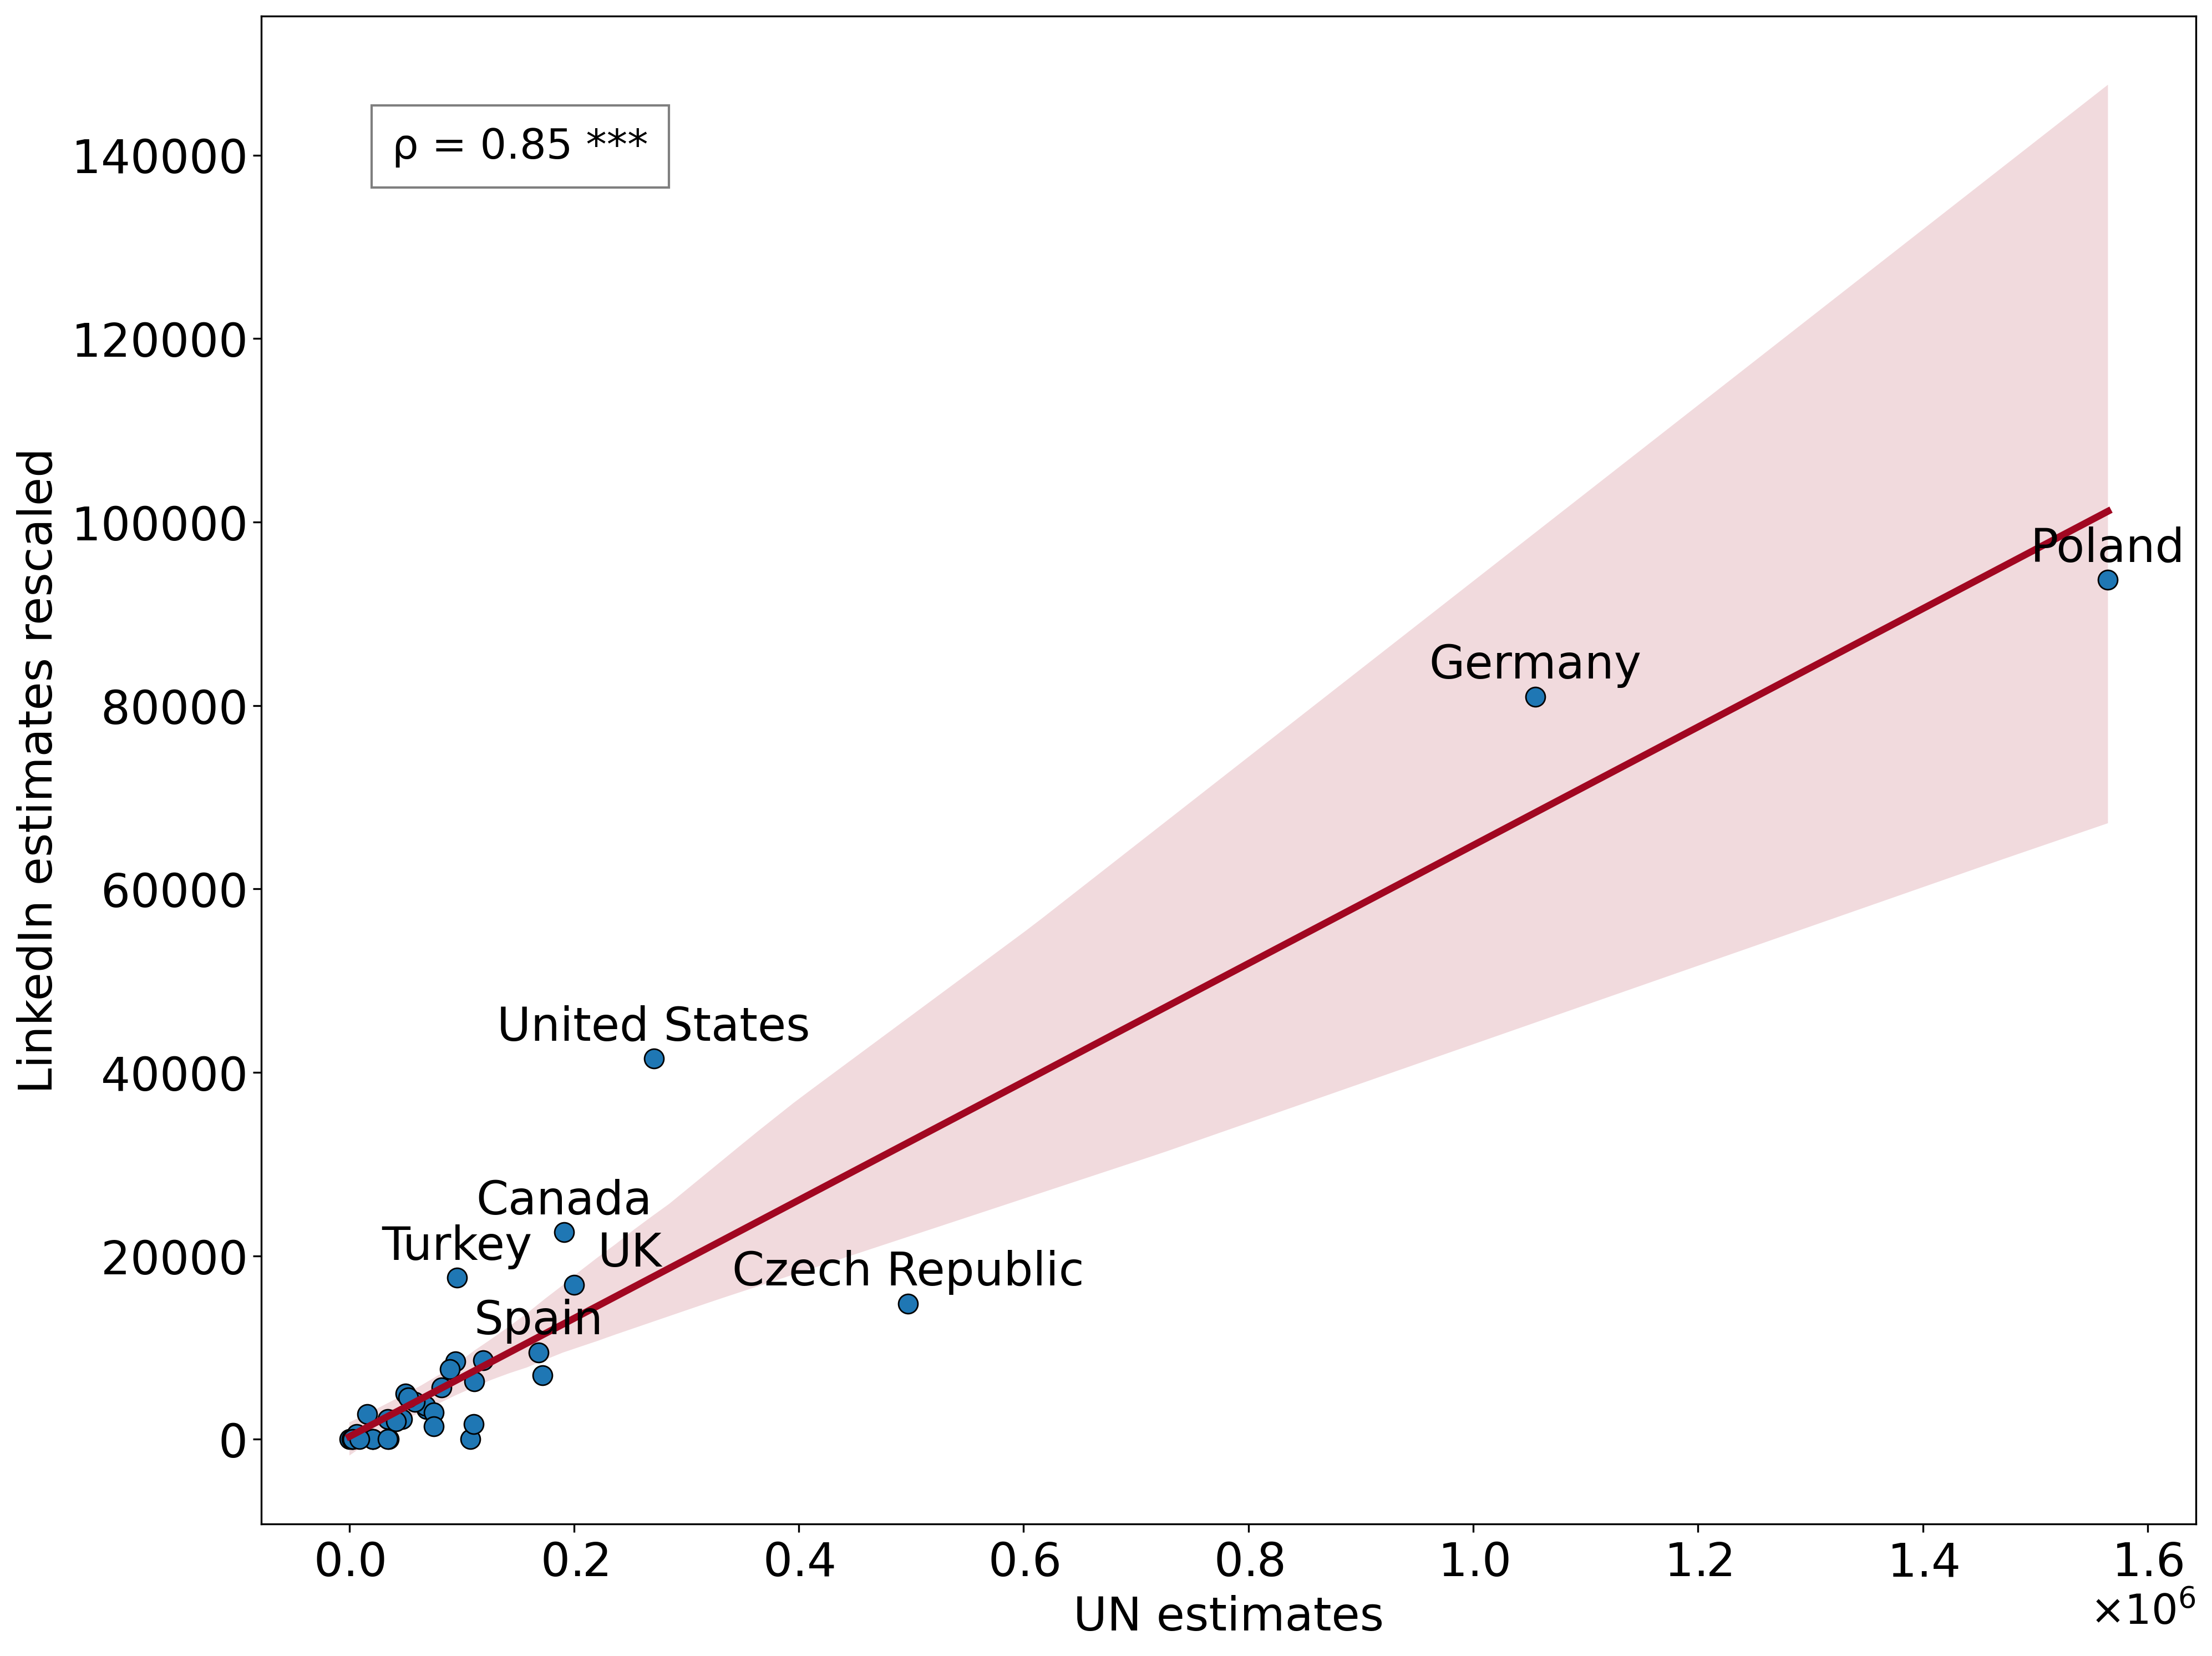
We find a significant positive Spearman555We opted for the Spearman correlation coefficient, due to the presence of outliers with much higher values than in other countries (Germany and Poland). correlation coefficient (, ) between LinkedIn estimates of tertiary educated Ukrainian migrants and UNHCR official figures of Ukrainian refugees by the host country (see Figure 3), implying that LinkedIn’s estimates of highly educated Ukrainians abroad are a good indicator of the actual number of Ukrainian refugees in a country. This can be justified by the results of the ongoing survey led by UNHCR for Regional Protection Profiling & Monitoring (from October 2022 onwards), which points out that most refugees have a high level of education (78%) and pre-war employment (60%), categories well covered by LinkedIn. Additionally, Ukraine has a much higher percentage of highly educated people than the European average (in the 30-34 age group 65% for women, 51% for men in 2021 (EUROSTAT, 2023)) and LinkedIn is a fairly widespread social media with penetration of 8.3% of the population (Datareportal, 2022). Hence, the LinkedIn ad estimates act as a valid proxy for the displacement of highly skilled professionals but are also a good proxy for the general population.
Facilitating the attainment of gainful employment that aligns with the educational and professional qualifications of refugees not only enhances their self-sufficiency but also contributes to the economic growth of the host community. To further investigate the outcome of the migration, we decided to collect data using LinkedIn’s Seniority feature as a target in the data collection to understand in the target countries which roles are most frequently filled by the highly educated Ukrainian migrants. We calculated for each country, grouped by gender, the percentage of workers in the different roles. Looking at the different distributions for each possible seniority level (Unpaid, Training, Entry, Senior, Manager, Director, VP, CxO, Partner, Owner), it emerges that the median for women is 51% for Entry level, 42% Senior, for all other roles the median distribution is zero. Similarly, for men, 48% Entry level, 40% Senior and 3% hold the role of Director. This outcome could potentially be attributed to data sparsity, meaning the occurrences wherein the count of individuals affiliated with a specific role and that received education from a Ukrainian university falls below the minimum threshold of 300, resulting in a value of 0. With sparse availability of data it is difficult to discern the actual distribution of roles held. We observe a notable presence of Senior and Entry level positions for both genders, with a nearly equal distribution among the audience. However, since information regarding users’ prior occupations is unavailable, it remains uncertain whether their current roles align with their previous professional experiences.
5.1. Temporal Evolution of Migration Patterns
The two time windows examined to assess the stability of the estimates are ten weeks and a week long, respectively. Inspired by the study of Rama et al. (Rama et al., 2020) who thoroughly assessed the temporal stability of Facebook estimates especially in under-represented populations, we assessed the stability of our estimates for the entire period of analysis. We considered two periods: the first considers the entire data collection window spanning over 10 weeks from 27/02/2023 to 12/05/2023. The second one examines the fluctuations over one week within the entire data collection period. For the weekly analysis, we breakdown the consecutive one-week periods: (i) from 28/04/2023 to 05/05/2023, (ii) from 05/05/2023 to 12/05/2023 and (iii) 12/05/2023 to 19/05/2023. The one-weeks periods aim at assessing the stability of the approach, while the ten-week one indicates the overall trend.
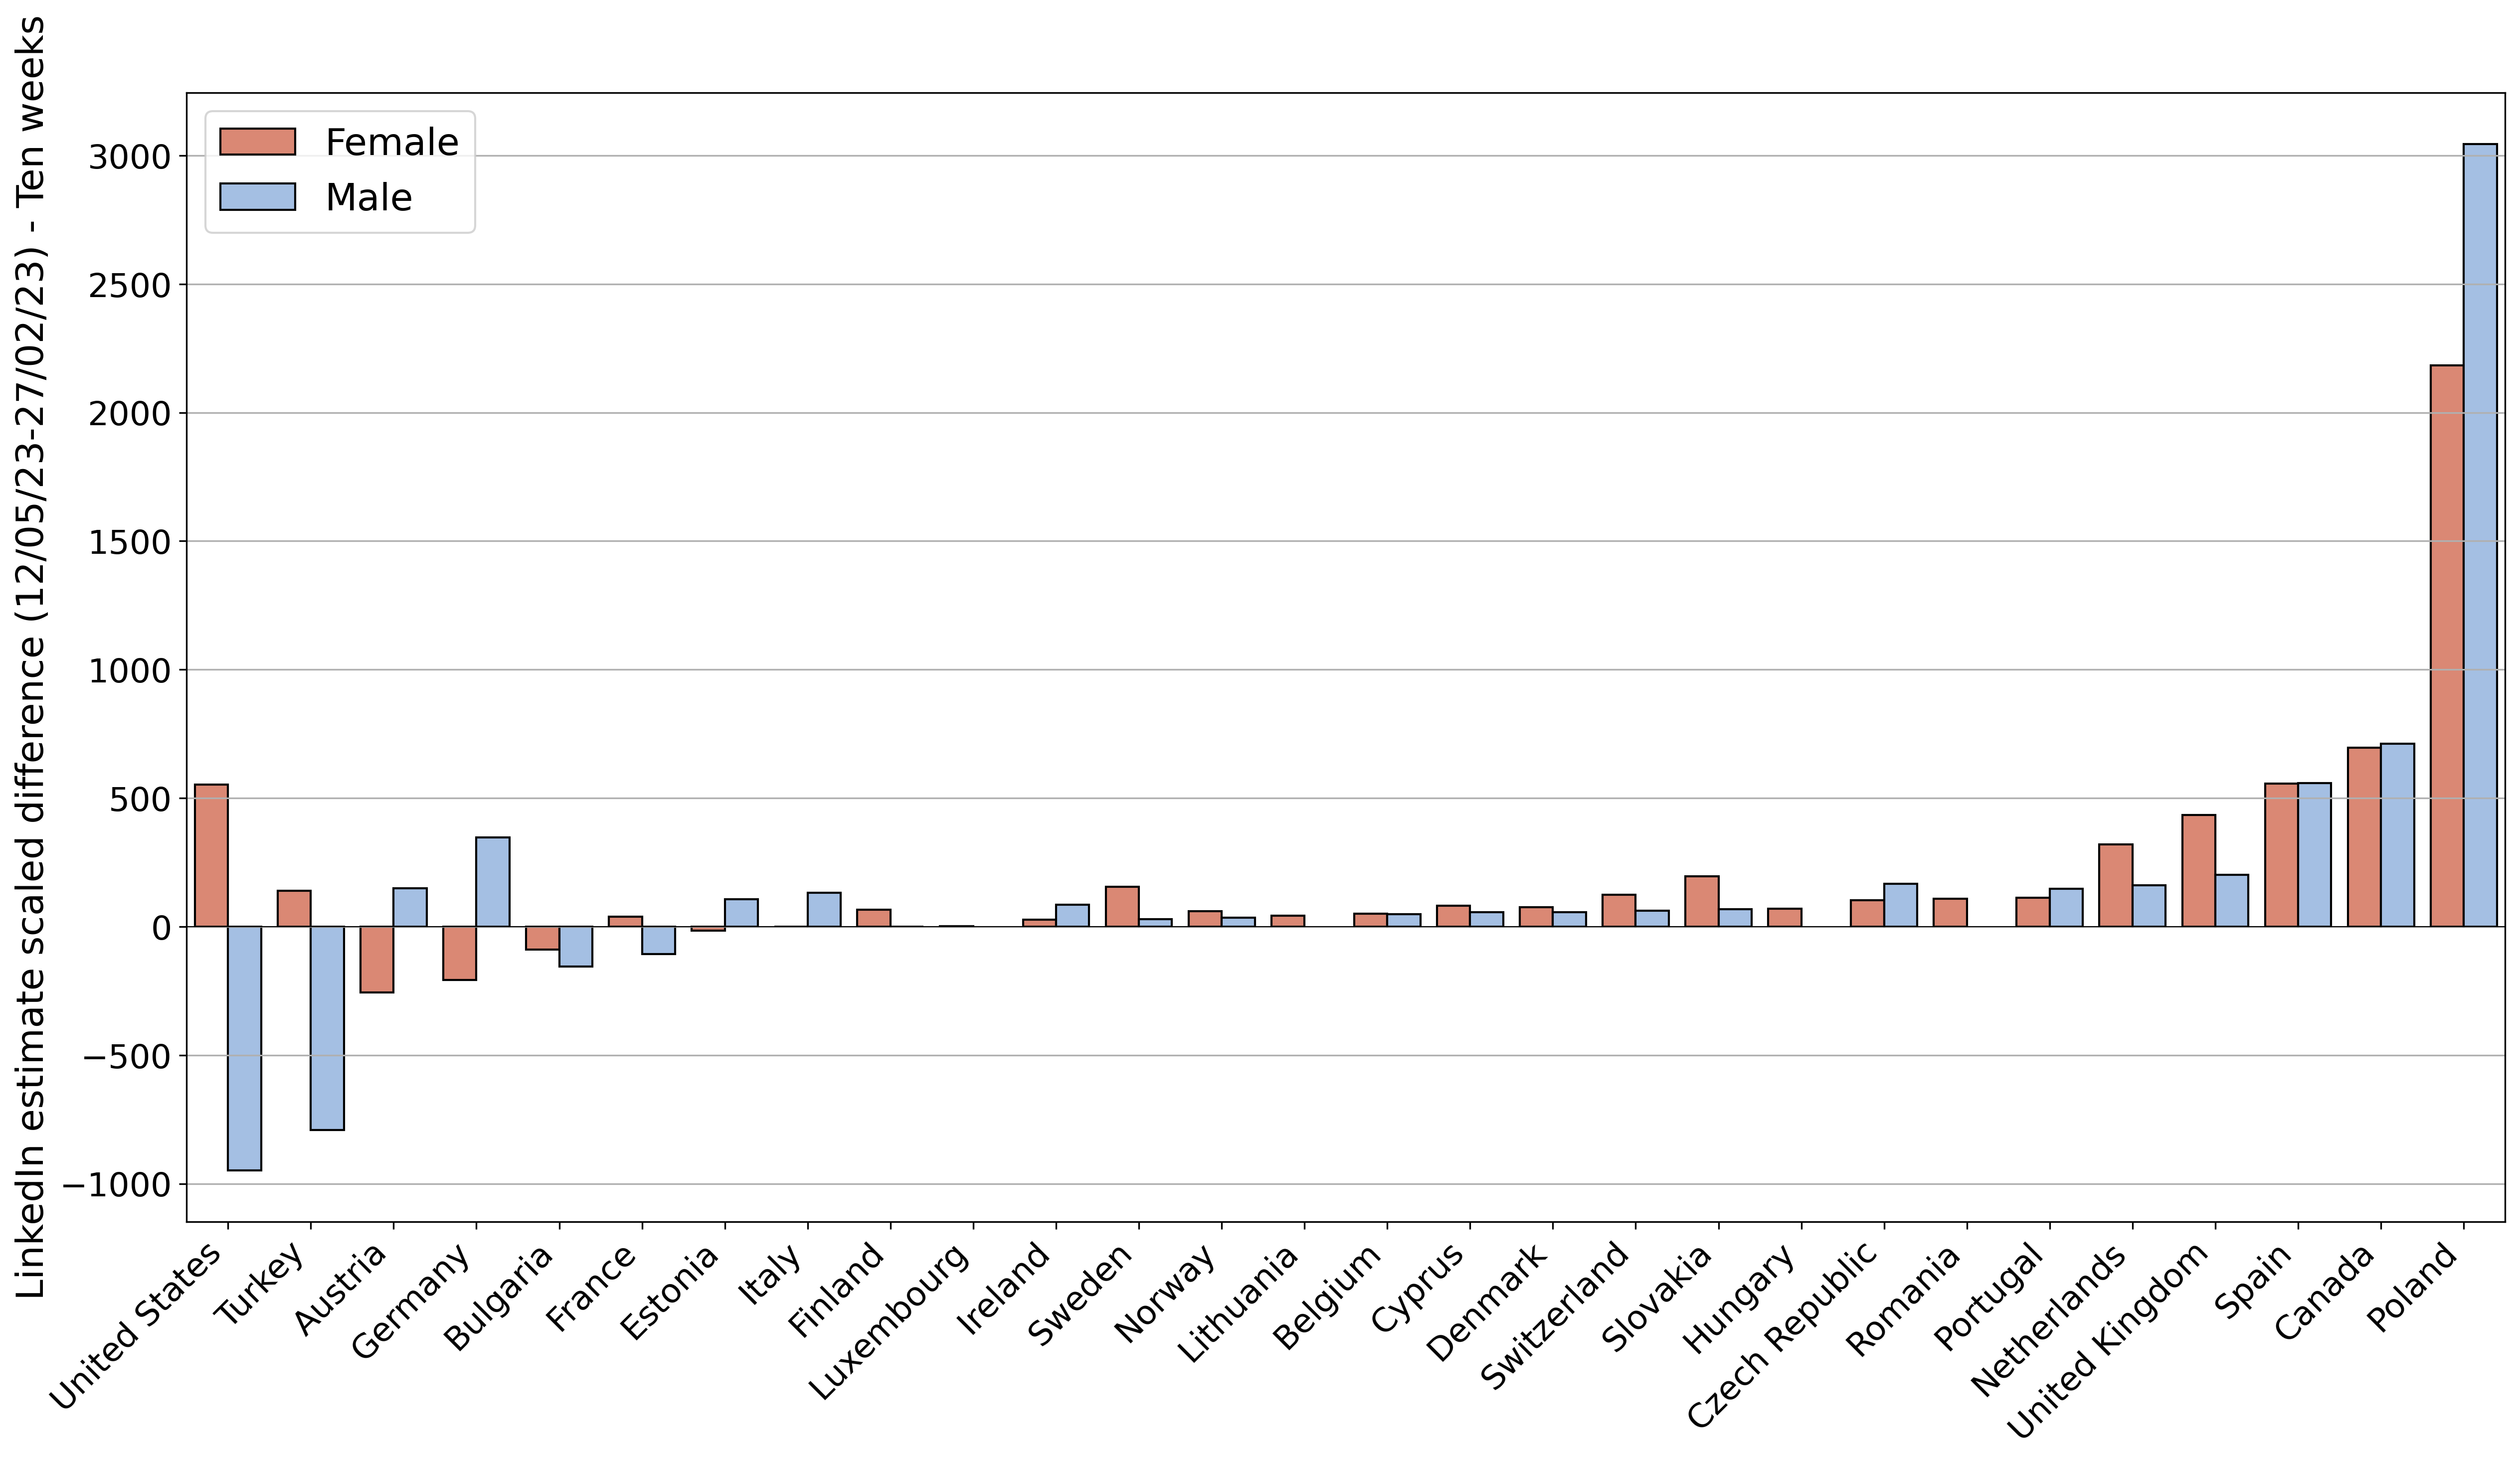
Over the entire period of ten weeks, the percentage changes become more significant with about 75% of the countries under 6.5% and over 1% for both genders. The estimates show a clear and stable increasing migration trend in time; Figure 4 depicts the trend of the per country during the entire period (Eq. 3 with and ).
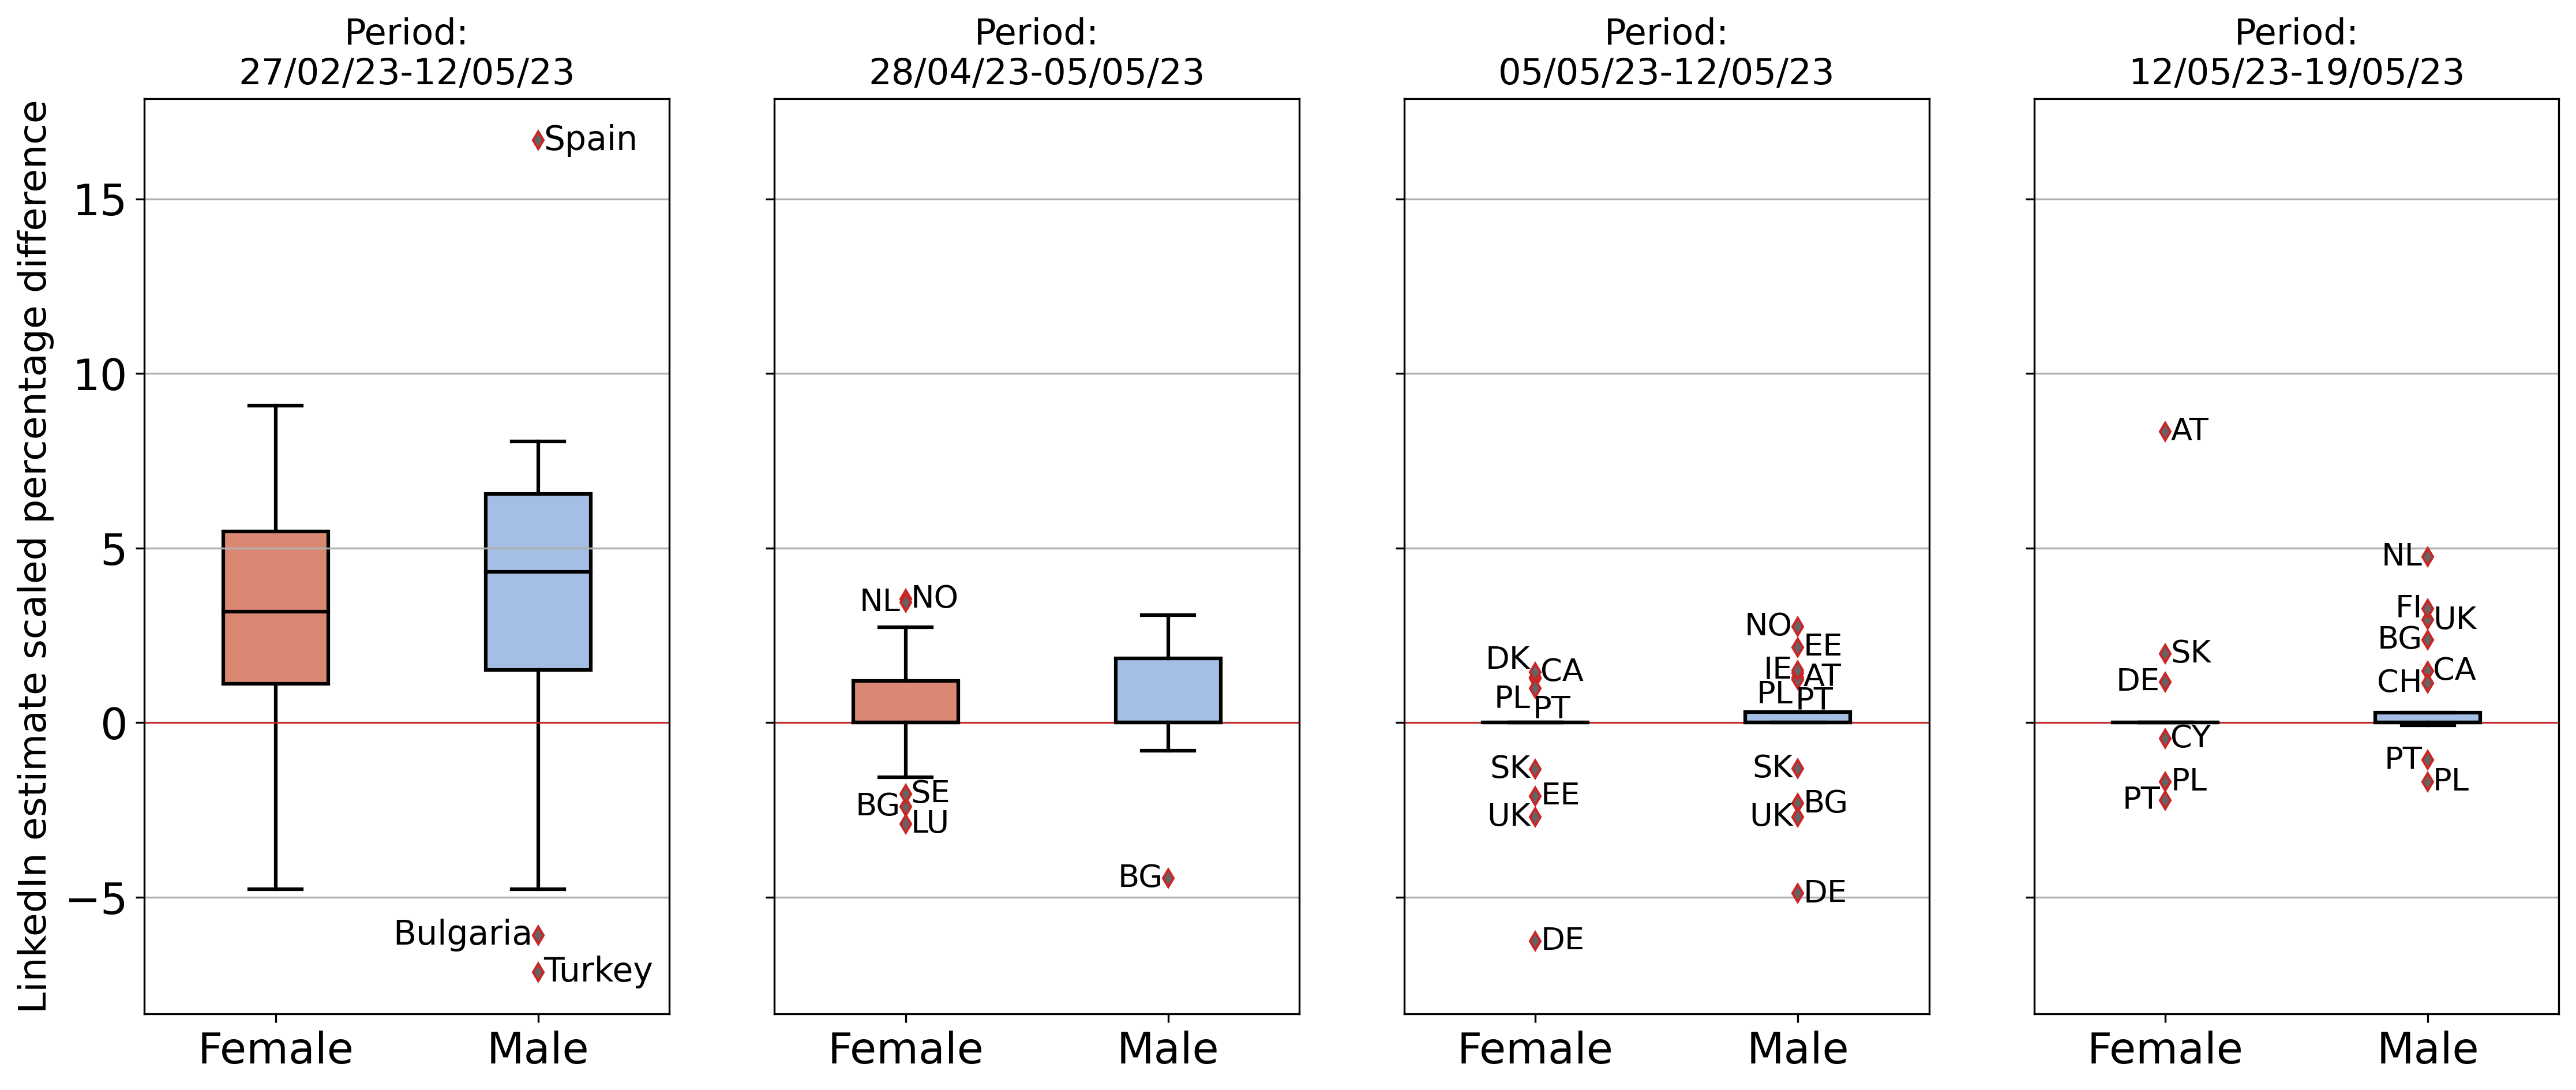
In Figure 5 we compare the distributions of LinkedIn estimate for the two different time windows by gender across the destination countries . The last three plots of Figure 5 depicts the distributions of the percentage differences for three one-week periods compared with the first boxplot related to the ten-week one. We notice that for both the time-windows the estimates increased with a higher peak for men in Spain in the ten weeks.
The second and third weeks have smaller inlier values with respect to the first week, on the other hand, the last ones have bigger outliers, for example, in the second week Germany has a change of -6.25% for women and -4.89% for men. This can be explained because the magnitude of Total population number LinkedIn (Germany) changed from 150.000 on May 05, 2023 to 160.000 on May 12, 2023. This growth increased the LinkedIn penetration (Germany) factor in the second week, and hence, the scaled estimates become significantly lower.
5.2. Modelling Migration
| Coefficients | Model Fit | ||||||
|---|---|---|---|---|---|---|---|
| LinkedIn estimates | SCI | Distance | GPI | GDP | F-statistic | ||
| Model 1 | 0.95*** | 0.91 | 329.2*** | ||||
| Model 2 | 0.32* | 0.08 | 4.1* | ||||
| Model 6 | 0.92*** | 0.18*** | 0.93 | 242.5*** | |||
| Model 7 | 0.99*** | -0.2** | 0.94 | 265.3*** | |||
| Model 8 | 0.96*** | -0.13** | 0.91 | 194.7*** | |||
| Model 9 | 1.04*** | -0.22*** | 0.94 | 296.9*** | |||
| Model 10 | 0.96*** | 0.12** | -0.15** | 0.95 | 216.0*** | ||
| Model 11 | 0.93*** | 0.20*** | -0.15** | 0.95 | 243.3*** | ||
| Model 12 | 1*** | 0.13*** | -0.19*** | 0.96 | 277.5*** | ||
| Model 13 | 0.99*** | 0.16*** | -0.10** | -0.14*** | 0.97 | 248.8*** | |
| Model 14 | 0.96*** | 0.15*** | -0.13*** | -0.14*** | 0.97 | 265.1*** | |
To address our main research question, namely, which are the main pull factors driving the migrants’ choice of the host country, we trained a series of predictive models. We consider a set of factors inspired by the existing literature (Beine et al., 2011; Crawley and Hagen-Zanker, 2019; Uebelmesser et al., 2013; Manafi and Roman, 2022), such as the host country’s distance from Ukraine, safety (peacefulness), the presence of pre-existing relationships as a support network in the host country, and the wealth of the host country. We followed an incremental experimental design. By combining several pull factors, we built multi-linear regression models to predict for each host country the number of Ukrainian refugees estimated by UNHCR.
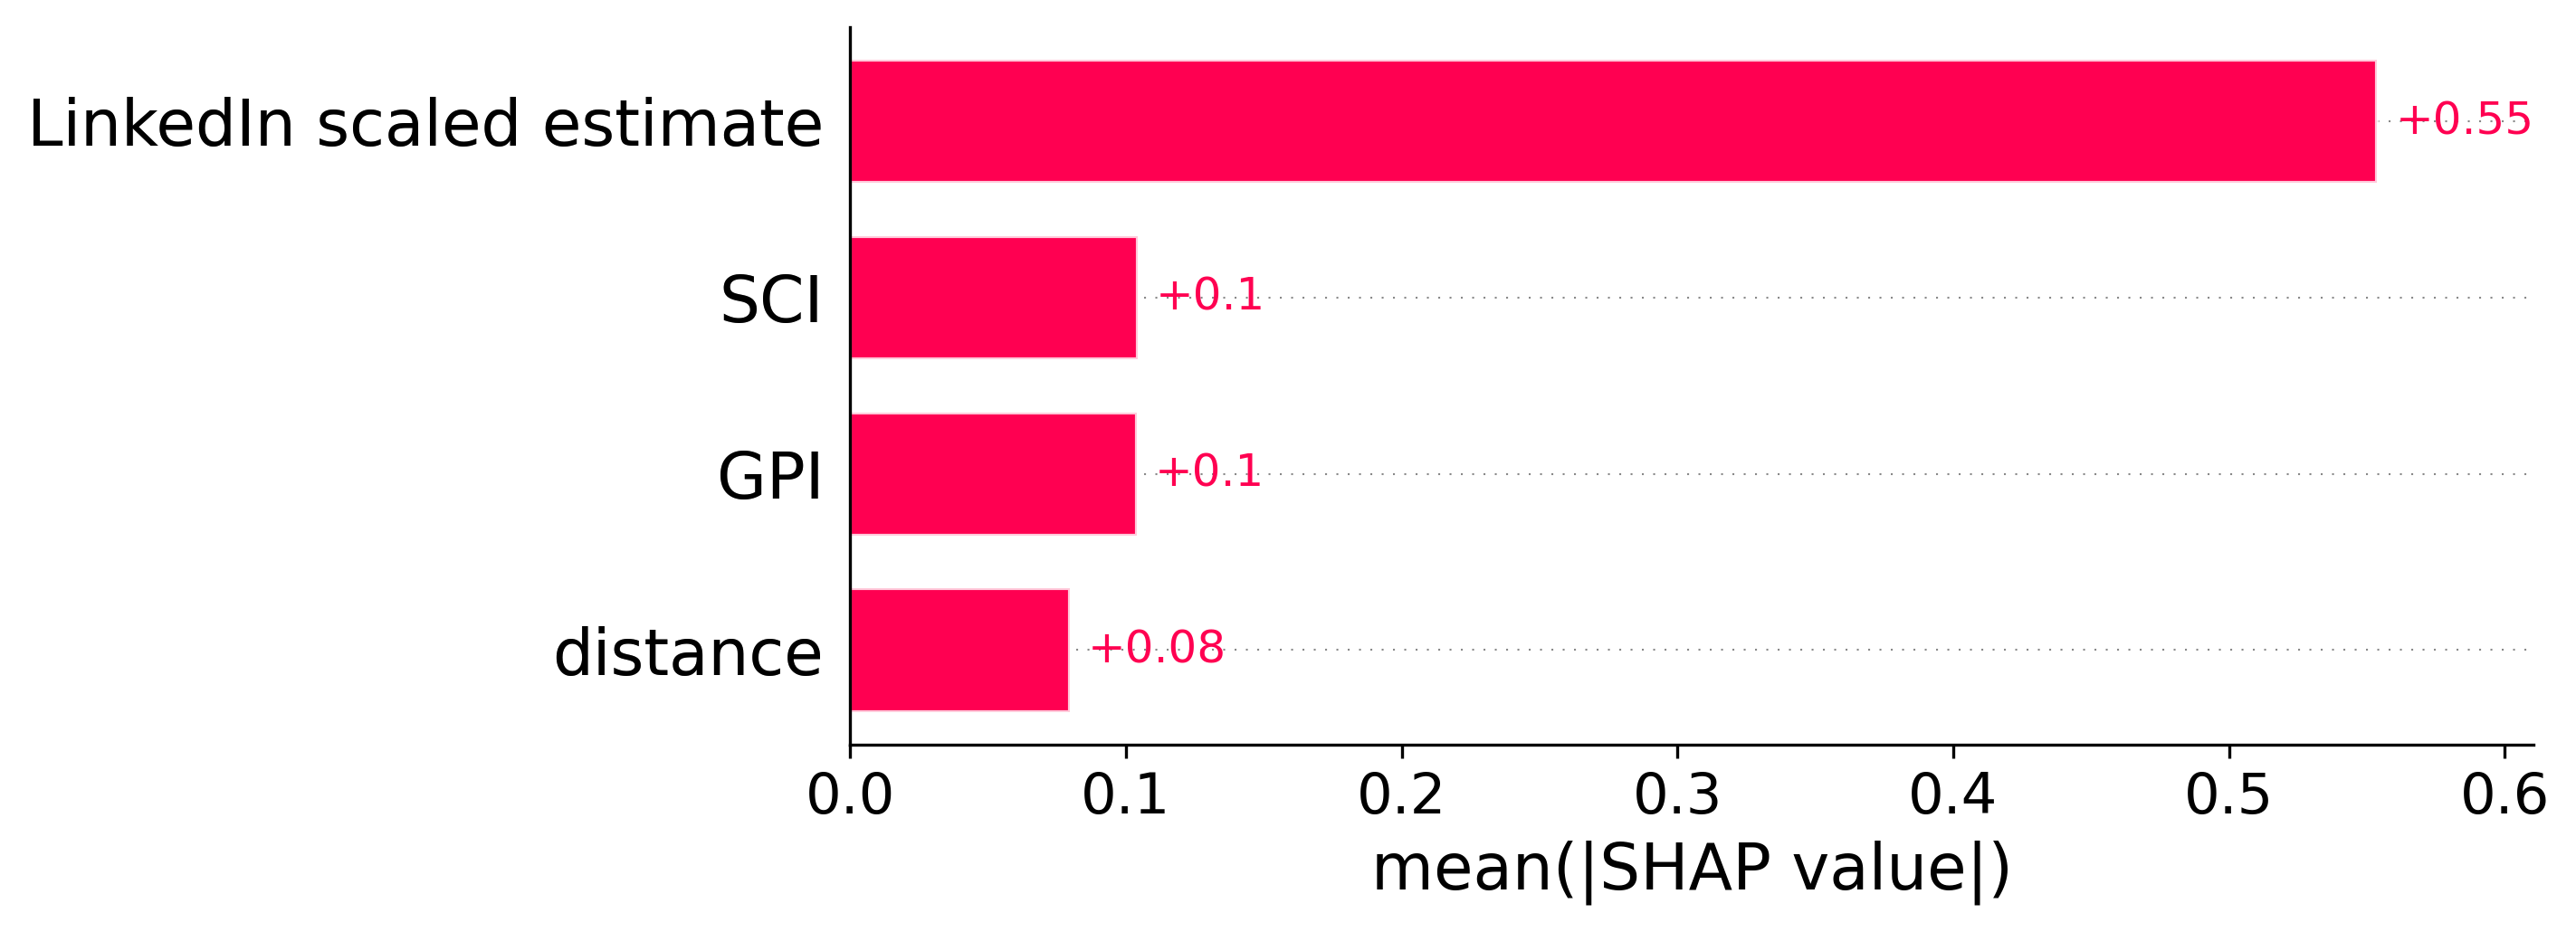
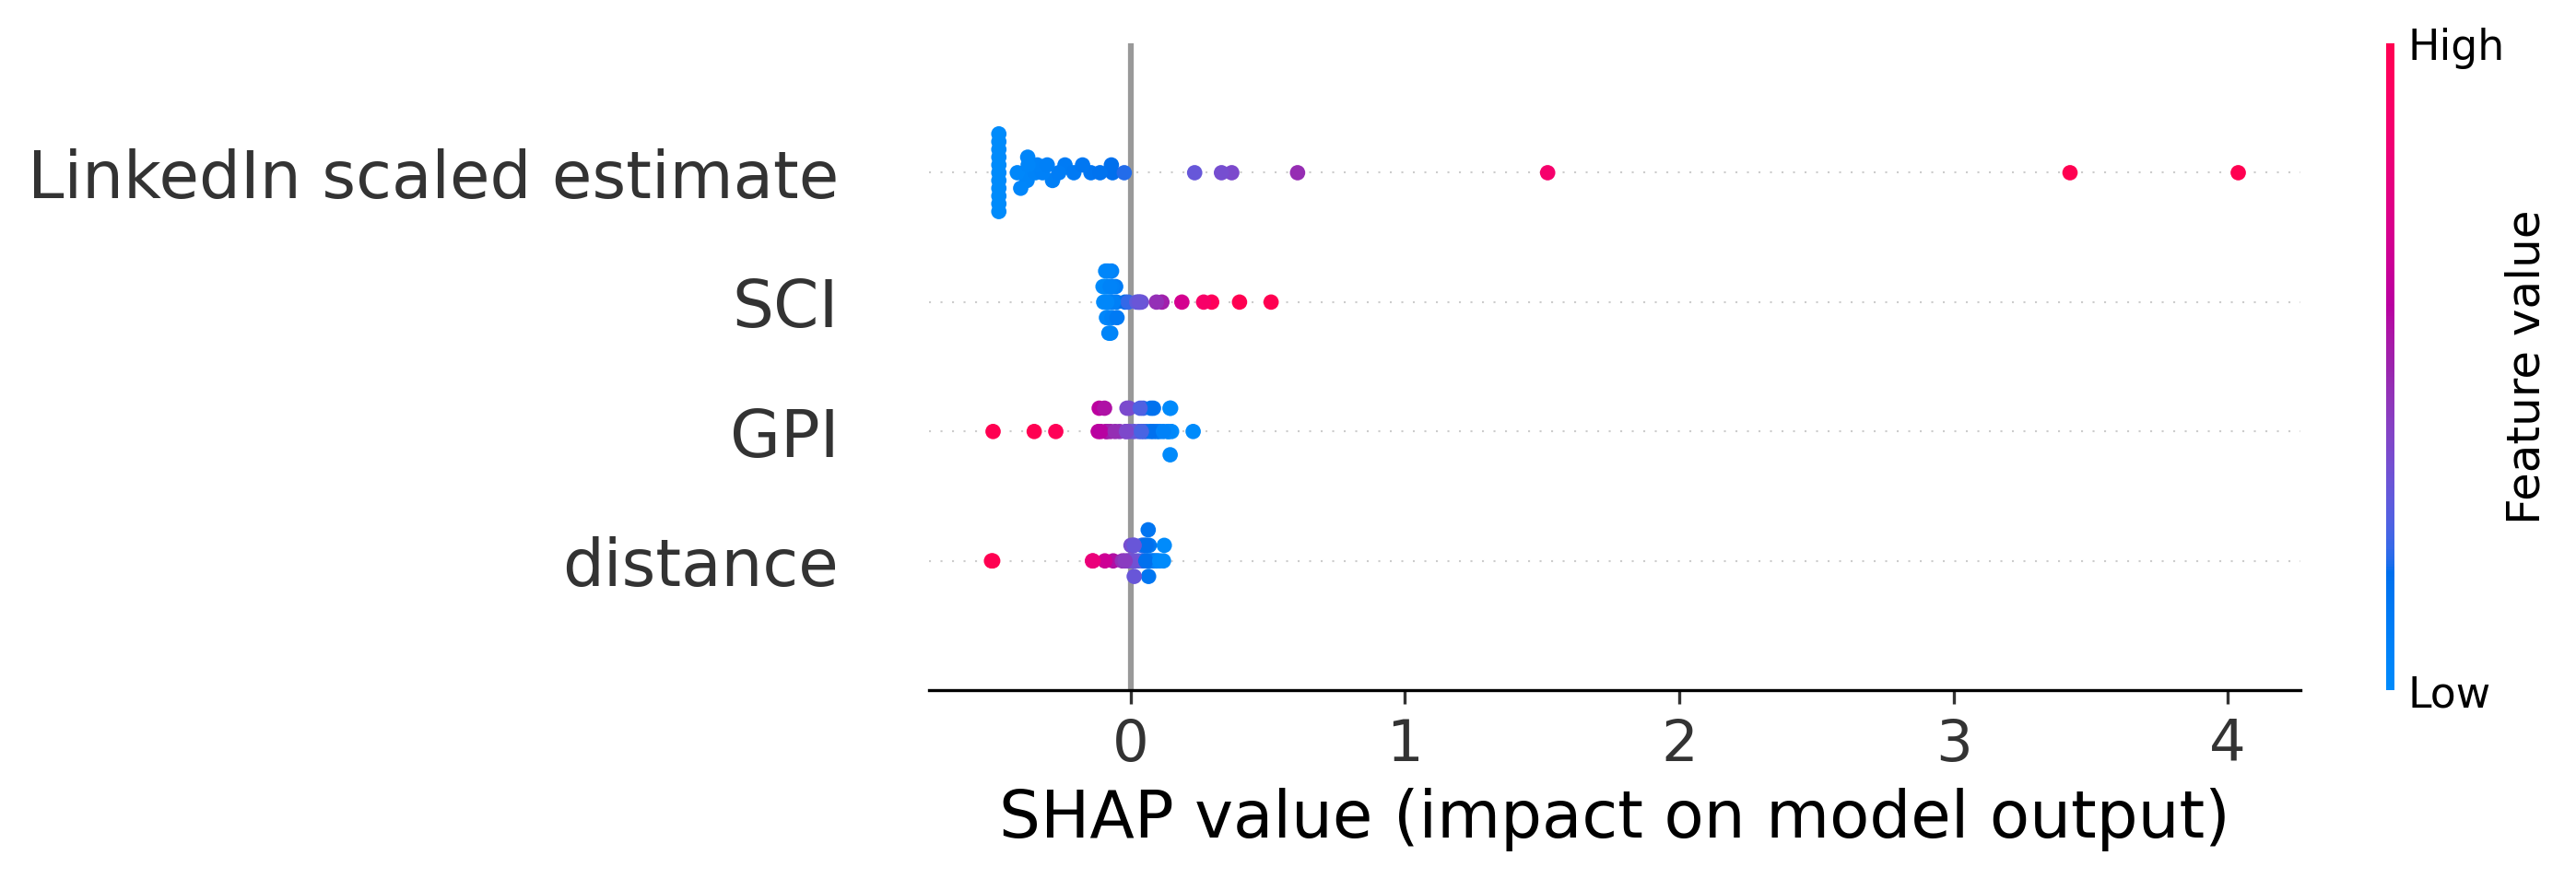
Table 2 reports the coefficients obtained for each set of normalized variables with significant coefficients for each trained model. We observe that the most important feature is the LinkedIn scaled estimates, which confirm the trends of the migration flows reported by UNHCR. Migration, being a complex phenomenon, requires the examination of a wide range of pull factors to better understand the decision-making process around the choice of the host country. From the predictive models built, we observe that the LinkedIn estimates alone are highly explanatory of the migration flows (Model 1 in Table 2), and Model 2 has a significant coefficient for the SCI even alone, indicating that people mainly choose the host country based on their social network. The model that best describes the variation of the migration flows is the one with the largest number of variables (Model 14 in Table 2). In this model, the SCI is the second most important feature considering the magnitude of the coefficients. Regarding distance and GPI, the negative signs of the coefficients are coherent with the meaning of the measure: the countries are less attractive when the two measures are higher, meaning that the closer a country is the less safe is considered. Finally, in Models 9, 12 and 13 the coefficient for GDP is negative, indicating that economic prosperity is less considered with respect to factors like safety or social network relationships of the people. GDP incidentally correlates with distance from Ukraine (the more distant countries are also richer) with countries like US and Canada which boost this behavior.
To fully assess the importance of each feature, we computed SHAP values for the best performing model (Model 14). We present the average of the absolute SHAP values for all countries (Figure 7), confirming that the two most important features are the LinkedIn estimates and the SCI. In Figure 7 are displayed the SHAP values for each country. We observe that the variables LinkedIn estimates and the SCI have a high contribution when their values are positive, and a low contribution on negative values. The situation is reversed for GPI and distance, which have a higher contribution when their values are negative.
5.3. Limitations
In light of the aforementioned potentials of our approach, is crucial to recognize and address the inherent limitations associated with the utilization of non-traditional data sources (Urbinati et al., 2020), as LinkedIn advertising estimates. Especially when dealing with vulnerable populations digital data may reveal sensitive demographic patterns (Beiró and Kalimeri, 2022). The measures derived from LinkedIn are likely to overestimate the number of tertiary-educated migrants due to the method’s limitations. Indeed, the information taken into account regarding universities is declared by the user and cannot be verified. Further users may be counted more than once if they attended more than one university in Ukraine. Nevertheless, inferring residence based on the university attended provides valuable insight since previous location data are unavailable from the LinkedIn ad platform. It is also important to notice that the collected estimates provide a snapshot of the situation at the time of collection. We access data only after February 2022 precluding comparison of earlier migration flows. Conversely, official UN figures quantify the total number of refugees since the Russian invasion in February 2022 but lack demographic information, hindering demographic comparisons with LinkedIn data. Finally, the UN reported more than 2,85 million Ukrainian refugees in Russia on October 2022 (UNHCR, 2023). However, Ukrainian refugees in Russia are not investigated in this work since LinkedIn’s audience location setting cannot be configured to Russia due to policy restrictions imposed by the Office of Foreign Assets Control (OFAC) of the US Department of the Treasury administers which publishes a list of prohibited trade-sanctioned countries (OFAC, 2023), as reported by LinkedIn in (LinkedIn, 2023).
6. Conclusion
The deterioration of relations between Ukraine and Russia escalated into conflict in 2014 and intensified in 2022 with Russia’s invasion of Ukraine. As a result, the Ukrainian population suffered significant migration flows in search of stability and better job opportunities, leading to one of the largest displaced workforces in Europe. The Russian invasion in February 2022 has made this need more urgent, strengthening migration flows. It is, therefore, imperative that host countries can direct them correctly and have a centralized view of the situation. The UNHCR is collecting estimates provided by the different authorities, struggling to capture the current situation due to the very nature of the problem. For this reason, non-traditional data sources have been used to support the official estimates. Our work fits into this context, using estimates from the LinkedIn ad platform to detect the number of people who have moved from Ukraine to another country. To collect the data, we limited our sample to members with tertiary education, using the status of the universities attended by the LinkedIn member as a target. Our collection estimates correlate strongly with official UN estimates and reveal trends in destination choices, with Poland and Germany as the preferred destinations. To investigate potential pull factors in country choice, we developed several linear regression models starting from LinkedIn estimates and indices for factors that by literature are spot as pull factors. The most important features are LinkedIn estimates and the 2021 Facebook Social Connectedness Index, which measures ties between individuals living in different countries. These findings confirm the importance of the presence of a community in the destination country in shaping the destination decision-making process. In contrast, distance plays a less significant role in migration patterns, which aligns with the nature of the collected estimates primarily representing settled migrants. The urgency to escape conflict swiftly is no longer the primary driver, shifting the focus toward other factors influencing destination choices. However, the observed phenomenon remains ongoing, as evidenced by the moderate yet consistent increase in variations over the longer period, in contrast to the minor fluctuations during the shorter period, indicating stability in the estimates. To conclude, although our data is restricted to LinkedIn members with tertiary education, we believe that for a highly educated country such as Ukraine, the communities sizes of highly educated people spread in other countries can be a good indicator for tracking flows and may be part of the pull factor that attracts new refugees.
Acknowledgements.
The authors gratefully acknowledge the support from the Lagrange Project of the Institute for Scientific Interchange Foundation (ISI Foundation) funded by Fondazione Cassa di Risparmio di Torino (Fondazione CRT).References
- (1)
- Ainsley (2023) Julia Ainsley. 2023. U.S. has admitted 271,000 Ukrainian refugees since Russian invasion, far above Biden’s goal of 100,000. Retrieved May 10, 2023 from https://www.nbcnews.com/politics/immigration/us-admits-271000-ukrainian-refugees-russia-invasion-biden-rcna72177
- Alexander et al. (2022) Monica Alexander, Kivan Polimis, and Emilio Zagheni. 2022. Combining Social Media and Survey Data to Nowcast Migrant Stocks in the United States. Population Research and Policy Review 41 (2022). Issue 1. https://doi.org/10.1007/s11113-020-09599-3
- Bank (2023a) The World Bank. 2023a. DataBankWorld Development Indicators. Retrieved May 10, 2023 from https://databank.worldbank.org/source/world-development-indicators
- Bank (2023b) The World Bank. 2023b. DataBankWorld Development Indicators. Retrieved May 10, 2023 from https://databank.worldbank.org/reports.aspx?source=2&series=NY.GDP.MKTP.CD&country=
- Beine et al. (2011) Michel AR Beine, Frédéric Docquier, and Caglar Ozden. 2011. Diaspora effects in international migration: Key questions and methodological issues. World Bank Policy Research Working Paper 5721 (2011).
- Beiró and Kalimeri (2022) Mariano G Beiró and Kyriaki Kalimeri. 2022. Fairness in vulnerable attribute prediction on social media. Data Mining and Knowledge Discovery 36, 6 (2022), 2194–2213.
- Berte et al. (2023) Margherita Berte, Kyriaki Kalimeri, and Daniela Paolotti. 2023. Monitoring Gender Gaps via LinkedIn Advertising Estimates: the case study of Italy. In Proceedings of the 15th ACM Web Science Conference 2023. 229–238. https://doi.org/10.1145/3578503.3583629
- Capozzi et al. (2021) Arthur Capozzi, Gianmarco De Francisci Morales, Yelena Mejova, Corrado Monti, André Panisson, and Daniela Paolotti. 2021. Clandestino or Rifugiato? Anti-immigration Facebook Ad Targeting in Italy. CoRR abs/2103.09224 (2021). arXiv:2103.09224 https://arxiv.org/abs/2103.09224
- Crawley and Hagen-Zanker (2019) Heaven Crawley and Jessica Hagen-Zanker. 2019. Deciding Where to go: Policies, People and Perceptions Shaping Destination Preferences. International Migration 57 (2019). Issue 1. https://doi.org/10.1111/imig.12537
- Datareportal (2022) Datareportal. 2022. DIGITAL 2022: UKRAINE. Retrieved May 10, 2023 from https://datareportal.com/reports/digital-2022-ukraine
- EUROSTAT (2022) EUROSTAT. 2022. Ukrainian citizens in the EU. Retrieved May 10, 2023 from https://ec.europa.eu/eurostat/statistics-explained/index.php?title=Ukrainian_citizens_in_the_EU
- EUROSTAT (2023) EUROSTAT. 2023. European Neighbourhood Policy - East - education statistics. Retrieved May 10, 2023 from https://ec.europa.eu/eurostat/statistics-explained/index.php?title=European_Neighbourhood_Policy_-_East_-_education_statistics#Tertiary_education
- Fatehkia et al. (2022) Masoomali Fatehkia, Zinnya Villar, Till Koebe, Emmanuel Letouzé, Andrés Lozano, Roaa Feel, Fouad Mrad, and Ingmar Weber. 2022. Using Facebook Advertising Data to Describe the Socio-Economic Situation of Syrian Refugees in Lebanon. Frontiers in Big Data 5 (3 2022). https://doi.org/10.3389/fdata.2022.1033530
- for Economics & Peace (2023) Institute for Economics & Peace. 2023. Global Peace Index 2022.
- Goglia et al. (2022) Diletta Goglia, Laura Pollacci, and Alina Sirbu. 2022. Dataset of Multi-aspect Integrated Migration Indicators. (4 2022). https://doi.org/10.5281/zenodo.6500885
- Heo et al. (2023) Nayoung Heo, Hsin-Chieh Chang, and Guy J Abel. 2023. Investigating the distribution of university alumni populations within South Korea and Taiwan based on data from the LinkedIn advertising platform. Cities 137 (2023), 104315. https://doi.org/10.1016/j.cities.2023.104315
- Jaroszewicz (2015) Marta Jaroszewicz. 2015. The migration of Ukrainians in times of crisis. OSW COMMENTARY Number 187, 2015-10-19. (2015). Retrieved May 10, 2023 from https://www.osw.waw.pl/en/publikacje/osw-commentary/2015-10-19/migration-ukrainians-times-crisis
- Jurić (2022) Tado Jurić. 2022. Big (Crisis) Data in Refugee and Migration Studies – Case Study of Ukrainian Refugees. Comparative Southeast European Studies 70, 3 (2022), 540–553. https://doi.org/10.1515/soeu-2022-0048
- Kashyap and Verkroost (2021) Ridhi Kashyap and Florianne C J Verkroost. 2021. Analysing global professional gender gaps using LinkedIn advertising data. EPJ Data Sci. (2021). https://doi.org/10.1140/epjds/s13688-021-00294-7
- Leasure et al. (2022) Douglas R Leasure, Ridhi Kashyap, Francesco Rampazzo, Claire Dooley, Benjamin Elbers, Maksym Bondarenko, Mark D Verhagen, Arun Frey, Jiani Yan, Evelina Akimova, and et al. 2022. Nowcasting daily population displacement in Ukraine through social media advertising data. (5 2022).
- Libanova (2019) Ella Libanova. 2019. Labour migration from Ukraine: Key features, drivers and impact. Economics & Sociology (2019).
- LinkedIn (2023) LinkedIn. 2023. Targeting Options for LinkedIn Advertisements. Retrieved May 10, 2023 from https://www.linkedin.com/help/lms/answer/a424655/targeting-options-for-linkedin-advertisements?lang=en
- Lloyd and Sirkeci (2022) Armağan Teke Lloyd and Ibrahim Sirkeci. 2022. A Long-Term View of Refugee Flows from Ukraine: War, Insecurities, and Migration. Migration Letters (2022).
- Manafi and Roman (2022) Ioana Manafi and Monica Roman. 2022. A Way to Europe: New Refugees’ Migration Patterns Revealed. Sustainability (Switzerland) 14 (2022). Issue 2. https://doi.org/10.3390/su14020748
- Mayer and Zignago (2012) Thierry Mayer and Soledad Zignago. 2012. Notes on CEPII’s Distances Measures: The GeoDist Database. SSRN Electronic Journal (2012). https://doi.org/10.2139/ssrn.1994531
- Mazzoli et al. (2020) Mattia Mazzoli, Boris Diechtiareff, Antònia Tugores, Willian Wives, Natalia Adler, Pere Colet, and José J. Ramasco. 2020. Migrant mobility flows characterized with digital data. PLoS ONE 15 (2020). Issue 3. https://doi.org/10.1371/journal.pone.0230264
- Meta (2023) Meta. 2023. Facebook Social Connectedness Index. Retrieved May 10, 2023 from https://data.humdata.org/dataset/social-connectedness-index
- Minora et al. (2023) Umberto Minora, Martina Belmonte, Claudio Bosco, Drew Johnston, Eugenia Giraudy, Stefano M. Iacus, and Francesco Sermi. 2023. MRS No. 73 – The war in Ukraine and the potential of Facebook’s Social Connectedness Index to anticipate human displacement. https://publications.iom.int/books/mrs-no-72-war-ukraine-and-potential-facebooks-social-connectedness-index-anticipate-human
- Minora et al. (2022) Umberto Minora, Claudio Bosco, Stefano M. Iacus, Sara Grubanov-Boskovic, Francesco Sermi, and Spyridon Spyratos. 2022. The potential of Facebook advertising data for understanding flows of people from Ukraine to the European Union. EPJ Data Science 11 (12 2022), 59. Issue 1. https://doi.org/10.1140/epjds/s13688-022-00370-6
- Mulska et al. (2021) Olha Mulska, Olha Levytska, Volodymyr Zaychenko, Taras Vasyltsiv, and Olha Ilyash. 2021. Pull environment of migration in the EU countries: Migration vector from Ukraine. Problems and perspectives in management (2021). https://doi.org/10.21511/ppm.19(4).2021.23
- OECD (2022) OECD. 2022. International Migration Outlook 2022. 408 pages. https://doi.org/10.1787/30fe16d2-en
- of Canada (2023) Government of Canada. 2023. Ukraine immigration measures: Key figures. Retrieved May 10, 2023 from https://www.canada.ca/en/immigration-refugees-citizenship/services/immigrate-canada/ukraine-measures/key-figures.html
- OFAC (2023) OFAC. 2023. Sanctions List Search. Retrieved May 10, 2023 from https://sanctionssearch.ofac.treas.gov/
- OHCHR (2014) UN OHCHR. 2014. Report on the human rights situation in Ukraine. Office of the United Nations High Commissioner for Human Rights 15 (2014).
- Palotti et al. (2020) Joao Palotti, Natalia Adler, Alfredo Morales-Guzman, Jeffrey Villaveces, Vedran Sekara, Manuel Garcia Herranz, Musa Al-Asad, and Ingmar Weber. 2020. Monitoring of the Venezuelan exodus through Facebook’s advertising platform. PLoS ONE 15 (2020). Issue 2. https://doi.org/10.1371/journal.pone.0229175
- Rama et al. (2020) Daniele Rama, Yelena Mejova, Michele Tizzoni, Kyriaki Kalimeri, and Ingmar Weber. 2020. Facebook Ads as a Demographic Tool to Measure the Urban-Rural Divide. CoRR abs/2002.11645 (2020). arXiv:2002.11645 https://arxiv.org/abs/2002.11645
- Sîrbu et al. (2021) Alina Sîrbu, Gennady Andrienko, Natalia Andrienko, Chiara Boldrini, Marco Conti, Fosca Giannotti, Riccardo Guidotti, Simone Bertoli, Jisu Kim, Cristina Ioana Muntean, Luca Pappalardo, Andrea Passarella, Dino Pedreschi, Laura Pollacci, Francesca Pratesi, and Rajesh Sharma. 2021. Human migration: the big data perspective. International Journal of Data Science and Analytics 11 (2021). Issue 4. https://doi.org/10.1007/s41060-020-00213-5
- State et al. (2014) Bogdan State, Mario Rodriguez, Dirk Helbing, and Emilio Zagheni. 2014. Migration of professionals to the U.S. Evidence from linkedin data. Lecture Notes in Computer Science (including subseries Lecture Notes in Artificial Intelligence and Lecture Notes in Bioinformatics) 8851. https://doi.org/10.1007/978-3-319-13734-6_37
- Uebelmesser et al. (2013) Silke Uebelmesser, Wido Geis, and Martin Werding. 2013. How do migrants choose their destination country? An analysis of institutional determinants. Review of International Economics 21 (2013). Issue 5. https://doi.org/10.1111/roie.12073
- UNHCR (2023) UNHCR. 2023. Ukrainian Refugee Situation. Retrieved May 10, 2023 from https://data.unhcr.org/en/situations/ukraine
- Urbinati et al. (2019) Alessandra Urbinati, Edoardo Galimberti, and Giancarlo Ruffo. 2019. Measuring Scientific Brain Drain with Hubs and Authorities: a Dual Perspective. (7 2019). https://doi.org/10.1016/j.osnem.2021.100176
- Urbinati et al. (2020) Alessandra Urbinati, Kyriaki Kalimeri, Andrea Bonanomi, Alessandro Rosina, Ciro Cattuto, and Daniela Paolotti. 2020. Young adult unemployment through the lens of social media: Italy as a case study. In International Conference on Social Informatics. Springer, 380–396.
- Verkroost et al. (2020) Florianne CJ Verkroost, Ridhi Kashyap, Kiran Garimella, Ingmar Weber, and Emilio Zagheni. 2020. Tracking global gender gaps in information technology using online data. Digital skills insights 2020 (2020).
- Vieira et al. (2022) Carolina C Vieira, Masoomali Fatehkia, Kiran Garimella, Ingmar Weber, and Emilio Zagheni. 2022. Using Facebook and LinkedIn Data to Study International Mobility. (7 2022). https://doi.org/10.31235/osf.io/v9ay5
- Wikipedia (2022) Wikipedia. 2022. List of universities in Ukraine. Retrieved May 10, 2023 from https://en.wikipedia.org/wiki/List_of_universities_in_Ukraine
- Zagheni et al. (2017) Emilio Zagheni, Ingmar Weber, and Krishna Gummadi. 2017. Leveraging Facebook’s Advertising Platform to Monitor Stocks of Migrants. Population and Development Review 43 (2017). Issue 4. https://doi.org/10.1111/padr.12102
- Zhao et al. (2023) Xinyi Zhao, Aliakbar Akbaritabar, Ridhi Kashyap, and Emilio Zagheni. 2023. A gender perspective on the global migration of scholars. Proceedings of the National Academy of Sciences 120 (2023), e2214664120. Issue 10. https://doi.org/10.1073/pnas.2214664120