Carbonates and ices in the galaxy-absorber towards PKS 1830–211 and within star-forming regions of the Milky Way
Abstract
A pair of 6.0 and 6.9 µm absorption features are frequently observed in Milky-Way (MW) molecular-clouds and YSOs; they also occur in the rest-frame of a molecule-rich spiral galaxy obscuring blazar PKS 1830–211. I calibrate -fitting methods which match observations with two or three laboratory spectra. The 6.0-µm component is dominated by H2O ice, as expected. Included MW sources were selected using opacity criteria which limit the range of explored H2O-ice column densities to 1.6– molecules cm-2, while the H2O-ice density in the galaxy absorber is molecules cm-2. CH3OH ice and / or small (< 0.1-µm-sized) Ca- and Mg-bearing carbonates contribute at 6.9 µm. The 41 % CH3OH : H2O molecular ratio in the PKS 1830–211 absorber is significantly higher than in the molecular cloud towards Taurus-Elias 16 (<7.5%) and similar to the highest value in MW YSOs (35% in AFGL 989). Fitted carbonate (-CO3) : H2O ratios in the galaxy absorber of 0.091% are low in comparison to most of the ratios detected in the MW sample (0.2–0.4 %; % in AFGL 989). Inorganic carbonates could explain the increased oxygen depletion at the diffuse-medium-to-molecular-cloud transition which Jones & Ysard associated with unobserved organic carbonates or materials with a C:O ratio of 1:3.
keywords:
quasars: individual:PKS 1830–211 – galaxies:abundances –galaxies: individual: PKS 1830–211 absorber, Milky Way – dust, extinction – solid state: refractory – solid state: volatile1 Introduction
In 1977 Puetter et al. (1977) observed Milky-Way (MW) protostars OMC 2-IRS3, GL 989, GL 2591, GL 2884 and NGC 7538 with the Kuiper Airborne Observatory (KAO) and found absorption features near 6.0 and 6.9 µm in addition to the known 3.0 µm ‘ice’ and 9.7 µm ‘silicate’ features. Puetter et al. (1979) subsequently observed massive star-forming region W51–IRS2 and suggested that the water of hydration in silicates could carry the 6.0 µm-band, carbonates could carry the 6.9 µm feature and that hydrocarbons could be additional components. May 1978 KAO observations of W33A (Soifer et al., 1979) provided the best early data set. Some forty-five years after discovery, the bulk of the 6.0 µm band is associated with H2O ice and the origins of the 6.9 µm band are ‘enigmatic’ with at least two components (e.g. Boogert et al., 2008). This ‘W’-shaped feature (Aller et al., 2012) is also seen in the face-on spiral galaxy lens obscuring blazar PKS 1830–211 (Winn et al., 2002).
The goals of this work are to determine the primary dust component(s) responsible for the 6.9 µm band. I compare results in the different MW and galaxy-absorber sightlines because differences in the dust components are a consequence of chemical and physical variations in their host environments. I use the smallest number of laboratory spectra in order to allow the statistics of the fits (reduced-chisquared values, ), to distinguish between models. In cases where the modelling is inconclusive, I constrain the results with information from other observations. Contributing dust components are: H2O and CH3OH ices, carbonates (calcite, dolomite, or magnesite), SiC, OCN- and CO2 ice. For the remainder of this paper the reader should assume that H2O, CO2 and CH3OH are ices unless stated otherwise.
Typical infrared absorption bands in MW star-forming environments are described in Section 2. MW source selection criteria are explained in Section 3 and their characteristics are decribed in Section 4. H2O, methanol (CH3OH), and carbonate models of the 6–8 µm spectra are outlined in Section 5; the laboratory data for modelling the astronomical bands are listed in Section 5.1 and Table 2. 20-µm-sized SiC grains are added to the 6–8-µm-model of Mon R2 IRS 3 in Section 5.4. Abundances of H2O, CH3OH, carbonates and SiC are derived in Section 6. In Section 7, shorter-wavelength bands at 4.3 and 4.6 µm in the PKS 1830–211 spectrum are associated with CO2 and OCN-, respectively. The quantitative results are summarised in Section 8 and the observational and theoretical consequences of a population of carbonate dust discussed in Section 9. The conclusions are in Section 10.
2 Infrared Absorption bands in MW molecular-clouds and YSOs
3–12 µm spectra of YSOs and sightlines through molecular clouds towards background stars within the MW contain several features between the 3.0 µm H2O ‘ice’ and 9.7 µm ‘silicate’ bands. They include:
2.1 Bands between 3 and 5 µm
Absorption bands near 3.25, 3.44 and 3.47 µm are not a part of this study because they do not appear in the PKS 1830–211 galaxy-absorber spectrum; they have recently been modelled with PAHs and hydrogenated PAHs co-condensed with H2O ice (Chiar et al., 2021). While the 3.25 µm band is normally associated with PAHs the 3.47 µm band is typically attributed to nano-diamonds (e.g. Allamandola et al., 1992). Bands at 3.54 and 3.95 are used to obtain CH3OH abundances (e.g. Gibb et al., 2004). Two, normally prominent, narrow absorption bands at 4.27 µm (fwhm µm) and 4.61 µm (fwhm µm) are assigned to the C=O stretch in pure CO2 or mixed CO2 bearing ices, and a CN stretch in OCN- or XCN, respectively (e.g. Gibb et al., 2004; Brucato, Baratta, & Strazzulla, 2006).
2.2 The 6.0 µm H2O and carbonaceous band
The non-gaussian 6.0 µm (fwhm µm) band associated with H2O ice is thought to contain additional contributions from carbonaceous materials. Possible contributors include: Organic Refractory Material (ORM; Gibb & Whittet, 2002), a 5.85 µm CO (carbonyl) band which occurs in Hydrogenated Amorphous Carbon (HAC) formed in an oxygen-bearing atmosphere (Grishko & Duley, 2002), and formic acid (HCOOH) as well as formate (HCOO-) ion which might contribute at 6.33 µm (see Boogert et al., 2008).
2.3 An ‘enigmatic’ band near 6.9 µm
2.3.1 CH3OH ice
CH3OH (e.g. Gibb et al., 2004) is a reasonable match to the µm-wide 6.9 µm band in many environments but the inferred abundance is frequently higher than estimates derived from the CH3OH bands at 3.54 µm and 3.95 µm. In addition, the peak-wavelength of the astronomical band shifts between sources whilst the CH3OH peak does not, so two components are thought to contribute (Keane et al., 2001; Boogert et al., 2008, 2011).
2.3.2 Aromatic and aliphatic candidates
Combinations of Polycyclic aromatic hydrocarbons (PAHs) have been found too narrow to fit the features in star-forming regions (Chiar et al., 2021; Mattioda et al., 2020). However, a narrower 6.9 µm absorption feature in the ISO spectrum of the line of sight towards Sgr A* (the MW Galactic Centre) which includes molecular-cloud and diffuse medium dust, is associated with asymmetric CH deformation modes in diffuse-medium aliphatic hydrocarbons (Chiar et al., 2000) because it is insufficiently broad to match CH3OH. This narrower feature has also been identified in the ice-free diffuse medium sightline towards Cyg OB2 no.12 (Hensley & Draine, 2020).
2.3.3 Oxygen-rich candidates–silicates and carbonates
Inorganic carbonates (of mineralogical formula X–CO3, where X is usually a combination including Mg, Ca, or Fe) were early candidates for the 6.9 µm band (Sandford & Walker, 1985) due the occurrance of a strong band (arising from an asymetric stretch within the CO ion; see White, 1974) near to this wavelength. However, Keane et al. (2001) excluded them from consideration because the 0.6 µm-wide carbonate bands in existing laboratory spectra were broader than the astronomical features. Bowey & Hofmeister (2005) found a match with the overtone spectrum of a crystalline silicate from the melilite (Ca2Mg(Si,Al)2O7) group, but laboratory measurements of a set of melilites (Bowey & Hofmeister, 2022) were used to prove that the ‘melilite’ band was produced by minor (<0.1 % by mass) contamination of the sample with carbonate powder 111True melilite overtones were a pair of narrow (¡0.1 µm-) peaks at 6.4 and 6.8 µm.. With the initial purpose of correcting the ‘melilite’ spectra, Bowey & Hofmeister (2022) obtained spectra of very thin –0.15 µm-thick carbonate films: the 6.9 µm absorption bands of these materials were narrower than those in the KBr-dispersion222 Transmission spectra derived from dispersions of powder mixed with other matrix material (KBr, polyethylene) have broader spectral peaks than those of thin films due to the effect of scattering between the grains and the matrix. Bowey, Hofmeister, & Keppel (2020) contains a detailed discussion of experimental methods and comparison between KBr and thin-film spectra for pyroxenes. Band-widths also increase if the grain-sizes or sample-thicknesses or grain sizes are too large because light is not transmitted at the band centre; Hofmeister’s preliminary spectra of thicker 0.2–0.3 µm carbonate films were significantly broader than the data in Bowey & Hofmeister (2022) and do not match astronomical spectra. Spectral artefacts are discussed in detail by Hofmeister, Keppel & Speck (2003). In the astronomical literature from the 1980s to 2000s this phenomenon is frequently referred to as ‘grain-shape and size effects’ and is one of the reasons why the use of particulate-spectra was frowned on in astronomy. spectra used by Keane et al. and provided a good match to a similar 6.9 µm absorption band produced by dust obscuring the carbon-rich atmosphere of Sakurai’s Object (V4334 Sgr) in 2005–2008 Spitzer observations. Interpretation of Sakurai’s Object spectra (Bowey, 2021; Bowey & Hofmeister, 2022) was simplified by the absence of ices as exemplified by the absence of a 6.0 µm H2O-ice absorption band. PAH absorption was added to match finer structure in its 6–7 µm spectra and fits improved if overtone features due to large (25 µm-sized) SiC grains were included in the model.
Here, I shall use the same carbonate spectra to model the sources in environments where the fitting is complicated by the co-existence of ices in the same lines of sight, and add SiC grains when necessary. The contribution of PAHs will be briefly considered, but is not a focus of this research.
An absence of experimental studies of carbonate formation under astronomical conditions, is frustrating, but unsurprising (see Bowey & Hofmeister (2022) for a detailed discussion). However, carbonates are candidate carriers of a broad 90-µm emission band in the spectra of planetary nebulae (PNe) (e.g Kemper et al., 2002) and YSOs (e.g Ceccarelli et al., 2002). Carbonates were also included in models of the spectra of freshly produced dust from the deep impact experiment on comet Tempel 1 (Lisse et al., 2007) because they produce a 6.9 µm absorption band in the spectra of pyroxene and layer-lattice interplanetary dust particles (Sandford & Walker, 1985). They are found with hydrated minerals in meteorites (e.g. Rubin & Ma, 2017), and form rapidly from CaO exposed to the air under ambient terrestrial conditions (Galván-Ruiz et al., 2009).
3 Selection of MW Sources
Due to the overlapping wavelengths of the CH3OH and carbonate 6.9-µm bands, fits to the 5–8 µm-spectra were compared with CH3OH to H2O abundance-ratios from 3–4 µm data for the MW targets. Hence, MW spectra were selected according to the following criteria:
-
1.
There must be good spectra of the 6–8 µm absorption bands which are unsaturated, i.e. the absorption peaks are curved rather than flat-topped. Laboratory spectra of rounded and flattened peaks indicate that the grains are too large or the sample is too thick for light to pass through to give a reliable spectral shape (e.g Hofmeister, Keppel & Speck, 2003) and footnote 2.
-
2.
There must be good unsaturated data for the 3.0 µm H2O band and estimates, or upper limits of the CH3OH abundance from the 3.54 µm and 3.95 µm bands.
The sample includes the quiescent sightline through the Taurus molecular cloud towards Taurus Elias 16 and spectra of YSOs in high-mass star forming regions (S140 IRS 1, Mon R2 IRS 3, AFGL 989). Unfortunately, these criteria eliminated observations of low-mass YSOs like -Elias 29 (the 6–8 µm spectrum was weak and relatively noisy), well-known high-mass YSOs like W 33A (saturated 3.0 µm band) which have more ice features than discussed here, and quiescent-molecular cloud sources (no 3.0 µm spectra), and sightlines where the 6–8 µm absorption bands were coincident with PAH emission. The 3–4 µm saturation constraint limits the range of explored H2O ice column densities and three of the four 3–4 µm CH3OH estimates are upper limits.
4 Sightline Characteristics
4.1 PKS 1830–211
The line of sight towards blazar PKS 1830–211 at is physically and chemically interesting at radio, submm and IR wavelengths because its light passes through a face-on lensing spiral galaxy at a redshift of (Winn et al., 2002). Two or three lensed components are observed in ALMA images with a maximum separation of 1 ″(Muller et al., 2020). The SW component of PKS 1830–211 is currently the only high redshift object in which gas-phase methanol (CH3OH) absorption has been detected in the submm (Muller et al., 2021); this together with other submm and radio absorption bands due to 60 gas-phase molecular species indicate conditions within the galaxy-absorber are similar to those in Milky-Way (MW) cold molecular clouds and hot UV-rich HII regions associated with young stellar objects (YSOs) (Tercero et al., 2020; Muller et al., 2021).
PKS 1830–211 was a single object in the ″ aperture of the Short-Low (SL) module of the infrared spectrometer (IRS) on Spitzer; its spectrum is known for its unusual 10 µm silicate absorption feature which resembles crystalline olivine (Aller et al., 2012), rather than the glassy silicates common to other galaxies and the interstellar medium of the MW; early MIRI/JWST observations are scheduled (Aller & Kulkarni, 2021). Aller et al. (2012) also remarked on the similarity between the galaxy-absorber’s additional 6.0 µm and 6.9 µm bands and those in MW embedded ice-rich YSOs and associated the 6.0 µm-band with H2O ice. The data selection process for this work is explained in Appendix A.
4.2 MW Dark molecular cloud: Taurus Elias 16
The interstellar line of sight towards the field-star Elias 16 is the archetypal quiescent dark and dusty molecular cloud environment because it is a bright and highly reddened field star (E(J-Ks)=4.76; A19) of spectral type K1 III behind the Taurus Molecular Cloud (Chiar et al., 2007). Spectral studies of ices, PAHs and silicates, and spectropolarimetric studies of ices have all been made towards Elias 16 (e.g. Knez et al., 2005; Chiar et al., 2021; Bowey, Adamson, & Whittet, 1998; Hough et al., 2008, respectively). Spitzer data in this work are from the CASSIS archive; the original observations were published by Knez et al. (2005). Short Wavelength Spectrometer (de Graauw et al., 1996) Infrared Space Observatory (ISO) data published by Gibb et al. (2004) were used for analysis in the 2–5-µm range.
4.3 MW Massive Star-Forming Regions
SWS/ISO spectra published by Gibb et al. (2004) were used for S140 IRS 1, AFGL 989 and Mon R2 IRS 3.
S140 is an H II region located 910 pc away behind mag of extinction in a molecular cloud, which is forming high- and low-mass stars (Evans et al., 1989). K’ band images (Preibisch & Smith, 2002) show several high mass YSOs (8–10 M☉) within the 30–40″ ISO beam. S140 IRS 1 has a dust disc which has been resolved at 1.3mm (Maud & Hoare, 2013).
AFGL 989, otherwise known as Allen’s Source, is the brightest IR source in NGC 2264 (IRS 1). It is a high-mass YSO (10 M☉) which is invisible in the optical. Mid-infrared interferometric observations indicate that the object is surrounded by a flat circumstellar disk that has properties similar to disks typically found around lower-mass young stellar objects (Grellmann et al., 2011). The luminosity is consistent with a 9.5 M☉ B2 zero-age main-sequence star (Allen, 1972) with 20–30 mag of visual extinction (Thompson et al., 1998).
In the near-infrared, Mon R2 IRS 3 is a bright 500-au conical reflection nebula containing two to three massive early-type stars (IRS 3N, IRS 3S and possibly IRS 3 NE). Infrared speckle imaging suggests that the conical-shaped nebula is due to collimation of the light of IRS 3 by a 500-au disc (Koresko et al., 1993) and the presence of three further sources within 2.6 arcsec of IRS 3S; the to the primary is >30 mag (Preibisch et al., 2002).
5 Ice and carbonate models of 6–8 µm spectra
The infrared continua of objects with strong absorption features are poorly constrained longward of 5 µm (e.g. see Gibb et al., 2004; Boogert et al., 2008) and it is common practice to use a low-order polynomial or spline fit over as wide a wavelength range as possible and then to add the absorbers for each of the bands. In contrast to this approach, I select laboratory data for thin films of candidate absorbers and simultaneously fit the optical depths and continua. My continua are represented by simple mathematical formulae over the narrower wavelength range of the absorption features; these represent an ill-defined combinination of the effects of baseline subtraction from the laboratory spectra, source physics, and foreground extinction.
Since ice abundances are usually given in terms of number of molecular absorbers (i.e. molecular density) whilst abundances of the refractory components (i.e. the grain cores) are quoted as mass and grain number densities, I give estimates of all three parameters. The relationship between these quantities is described in Appendix B.
5.1 Laboratory spectra used to model the absorption bands
Each continuum function, , was extinguished by up to three components represented by H2O and CH3OH, and one of the carbonate spectra listed in Table 1.
| (1) |
where is the shape of the absorber, normalised to unity at the tallest peak in the wavelength range of interest.
| Absorber | 333Sample thickness, , is used as a proxy for grain length in refractory components (see Appendix B.2 for justification). The nominal volume is . | 444fwhm | – | |||||
| µm | µm | gcm-3 | cm2g-1 | cm-1 | cm molecule-1 | cm-1 | Ref.555 References: Spectrum and film thickness from 1– Hudgins et al. (1993), 2– Bowey & Hofmeister (2022), 3–Hofmeister et al. (2009); spectrum from 4 –van Broekhuizen et al. (2006), 5–Brucato, Baratta, & Strazzulla (2006). References for ice mass densities, : 6– H2O at 20K –Dohnálek et al. (2003); 7– CH3OH at 20 K–Luna et al. (2018); 8– CO2 at 80 K Mangan et al. (2017). Refractory measurements and densities were obtained at room temperature. | |
| 6–7 µm components | ||||||||
| Ices | ||||||||
| H2O | 6.05 | 0.41 | 0.94 | 1700 | 144 | 1100–1900 | 1, 6 | |
| CH3OH | 6.85 | 0.56 | 0.64 | 3000 | 115 | 1200–1800 | 1, 7 | |
| Carbonates | ||||||||
| Dolomite, CaMg(CO3)2 | 6.87 | 0.15 | 2.86 | 33000 | 120 | 666To follow chemical convention, the formula has two CO3 groups because Fe and Mg are interchangeable in the same lattice positions. Quoted band strength is the value per CO3 group to match the other carbonates. | 1200–1700 | 2 |
| Magnesite, MgCO3777Magnesite provided a good fit to data for Sakurai’s Object (Bowey & Hofmeister, 2022), the integrated cross-section and fwhm is included for completeness. | 6.87 | 0.15 | 2.98 | 27000 | 120 | 1200–1700 | 2 | |
| Calcite, CaCO3 | 6.97 | 0.11 | 2.72 | 49000 | 125 | 1100–1640 | 2 | |
| Calcite, nCaCO3888The prefixed n in the chemical formula is to distinguish the very thin film. | 6.97 | 2.72 | 63000 | 96 | 1100-1640 | 2 | ||
| Silicon Carbide overtone spectrum | ||||||||
| bSiC 999Overtone bands in 6H Alfa/Aesar sample orientated ; Sakurai’s Object was better fitted with a different sample (a 25 µm-thick SiC wafer). | 6.48 | 22 | 3.2 | 210 | 55 | 101010blended with peak at 6.17 µm | 1460–1585 | 3 |
| 4–5 µm components | ||||||||
| Ice | ||||||||
| CO2 | 4.27 | 1.68 | 34000 | 18 | 111111pure CO2 band strength Gerakines et al. (1995) | - | 4, 8 | |
| Organic Residue | ||||||||
| OCN- | 4.61 | 121212estimated from Brucato, Baratta, & Strazzulla (2006) data | 131313van Broekhuizen, Keane, & Schutte (2004), accuracy % | - | 5 | |||
Three combinations of materials were fitted to each source spectrum: (i) H2O, CH3OH and a carbonate, (ii) H2O and CH3OH, (iii) H2O and a carbonate. The ice spectra (Hudgins et al., 1993) were measured at 10 Kelvin, the carbonate spectra (Bowey & Hofmeister, 2022) were obtained at room temperature (there are no suitable low-temperature data). The carbonate samples included magnesite (MgCO3), dolomite (CaMg(CO3)2) and calcite (CaCO3). Peak wavelengths vary between 6.87 µm (magnesite, dolomite) and 6.97 µm (calcite); most of the spectra were obtained from 0.1- to 0.15-µm-thick powder films. The effect of grain-size on the calcite fits was explored by using the spectrum of an additional µm-thick calcite film (nCaCO3). Only the best carbonate fits are included in the paper; fit qualities are governed primarily by the match to peak-wavelength and secondly by feature-width. Small components of other materials may also contribute to the spectra, especially to the 6.0-µm H2O band.141414Organic residues may broaden and deepen the feature (Gibb & Whittet, 2002) but were included by them to explain extra depth in the 6.0µm band in comparison to predictions from the 3.0-µm H2O band. I did not included an (organic refractory material) ORM component because the fits were degenerate. In tests extra components fell to zero or the fit was unconstrained.
5.2 Continua and fitting process
5.2.1 Power-law galaxy and YSO continua
The observed spectra of PKS 1830–211, and the YSOs, were modelled by inserting a wavelength-dependent power-law continuum,
| (2) |
into equation 1. Constant, , and optical-depth scale factors to were constrained to positive values (to prevent the introduction of spurious emission features) and optimized by the downhill-simplex method of -minimization as implemented by the AMOEBA routine in Interactive Data Language (IDL). Power-law index, , values were selected by trial and error to give the best fit to each source.
5.2.2 Taurus-Elias 16 continuum
Power-law models which match the featureless Elias 16 spectrum between 5.0 and 5.6 µm and the 6.0 µm band are too shallow to match the 6.9 µm band and continuum beyond 7.0 µm values are poor. Unlike the other sources which are characterised by largely optically-thick power-law emission local to the source, Elias 16 is a heavily reddened field star which is better represented by a second order polynomial in wavelength:
| (3) |
in equation 1
Six parameter fits of coefficients to and optical-depth scale factors to were poorly constrained due to the excessive number of degrees of freedom; five parameter fits were constrained. Therefore, values of the 6.0 µm H2O optical depth were pre-selected by trial-and-error to give the lowest in the H2O, CH3OH and carbonate models. H2O components in two-component models including either CH3OH, or a carbonate were allowed to vary freely.
Unsophisticated tests of power-law reddened Spitzer library spectra of KIII giants produced continua similar to the polynomial models over this wavelength range.
5.2.3 Calculation of fit uncertainties
Fit robustness was checked by determining one-sigma confidence intervals after convergence at . Each parameter was shifted from the solved value by a few per cent and a new calculated. Then the AMOEBA routine was invoked to minimize . The value at convergence is an estimate of the one sigma confidence interval. Formal uncertainties of well-constrained parameters are usually small (0.1–3%) in comparison to my estimates of systematic uncertainties; these include the true number of dust components, the true continuum, and uncertainties intrinsic to baseline subtraction in the laboratory data. Hence, parameters are quoted to no more than two significant figures despite the confidence intervals indicating smaller uncertainties. Quoted uncertainties are based on propagating the most pessimistic fit (5 %) and realistic systematic (15%) errors.
5.3 Fitted components and optical depth profiles
. Source Index H2O Component Additional Components Quality (H2O) 151515Published estimate deduced from 3.0 µm band and the temperature of the 3.0-µm laboratory spectrum, see Section 6.1. Value for Elias 16 is from Boogert et al. (2011); others are from Boogert et al. (2008) (CH3OH) 161616Estimate defined in Section 6.2. It is based on published ratios of the 3.54 µm-CH3OH ice to the 3.0 µm-H2O ice band. (–CO3) PKS 1830–211 1.44 0.21 1 – CH3OH+CaCO3 0.11 2 0.063 4 1.1 1.32 0.19 1 CH3OH 0.15 2 – – 1.3 1.52 0.22 1 CaCO3 – 0.17 1 2.1 Elias 16 – 0.18 1 0.15 (10 K) CaMg(CO3)2 – 0.10 2 3.52 – 0.18 – CH3OH+CaMg(CO3)2 0.017 10 <0.006 0.086 2 3.54 – 0.16 2 CH3OH 0.096 1 – 4.37 S140 IRS 1 2.07 0.12 0.1 0.16 (100 K) nCaCO3 – 0.10 0.2 13.052 2.05 0.12 0.2 CH3OH+nCaCO3 0.0073 3 <0.01 0.092 0.3 13.055 2.04 0.11 0.2 CH3OH 0.092 0.2 – 18.27 AFGL 989 1.25 0.16 0.2 0.18 (40 K) CH3OH 0.071 0.6 – 10.538 1.25 0.16 0.2 CH3OH+nCaCO3 0.071 0.6 0.046 10.540 1.23 0.17 0.2 nCaCO3 – 0.061 0.7 12.44 Mon R2 IRS 3 1.65 0.18 0.2 0.20 (100 K) CH3OH+nCaCO3 <0.01 0.21 0.2 26.9 1.66 0.18 0.2 nCaCO3 – 0.21 0.2 27.0 1.65 0.16 0.2 CH3OH 0.20 0.2 – 42 (bSiC) 1.88 0.17 0.2 nCaCO3 + bSiC 0.064 0.6 0.27 0.1 20.0
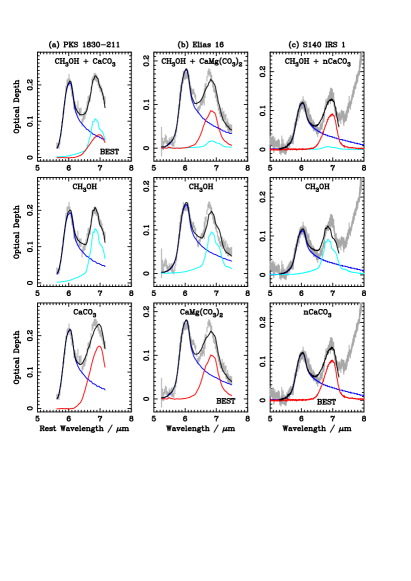
Fits are listed in Table 2 where the best fits (with the lowest values) are indicated in bold and shown with the observed fluxes in Figure 1. Optical depth profiles and absorption components obtained from visually distinguishable models are shown in Figure 2; they were derived by taking the natural log of the ratio of the observed, or fitted flux (equation 1) to the continuum model (equations 2 or 3, as appropriate).
| (4) |
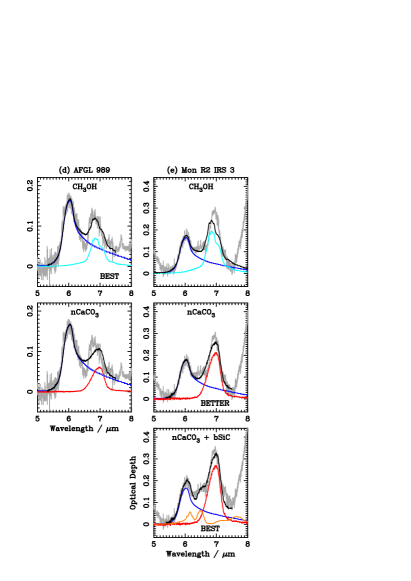
The spectrum of the PKS 1830–211 galaxy-absorber was fitted best with a three-component model including H2O, CH3OH and CaCO3 (Figure 1(a)). Carbonate-bearing fits to Elias 16 (with CaMg(CO3)2; Figure 1(b)) and S140 IRS 1 (with nCaCO3; Figure 1(c)) were nearly statistically identical irrespective of the inclusion or exclusion of CH3OH. Hence, I represent the data with two-component H2O and carbonate models. In contrast, the carbonate component in AFGL 989 (Figure 1(e)) was negligible ((nCaCO3)) so the two-component H2O and CH3OH model was selected.
The Mon R2 IRS 3 observation was initially matched with a two-component H2O and nCaCO3 model due to the negligible fitted CH3OH component ((CH3OH)) (labelled BETTER in Figure 1(e)). However, this fit does not match a plateau centred at 6.4 µm indicating the need to add a third absorber.
5.4 20 µm-sized SiC grains in Mon R2 IRS 3
Isotope measurements of thousands of 0.1–20 µm-sized meteoritic SiC grains (e.g. Hoppe et al., 1994; Speck, Thompson, & Hofmeister, 2005) suggest that they exist in protostellar environments. However, the SiC stretching band near 11.5 µm has not been detected beyond carbon stars(e.g Whittet, Duley, & Martin, 1990); due to the high opacity of the band only nanometre-sized grains produce unsaturated 11.5 µm features (see Hofmeister et al., 2009) so the meteoritic grains would be opaque. Noting that larger m SiC grains, hereinafter denoted bSiC (for “big” SiC grains), might be detectable by using their weak overtone peaks near 6.2 and 6.5 µm (Hofmeister et al., 2009), Bowey (2021) and Bowey & Hofmeister (2022) included them in three-component models of Sakurai’s Object and I include them here171717Overtone features due to other materials did not match the Mon R2 IRS 3 spectrum (Bowey & Hofmeister, 2005), with the exception of the ’melilite’ spectrum which was later found to be contaminated with carbonates (Bowey & Hofmeister, 2022)..
Significantly better fits (= 20.0 instead of 26.9 and labelled BEST in Figure 1(e)) were obtained by adding the overtone spectrum of –µm-sized silicon carbide grains to the nCaCO3 and H2O model. This component increased the power-law index slightly, reduced (H2O) by 5% and increased (–CO3) by 29%, to 0.27. In test fits to other MW objects the bSiC component fell to zero.
5.5 Unfitted structure in the molecular-cloud, Elias 16, sightline
Spectra of Elias 16 and PKS 1830–211 contain weak 0.2-µm-wide peaks centred at 6.3 µm that are not captured by the model fits. While the PKS 1830–211 peak could be explained by noise, structure in the Elias-16 spectrum appears to be significant. In addition, the Elias-16 6.9-µm peak is narrower than the dolomite and magnesite laboratory spectra and is blueshifted by 0.1 µm in comparison to these carbonates. 6.9 µm-fits might be improved with spectra of smaller ( magnesite or dolomite grains, or low-temperature measurements because these factors sharpen the bands. However, it is unlikely that they can explain the wavelength shift. Since unmatched areas below and above the dolomite fit to the 6.9 µm peak in Elias 16 are similar, I consider derived carbonate abundances and uncertainties representative of the true values.
The two excesses at 6.3 µm and 6.75 µm might be explained by a contribution from PAHs. Preliminary attempts to obtain an upper-limit by adding a Carpentier et al. (2012) PAH spectrum were unconstrained, but fits with the narrower bands of individual PAHs (aka Mattioda et al., 2020; Chiar et al., 2021) might provide a solution.
5.6 Summary
H2O ice is present in all these lines of sight. Every sightline, except AFGL 989, required a carbonate component. The best models of Mon R2 IRS 3 included large (20 µm-sized) SiC grains. Only PKS 1830–211 and AFGL 989 have a substantial CH3OH component. There is unexplained excess absorption in the spectrum of Elias 16 at 6.3 µm and 6.75 µm.
| Object | / gcm-2 | / cm-2 | / cm-2 |
|---|---|---|---|
| PKS 1830–211 | 120 | 2.7 | |
| Elias 16 | 110 | 2.4 | 2.5 0.06 |
| S140 IRS 1 | 70 | 1.6 | 1.9 0.03 |
| AFGL 989 | 96 | 2.1 | 2.4 0.1 |
| Mon R2 IRS 3 | 98 | 2.2 | 1.9 |
6 Abundances
6.1 H2O
Fitted H2O optical depths, (H2O), in Table 2 are compared with published estimates, . Boogert et al. (2008) define
| (5) |
where is the optical depth of H2O ice at 6.0 µm inferred from the observed depth of the 3.0 µm H2O band using a laboratory spectrum obtained at temperature . Components ( µm, fwhm µm) and ( µm, fwhm µm) are the optical depths of two observationally-defined profiles of unknown materials. The contribution of to in Elias 16, S140 IRS 1, AFGL 989 and Mon R2 IRS 3 were 0.01, 0.02, 0.03 and 0.01, respectively.
My (H2O) values are similar to . Small discrepancies (-0.04 to +0.03) are suggestive of differences in the continua adopted, rather than the H2O temperature, because (temperature-) broadened profiles tend to reduce fitted optical depths.
Mass and molecular densities derived from my fits are in Table 3 with the molecular densities, , derived by Gibb et al. (2004) from the 3.0 µm feature of the MW sources. The 6.0–7.0 µm values are % of . The molecular H2O density in the PKS 1830–211 absorber is molecules cm-2. This is 110% of the, molecular density towards Elias 16, and 120–170% the molecular density in the MW YSOs.
6.2 CH3OH
Fitted CH3OH optical depths, (CH3OH), are compared with values, , predicted from 3.54 µm data in Table 2 and defined below. Mass- and molecular-densities are in Table 4.
I used the three component fits to obtain an upper limits for the column densities in cases where three-component fits included a very small, but finite, CH3OH component but were statistically marginally poorer than two-component H2O and carbonate fits. These sources were Elias 16 –(CH3OH)=0.017 with =3.54 versus 3.52 and S140 IRS 1 (CH3OH)=0.0073 with 13.055 versus 13.052.
6.2.1 Calibration of 6.85 µm CH3OH abundance
is derived from the 3.54-to-3.0-µm CH3OH-to-H2O molecular ratios, (CH3OH), obtained by Gibb et al. (2004), and reproduced in Table 4. Since the integrated band strengths of the 6.85- and 6.0-µm CH3OH- and H2O- bands in Table 1 are similar,
| (6) |
where the factor of 1.25 is obtained from the ratio of the fwhms of the pseudo-Gaussian 6.0 and 6.85-µm bands.
Fitted CH3OH optical depths in S140 IRS 1 () and Mon R2 IRS 3 () are consistent with predicted values (< 0.01); Towards Elias 16 the (CH3OH) upper limit is 2.8 times the predicted value (< 0.006). Fits to AFGL 989 in which carbonates were absent, were 1.5 times the predicted value (0.046).
| Object | (CH3OH) | (CH3OH) | ||
| gcm-2 | cm-2 | % | % | |
| PKS 1830–211 | 36 | 1.1 | 41 | |
| Elias 16181818 Upper limits are based on the marginally poorer 3-component fit. | <5.7 | <0.18 | <7.5 | <2.9 |
| S140 IRS 1 | <2.4 | <0.077 | <4.9 | <7.7 |
| AFGL 989 | 24 | 0.74 | 35 | |
| Mon R2 IRS 3 | <4.9 |
6.2.2 Sources of uncertainty in particle abundance estimates
Even if the optical paths of light transmitted at different wavelengths are identical (unlikely within a YSO disc or envelope), abundance discrepancies between estimates from different spectral features occur due to: (i) the choice of continuum. For example, my polynomial fit to the Elias 16 spectrum adds curvature which explains the larger ice optical depths. (ii) the effect of very large column densities of small grains or a smaller number of large grains which cause the band to saturate. The effect occurs in thin film laboratory samples (see Hofmeister, Keppel & Speck, 2003; Bowey, Hofmeister, & Keppel, 2020; Bowey & Hofmeister, 2022) because strong bands become rounded and eventually opaque as the film thickness (aka column density) is increased. Hence, if the column density is high, weak peaks will give a truer (and larger) estimate of the total abundance.
6.3 CH3OH ice in the PKS 1830–211 galaxy-absorber
Due to the consistency of the determined 6.85 µm and 3.54 µm CH3OH abundances, I conclude that the high CH3OH optical depth ((CH3OH)=0.11) towards PKS 1830–211 is supported by the MW fits. The galaxy-absorber (CH3OH) ratio of 41% is similar to the value for AFGL 989 (35%), but much higher than ratios in the quiescent molecular cloud towards Elias 16 (<7.5%) and the other YSOs (S140 IRS 1 (4.9%) and Mon-R2 IRS 3 ()). It is 3–8 times the (CH3OH) value in MW isolated starless molecular clouds and 14 times the value in giant molecular clouds (5–12% ; Boogert et al., 2011; Goto et al., 2021), while the ratio in the giant Lupus and Taurus molecular clouds and IC 5146 is (<3%; Boogert et al., 2013; Chiar et al., 2011). The high ratio is consistent with the detection of gas-phase CH3OH absorption in the submm lensed SW image because observations of massive star-formation regions combined with gas-grain chemical models (e.g. van der Tak, van Dishoeck, & Caselli, 2000) indicate CH3OH forms on Kelvin grain surfaces in molecular clouds when HI densities cm-3 with CO2 forming preferentially at higher densities. Evaporation occurs at K as a consequence of star-formation. Muller et al. (2020) obtain a total methanol gas column density molecule cm-2 in the SW component. Assuming the SW lensed submm component, is responsible for the infrared absorption feature, the CH3OH solid-to-gas ratio along this line of sight is .
6.4 Carbonates
| Object | Carbonate | (–CO3) | |||
|---|---|---|---|---|---|
| gcm-2 | cm-2 | cm-2 | % | ||
| PKS 1830–211 | CaCO3 | 1.3 | 350 | 2.5 | 0.091 |
| Elias 16 | CaMg(CO3)2 | 3.0 | 310 | 6.3 | 0.26 |
| S140 IRS 1 | nCaCO3 | 1.6 | 9300 | 3.1 | 0.19 |
| Mon R2 IRS 3 | nCaCO3 | 4.2 | 24000 | 8.1 | 0.37 |
Carbonate column densities are listed in Table 5. Calcite (CaCO3) grains, with a peak wavelength of 6.97 µm and grain size of 0.11 µm, provided the best fit to PKS 1830–211. MW YSOs S140 IRS1 and Mon R2 IRS 3 were matched with smaller ( µm-sized) calcite grains. Elias 16 was fitted with dolomite (CaMg(CO3)2), with a peak wavelength of 6.87 µm and a grain size of 0.15 µm. AFGL 989 models do not contain carbonate dust.
The carbonate-to-H2O molecular-density ratio ((–CO3)) towards PKS 1830–211 is 35% of the value towards Elias 16 and 48 % of the value in S140 IRS 1, and % the ratio towards Mon R2 IRS 3. The mass-densities towards PKS 1830–211, Elias 16, and S140 IRS 1 are similar to those in the circumstellar environment of Sakurai’s Object (1.2–2.8)gcm-2 between 2005 April and 2008 October (Bowey & Hofmeister, 2022). The carbonate mass-density towards Mon R2 IRS 3 is 1.5 times the peak value in Sakurai’s Object.
6.5 SiC in Mon R2 IRS 3
| gcm-2 | cm-2 | cm-2 | % |
| 300 | 0.0089191919Grain number densities are not directly comparible with those for Sakurai’s Object because the samples were different; the grain volume ratio is 1.95. | 1.5 | 68 |
bSiC abundances for Mon R2 IRS 3 are given in Table 6. Due to the 20 µm-size of these grains, the molecular and mass-densities are substantial in comparison to the measured H2O abundances: (SiC)68%; the mass density is 300 gcm-2. For comparison, bSiC mass densities within Sakurai’s Object were 54–167 gcm-2, or 0.18–0.6 times the inferred value towards Mon R2 IRS 3.
7 Ices in the 2.5–5 µm PKS 1830–211 spectrum


Figure 3 shows the rest-frame 2–5 µm flux spectrum of the PKS 1830–211 galaxy-absorber with laboratory spectra scaled to optical depths obtained with the 6–7 µm fits and a modified power-law index, (defined, below). I attribute the peculiar absence of a 3.0 µm H2O-ice band to flux contamination from an object of unknown type in the SL 2 slit (see Appendix A). Despite the absence of H2O, the PKS 1830–211 spectrum contains structures similar in shape and strength to CH3OH bands in the extrapolated 3-component ‘continuum’. CH3OH bands in the carbonate-free CH3OH-rich model are too strong.
There are clear absorption features near 4.3 and 4.6 µm. I added two extra absorbers and selected the power-law index, to produce the lowest values in this wavelength range:
| (7) |
Parameters – are fixed to values for H2O, CH3OH and CaCO3 obtained from the 5–8 µm fits. The scale factor, and and are fitted.
Optical depth spectra of the observations and fits, obtained with the 4–4.8 µm continuum by setting and to zero, are in Figure 4. The best-matching laboratory spectra (Table 1) were the 4.27 µm CO2 band in a CO : 10 CO2 mixture () and the 4.61 µm OCN- band () with and which have been identified in MW molecular-clouds. The fwhms of these bands are µm and 0.06 µm similar to the spacing between 2 and 4 wavelength-intervals, respectively; this resolution is insufficient to derive reliable abundance estimates.
8 Summary of Results
Light from blazar PKS 1830–211 passes through a face-on lensing
spiral galaxy at a redshift of z=0.886. Observations of absorption
features from IR to radio wavelengths indicate the optical path
through the galaxy includes massive star-forming regions and molecular
clouds similar to those in the Milky-Way. MW sightlines included for
comparison with the PKS 1830–211 spectrum are the quiescent
molecular-cloud towards Taurus-Elias 16, and YSOs in massive
star-forming regions (S140 1RS 1, AFGL 989, and Mon R2 IRS 3).
8.1 Carbonates and ices in star-forming regions
I have: (i) associated the 6.9-µm band with a combinations of CH3OH ice and/or carbonate dust; (ii) deciphered the carriers of solid-state absorption features near 4.3, 4.6, 6.0 and 6.9 µm in the PKS 1830–211 absorber-rest-frame and compared the results with those for the MW sightlines; (iii) shown CH3OH : H2O ratios derived in my 6–8 µm models are comparible to those obtained at 3–4 µm if the observation has unsaturated 3–4 µm and 6–8 µm bands.
8.2 H2O, CO2 and OCN-
Due to the constraint on the spectral characteristics, the range of MW H2O column densities was limited to 1.6– molecules cm-2. 6.0 µm estimates of H2O column density are within % of the 3.0-µm values. The H2O column density in the PKS 1830–211 galaxy-absorber is molecules cm-2.
NIR features in the PKS 1830–211 absorber were matched with the 4.27-µm CO2 peak in a CO : 10 CO2 mixture, a 4.61-µm OCN- peak but the spectral resolution is too low to obtain estimates of their abundances.
8.3 CH3OH to H2O ratios
The PKS 1830–211 galaxy-absorber and MW YSO AFGL 989, have a substantial CH3OH:H2O molecular ratios of 41% and 35%, respectively. For the MW sources Elias 16, and YSOs S140 IRS 1 and Mon R2 IRS 3, the respective ratios are < 7.5 %, <4.9 % and .
Whilst the MW sources have ratios within the range expected, the PKS 1830–211 galaxy-absorber has an extremely high CH3OH:H20 ratio: typical 3–4 µm ratios for isolated starless molecular-clouds within the MW are (5–12% ; Boogert et al., 2011; Goto et al., 2021), with values <3% within the giant Lupus and Taurus molecular clouds and IC 5146 is (Boogert et al., 2013; Chiar et al., 2011)). These substantial quantities of CH3OH ice appear consistent with the submm detection of gas-phase CH3OH absorption in the SW lensed component observed by Muller et al.. Assuming the SW lensed submm component, is responsible for the infrared absorption feature, the CH3OH solid-to-gas ratio along this line of sight is .
8.4 Carbonates in MW molecular-clouds, YSOs and the PKS 1830–211 galaxy absorber
With the exception of AFGL 989, fits to the 6.9 µm-band of every sightline required a contribution from carbonate dust. The best fit to PKS 1830–211 was obtained with calcite (CaCO3) grains, with a peak wavelength of 6.97 µm and grain size of 0.11 µm. S140 IRS1 and Mon R2 IRS 3 were matched with smaller (0.04 µm-sized) calcite grains. Elias 16 was fitted with dolomite CaMg(CO3)2, with a peak wavelength of 6.87 µm and a grain size of 0.15 µm. The carbonate-to-H2O molecular-density ratio towards PKS 1830–211 is 39 % of the value towards Elias 16, 50 % of the value towards S140 IRS 1, and % of the ratio towards Mon R2 IRS 3.
8.5 20- µm-sized SiC grains in Mon R2 IRS 3?
The best models of Mon R2 IRS 3 included large (20 µm-sized) SiC grains to fit a plateau at 6.4 µm. Modelled molecular densities of 20 µm-sized SiC grains in Mon R2 IRS 3 are 68 % of the measured H2O abundances; the mass density is 300 gcm-2. For comparison, bSiC mass densities within Sakurai’s Object were 54–167 gcm-2, or 0.18–0.6 times the inferred value towards Mon R2 IRS 3.
9 Discussion: Impact of astronomical carbonate dust
9.1 Additional spectral features

.
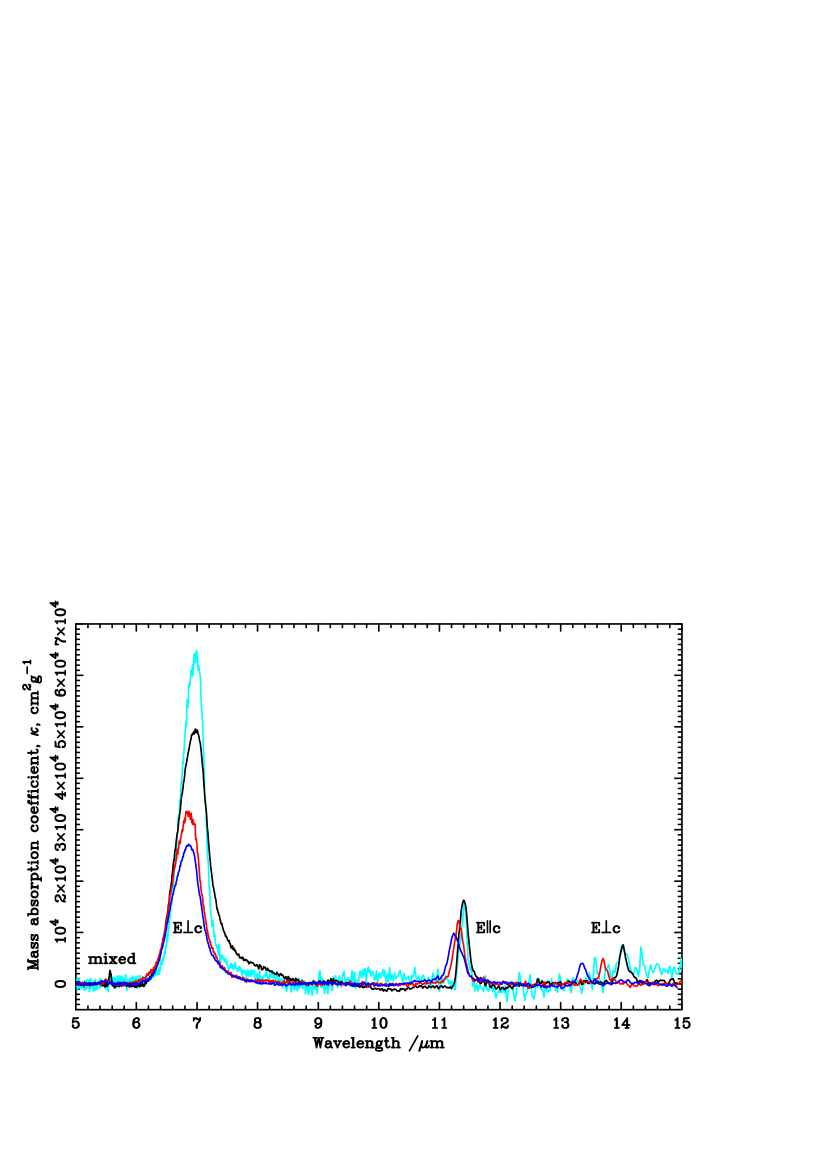
Since carbonates contribute to the astronomical 6.9-µm band weaker bands near 5.6 µm, 11.3 µm and 13.2–14 µm might also be detected (see Figure 5). However, due to the very large difference in band strength, the occurrance of both sets of features in a single sightline is likely to be infrequent. This extreme difference in band strength was the reason a very small carbonate fraction (<0.1%) was missed by Bowey & Hofmeister (2005) in their melilite overtones study. Grains with strong 5.6 µm, 11.3 µm and 13.2–14 µm peaks are very likely to be opaque at 6.9 µm. Under controlled laboratory conditions this property of particulate samples is a useful method for band-strength calibration, provided it is possible to measure the thickness of extremely thin films. After appropriate calibration, this property might become useful in the interpretation of astronomical data.
The effect of cation substitution of Ca2+ with Mg2+ relatively difficult to discern within the broad 6.9 µm band, but is much more visible in the narrow longer wavelength-bands. Bregman, Hayward, & Sloan (2000) identified excess absorption 11.3 µm in the ratioed spectrum of Mon R2 IRS 3 and identified it with PAHs due to its resemblance to emission bands in planetary nebulate, HII regions and the ISM. I took the natural logarthm of their ratio to obtain the optical depth spectrum in Figure 6; it closely resembles the 11.25 µm band in magnesite. Scaling the laboratory spectrum by eye, gives a match to the 11.3 µm optical depth, when and mass- and molecular- densities of gcm-2 and , respectively. These values are % of the densities evaluated using nCaCO3 in the 6.9 µm fits of the Mon R2 IRS 3 ISO data which is suggestive of a match to carbonates with the caveat that the H2O+ MgCO3 fit to the 5–8 µm spectrum was poorer () than that for H2O and nCaCO3 (), or CH3OH () due to mis-matches in peak wavelength and feature width.
9.2 Grain orientation and potential for polarization effects
Carbonate crystals are optically anisotropic: the 6.9 µm and 13.2–14-µm peaks are sensitive to while the 11.3 µm peak is responsive to . Hence, if the optical path is the same for the 6.9 µm and 11.3 µm bands similar measurements of column density at both wavelengths is indicative of random crystal orientation. In astronomical observations, e.g. towards Mon R2 IRS 3, this might indicate an insensitivity of carbonate dust to the local magnetic field and an absence of Fe in these grains. Fe-bearing carbonates were not measured by Bowey & Hofmeister (2022) because the strongest peak in the Fe-carbonate end-member (siderite, FeCO3) is at µm and longward of the astronomical bands, but clearly more observations and laboratory data are needed to confirm these hypotheses.
Carbonate dust may also provide an explanation for a narrow polarization feature at 11.3 µm in the N-band polarization spectrum of AFGL 2591 which was tentatively attributed to an annealed (i.e. crystalline) silicate component (Aitken et al., 1988) before the infrared-space-observatory revealed that crystalline silicates were reasonably common in circumstellar environments. The feature is known to be persistent over time due to the use of the source as a position-angle standard (170∘) (Smith et al., 2000). Carbonate orientation might be due to a physical association with flowing gas rather than magnetic fields because Fe-free carbonates would be insensitive to the magnetic field unless they contained magnetic inclusions.
9.3 Impact on chemical depletion measurements
Observations of abundances in the transitions between the diffuse medium (atomic hydrogen column density, cm-2; visual extinction, AV<1), the translucent medium ( cm-2; AV 3–5) and dark molecular clouds (cm-2; ) established the occurrance of a rapid removal of 30–50% of the available oxygen atoms from the interstellar gas as the density increases (Jenkins, 2009; Whittet, 2010). Jones & Ysard (2019) argued for the presence of (possibly undetectible) cyclic organic carbonates (COCs), or other carrier with a C:O ratio of 1:3 which mimimises the requred carbon depletion into an O-rich phase, but could find no observational studies of COC spectroscopic signatures which might occur at 5.5–5.8 µm and 7.8–8.2 µm 202020These bands do not appear in the 6–7 µm-features in the circumstellar environment of Sakurai’s Object either, Bowey (2021). The 6.9 µm-band of inorganic carbonates were mentioned in a footnote, presumably because they had been ruled out of contention by Keane et al. (2001) or due to the absence of laboratory data for them. My analysis of the 6.9 µm feature in molecular cloud environments and identification of carbonate dust seems to seems to fulfill the abundance constraints, especially since the authors allowed a minor depletion () of other metals including Mg onto the grains in these transition regions.
10 Conclusion
Solid-state infrared absorption features within dense molecular clouds
are useful tracers of the physical and chemical conditions within the
Milky-Way and other galaxies because the dust is a repository of
information about stellar evolution and metallicity, and is the source
material for new planets. IR spectra are used to determine the
mineralogy of oxygen-rich refractory materials because these materials
do not have characteristic spectral features in radio and submm bands
and their optical bands are obscured by the high visual extinction and
stronger atomic and molecular lines. The analysis has required data
from several laboratories which specialise in chemical synthesis,
infrared spectroscopy of ices and organics, and the Earth and
planetary sciences, as well as reinterpretation of astronomical
observations with simple empirical models
(-fitting).
I have interpreted spectral features near 6.0 and 6.9 µm which appear in molecular clouds and YSOs within the MW and the galaxy absorber in the line of sight to PKS 1830–211. To determine the proportions of three-component models, four MW sources were selected using two criteria: (i) the peaks must be curved (not flattened) because distorted spectral shapes indicate grain densities or grain sizes which are too large for light transmission, and (ii) there must be published H2O to CH3OH ice ratios derived from 3.0 to 4.0µm observations to calibrate the 5 to 8-µm fits. These constraints limit the range of explored MW H2O-ice column densities to 1.6– molecules cm-2; the H2O ice column density in the galaxy absorber is molecules cm-2 with an uncertainty of to %.
Uncertainties in molecular ratios are estimated to be % of the quoted values. Evaluations of CH3OH : H2O ratio in the ices from 6–8 µm-spectra of PKS 1830–211 and AFGL 989 are high at 41% and 35%, respectively. For Elias 16, S140 IRS 1 and Mon R2 IRS 3 the respective ratios are < 7.5%, 4.9% and .
Every sightline, except AFGL 989, required a carbonate component with grain-sizes in the 0.04–0.15 µm-range. PKS 1830–211, S140 IRS 1, and Mon R2 IRS 3 spectra were all matched with calcite (CaCO3). The molecular-cloud sightline towards Elias 16 was better matched with 0.15 µm-sized dolomites (CaMg(CO3)2. However, the carbonate fit to Elias 16 might be improved by using narrower laboratory spectra produced by small ( µm-sized) and/or low-temperature ( K) Mg-bearing carbonates which were unavailable. Unexplained excesses in the spectrum of Elias 16 at 6.3 µm and 6.75 µm could potentially be associated with PAHs.
The Mon R2 IRS 3 spectrum may indicate a population of much larger (20 µm-sized) SiC grains which contribute to a plateau near 6.4 µm. Due to their large size, the SiC to H2O molecular ratio is 68 %.
Observations with NIRSpec and MIRI on JWST and future far-infrared instruments could enhance our understanding of the dust mineralogy and improve the link between meteoritics, planetary science and astrophysics of systems beyond the Solar System as far as high-redshift galaxies. IR spectra of solid-state features in satistically significant samples of high redshift galaxies could aid studies of star-formation rate, metallicity, and physical conditions at extended look-back times if there are suitable background sources. Laboratory experiments are required to determine mechanisms for carbonate formation in astronomical environments, and to reduce systematic uncertainties in the abundance of dust species in dense environments.
Acknowledgements
The author was funded by a 2-yr Science and Technology Research Council Ernest Rutherford Returner Fellowship (ST/S004106/1) plus a 6 month extension from Cardiff University; an additional 12 months of her time was unremunerated. She would like to thank A. M. Hofmeister for collaborating to produce the carbonate laboratory data, and the anonymous referees for their time, diligence and their request that she consider the broader implications of the work. LR Spitzer spectra were obtained from the NASA/IPAC Infrared Science Archive IRSA, which is funded by the National Aeronautics and Space Administration and operated by the California Institute of Technology, and the Combined Atlas of Sources with Spitzer/IRS Spectra (CASSIS), a product of the Infrared Science Center at Cornell University, supported by NASA and JPL. Observations were made with the Spitzer Space Telescope, which was operated by the Jet Propulsion Laboratory, California Institute of Technology under a contract with NASA.
Data Availability
Carbonate data published by Bowey & Hofmeister (2022) are available from https://zenodo.org/communities/mineralspectra/. Other data underlying this article will be shared on reasonable request to the corresponding author.
References
- Aitken et al. (1988) Aitken D. K., Roche P. F., Smith C. H., James S. D., Hough J. H., 1988, MNRAS, 230, 629. doi:10.1093/mnras/230.4.629
- Allamandola et al. (1992) Allamandola L. J., Sandford S. A., Tielens A. G. G. M., Herbst T. M., 1992, ApJ, 399, 134. doi:10.1086/171909
- Allen (1972) Allen D. A., 1972, ApJL, 172, L55. doi:10.1086/180890
- Aller & Kulkarni (2021) Aller M. C., Kulkarni V. P., 2021, jwst.prop, 2441
- Aller et al. (2012) Aller M. C., Kulkarni V. P., York D. G., Vladilo G., Welty D. E., Som D., 2012, ApJ, 748, 19. doi:10.1088/0004-637X/748/1/19
- van Broekhuizen, Keane, & Schutte (2004) van Broekhuizen F. A., Keane J. V., Schutte W. A., 2004, A&A, 415, 425. doi:10.1051/0004-6361:20034161
- van Broekhuizen et al. (2006) van Broekhuizen F. A., Groot I. M. N., Fraser H. J., van Dishoeck E. F., Schlemmer S., 2006, A&A, 451, 723. doi:10.1051/0004-6361:20052942
- Boogert et al. (2008) Boogert A. C. A., Pontoppidan K. M., Knez C., Lahuis F., Kessler-Silacci J., van Dishoeck E. F., Blake G. A., et al., 2008, ApJ, 678, 985. doi:10.1086/533425
- Boogert et al. (2011) Boogert A. C. A., Huard T. L., Cook A. M., Chiar J. E., Knez C., Decin L., Blake G. A., et al., 2011, ApJ, 729, 92. doi:10.1088/0004-637X/729/2/92
- Boogert et al. (2013) Boogert A. C. A., Chiar J. E., Knez C., Öberg K. I., Mundy L. G., Pendleton Y. J., Tielens A. G. G. M., et al., 2013, ApJ, 777, 73. doi:10.1088/0004-637X/777/1/73
- Bowey & Hofmeister (2005) Bowey, J. E.,Hofmeister, A. M. 2005, MNRAS, 358, 1383
- Bowey, Hofmeister, & Keppel (2020) Bowey J. E., Hofmeister A. M., Keppel E., 2020, MNRAS, 497, 3658. doi:10.1093/mnras/staa2227
- Bowey (2021) Bowey J. E., 2021, MNRAS, 505, 568. doi:10.1093/mnras/stab1305
- Bowey & Hofmeister (2022) Bowey J. E., Hofmeister A. M., 2022, MNRAS, 513, 1774. doi:10.1093/mnras/stac993
- Bowey, Adamson, & Whittet (1998) Bowey J. E., Adamson A. J., Whittet D. C. B., 1998, MNRAS, 298, 131. doi:10.1046/j.1365-8711.1998.01640.x
- Bregman, Hayward, & Sloan (2000) Bregman J. D., Hayward T. L., Sloan G. C., 2000, ApJL, 544, L75. doi:10.1086/317294
- Brucato, Baratta, & Strazzulla (2006) Brucato J. R., Baratta G. A., Strazzulla G., 2006, A&A, 455, 395. doi:10.1051/0004-6361:20065095
- Carpentier et al. (2012) Carpentier Y., Féraud G., Dartois E., Brunetto R., Charon E., Cao A.-T., d’Hendecourt L., et al., 2012, A&A, 548, A40. doi:10.1051/0004-6361/201118700
- Ceccarelli et al. (2002) Ceccarelli C., Caux E., Tielens A. G. G. M., Kemper F., Waters L. B. F. M., Phillips T., 2002, A&A, 395, L29. doi:10.1051/0004-6361:20021490
- Chiar et al. (2000) Chiar J. E., Tielens A. G. G. M., Whittet D. C. B., Schutte W. A., Boogert A. C. A., Lutz D., van Dishoeck E. F., et al., 2000, ApJ, 537, 749. doi:10.1086/309047
- Chiar et al. (2007) Chiar J. E., Ennico K., Pendleton Y. J., Boogert A. C. A., Greene T., Knez C., Lada C., et al., 2007, ApJL, 666, L73. doi:10.1086/521789
- Chiar et al. (2011) Chiar J. E., Pendleton Y. J., Allamandola L. J., Boogert A. C. A., Ennico K., Greene T. P., Geballe T. R., et al., 2011, ApJ, 731, 9. doi:10.1088/0004-637X/731/1/9
- Chiar et al. (2021) Chiar J. E., de Barros A. L. F., Mattioda A. L., Ricca A., 2021, ApJ, 908, 239. doi:10.3847/1538-4357/abd6e8
- Day et al. (2013) Day S. J., Thompson S. P., Parker J. E., Evans A., 2013, A&A, 553, A68. doi:10.1051/0004-6361/201321138
- de Graauw et al. (1996) de Graauw T., Haser L. N., Beintema D. A., Roelfsema P. R., van Agthoven H., Barl L., Bauer O. H., et al., 1996, A&A, 315, L49
- Dohnálek et al. (2003) Dohnálek Z., Kimmel G. A., Ayotte P., Smith R. S., Kay B. D., 2003, JChPh, 118, 364. doi:10.1063/1.1525805
- Evans et al. (2020) Evans A., Gehrz R. D., Woodward C. E., Banerjee D. P. K., Geballe T. R., Clayton G. C., Sarre P. J., et al., 2020, MNRAS, 493, 1277. doi:10.1093/mnras/staa343
- Evans et al. (1989) Evans N. J., Mundy L. G., Kutner M. L., Depoy D. L., 1989, ApJ, 346, 212. doi:10.1086/168002
- Farmer (1958) Farmer V. C., 1958, MinM, 31, 829. doi:10.1180/minmag.1958.031.241.03
- Galván-Ruiz et al. (2009) Galván-Ruiz M, Hernández, J., Baños L., Noriega-Montes J., Rodríguez-García M. E. 2009 Journal of Materials in Civil Engineering, 21, 694, DOI: 10.1061/(ASCE)0899-1561(2009)21:11(694)
- Gerakines et al. (1995) Gerakines P. A., Schutte W. A., Greenberg J. M., van Dishoeck E. F., 1995, A&A, 296, 810
- Gibb & Whittet (2002) Gibb E. L., Whittet D. C. B., 2002, ApJL, 566, L113. doi:10.1086/339633
- Gibb et al. (2004) Gibb E. L., Whittet D. C. B., Boogert A. C. A., Tielens A. G. G. M., 2004, ApJS, 151, 35. doi:10.1086/381182
- Goto et al. (2021) Goto M., Vasyunin A. I., Giuliano B. M., Jiménez-Serra I., Caselli P., Román-Zúñiga C. G., Alves J., 2021, A&A, 651, A53. doi:10.1051/0004-6361/201936385
- Grishko & Duley (2002) Grishko V. I., Duley W. W., 2002, ApJ, 568, 448. doi:10.1086/338926
- Grellmann et al. (2011) Grellmann R., Ratzka T., Kraus S., Linz H., Preibisch T., Weigelt G., 2011, A&A, 532, A109. doi:10.1051/0004-6361/201116699
- Hensley & Draine (2020) Hensley B. S., Draine B. T., 2020, ApJ, 895, 38. doi:10.3847/1538-4357/ab8cc3
- Hofmeister, Keppel & Speck (2003) Hofmeister, A. M., Keppel, E., Speck, A. K., 2003, MNRAS, 345, 16
- Hofmeister et al. (2009) Hofmeister A. M., Pitman K. M., Goncharov A. F., Speck A. K., 2009, ApJ, 696, 1502. doi:10.1088/0004-637X/696/2/1502
- Hoppe et al. (1994) Hoppe P., Amari S., Zinner E., Ireland T., Lewis R. S., 1994, ApJ, 430, 870. doi:10.1086/174458
- Hudgins et al. (1993) Hudgins D. M., Sandford S. A., Allamandola L. J., Tielens A. G. G. M., 1993, ApJS, 86, 713. doi:10.1086/191796
- Houck et al. (2004) Houck J. R., Roellig T. L., van Cleve J., Forrest W. J., Herter T., Lawrence C. R., Matthews K., et al., 2004, ApJS, 154, 18. doi:10.1086/423134
- Hough et al. (2008) Hough J. H., Aitken D. K., Whittet D. C. B., Adamson A. J., Chrysostomou A., 2008, MNRAS, 387, 797. doi:10.1111/j.1365-2966.2008.13274.x
- Imai, et al. (2009) Imai Y., Koike C., Chihara H., Murata K., Aoki T., Tsuchiyama A., 2009, A&A, 507, 277
- IRS (2011) IRS Instrument Team & Science User Support Team, Version 5.0, S18.18 December 2011 title: IRS Instrument Handbook. https://irsa.ipac.caltech.edu/data/SPITZER/docs/irs/irsinstrumenthandbook/.
- Jenkins (2009) Jenkins E. B., 2009, ApJ, 700, 1299. doi:10.1088/0004-637X/700/2/1299
- Jones & Ysard (2019) Jones A. P., Ysard N., 2019, A&A, 627, A38. doi:10.1051/0004-6361/201935532
- Keane et al. (2001) Keane J. V., Tielens A. G. G. M., Boogert A. C. A., Schutte W. A., Whittet D. C. B., 2001, A&A, 376, 254. doi:10.1051/0004-6361:20010936
- Kemper et al. (2002) Kemper F., Jäger C., Waters L. B. F. M., Henning T., Molster F. J., Barlow M. J., Lim T., et al., 2002, Natur, 415, 295. doi:10.1038/415295a
- Knez et al. (2005) Knez C., Boogert A. C. A., Pontoppidan K. M., Kessler-Silacci J., van Dishoeck E. F., Evans N. J., Augereau J.-C., et al., 2005, ApJL, 635, L145. doi:10.1086/499584
- Koresko et al. (1993) Koresko C. D., Beckwith S., Ghez A. M., Matthews K., Herbst T. M., Smith D. A., 1993, AJ, 105, 1481. doi:10.1086/116526
- Lebouteiller et al. (2011) Lebouteiller, V., Barry, D. J., Spoon, H.W.W., Bernard-Salas, J., Sloan, G.C., Houck, J.R., Weedman, D., 2011 ApJS, 196, 8
- Lisse et al. (2007) Lisse C. M., Kraemer K. E., Nuth J. A., Li A., Joswiak D., 2007, Icar, 187, 69. doi:10.1016/j.icarus.2006.11.019
- Luna et al. (2018) Luna R., Molpeceres G., Ortigoso J., Satorre M. A., Domingo M., Maté B., 2018, A&A, 617, A116. doi:10.1051/0004-6361/201833463
- Mangan et al. (2017) Mangan T. P., Salzmann C. G., Plane J. M. C., Murray B. J., 2017, Icar, 294, 201. doi:10.1016/j.icarus.2017.03.012
- Maud & Hoare (2013) Maud L. T., Hoare M. G., 2013, ApJL, 779, L24. doi:10.1088/2041-8205/779/2/L24
- Mattioda et al. (2020) Mattioda A. L., Hudgins D. M., Boersma C., Bauschlicher C. W., Ricca A., Cami J., Peeters E., et al., 2020, ApJS, 251, 22. doi:10.3847/1538-4365/abc2c8
- McClure (2009) McClure M., 2009, ApJL, 693, L81. doi:10.1088/0004-637X/693/2/L81
- Muller et al. (2020) Muller S., Jaswanth S., Horellou C., Martí-Vidal I., 2020, A&A, 641, L2. doi:10.1051/0004-6361/202038978
- Muller et al. (2021) Muller S., Ubachs W., Menten K. M., Henkel C., Kanekar N., 2021, A&A, 652, A5. doi:10.1051/0004-6361/202140531
- Preibisch & Smith (2002) Preibisch T., Smith M. D., 2002, A&A, 383, 540. doi:10.1051/0004-6361:20011772
- Preibisch et al. (2002) Preibisch T., Balega Y. Y., Schertl D., Weigelt G., 2002, A&A, 392, 945. doi:10.1051/0004-6361:20021191
- Puetter et al. (1979) Puetter R. C., Russell R. W., Soifer B. T., Willner S. P., 1979, ApJ, 228, 118. doi:10.1086/156828
- Puetter et al. (1977) Puetter R. C., Russell R. W., Soifer B. T., Willner S. P., 1977, BAAS
- Rubin & Ma (2017) Rubin A. E., Ma C., 2017, Chemie der Erde Geochemistry, 77, 325. doi:10.1016/j.chemer.2017.01.005
- Sandford & Walker (1985) Sandford S. A., Walker R. M., 1985, ApJ, 291, 838. doi:10.1086/163120
- Smith et al. (2000) Smith C. H., Wright C. M., Aitken D. K., Roche P. F., Hough J. H., 2000, MNRAS, 312, 327. doi:10.1046/j.1365-8711.2000.03158.x
- Soifer et al. (1979) Soifer B. T., Puetter R. C., Russell R. W., Willner S. P., Harvey P. M., Gillett F. C., 1979, ApJL, 232, L53. doi:10.1086/183035
- Speck, Thompson, & Hofmeister (2005) Speck A. K., Thompson G. D., Hofmeister A. M., 2005, ApJ, 634, 426. doi:10.1086/496955
- Tercero et al. (2020) Tercero B., Cernicharo J., Cuadrado S., de Vicente P., Guélin M., 2020, A&A, 636, L7. doi:10.1051/0004-6361/202037837
- Thompson et al. (1998) Thompson R. I., Corbin M. R., Young E., Schneider G., 1998, ApJL, 492, L177. doi:10.1086/311096
- van der Tak, van Dishoeck, & Caselli (2000) van der Tak F. F. S., van Dishoeck E. F., Caselli P., 2000, A&A, 361, 327. doi:10.48550/arXiv.astro-ph/0008010
- Werner et al. (2004) Werner M. W., Roellig T. L., Low F. J., Rieke G. H., Rieke M., Hoffmann W. F., Young E., et al., 2004, ApJS, 154, 1. doi:10.1086/422992
- Whittet, Duley, & Martin (1990) Whittet D. C. B., Duley W. W., Martin P. G., 1990, MNRAS, 244, 427
- Whittet (2010) Whittet D. C. B., 2010, ApJ, 710, 1009. doi:10.1088/0004-637X/710/2/1009
- White (1974) White, W. B., Ch 12 in "The Infrared Spectra of Minerals", Mineralogical Society of Great Britain and Ireland 1974:01,doi:10.1180/mono-4.12 page 227.
- Smith et al. (2000) Smith C. H., Wright C. M., Aitken D. K., Roche P. F., Hough J. H., 2000, MNRAS, 312, 327. doi:10.1046/j.1365-8711.2000.03158.x
- Winn et al. (2002) Winn, J. N., Kochanek, C. S., McLeod, B. A., et al. 2002, ApJ, 575, 103
- Zacharias et al. (2005) Zacharias N., Monet D. G., Levine S. E., Urban S. E., Gaume R., Wycoff G. L., 2005, yCat, I/297
Appendix A PKS 1830–211 Spitzer observations
PKS 1830–211 was observed with the Infrared Spectrometer (IRS) (Houck et al., 2004) on the Spitzer Space Telescope (Werner et al., 2004) on 2008 October 05 as part of programme 50783 (PI Kulkarni, V. P.); Astronomical Observation Request (AOR) 26905856 was originally reduced, published and interpreted by Aller et al. (2012).
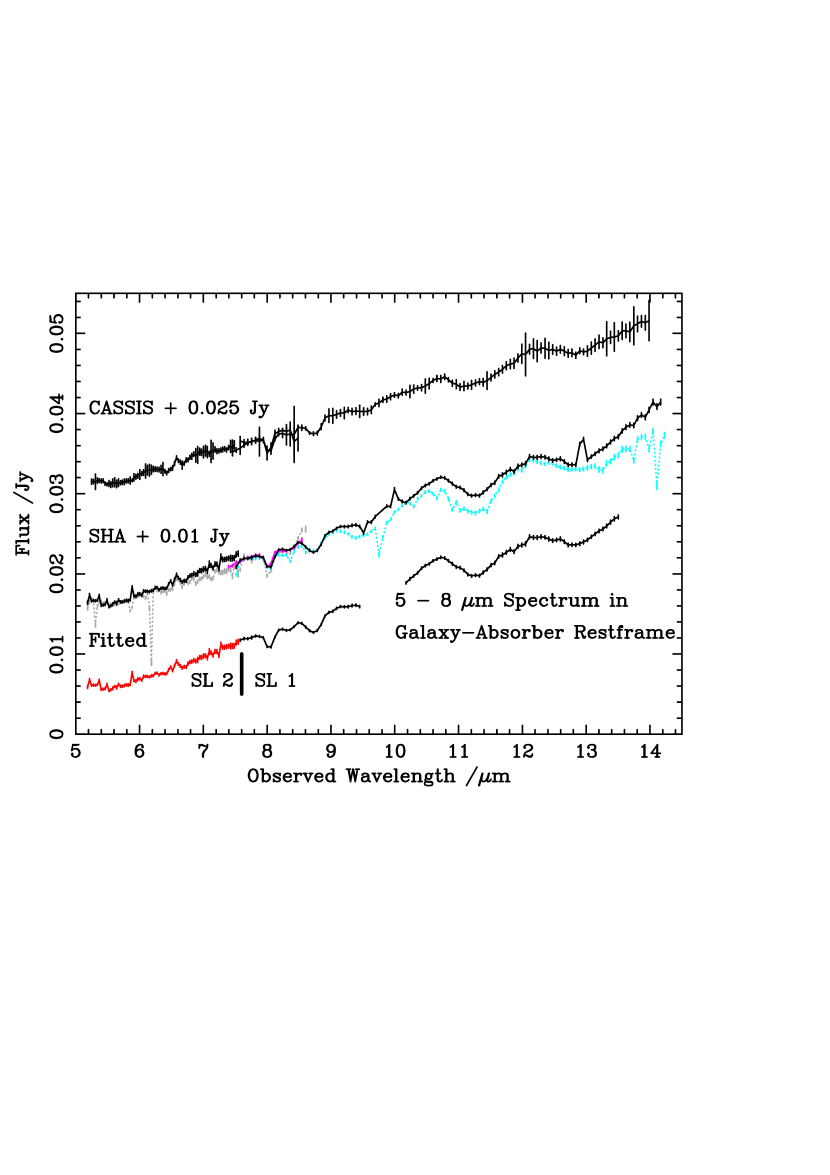
Data from the Combined Atlas of Sources with Spitzer/IRS Spectra (CASSIS) Archive (Lebouteiller et al., 2011) from pipeline S18.18.0 and Level 2 data from the Spitzer Heritage Archive (SHA) retrieved in 2020 are compared in Figure 7. Due to the redshift of the absorber (), the 4–5 µm and 6-7 µm features of interest were observed by order Short-Low (SL) 1 at wavelengths of 8–9 µm and 10–14 m, respectively.
A.1 Data selection
IRS observations were obtained by nodding between two beams; SL 1 beams in the SHA spectrum in Figure 7 are denoted 004 (dotted cyan) and 005 (solid black) in the SHA archive. If the source had been perfectly centred on the slit spectra from the two beams would be nearly identical. However, beyond 9 µm the 004-fluxes are lower and noisier than the 005 data indicating a loss of signal. Since the CASSIS pipeline combines the 004 and 005 beams, the long-wavelength part of the spectrum is 6% lower than 005 and there is reduced contrast in the spectral features. Hence, I discarded 004 data except for using it to justify an interpolation across the 13-µm bad-pixel spike in 005. The result was trimmed to the 10.2–13.5m range to exclude a spectral curvature due to an artefact known as the 14-m teardrop (see IRS, 2011) and blue-shifted to the rest-frame of the galaxy-absorber. Error bars are the root-mean-square uncertainties in 005. The SL 2 spectrum from the 003 beam (red) were scaled by a factor of 0.92 to match SL 1 and trimmed at 7.6 µm. Data from SL 2 002 (grey) were discarded due to the larger number of bad points.
A.2 Contamination of the SL 2 slit by an unknown source
Order SL 2 observations covered 3.0–5 µm bands in the absorber rest-frame. Unfortunately, these data are contaminated by the presence of an additional object of unknown type in the SL 2 slit. The source, at J2000 coordinates 18:33:40.444 -21:04:35.24, is variously catalogued as a star and a galaxy; it increases in brightness from 17.4 mag in the B band to 14.372 mag at K in the NOMAD catalogue (Zacharias et al., 2005) but does not seem to affect spectral shapes in the (magenta) region of SL 2 which overlaps SL 1.
Appendix B Calculation of Column Densities
B.1 Mass Density and Mass Absorption Coefficient
The mass column density, , of each component is,
| (8) |
where is the mass absorption coefficient of the appropriate laboratory spectrum at the peak wavelength of the absorber, is given by,
| (9) |
where is the optical depth of the sample of thickness at wavelength .
B.2 Grain Number Density
The grain number density, of each component is
| (10) |
where , is the mass of a single grain. This mass calculation includes three approximations: (i) that the mass densities of terrestrial materials are similar to those of interstellar materials, (ii) that the thickness of a powder film thin can be used as a representative grain size and (iii) that the geometry is approximately cubic. Film thickness is assumed to be representative of the largest grain sizes in the sample because boundary reflections between grains smaller than the thickness of a compressed powder are minimized due to the absence of airspaces (or matrix material) with a significantly different refractive index. However, the powder-measurement will represent the average of a range of crystal orientations. Cubic grains are isotropic so the orientations will be truly random. Problems arise from elongated grains which will preferentially lie with their long axes perpendicular to the compression axis; film thickness is difficult to measure in very small samples (e.g. the nCaCO3 sample) and air spaces will be imperfectly removed. However, my assumption is no worse than the ubiquitous use of astronomical assumption of spheroidal or ellipsoidal shapes. By definition crystals have specific angular shapes, e.g. some forms of SiC are cubic, carbonates are rhombohedral. Grinding mineral samples will knock some corners off. Care is taken to avoid this as far as possible (e.g.see Bowey, Hofmeister, & Keppel, 2020) because over-grinding destroys the crystal structure and alters the infrared spectrum (e.g. Farmer, 1958; Imai, et al., 2009).
B.3 Number of molecular absorbers and integrated band strength
The number of absorbers, , is obtained from the integrated band strength, , (cm molecule-1). The integrated band strength of a laboratory sample is given by
| (11) |
where and and are the frequencies at the edges of the band, is the relative molecular mass of the sample and is Avogadro’s number. The optical depth, , at frequency , has a sample-thickness in µm. For a Gaussian peak the integral can be approximated by where, is the full-width-half-maximum in wavenumbers (cm) and is the peak optical depth. The number of molecular absorbers is given by
| (12) |