Pseudo Outlier Exposure for Out-of-Distribution Detection using Pretrained Transformers
Abstract
For real-world language applications, detecting an out-of-distribution (OOD) sample is helpful to alert users or reject such unreliable samples. However, modern over-parameterized language models often produce overconfident predictions for both in-distribution (ID) and OOD samples. In particular, language models suffer from OOD samples with a similar semantic representation to ID samples since these OOD samples lie near the ID manifold. A rejection network can be trained with ID and diverse outlier samples to detect test OOD samples, but explicitly collecting auxiliary OOD datasets brings an additional burden for data collection. In this paper, we propose a simple but effective method called Pseudo Outlier Exposure (POE) that constructs a surrogate OOD dataset by sequentially masking tokens related to ID classes. The surrogate OOD sample introduced by POE shows a similar representation to ID data, which is most effective in training a rejection network. Our method does not require any external OOD data and can be easily implemented within off-the-shelf Transformers. A comprehensive comparison with state-of-the-art algorithms demonstrates POE’s competitiveness on several text classification benchmarks.
1 Introduction
Pre-trained language models (PLMs) have achieved remarkable success in various natural language processing (NLP) tasks such as question-answering Yuan et al. (2019); Brown et al. (2020), sentiment analysis Clark et al. (2020), and text categorization Devlin et al. (2019); Yang et al. (2019). While PLMs have become a de-facto standard promoting classification accuracy, recent studies have found that over-parameterized PLMs often produce overconfident predictions for out-of-distribution (OOD) samples Jiang et al. (2020); Kong et al. (2020). For real-world language applications, these unreliable predictions can confuse users when interpreting the model’s decisions. Therefore, language models require the ability to detect OOD samples to instill the reliability in NLP applications.
The task of detecting OOD samples can be formulated as a binary hypothesis test of detecting whether an input data is from in-distribution (ID) or OOD. To detect an outlier data, in machine learning communities, the OOD detection task has been studied for many years Hendrycks and Gimpel (2017); Lakshminarayanan et al. (2017); Andersen et al. (2020). The prior works have proposed effective methods, including post-hoc algorithms Lee et al. (2018b); Sun and Li (2022), and training a rejection network by exposing the model to external OOD datasets Hendrycks et al. (2019).
However, existing post-hoc methods usually require a subset of actual OOD samples to tune their hyperparameters Liang et al. (2018); Sun et al. (2021), especially, Hsu et al. (2020) find that hyperparameters tuned with limited OOD dataset are not generalized to others. Thus, these methods are not feasible in real-world applications; moreover, we often cannot know the entire distribution of OOD datasets. Similarly, training a rejection network not only brings an additional burden for OOD data collection but also may result in sub-par OOD detection performance in deciding which subset of external data to use. Intuitively, OOD examples that are excessively distant from training samples may not help with OOD detection because easy-to-learn outlier features can be discriminated rather trivially. Therefore, a desirable trait for OOD samples to effectively train rejection networks is that the OOD sample does not belong to ID but is sufficiently close to the distribution of ID samples Lee et al. (2018a).
In this paper, we primarily focus on detecting OOD samples by constructing a surrogate OOD dataset from training samples rather than using external OOD data to train a rejection network. To this end, we propose Pseudo Outlier Exposure (POE) which is a procedure to construct a near-OOD set by erasing tokens with high attention scores in training sentences. A rejection network can then be trained on the training (ID) and constructed OOD datasets to detect OOD samples. Numerical experiments confirm that our procedure indeed generates surrogate OOD data close to ID examples. Accordingly, a rejection network trained on this construction outperforms state-of-the-art OOD detection algorithms on several benchmarks. Our main contributions are:
-
•
Our novel method easily constructs a surrogate OOD dataset in an offline manner and can be applied to any ID training data without access to any real OOD sample.
-
•
We demonstrate that the resultant surrogate OOD dataset introduced by POE is sufficiently close to the distribution of ID samples, which results in improvement of OOD detection performance for the rejection network.
-
•
Through comprehensive comparison with state-of-the-art algorithms, we demonstrate POE’s competitiveness on several text classification benchmarks.
2 Related Work
2.1 Post-hoc Methods
Post-hoc methods can detect an OOD sample by manipulating the features or logits of a pre-trained network without changing the weights of the given network. They have advantages where they do not require re-training a pre-trained classifier to detect OOD samples and can be simply applied in the inference time. Therefore, post-hoc methods can preserve the classification accuracy for the classifier. To detect OOD data, Hendrycks and Gimpel (2017) propose a simple post-hoc algorithm by thresholding the classifier’s maximum softmax probability (MSP). ODIN Liang et al. (2018) adds two additional strategies, temperature scaling and input pre-processing (adding perturbation to the test input) to the MSP for better separating confidence scores between ID and OOD samples. Treating the distribution of feature vectors of pre-trained models as class-conditional Gaussian distributions, Lee et al. (2018b) suggest the Mahalanobis distance-based confidence scoring rule with statistics of data samples in feature space. Energy Liu et al. (2020) propose the OOD scoring rule using an energy score that is aligned with the probability density of the logits of a pre-trained network. They demonstrate that the energy-based scoring rule is less susceptible to the overconfidence issue for a softmax classifier. ReAct Sun et al. (2021) suggests truncating the high activations of the penultimate layer to distinguish distinctive patterns arising when OOD data is fed into the model. DICE Sun and Li (2022) is a sparsification technique that ranks weights by contribution, and then uses the most significant weights to reduce noisy signals in OOD data.
Except for MSP and Energy described above, other methods specify parameter(s) that must be tuned on a reserved OOD subset. However, in many real-world deployment settings, the distribution of entire OOD samples is usually unknown.
2.2 Training a Rejection Network
Outlier Exposure (OE; Hendrycks et al., 2019) uses auxiliary datasets completely disjoint from the test time data to teach the model a representation for ID/OOD distinctions. However, in real-world applications, OE has a limitation in that collecting all possible OOD samples is not feasible, and OOD samples may not be known a priori. -Folden Li et al. (2021) is an ensemble method that trains individual classification models. Each model is trained on a subset with classes with the remaining class masked unknown (OOD) to the model. They train each model with a cross-entropy loss for the visible labels and an additional Kullback-Leibler (KL) divergence loss enforcing uniform predictions on the left-one-out label. For a test time, they simply average the probability distributions produced by these models and treat the result as the final probability estimate for a test sample. However, the -Folden lacks scalability to tasks with large classes and requires excessive computational costs because it requires network instances. Moreover, their approach cannot be applied to a binary classification task (i.e., ).
Compared to these studies, our method does not require the actual real-world OOD dataset and only trains a single additional rejection network.
2.3 Feature Representation Learning
Contrastive representation learning has shown remarkable performance for both ID classification and OOD detection Khosla et al. (2020); Zhou et al. (2022). Compared to the contrastive loss used in self-supervised representation learning Chen et al. (2020), where a model learns the general features of a dataset without labels, Khosla et al. (2020) suggest a supervised-contrastive loss (SCL), instances of the same class form a dense cluster on the model’s feature space, whereas instances of different classes are encouraged to be distant from each other. Motivated by Khosla et al. (2020), Zhou et al. (2021) propose the margin-based contrastive loss (MCL) to better increase the discrepancy of the representations for ID instances from different classes. MCL enforces the L2 distances of samples from the same class to be as small as possible, whereas the L2 distances of samples from different classes to be larger than a margin. They show that the model learned the intra-class compactness achieves advanced OOD detection performance. Compared to MCL Zhou et al. (2021) used only ID classes, we modify MCL by assigning a pseudo OOD set to the OOD class in the contrastive loss. Thus, our variant version of MCL not only shrinks the manifold of the OOD samples in the feature space but also further maximizes the discrepancy of the representations for ID instances from the surrogate OOD classes.
3 Method
Given Transformer-based PLMs with the softmax classifier, we propose a simple but effective method for detecting OOD samples. We first introduce the proposed method for generating surrogate OOD data and then present a rejection network that is trained with ID and the surrogate OOD.
Notation. Let be a training set, and be a label. For multi-class classification tasks, BERT-style Transformer can be decomposed by the attention blocks and the last dense layer.
We denote each layer as , and , respectively. Unless otherwise mentioned, the output of denotes the [CLS] feature vector on the last attention block.

3.1 Out-of-Distribution Set Construction
High-level idea. Following Lee et al. (2018b), we assume that class-conditional features on the PLM’s penultimate layer (i.e., the last attention layer) follow the multivariate Gaussian distribution for the training set. We first calculate the empirical class mean and covariance of the training set. The former is defined as:
| (1) |
where is the number of samples with class . The latter can be calculated by:
| (2) |
Because our aim is to create surrogate OOD samples that are sufficiently close to the manifold of ID samples, a surrogate OOD sample would be satisfied the following condition:
| (3) |
where is an explicit OOD sample (e.g., an OOD sample comes from completely different ID tasks), and is the Mahalanobis distance between and the closest class-conditional Gaussian distribution, i.e.,
| (4) |
Considering Eq. 3, we construct the surrogate OOD sample from the training sample, i.e., . To obtain the OOD data with a similar semantic representation to ID samples, we gradually erase tokens with high attention scores until has a larger Mahalanobis distance than the maximum ID Mahalanobis distance. It can be interpreted that the surrogate OOD sample starts with an ID and gradually turns into OOD as distinct tokens are erased.
Data construction pipeline.
Let is the training sample where is its sequence length, and is the token.
In the PLM’s architecture, we can identify key tokens that mainly affect to the model predictions by leveraging the attention score corresponding to the position of [CLS] token.
Using the attention score for each token, we can easily remove these tokens for any training set; thus we construct excluding tokens that are correlated with ID classes.
We gradually replace the attention score-based tokens with the [MASK] token for steps using the attention score:
| (5) |
where is the token replacement function, and is the index where the token with the highest attention score is located.
For each step, we calculate , and select at the when becomes greater than . For all training samples, we collect the surrogate OOD samples generated by the above process (see Fig. 1).
3.2 Rejection Network
The task of detecting OOD samples is a binary hypothesis test
| (6) |
where is a decision model. In order for to learn the distinctive patterns between ID and OOD samples, we re-train the PLM on both ID and the constructed OOD samples by leveraging a supervised contrastive representation learning. Because we construct the surrogate OOD set, we can explicitly make the model learns distinctive representations of an OOD class as well as ID classes using the margin-based contrastive loss (MCL; Zhou et al., 2021). Different from MCL, which uses only ID classes, our variant version of MCL contrasts OOD instances to those from different ID classes.
Let is a batch of training instances, and is assigned to OOD class . The denotes the size of a batch containing only ID samples, and the denotes the size of a batch containing only our synthesized OOD samples. We denote is the set of all anchor instances for the batch samples.
The MCL with classes can be formulated as,
| (7) |
where is the feature dimension of , is the positive loss term that enforces the L2-distances of instances from the same class to be small, and is the negative loss term that encourages the L2-distances of instances from different classes to be larger than a margin . is calculated by,
| (8) |
where is the set of indices for the instances from the same class as . The negative loss term is defined as
| (9) |
In Eq. 9, is the set of indices for the instances from different classes with . is the ReLU function. The margin is defined as the maximum distance between positive pairs,
| (10) |
In conclusion, we re-train with the following objective, , where is the cross-entropy loss. We use the same as the loss for ID class classification in order to (1) without changing the output node of and (2) to apply the existing post-hoc methods without modification.
In addition, during re-training, the [MASK] token of is randomly replaced with a word in the PLM’s vocabulary so that the model learns about various OOD representations.
3.3 Out-of-Distribution Scoring Rules
We use the existing OOD scoring algorithm, which maps the outputs of the model for test samples to OOD detection scores. The low score indicates a low likelihood of being OOD. Our rejection network can be applied to existing post-hoc methods, and we combine three parameter-free methods with our method in this work.
-
•
MSP. Hendrycks and Gimpel (2017) use the maximum class probability , where is the softmax function.
-
•
Energy Liu et al. (2020) based scoring rule is defined as .
-
•
Mahalanobis (Maha). Lee et al. (2018b) propose the Mahalanobis distance-based scoring rule, but their method requires several hyperparameters should be tuned via a real OOD subset. Instead, following Zhou et al. (2021), we use the parameter-free Mahalanobis distance as a scoring rule: . Unless otherwise mentioned, we use this scoring rule in our experiments.
4 Setup
ID # train # dev # test # classes OOD 15.0k 3.0k 4.5k 150 7.5k 3.0k 4.5k 150 SST2 6.2k 1.5k 1.8k 2 Yelp Yelp 448k 112k 38k 2 SST2 51.7k 0.2k 17.2k 5 IMDB 20.0k 5.0k 25.0k 2 c-IMDB
4.1 Dataset
In order to demonstrate the effectiveness of our method, we conduct experiments on common benchmarks for the OOD detection task:
-
•
is a user intent classification dataset designed for OOD detection, which consists of 150 intent classes from 10 domains. This dataset includes 22.5k ID utterances and 1.2k OOD utterances ().
-
•
is the variant version of the dataset, in which there are only 50 training utterances per each ID class. This dataset includes 15k ID utterances and 1.2k OOD utterances.
Recently, in the field of NLP, Arora et al. (2021) categorize OOD samples by two types of distribution shifts: semantic and background shifts. Because the shifted benchmarks share a common ID text style (background) or content (semantic), these distribution shifts in such near-OOD detection problems are more subtle in comparison to arbitrary ID and OOD dataset pairs (e.g., training and OOD sets come from completely different tasks), and thus, are harder to detect. We also conduct experiments with semantic shift and background shift benchmarks to verify that POE is effective even with challenging ID/OOD pairs.
The semantic shift benchmark we used is as follows:
-
•
is the rebuilt version of the News Category dataset Misra (2018) for OOD detection. contains instances from the five most common classes of the News Category dataset, and the data from the remaining 36 classes are used as OOD ().
-
•
IMDB Maas et al. (2011) is a binary sentiment classification dataset consisting of movie reviews. Kaushik et al. (2020) construct a set of augmented IMDB samples (c-IMDB) by editing IMDB examples to yield counterfactual labels. As a result, this changes the distribution of semantic features with high a correlation to ID labels. We use the IMDB as ID and c-IMDB as OOD.
For evaluating POE on the background shift, we use the SST2 Socher et al. (2013) and Yelp Polarity Zhang et al. (2015) binary sentiment analysis datasets. The SST2 consists of movie reviews, whereas the Yelp polarity dataset contains reviews for different businesses, representing a domain shift from SST2. These datasets are used as ID/OOD pairs (i.e., SST2/Yelp and Yelp/SST2) in our experiments. The data statistics are described in Tab. 1.
4.2 Evaluation Metrics
The OOD detection performance is measured with respect to the following standard criteria.
-
•
AUROC is the area under the receiver operating characteristic curve obtained by varying the operating point. Higher is better.
-
•
FPR@95TPR (FPR) is the probability that an OOD (negative) example is classified as a positive when the true positive rate (TPR) is as high as 95%. Lower is better.
4.3 Training Details
Two PLMs are used to compare a wide variety of algorithms: BERT-uncased-base Devlin et al. (2019) and RoBERTa-base Liu et al. (2019). The PLMs are optimized with AdamW Loshchilov and Hutter (2018), the weight decay of 0.01, and the learning rate of 2e-5. We use a batch size of 16 and fine-tune the PLM for 10 epochs on the downstream task. When training the rejection network, we use of 16, and of 4. Other training configurations are equal to the above parameters. For all methods, we report the averaged performance over five runs using different random seeds. We implement our framework upon Huggingface’s Transformers Wolf et al. (2020) and implementation codes are available at https://github.com/kimjeyoung/Pseudo_OutlierExposure.
4.4 Compared Methods
Hyperparameter Range ODIN temperature {5, 50, 100, 500, 1000} perturbation {0.001, 0.01, 0.1, 1.0} DICE sparsification (%) {10, 30, 50, 90, 99} ReAct truncating (%) {80, 85, 90, 95, 99}
We compare our method with six post-hoc methods: MSP, ODIN, Mahalanobis (Maha), Energy, ReAct, and DICE. As the orthogonal research, contrastive learning methods that efficiently learn informative feature representations are well-suited for OOD detection. In our work, the recently proposed KNN-Contrastive Learning (KNN; Zhou et al., 2022), Supervised-Contrastive Learning (SCL; Khosla et al., 2020), and Margin-based Contrastive Learning (MCL; Zhou et al., 2021) are also compared. The hyperparameters of compared contrastive learning methods are followed the original work as possible for a fair comparison. For the post-hoc methods, excluding parameter-free methods, we report the best OOD detection performance by varying their hyperparameters and adopting their best settings on the test ID/OOD pairs. The detailed hyperparameter settings are reported in Tab. 2.
5 Result
In this section, we present comprehensive experimental evaluations of POE. We compare POE with baselines for CLINC datasets (Sec. 5.1), followed by empirical results for semantic and background shift benchmarks (Sec. 5.2) and detailed analysis (Sec. 5.4). Due to the space limitation, we evaluate all methods based on RoBERTa in this section, and the experimental results based on BERT are reported in Appendix.
5.1 Result for CLINC datasets
AUROC FPR AUROC FPR MSP 95.71 20.08 95.18 23.91 Energy 96.33 15.99 95.79 19.16 Maha 97.55 12.66 96.81 17.58 ODIN 96.36 16.49 95.73 20.24 ReAct 95.71 20.08 95.20 23.74 DICE 95.22 19.16 94.35 18.08 KNN-cosine 96.37 19.83 96.03 23.91 KNN-euclidean 96.39 19.33 95.87 23.66 SCL+MSP 94.35 22.91 95.89 20.40 MCL+MSP 95.73 17.93 95.83 19.96 POE+MSP (Ours) 96.58 15.58 96.36 16.49 SCL+Energy 95.16 17.08 96.50 15.24 MCL+Energy 96.41 13.74 96.53 14.46 POE+Energy (Ours) 96.98 12.16 96.62 13.33 SCL+Maha 97.42 13.91 97.06 13.24 MCL+Maha 97.63 11.24 97.38 13.91 POE+Maha (Ours) 97.66 12.33 97.48 12.08
Background Shift Semantic Shift SST2 Yelp IMDB Average AUROC FPR AUROC FPR AUROC FPR AUROC FPR AUROC FPR MSP 67.06 92.75 80.81 65.29 74.14 79.98 59.52 92.97 70.38 82.75 Energy 61.53 92.99 75.52 65.17 75.91 75.54 59.11 92.56 68.02 81.57 ODIN 67.05 92.81 80.80 65.32 75.60 75.67 59.57 92.85 70.76 81.66 Maha 64.64 93.53 91.04 51.74 79.77 68.73 60.48 93.96 73.98 76.99 ReAct 67.07 92.75 83.21 65.30 74.46 78.77 59.83 92.91 71.14 82.43 DICE 68.49 91.30 77.48 64.87 74.95 84.18 59.88 92.54 67.70 83.22 KNN-cosine 74.16 90.75 79.46 65.18 75.17 78.52 59.15 92.32 71.99 81.69 KNN-euclidean 74.48 90.63 79.80 65.03 75.11 78.42 58.54 92.50 71.98 81.65 SCL+MSP 59.36 94.69 79.98 70.33 70.72 79.29 62.34 92.20 68.10 84.13 MCL+MSP 62.23 89.95 89.30 58.93 72.87 77.56 59.09 92.44 70.87 79.72 POE+MSP (Ours) 70.05 91.63 90.47 57.94 74.62 77.08 62.41 92.33 74.39 79.75 SCL+Energy 56.53 94.93 76.72 70.42 73.69 77.02 62.28 92.13 67.31 83.63 MCL+Energy 61.66 89.76 89.17 59.00 73.12 76.13 58.63 92.44 70.65 79.33 POE+Energy (Ours) 70.74 88.14 90.16 57.53 74.31 76.07 62.01 92.09 74.31 78.46 SCL+Maha 75.42 82.48 80.88 71.34 80.94 67.76 61.29 93.67 74.63 78.81 MCL+Maha 90.16 60.16 97.10 17.13 80.19 66.21 60.46 93.43 81.98 59.23 POE+Maha (Ours) 92.76 36.84 97.59 15.08 81.77 65.50 61.15 93.79 83.32 52.80
The results in and are presented in Tab. 3, where the best results for each block are highlighted in bold. Specifically, KNN Zhou et al. (2022) uses the LOF algorithm Breunig et al. (2000) as an OOD scoring rule, in which they use two basic distances to calculate the LOF score. We denote KNN using Euclidean distance as KNN-euclidean and using cosine distance as KNN-cosine, respectively.
As shown in Tab. 3, POE outperforms all considered baselines on most ID and OOD distribution pairs on CLINC datasets, even though our method never requires access to real OOD data, unlike ODIN, ReAct, and DICE. Moreover, POE generally performs much better than other contrastive learning methods, especially on the which has a small size of training samples (50 instances per class). This empirical result shows that even if the rejection network is trained with the surrogate OOD set using small number of training samples and it shows the robust performance.
AUROC SST2 IMDB w/o replacement 96.32 91.67 61.02 w/ replacement 97.48 92.76 61.15
AUROC SST2 IMDB CE 95.18 67.06 59.52 CE+KL 96.90 85.68 61.01 CE+SCL 97.07 92.54 60.99 CE+MCL 97.48 92.76 61.15
5.2 Result for Distribution Shift Benchmarks
We also conduct the distribution shift experiment using two types of shifted OOD benchmarks to verify that our method can detect the challenging OOD samples successfully. Tab. 4 shows OOD detection results for the background and semantic shifts, and the best results are highlighted in bold.
As shown in Tab. 4, interestingly, we observe that not only MSP but also the SCL and MCL struggle with these challenging OOD data. For example, on at least one ID/OOD pair (underlined entries), the naive MSP outperforms SCL+MSP and MCL+MSP except for POE+MSP. In contrast, POE more accurately detects distributionally shifted instances compared to baselines. Especially, POE performs the best with the Mahalanobis distance for both background and semantic shifts.
5.3 Ablation Study
Recall that the [MASK] token of is randomly replaced with a word in the PLM’s vocabulary for training the rejection network.
We also assess how the replacement technique affects OOD detection performance (see Tab. 5).
We observe that using the replacement technique brings additional performance gain by exposing diverse OOD representations to the rejection network.
To investigate the promising design choices of training objectives, we conduct an ablation study by applying each training objective to the rejection network as shown in Tab. 6. The CE+KL can be another choice for training the rejection network, which is an additional KL penalty enforcing uniform predictions on the surrogate samples generated by POE, i.e., , where is the uniform distribution over classes. Overall, the rejection network is well-suited with a contrastive loss, and CE+MCL shows the best performances for all datasets. Different from the KL loss, which can not impose any constraints on the distribution of the rejection network’s inner representation of the given data, the rejection network with the contrastive loss learns the intra-class compactness for both ID and OOD classes, and it further separates the inter-class distances. We believe that this discriminative feature space introduced by the contrastive loss leads to better OOD detection performance.
5.4 Analysis
Accuracy (%) CE CE+SCL CE+MCL CE+POE 95.95 95.84 96.11 96.80 95.48 95.99 95.66 95.91 SST2 94.39 93.30 94.45 93.79 Yelp 97.75 97.76 97.65 97.81 92.48 92.51 93.04 92.49 IMDB 94.48 94.44 94.53 94.92
Target \ ID SST2 IMDB -3.02 -7.00 -22.3 SST2 -35.96 -1.64 -8.48 Yelp -33.28 -2.22 -5.82 IMDB -43.27 -1.73 -1.44 c-IMDB -46.42 -2.07 -2.58 News -37.65 -7.01 -20.31 POE -18.86 -3.25 -4.60
Classification Performance. When the post-hoc method is applied to the PLM trained on the downstream task, classification accuracy is maintained because its weights do not change. However, the accuracy may not be preserved when the weights of PLM are fine-tuned using a contrastive loss.
We evaluate the PLM trained with the contrastive loss on the six ID datasets. The experimental results are shown in Tab. 7. We observe that contrastive losses do not significantly reduce or increase the classification performance, which is similar to the observations by Zhou et al. (2021).
Analysis of the Surrogate OOD Set. To examine how closely the surrogate OOD samples lie in the ID manifold, we measure the Mahalanobis distance between ID and the surrogate OOD introduced by POE (Tab. 8). The RoBERTa is trained with the cross-entropy (CE) loss on the ID dataset and we calculate the Mahalanobis distance (Eq. 4) at the RoBERTa’s penultimate layer. We observe that the surrogate OOD samples produced by POE indeed have similar representations to ID samples.
For example, in the feature space of the RoBERTa trained on , the Mahalanobis distance between the surrogate OOD samples and the conditional Gaussian distribution for has the closest distance to the ID manifold. For the background (SST2) and semantic shift (IMDB) benchmarks, the IMDB and c-IMDB each has the most similar representation of paired ID set. However, the , and are also sufficiently closed to SST2 and IMDB, respectively.
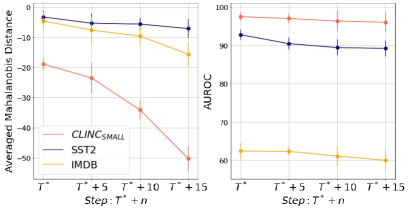
We also assess whether surrogate OOD samples, which have similar representations to ID samples, are most effective for OOD detection. In our OOD construction, for all training samples, we collect when becomes greater than . Therefore, as increases, OOD samples that are semantically distant from the ID dataset can be generated.
In Fig. 2, we report POE+Maha’s OOD detection performances with varying levels of . We identify that surrogate OOD samples produced by a larger further away from the ID samples are generated (Left in Fig. 2). This trait is desirable as ID discriminative tokens are more erased in the surrogate sample. Moreover, we observe that POE+Maha with surrogate OOD sets introduced by achieves the best AUROC scores for all datasets, whereas the OOD detection performance deteriorates when the reject network is trained with a set of OODs far from the ID. This empirical result shows that (1) POE leverages the simplicity of erasing attention-based tokens, but it is possible to generate pseudo OOD samples close to the distribution of ID, and (2) these OOD samples are effective in training the rejection network.
6 Conclusion
In this paper, we propose a simple and intuitive OOD construction to train a rejection network. Motivated by the previous observation that OOD samples are most effective when semantically similar to ID samples, POE detects and erases tokens with high attention scores of PLMs. Its resultant surrogate OOD dataset is close to the distribution of ID samples that have been observed to improve the OOD detection performance of the rejection network. Extensive experiments conducted on challenging ID/OOD pairs show POE’s competitiveness.
7 Limitation
Although the proposed method achieves significantly improved OOD detection performances compared to the baselines, but POE can not be applied to a naive LSTM, and RNN because our OOD construction is based on an attention score of the PLM. We leave this issue for future work, but we believe that our proposed method can be used in various NLP tasks as PLMs are now adopted in most fields of NLP tasks. While we adopted a masking method using attention scores in this paper, it is not clear that tokens with high attention scores have the most direct impact on the model’s predictions Wiegreffe and Pinter (2019). To provide readers with more information, we include additional experimental results in the Appendix to discuss the impact of different masking strategies on OOD detection performance.
8 Ethics Statement
The reliability of language models is crucial to the stable deployment of real-world NLP applications. For example, the computer-aided resume recommendation system and neural conversational AI should provide trustworthy predictions because they are intimately related to the issue of trust in new technologies. In this paper, we propose a simple but effective method called POE for OOD detection tasks. We introduce a novel OOD construction pipeline without any external OOD samples to train a rejection network. We hope our work to provide researchers with a new methodological perspective.
Acknowledgement
This work was supported by a National Research Foundation of Korea (NRF) grant and funded by the Korean government(No.2021R1C1C1012689 and No.2018R1D1A1B07045825).
References
- Andersen et al. (2020) Jakob Smedegaard Andersen, Tom Schöner, and Walid Maalej. 2020. Word-level uncertainty estimation for black-box text classifiers using rnns. In Proceedings of the 28th International Conference on Computational Linguistics, pages 5541–5546.
- Arora et al. (2021) Udit Arora, William Huang, and He He. 2021. Types of out-of-distribution texts and how to detect them. In Proceedings of the 2021 Conference on Empirical Methods in Natural Language Processing, pages 10687–10701, Online and Punta Cana, Dominican Republic. Association for Computational Linguistics.
- Breunig et al. (2000) Markus M Breunig, Hans-Peter Kriegel, Raymond T Ng, and Jörg Sander. 2000. Lof: identifying density-based local outliers. In Proceedings of the 2000 ACM SIGMOD international conference on Management of data, pages 93–104.
- Brown et al. (2020) Tom Brown, Benjamin Mann, Nick Ryder, Melanie Subbiah, Jared D Kaplan, Prafulla Dhariwal, Arvind Neelakantan, Pranav Shyam, Girish Sastry, Amanda Askell, et al. 2020. Language models are few-shot learners. Advances in neural information processing systems, 33:1877–1901.
- Chen et al. (2020) Ting Chen, Simon Kornblith, Mohammad Norouzi, and Geoffrey Hinton. 2020. A simple framework for contrastive learning of visual representations. In International conference on machine learning, pages 1597–1607. PMLR.
- Clark et al. (2020) Kevin Clark, Minh-Thang Luong, Quoc V. Le, and Christopher D. Manning. 2020. Pre-training transformers as energy-based cloze models. In EMNLP.
- Devlin et al. (2019) Jacob Devlin, Ming-Wei Chang, Kenton Lee, and Kristina Toutanova. 2019. BERT: Pre-training of deep bidirectional transformers for language understanding. In Proceedings of the 2019 Conference of the North American Chapter of the Association for Computational Linguistics: Human Language Technologies, Volume 1 (Long and Short Papers), pages 4171–4186, Minneapolis, Minnesota. Association for Computational Linguistics.
- Hendrycks and Gimpel (2017) Dan Hendrycks and Kevin Gimpel. 2017. A baseline for detecting misclassified and out-of-distribution examples in neural networks. Proceedings of International Conference on Learning Representations.
- Hendrycks et al. (2019) Dan Hendrycks, Mantas Mazeika, and Thomas Dietterich. 2019. Deep anomaly detection with outlier exposure. Proceedings of the International Conference on Learning Representations.
- Hsu et al. (2020) Yen-Chang Hsu, Yilin Shen, Hongxia Jin, and Zsolt Kira. 2020. Generalized odin: Detecting out-of-distribution image without learning from out-of-distribution data. In Proceedings of the IEEE/CVF Conference on Computer Vision and Pattern Recognition, pages 10951–10960.
- Jiang et al. (2020) Zhengbao Jiang, Frank F Xu, Jun Araki, and Graham Neubig. 2020. How can we know what language models know? Transactions of the Association for Computational Linguistics, 8:423–438.
- Kaushik et al. (2020) Divyansh Kaushik, Eduard Hovy, and Zachary Lipton. 2020. Learning the difference that makes a difference with counterfactually-augmented data. In International Conference on Learning Representations.
- Khosla et al. (2020) Prannay Khosla, Piotr Teterwak, Chen Wang, Aaron Sarna, Yonglong Tian, Phillip Isola, Aaron Maschinot, Ce Liu, and Dilip Krishnan. 2020. Supervised contrastive learning. Advances in Neural Information Processing Systems, 33:18661–18673.
- Kong et al. (2020) Lingkai Kong, Haoming Jiang, Yuchen Zhuang, Jie Lyu, Tuo Zhao, and Chao Zhang. 2020. Calibrated language model fine-tuning for in- and out-of-distribution data. In Proceedings of the 2020 Conference on Empirical Methods in Natural Language Processing (EMNLP), pages 1326–1340, Online. Association for Computational Linguistics.
- Lakshminarayanan et al. (2017) Balaji Lakshminarayanan, Alexander Pritzel, and Charles Blundell. 2017. Simple and scalable predictive uncertainty estimation using deep ensembles. Advances in neural information processing systems, 30.
- Lee et al. (2018a) Kimin Lee, Honglak Lee, Kibok Lee, and Jinwoo Shin. 2018a. Training confidence-calibrated classifiers for detecting out-of-distribution samples. International Conference on Learning Representations.
- Lee et al. (2018b) Kimin Lee, Kibok Lee, Honglak Lee, and Jinwoo Shin. 2018b. A simple unified framework for detecting out-of-distribution samples and adversarial attacks. Advances in neural information processing systems, 31.
- Li et al. (2021) Xiaoya Li, Jiwei Li, Xiaofei Sun, Chun Fan, Tianwei Zhang, Fei Wu, Yuxian Meng, and Jun Zhang. 2021. Folden: -fold ensemble for out-of-distribution detection. In Proceedings of the 2021 Conference on Empirical Methods in Natural Language Processing, pages 3102–3115, Online and Punta Cana, Dominican Republic. Association for Computational Linguistics.
- Liang et al. (2018) Shiyu Liang, Yixuan Li, and Rayadurgam Srikant. 2018. Enhancing the reliability of out-of-distribution image detection in neural networks. International Conference on Learning Representations.
- Liu et al. (2020) Weitang Liu, Xiaoyun Wang, John Owens, and Yixuan Li. 2020. Energy-based out-of-distribution detection. Advances in Neural Information Processing Systems, 33:21464–21475.
- Liu et al. (2019) Yinhan Liu, Myle Ott, Naman Goyal, Jingfei Du, Mandar Joshi, Danqi Chen, Omer Levy, Mike Lewis, Luke Zettlemoyer, and Veselin Stoyanov. 2019. Roberta: A robustly optimized bert pretraining approach. arXiv preprint arXiv:1907.11692.
- Loshchilov and Hutter (2018) Ilya Loshchilov and Frank Hutter. 2018. Decoupled weight decay regularization. In International Conference on Learning Representations.
- Maas et al. (2011) Andrew L. Maas, Raymond E. Daly, Peter T. Pham, Dan Huang, Andrew Y. Ng, and Christopher Potts. 2011. Learning word vectors for sentiment analysis. In Proceedings of the 49th Annual Meeting of the Association for Computational Linguistics: Human Language Technologies, pages 142–150, Portland, Oregon, USA. Association for Computational Linguistics.
- Misra (2018) Rishabh Misra. 2018. News category dataset.
- Socher et al. (2013) Richard Socher, Alex Perelygin, Jean Wu, Jason Chuang, Christopher D Manning, Andrew Y Ng, and Christopher Potts. 2013. Recursive deep models for semantic compositionality over a sentiment treebank. In Proceedings of the 2013 conference on empirical methods in natural language processing, pages 1631–1642.
- Sun et al. (2021) Yiyou Sun, Chuan Guo, and Yixuan Li. 2021. React: Out-of-distribution detection with rectified activations. Advances in Neural Information Processing Systems, 34.
- Sun and Li (2022) Yiyou Sun and Yixuan Li. 2022. Dice: Leveraging sparsification for out-of-distribution detection. In European Conference on Computer Vision.
- Wiegreffe and Pinter (2019) Sarah Wiegreffe and Yuval Pinter. 2019. Attention is not not explanation. In Proceedings of the 2019 Conference on Empirical Methods in Natural Language Processing and the 9th International Joint Conference on Natural Language Processing (EMNLP-IJCNLP), pages 11–20, Hong Kong, China. Association for Computational Linguistics.
- Wolf et al. (2020) Thomas Wolf, Lysandre Debut, Victor Sanh, Julien Chaumond, Clement Delangue, Anthony Moi, Pierric Cistac, Tim Rault, Remi Louf, Morgan Funtowicz, Joe Davison, Sam Shleifer, Patrick von Platen, Clara Ma, Yacine Jernite, Julien Plu, Canwen Xu, Teven Le Scao, Sylvain Gugger, Mariama Drame, Quentin Lhoest, and Alexander Rush. 2020. Transformers: State-of-the-art natural language processing. In Proceedings of the 2020 Conference on Empirical Methods in Natural Language Processing: System Demonstrations, pages 38–45, Online. Association for Computational Linguistics.
- Yang et al. (2019) Zhilin Yang, Zihang Dai, Yiming Yang, Jaime Carbonell, Russ R Salakhutdinov, and Quoc V Le. 2019. Xlnet: Generalized autoregressive pretraining for language understanding. Advances in neural information processing systems, 32.
- Yuan et al. (2019) Xingdi Yuan, Marc-Alexandre Côté, Jie Fu, Zhouhan Lin, Chris Pal, Yoshua Bengio, and Adam Trischler. 2019. Interactive language learning by question answering. In Proceedings of the 2019 Conference on Empirical Methods in Natural Language Processing and the 9th International Joint Conference on Natural Language Processing (EMNLP-IJCNLP), pages 2796–2813, Hong Kong, China. Association for Computational Linguistics.
- Zhang et al. (2015) Xiang Zhang, Junbo Zhao, and Yann LeCun. 2015. Character-level convolutional networks for text classification. Advances in neural information processing systems, 28.
- Zhou et al. (2021) Wenxuan Zhou, Fangyu Liu, and Muhao Chen. 2021. Contrastive out-of-distribution detection for pretrained transformers. In Conference on Empirical Methods in Natural Language Processing.
- Zhou et al. (2022) Yunhua Zhou, Peiju Liu, and Xipeng Qiu. 2022. KNN-contrastive learning for out-of-domain intent classification. In Proceedings of the 60th Annual Meeting of the Association for Computational Linguistics (Volume 1: Long Papers), pages 5129–5141, Dublin, Ireland. Association for Computational Linguistics.
Appendix A Additional Result
Comparison with other masking strategies. To provide readers with more information, we compare attention score-based masking with leave-one-out (LOO) method Wiegreffe and Pinter (2019). In Table 11, both attention-based masking and LOO are effective for the OOD detection task. However, attention-based masking has the advantage of being computationally efficient, as masking priorities can be obtained in a single forward pass. In contrast, LOO is computationally inefficient because it must remove each token in the input sentence one by one to verify the model predictions.
AUROC SST2 Yelp News IMDB MSP 96.39 95.14 65.42 83.78 71.44 56.26 Energy 97.02 96.35 62.77 82.49 73.46 54.41 ODIN 96.98 96.01 65.43 83.70 71.52 56.25 Maha 97.18 96.81 72.87 96.79 80.35 56.40 ReAct 96.39 96.01 65.42 83.76 71.99 56.33 DICE 94.57 95.02 65.68 83.40 71.74 56.32 KNN-cosine 96.94 96.03 72.77 84.41 73.26 57.67 KNN-euclidean 96.94 96.02 72.52 84.49 70.14 57.62 SCL+MSP 95.19 95.42 67.69 83.71 75.88 54.25 MCL+MSP 95.79 95.22 63.62 84.58 75.27 58.02 POE+MSP 96.25 95.92 73.27 85.24 77.23 56.64 SCL+Energy 96.43 96.71 65.23 81.92 76.83 56.91 MCL+Energy 96.69 96.82 62.71 84.96 76.03 57.67 POE+Energy 97.24 96.85 72.97 85.11 77.96 56.17 SCL+Maha 97.01 96.80 67.82 94.95 80.16 59.15 MCL+Maha 97.18 96.81 72.88 96.79 80.35 56.40 POE+Maha 97.03 96.19 73.03 96.98 80.70 57.49
FPR SST2 Yelp News IMDB MSP 17.41 20.08 91.03 69.57 82.89 91.32 Energy 12.24 14.99 97.87 68.56 76.34 91.44 ODIN 15.39 18.22 91.01 69.47 82.83 91.35 Maha 13.91 16.08 88.77 16.97 69.31 95.48 ReAct 17.41 18.24 91.03 69.57 80.63 91.09 DICE 22.08 20.12 91.33 68.85 82.36 91.59 KNN-cosine 17.33 22.75 93.64 68.21 81.57 92.85 KNN-euclidean 17.00 22.83 93.59 68.79 86.01 92.97 SCL+MSP 22.49 20.91 90.71 68.64 77.85 92.97 MCL+MSP 20.91 21.58 92.64 68.05 76.77 93.02 POE+MSP 18.89 20.24 88.69 67.91 77.38 92.76 SCL+Energy 14.08 15.16 95.30 68.87 72.81 92.03 MCL+Energy 14.91 15.66 94.08 67.92 72.15 93.02 POE+Energy 12.46 14.08 88.52 67.36 71.16 92.14 SCL+Maha 12.99 16.58 89.87 27.85 71.04 94.37 MCL+Maha 13.91 16.08 88.77 16.97 69.31 95.48 POE+Maha 14.35 18.83 90.14 16.39 70.18 94.14
SST2 IMDB AUROC MSP Energy MAHA MSP Energy MAHA MSP Energy MAHA Random masking 94.68 95.13 96.32 68.43 70.28 91.97 61.03 61.34 55.68 Attention score 96.36 96.62 97.48 70.05 70.74 92.76 62.41 62.01 61.15 LOO 96.31 96.84 97.35 71.13 70.54 92.50 61.88 61.71 62.26