Electron spin resonance study on the 4 honeycomb quantum magnet YbCl3
Abstract
The local magnetic properties of Yb3+ in the layered honeycomb material YbCl3 were investigated by electron spin resonance on single crystals. For in-plane and out-of-plane field orientations the -factor shows a clear anisotropy ( and ), whereas the low temperature exchange coupling and the spin relaxation display a rather isotropic character. At elevated temperatures the contribution of the first excited crystal field level ( meV) dominates the spin relaxation.
1 Introduction
Yb-containing quantum magnets in general but planar triangular or honeycomb lattices in particular are experiencing a resurgence of strong interest due to the emerging spin-liquid physics towards lowest temperatures. Due to spin-orbit entanglement, the exchange interactions are complex and bond-dependent, leading to strong frustration between spin-1/2 Yb Kramers ions. For the Yb-based planar triangular lattice spin liquids NaYbCh2 (Ch:O,S,Se) we have shown the electron spin resonance (ESR) of Yb to be a powerful local probe to study the local static and dynamic magnetization [1, 2, 3]. Due to its high resolution, the ESR method is particularly suitable for the investigation of the magnetic properties of very small single crystals, which is a clear advantage over conventional methods (SQUID magnetometry) [4].
Yb-based honeycomb lattices have been little studied so far. Ir4+ honeycomb lattices and Ru3+ honeycomb lattices, on the other hand, have been the focus of research in recent years. Here, the complex exchange can be described quite well with the so-called Kitaev model. This model predicts a number of magnetically ordered states including the non-ordered spin liquid state (see review [5] and references in there).
YbCl3 is a proposed candidate material for Kitaev physics on a honeycomb lattice containing edge-sharing octahedra [6, 7, 8] and is isostructural to the quantum spin liquid (QSL) candidate material -RuCl3. It exhibits short-range magnetic order below 1.2 K and Néel-type antiferromagnetic long-range order below 0.6 K [7, 9]. Strong quantum fluctuations were inferred from a reduced ordered moment and a tiny magnetic entropy release. It is discussed in terms of a model specified on anisotropic spin exchange interactions of rare-earth magnets on an unfrustrated honeycomb lattice [10]. This model also discusses the magnetic anisotropy as the main source of broadening of Yb3+-ESR in YbCl3.
Here, we present the Yb3+-ESR in YbCl3 which proofs a strong factor anisotropy, a contrasting low-temperature behavior between in-plane and out-of-plane line broadening, and a small anisotropy in Weiss temperatures which points towards a weak exchange anisotropy.
2 Experimental
2.1 Electron Spin Resonance
We performed our ESR investigations as previously described in more detail [1]. We used a magnetic microwave field at =9.4 GHz and transversally aligned to an external magnetic field . The ESR signal consists of the derivative of the absorbed microwave power and is measured for temperatures between 2.4 and 65 K. A Lorentzian line shape fitting yielded the parameters linewidth , determined by the spin-probe relaxation, and resonance field , determined by the effective -factor ) and internal fields. The integrated ESR absorption was calculated using the line amplitude and linewidth [11]. It is a measure of the intensity being determined by the static spin-probe magnetic susceptibility along the microwave magnetic field.
2.2 Sample preparation and characterisation
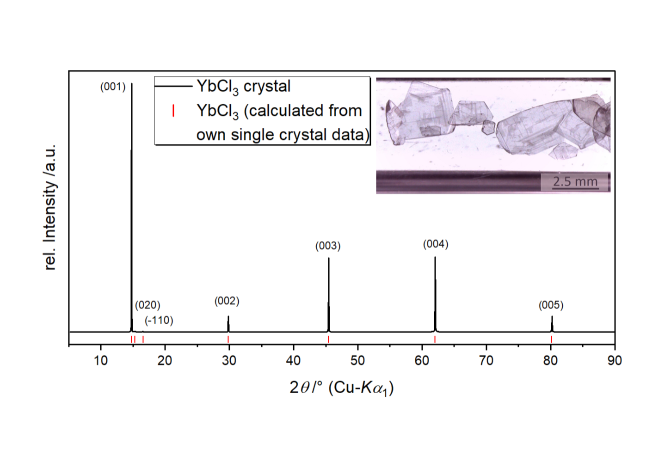
As YbCl3 is highly water sensitive, all operations were carried out in argon-filled glove boxes with O2 and H2O content less than 0.1 ppm. Special care was also taken to store and transport YbCl3 samples. Crystals were grown by chemical vapour transport from purchased YbCl3 powder (anhydrous, 99.9 %, ChemPUR) with AlCl3 (anhydrous, 98 %, Sigma Aldrich) as the transport agent in molar ratios of 5:1. Both powders were mixed in an agate mortar and filled into the quartz ampule, which was sealed under vacuum. The ampule was placed in a two zone furnace with the source side at 1073 K and the sink side at 873 K. After five days, thin transparent colourless crystals with up to 5 mm edge length were found in the sink side (see inset of Fig. 1). Smaller crystals and white powder with intergrown crystals were found in the middle and in the source side of the ampule, respectively.
Powder X-Ray Diffraction (PXRD) pattern was collected on a single crystal of YbCl3 in an inert gas sample holder. The data was recorded at room temperature on PANalytical X’Pert Pro diffractometer equipped with a curved Ge(111) monochromator with Cu-K-radiation ( Å) in Bragg–Brentano geometry in the range . As the pattern was collected from a single crystal, it is highly textured with mostly only reflections of -series visible, Fig. 1. All visible reflections can be indexed with a monoclinic space group in accordance with literature [7] and the theoretical pattern calculated from our single-crystal data, see below. No reflections of impurity phases were observed.
Single-Crystal X-Ray Diffraction (SCXRD) was performed on STOE IPDS II diffractometer with Ag-K ( Å) radiation at ambient temperature. A suitable crystal was selected and sealed in a glass capillary inside a glove box under inert gas atmosphere. Data collection, processing, integration, and numerical absorption correction were performed using the X-area software packages X-SHAPE and X-RED32 [12, 13]. The structure was solved with the SHELXT [14] structure solution program and refined using Olex2 [15] with the SHELXL [16] refinement package. Crystallographic data and experimental details are summarized in Table 1 and Table 2. Our data confirm YbCl3 to crystallize in the monoclinic space group with lattice parameters Å, 11.591(5) Å, 6.361(3) Å, in agreement with the literature [7]. No deviation from the ideal composition was found within experimental limits. The crystal structure data are deposited in the Inorganic Crystal Structure Database (ICSD) at FIZ-Karlsruhe and can be obtained free of charge by quoting the deposition number CSD-2250749.
| Crystal system | monoclinic |
|---|---|
| Space group | |
| , Å | 6.725(3) |
| , Å | 11.591(5) |
| , Å | 6.361(3) |
| , ∘ | 110.33(4) |
| , Å3 | 464.9(4) |
| Z | 4 |
| 2 range, ∘ | from 5.39 to 40 |
| Index ranges | |
| Reflections collected | 1866 |
| Independent reflections | 467 [Rint = 0.0727, Rσ = 0.0468] |
| Data/restraints/parameters | 467/0/21 |
| Goodness-of-fit on F2 | 1.049 |
| Final R indexes [] | R1 = 0.0337, wR2 = 0.0780 |
| Final R indexes [all data] | R1 = 0.0341, wR2 = 0.0782 |
| Largest diff. peak/hole, e Å-3 | 3.02/-1.65 |
| Atom | x | y | z | U11 | U22 | U33 | U23 | U13 | U12 |
|---|---|---|---|---|---|---|---|---|---|
| Yb | 0.5 | 0.33364(4) | 0.5 | 0.0338(4) | 0.0227(3) | 0.0513(4) | 0.000 | 0.0192(3) | 0.000 |
| Cl01 | 0.7149(5) | 0.5 | 0.7469(6) | 0.0440(18) | 0.0273(16) | 0.050(2) | 0.000 | 0.0072(15) | 0.000 |
| Cl02 | 0.2413(4) | 0.1797(2) | 0.2603(5) | 0.0446(13) | 0.0391(13) | 0.0508(14) | -0.0114(10) | 0.0244(11) | -0.0109(9) |
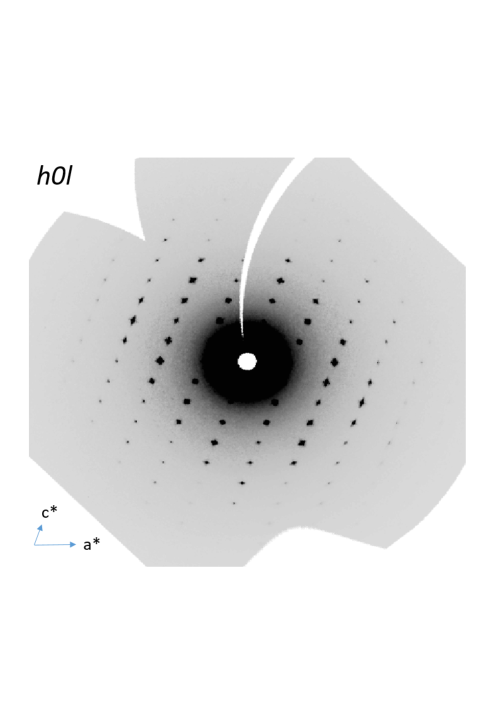
Layered van-der-Waals compounds are prone to stacking faults, often manifesting themselves in extensive diffuse streaks in their diffraction image, see, e.g. [17, 18]. As the reconstructed reciprocal space layers of our YbCl3 crystals evidence, Fig. 2, the Bragg reflections are not sharp spots but are slightly extended along [001] and, to a smaller extend, also along [100]. This indicates a certain amount of layer misorientation and domain formation but extensive stacking faults seem to be absent.
For the ESR experiment a millimetre sized single crystal was fixed with Apiezon grease in a suprasil quartz tube, which was sealed under vacuum. The crystal was oriented such that the microwave magnetic field direction is in the crystals’ ab-plane. The crystal was then goniometer-aligned to the direction of the external field for angles between in-plane ab and out-of-plane ab orientations.
3 Results
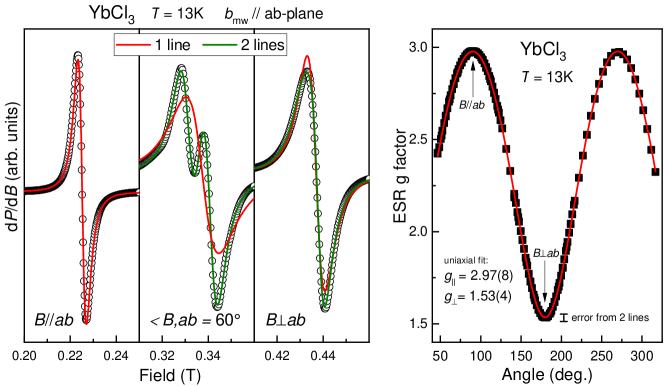
Typical ESR spectra are shown in Fig. 3 for three -plane orientations in the external field . Lorentzian line shapes were used to fit of the spectra (solid lines). Satisfying fits could be achieved by a single line for in-plane field orientation (, red line) whereas for out-of-plane field directions, two superimposed Lorentzian lines (green line) clearly yield a better fit. In fact, even two lines are not enough to perfectly fit the line shape. There are tiny contributions from further lines all having their individual orientation dependencies. To understand this multiline feature one may think of out-of-plane stacking faults. These are indicated by a broadened crystal field excitation as discussed for inelastic neutron diffraction data [19]. Such stacking faults result in a variation of the crystal field potential what in turn affects g-value and relaxation. However, as discussed above, the character of the Bragg reflections (Fig. 2) do not point toward extensive stacking faults but merely indicate a certain amount of domain formation and layer misorientation. The latter, in fact, provides the most sound explanation of the observed multi-lineshape. A two-line fitting results in g-value anisotropies which are shifted by . Hence, dominantly two layers tilted by contribute to the lineshape being consistent with two superimposed lines.
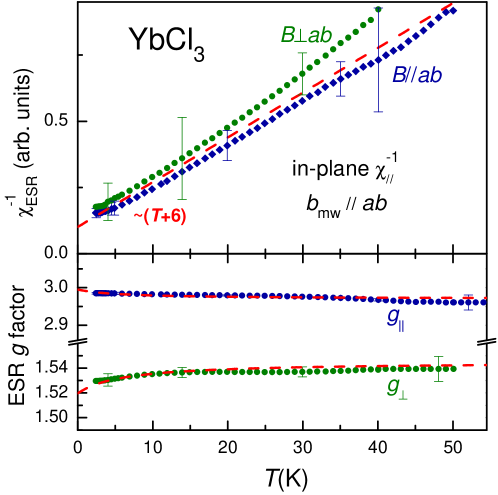
In order to extract the g-value anisotropy of the system as presented in Fig. 3, right frame, we utilized a single line fitting (accepting a small additional error as indicated) and obtained for K (smallest linewidth) an in-plane and an out-of-plane . Note that these values display a much larger anisotropy than reported from low-temperature susceptibility data, and [7]. We suspect that this discrepancy is due to the incomplete analysis of the magnetization data available in the literature. In order to obtain a consistent description, high field magnetizations at low temperatures (far below the first crystal field level) have to be performed. At very high fields, the magnetization is linearly proportional to the magnetic field. The proportionality constant is the temperature independent and anisotropic Van Vleck susceptibility which must be considered as a contribution in the analysis of the susceptibility, especially in the determination of the magnetic moment (see [20], for instance).
The temperature dependence of the linewidth is shown in Fig. 4 and shows the same characteristics as found in Yb-based delafossites [1, 2]: Towards high temperatures an Orbach process [21, 22] dominates the broadening according to with denoting the first excited crystalline-electric field split electronic energy level. The red dashed line in Fig. 4 corresponds to K ( meV) in agreement with neutron scattering results for the lowest crystal field split level at meV (244 K) [19]. This elevated value of is in accordance with the scenario of an effective spin-1/2 state for the low-temperature regime which is indicated by the recovery of the spin-1/2 entropy of seen in specific heat results at K [7].
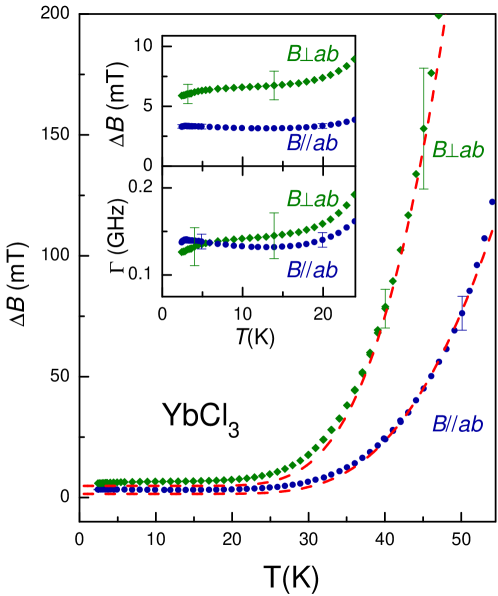
Towards low temperatures the behavior of is clearly different to that observed in the Yb-delafossites [2] (see inset top frame Fig. 4). For the latter a growing influence of spin correlations lead to an increase of . In YbCl3, however, a slight increase could only be detected for whereas for continues to decrease towards low temperatures. Regarding the effect of spin correlations this observation is remarkable in the presence of Néel-type antiferromagnetic order below 0.6 K [9, 7] (with ordered moments along the a-axis). However, as shown in the lower inset frame of Fig.4, the spin relaxation rate shows very weak anisotropy and can even be considered isotropic within experimental accuracy.
The ESR intensity is shown in the upper frame of Fig. 5 for the microwave magnetic field aligned in the -plane and for in-plane and out-of-plane directions, both yielding . Within the experimental error both dataset can be considered to be the same, as in the case of NaYbS2 [1]. Although the intensity data are based on a single line fitting (see Fig. 3) the systematically larger for cannot be explained if the intensity was based on a two lines fitting. Hence, both dataset can be reasonably well described by a Curie-Weiss law with K (solid line) which is consistent with the one from magnetization [7], confirming dominant antiferromagnetic correlations in the plane.
The ESR factor shows a weak temperature dependence, as shown in the lower frame of Fig. 5. There the dashed lines refer to a molecular magnetic field description of the anisotropic Yb-Yb interaction [11, 23, 24] providing a link between the -factor and the exchange anisotropy which is reflected in :
| (1) | |||||
| (2) |
These equations provide a reasonable data description with K given from . We obtained , , and K for the adjustable parameters in good agreement with the -values describing the anisotropy in Fig.3. Hence, the weak temperature dependence of demonstrates a small difference , as similarly found for NaYbS2 and NaYbSe2 [2].
4 Discussion and Summary
The presented ESR studies provide the first results for local magnetic properties of Yb3+ in YbCl3 being partly dissimilar with non-local probes such as AC and DC susceptibility [7, 9, 19]. The strong anisotropy of the factor (Fig. 3) as well as the exponential linewidth increase (Fig. 4) are clear effects of the crystalline electric field that is locally acting on the Yb3+ moments. These are centered in edge-sharing, tilted YbCl6 octahedra giving rise to quasi-2D honeycomb layers of Yb3+ ions. For this environment the low- temperature state of the Yb3+ ion is characterized by the measured values in-plane and out-of-plane given in Fig. 3. As discussed for NaYbS2 [1] the small difference in the Weiss temperatures obtained from the factor temperature dependence (Fig. 5) is a measure of the anisotropy in the exchange interaction between the Yb3+ spins. This anisotropy leads to a broadening of the line in contrast to the isotropic exchange which is responsible for the exchange narrowing mechanism [25]. With K, K and with the notation and values used in Refs. [19, 26] we obtained K. A rough estimate for the anisotropy broadening according to with K yields mT. This value is not small compared to the maximal estimations for hyperfine- ( mT) and dipolar broadening ( mT) using the nearest-neighbour Yb-distance of YbCl3 [19]. Hence, in YbCl3, similar to NaYbS2 [1], the observed linewidth, reaching the smallest value of 3.16 mT for -plane at 13 K, is largely due to a broadening from anisotropic exchange interactions.
In summary, YbCl3 is an interesting quantum magnet. It remains to be seen whether other local probes such as muon spectroscopy or nuclear magnetic resonance will confirm the anisotropy determined here. It also remains to be seen whether the magnetic order at 0.6 K for YbCl3 can be confirmed with these local probes. The related system YbBr3, for example, shows an absence of magnetic order down to 0.1 K and is therefore classified as spin liquid [27].
Acknowledgements
We thank Prof. Anna Isaeva, U. Amsterdam, and Oliver Stockert for valuable discussions. Financial support by the Deutsche Forschungsgemeinschaft through SFB 1143 (project-id 247310070) is gratefully acknowledged.
References
References
- [1] Sichelschmidt J, Schlender P, Schmidt B, Baenitz M and Doert T 2019 J. Phys.: Condens. Matter 31 205601
- [2] Sichelschmidt J, Schmidt B, Schlender P, Khim S, Doert T and Baenitz M 2020 JPS Conf. Proc. 30 011096 (Preprint https://journals.jps.jp/doi/pdf/10.7566/JPSCP.30.011096)
- [3] Schmidt B, Sichelschmidt J, Ranjith K M, Doert T and Baenitz M 2021 Phys. Rev. B 103(21) 214445
- [4] Häußler E, Sichelschmidt J, Baenitz M, Andrade E C, Vojta M and Doert T 2022 Phys. Rev. Materials 6 046201
- [5] Trebst S and Hickey C 2022 Phys. Rep. 950 1–37
- [6] Rau J G and Gingras M J P 2018 Phys. Rev. B 98 054408
- [7] Xing J, Feng E, Liu Y, Emmanouilidou E, Hu C, Liu J, Graf D, Ramirez A P, Chen G, Cao H and Ni N 2020 Phys. Rev. B 102(1) 014427
- [8] Templeton D H and Carter G F 1954 J. Phys. Chem. 58 940–944
- [9] Hao Y, Wo H, Gu Y, Zhang X, Gu Y, Zheng S, Zhao Y, Xu G, Lynn J W, Nakajima K, Murai N, Wang W and Zhao J 2020 Sci. China Phys. 64 237411
- [10] Luo Z X and Chen G 2020 SciPost Phys. Core 3 4
- [11] Gruner T, Wykhoff J, Sichelschmidt J, Krellner C, Geibel C and Steglich F 2010 J. Phys.: Condens. Matter 22 135602
- [12] Stoe & Cie GmbH Darmstadt, Germany 2009 X-SHAPE: Crystal Optimisation for Numerical Absorption Correction Program (Version 2.12.2)
- [13] Stoe & Cie GmbH Darmstadt, Germany 2009 X-RED32: Data Reduction Program (Version 1.53)
- [14] Sheldrick G M 2015 Acta Crystallographica Section A 71 3–8
- [15] Dolomanov O V, Bourhis L J, Gildea R J, Howard J A K and Puschmann H 2009 Journal of Applied Crystallography 42 339–341
- [16] Sheldrick G M 2015 Acta Crystallographica Section C 71 3–8
- [17] Johnson R D, Williams S C, Haghighirad A A, Singleton J, Zapf V, Manuel P, Mazin I I, Li Y, Jeschke H O, Valentí R and Coldea R 2015 Phys. Rev. B 92(23) 235119
- [18] Stahl Q, Ritschel T, Garbarino G, Cova F, Isaeva A, Doert T and Geck J 2022 Pressure-tuning of towards the ideal kitaev-limit arXiv:2209.08367
- [19] Sala G, Stone M B, Rai B K, May A F, Parker D S, Halász G B, Cheng Y Q, Ehlers G, Garlea V O, Zhang Q, Lumsden M D and Christianson A D 2019 Phys. Rev. B 100(18) 180406
- [20] Ranjith K M, Luther S, Reimann T, Schmidt B, Schlender P, Sichelschmidt J, Yasuoka H, Strydom A M, Skourski Y, Wosnitza J, Kühne H, Doert T and Baenitz M 2019 Phys. Rev. B 100 224417
- [21] Orbach R 1961 Proc. Roy. Phys. Soc. A 264 458–484
- [22] Abragam A and Bleaney B 1970 Electron Paramagnetic Resonance of Transition Ions (Oxford: Clarendon Press)
- [23] Huber D L 2009 J. Phys.: Condens. Matter 21 322203
- [24] Sichelschmidt J, Gruner T, Jang D, Steppke A, Brando M, Mitsumoto K and Geibel C 2015 J. Phys. Conf. Ser. 592 012017
- [25] Anderson P W and Weiss P R 1953 Rev. Mod. Phys. 25 269
- [26] Li Y, Chen G, Tong W, Pi L, Liu J, Yang Z, Wang X and Zhang Q 2015 Phys. Rev. Lett. 115(16) 167203
- [27] Wessler C, Roessli B, Krämer K W, Delley B, Waldmann O, Keller L, Cheptiakov D, Braun H B and Kenzelmann M 2020 npj Quantum Mater. 5 85