The effect of disorder on phases across two-dimensional thermal melting
Abstract
We study melting in a two-dimensional system of classical particles with Gaussian-core interactions in disordered environments. The pure system validates the conventional two-step melting with a hexatic phase intervening between the solid and the liquid. This picture is modified in the presence of pinning impurities. A random distribution of pinning centers forces a hexatic-like low temperature phase that transits into a liquid at a single melting temperature . In contrast, pinning centers located at randomly chosen sites of a perfect crystal anchors a solid at low temperatures which undergoes a direct transition to the liquid at . Thus, the two-step melting is lost in either cases of disorder. We discuss the characteristics of melting depending on the nature of the impurities.
Introduction — Enhanced fluctuations make two-dimensional melting a topic of immense research interest. Unlike their three-dimensional counterparts undergoing “Lindemann melting” [1, 2], 2D melting is mediated by the unbinding of topological defects. The positional order (PO) and bond-orientational order (BOO) decouple in 2D, producing a “hexatic phase” sandwiched between the solid and the liquid. Hexaticity, a rich concept, is realized in colloids [3, 4], the vortex lattice in superconductors [5], in active Brownian disks [6] and recently in van der Waals magnet [7]. The celebrated KTHNY theory [8, 9, 10, 11, 12], pictures 2D-melting as a two-step process involving successive unbinding of dislocations and disclinations– presented schematically in Fig. 1(a). However, the relevance of the two-step 2D melting has also been debated [13, 14, 15, 16].
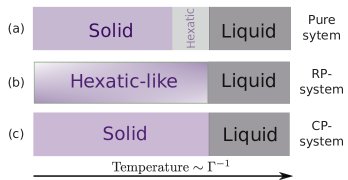
Quenched disorder, inherent to real materials, can not only move around the phase boundaries but is also capable of modifying the mechanism of melting. For example, impurities can generate unbounded defects even at , and thereby mask the unbinding of thermal defect-pairs. This could strike out solidity even at the lowest , as suggested by Nelson [17] – portrayed schematically in Fig. 1(b). In contrast, impurities which pin a given fraction of particles on sites of the underlying perfect lattice could stabilize the solid by anchoring it via these commensurate locations, and thereby consume the phase space of hexaticity (see Fig. 1(c)). Role of disorder in destabilizing the hexatic phase [18] and in enhancing long-range correlation has also been pointed out [19]. Thus, a careful analysis of 2D-melting in disordered media can potentially uncover new paradigms.
Experiments on colloids [20], vortex lattices [21, 22] and multi component mixtures [23] indicate a broadened stability of the hexatic phase in the presence of disorder consistent with recent calculations [24, 25, 26, 27, 28, 32]. Study of 2D melting is also popular in confined geometry [29, 30, 31] mimicking disordered background. Zeng et al.[33] have argued that a solid (“Bragg glass”) phase with power-law decay of translational correlations cannot occur in a 2D system with impurities. Pronounced hexatic correlations are expected to be present [34, 35] if the disorder is not strong, though there are controversies [36, 37, 38] about the existence of a hexatic glass phase with long- or quasi-long-range hexatic order in 2D. In contrast, phase boundaries of the two-step melting are found to be insensitive to quenched defects on a spherical surface [39].
In this letter, we investigate the phases across melting of a bulk 2D system of soft-core particles, modeled via Gaussian-core interactions [40], which is known to validate the KTHNY-melting scenario in a pure system [41]. Addressing the role of quenched disorder in the phase behaviour this model, our key results are summarized as follows: (i) Random-pinning (RP) destabilizes solidity causing a single transition from a low- hexatic-like phase to a high- liquid. Here, the low- phase undergoes a likely crossover from hexatic-glass to hexatic-liquid. (ii) On the other hand, the commensurate-pinning (CP) anchors solidity and engulfs hexaticity – even the high- liquid phase supports inhomogeneous pockets of crystallinity. The defect locations correlate oppositely with pinning centers in the two models of disorder – defects tend to bind with the pinning centers for RP-systems, whereas they stay away from the impurities in CP-systems. Thus, in either realization of the quenched disorder, the two-step melting is lost.
Model & method: — We introduce disorder in two different ways: (a) Random pinning (RP), in which we freeze a given fraction () of particles, chosen randomly in space, within a high- liquid configuration. Here, these immobile particles act as disorder. (b) Commensurate pinning (CP), where fraction of particles are frozen at randomly chosen positions of an ideal triangular lattice – the ground state configuration of the pure system. Note that CP represents correlated disorder with a long-range positional correlation of a perfect lattice. In contrast, RP constitutes nearly uncorrelated disorder though weak short-range correlation of a high- liquid may exist. We investigated a system of particles, with . These results were compared with those from a pure system with particles. For these systems, we sample configurations via molecular dynamics. [42] within the canonical ensemble, using LAMMPS [43] We consider a simulation box having dimensions , having periodic boundary conditions. is adjusted to keep the density, of particles fixed for all our studies (). We carried out MD steps with a time step . We use dimensionless parameters: and , where is the mass of each particle. is expressed in terms of [44], where . The physical observables are averaged over - independent pinning configurations for a given .
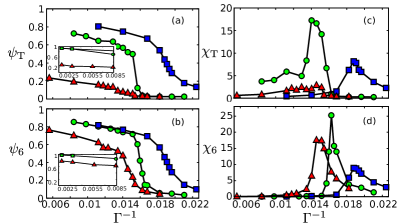
Positional and bond orientational order: — A pure 2D solid is characterized by two kinds of ordering: (i) PO measured by , where . is a first shell reciprocal-lattice vector of the underlying triangular crystal and is the position of particle , and (ii) BOO, quantified by where . The sum is over the nearest neighbors of particle identified by a Voronoi construction [45] and is the angle that a line joining particle and particle makes with a reference axis. KTHNY theory predicts two critical temperatures: and , for the thermal depletion of quasi-long-range PO (solid to hexatic) and BOO (hexatic to liquid) respectively, leaving a hexatic phase with quasi-long-range BOO between the solid and isotropic liquid phases.
In Fig. 2(a,b), we plot the thermal evolution of and for pure, RP and CP systems. While the pure system follows KTHNY melting 111The three phases are clearly identified by the snapshots at three representatives s in the SM, Fig. S1(a-c) with and , in the CP-system is found to survive to larger . The RP-system shows a much weaker than the other two, even at the lowest and depletes very gradually with without any threshold behavior. A threshold behavior near is also seen in the pinned systems in Fig. 2(b), albeit the transitions are broader. Unlike , the is comparable at low- in pure, CP- and RP-systems. We also note that and show a significant drop at the same critical temperature in a CP-system, implying a direct transition from solid to liquid, which we discuss further below.
In addition, the fluctuations of and define generalised susceptibilities , (with or ), and help to identify and , as shown in Fig. 2(c,d). Their behavior confirms that the pure system shows sharp transitions. Consistent with our finding in panel (a), in the RP-system features only a broad and low hump, hinting that a low- phase in such a system represents a broad crossover between a hexatic glass [34] and a hexatic liquid 222The low- phase support significant hexatic order for our model parameters, while and the snapshots establish the amorphous and glassy nature. The -dependence of and is indicative of a crossover from a hexatic-glass to a hexatic-liquid, before the RP-system transits to a liquid at . However, the resolution of our simulation is inadequate for drawing a firm conclusion.. This is also consistent with the trajectory picture of RP system at in the supplementary material (SM) [48] Fig. S1(d). Congruous with our findings in panels (a,b), the locations of the peak of and verify that PO and BOO in the CP-system vanish at a single . While our results from Fig. 2 seem to support the schematic phase-diagram of Fig. 1, we emphasize that the ‘impure’ phases at low- and high- defy conventional wisdom. These include the presence of unbound defects even at in RP-systems, and pockets of crystallinity deep into the liquid phase in CP-systems, as seen from Fig. S1(g-i) in the SM [48], and discussed below.
Defects analysis: —
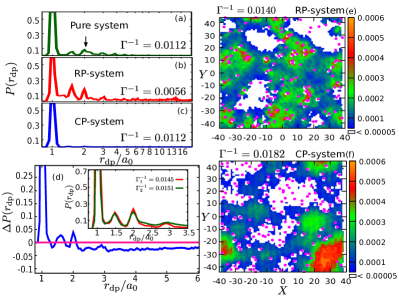
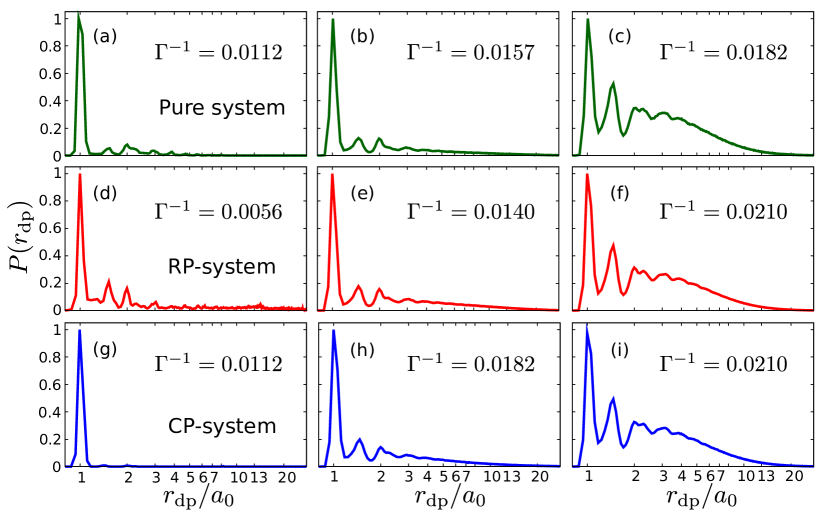
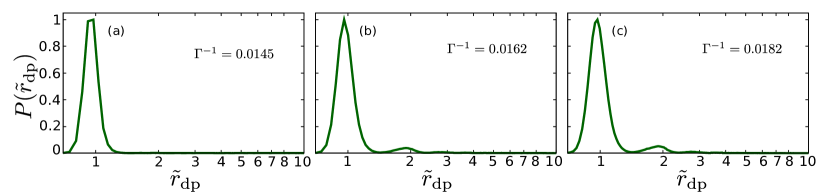
In KTHNY theory, a 2D-solid transits to the hexatic phase by the unbinding of paired dislocations [10, 11]. We proceed to examine the consistency of this picture in Fig. 2. This requires an estimation of the critical distance between two dislocations (with equal and opposite Burger vectors) below which they are bound. We first employ the Hungarian algorithm [49], which chooses ‘correct’ partners of dislocations by minimizing the sum of the distances between all partners [50]. The distribution of resulting pair distances, , at low- is presented in Fig. 3(a-c).
is sharply peaked for pure systems in Fig. 3(a), with insignificant weight at larger .
In contrast, its long tail at low (shown for in Fig. 3(b)) for the RP-system arises from unbound dislocations even for , which destabilize a true solid.
in CP-systems (Fig. 3(c)) consists of the initial sharp peak, and nearly no weight for larger .
A discernible tail in for pure systems develops when dislocation pairs start unbinding. An integrated distribution of features a threshold behavior at this transition (see SM [48]).
To obtain the critical for the pure system, we plot in Fig. 3(d) the difference of these distributions, , at temperatures just above and below , while the corresponding -s are shown as the inset. The total positive and negative weights of cancel out, and is identified as the last zero-crossing point. This identification is found robust for ’s near . A study of distances of disclination pairs yielded a similar critical distance between disclination pairs. Once extracted for the pure system, these critical distances were used for analyzing pinned systems.
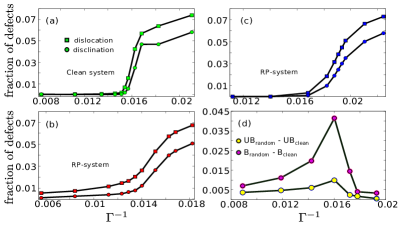
Subsequently, we explored the thermal evolution of the defects and their unbinding in Fig. 4(a-c). For the lowest , defects are essentially absent in the pure system. Unbound disclinations proliferate at , whereas dislocations unbind at , with a hexatic phase at intervening temperatures [41], consistent with Fig. 2.
The CP-system (Fig. 4(c)) behaves like a ‘better’ solid at low- due to the absence of any free defects up to beyond that unbound dislocations and disclinations start proliferating at the same .
There are significant number of impurity-induced unbound dislocations in the RP-system for , as also concluded from Fig. 2.
Here, unpaired dislocations are not only present for all , they even outnumber bound dislocations at low-.
Fig. 4(d) addresses the role of the impurity induced free defects (at ) in RP-systems, on the thermal defects, whose unbinding drives the two transitions in a pure system. Number of bound (B) and unbound (UB) defects, with corresponding numbers subtracted for an equivalent pure system, are examined separately in Fig. 4(d).
These numbers increase sharply with until the system transits to the liquid. Thus, the impurity induced defects help promote further thermal defects, than in pure systems for . Such a rise disappears in the liquid.
In fact, this difference in bound defects in the liquid goes down to a even lower value than the corresponding number at .
Correlations: —
Finally, we discuss the orientational correlations as measured by the
correlation function
where .
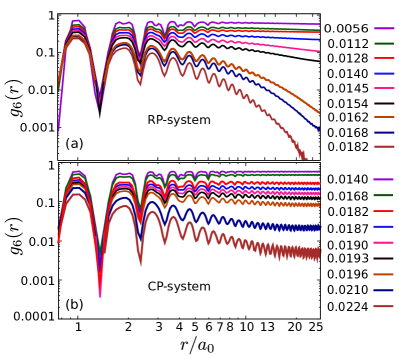
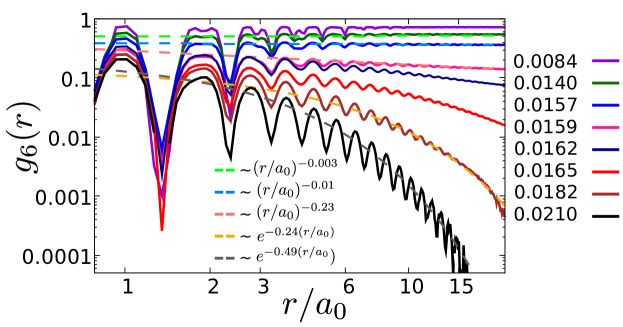
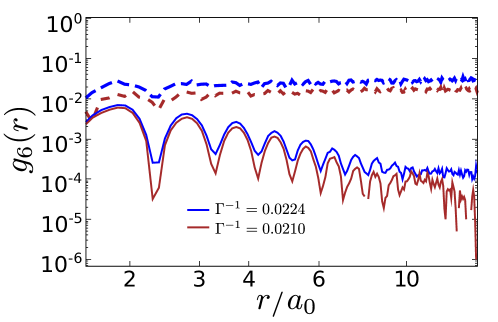
The -dependence of orientational correlations in the pure system follows KTHNY scenario [10, 11, 12] as claimed earlier [41]. The evolution of for various is shown in Fig. 5 for RP- and CP-systems.
Our -minimization analysis [51] of the large- decay of in the RP-system (Fig. 5(a)) identified a power-law behavior for nearly the entire low- phase.
This power-law behavior continues until an exponential decay sets in for , signaling the onset of liquidity.
Intriguingly, in CP-systems shows the enhanced solidity for , where its traces remain largely flat.
Beyond the direct melting from solid to liquid for , in CP-systems displays a tendency of plateauing at large-, though it decays at intermediate . This is a signature of ‘remnant solidity’ arising from local crystalline pockets surrounding the impurities
whose locations are commensurate with the perfect crystal and hence anchoring crystallinity in the vicinity (See SM [48]).
This is a direct consequence of the correlated nature of the CP-impurities.
Conclusion: —
To summarize, we demonstrate that the conventional picture of 2D-melting undergoes significant changes in the presence of impurities.
While RP-disorder destabilizes solidity and CP-disorder removes the hexatic phase, the low- phase in RP-systems is not the conventional hexatic. Similarly, the high- phase in the CP-systems mixes remnant solidity with the liquid phase.
The inhomogeneous melting (Fig. S1 in SM [48] generates defects which correlate differently with pinning centers:
For RP-systems the defects tend to bind with the pinning centers, whereas the defects stay away from the impurities in CP-systems.
While defects are found essential for driving the melting, our MD configurations indicate that they often bunch up in various shapes of macroscopic size (See videos in SM [48]).
An extension of our study to larger systems exploring possible role of grain boundaries on melting is a promising future direction. It will also be interesting to inspect the role of quantum fluctuations in these thermal phases. We hope that our findings will motivate future experiments for shedding new light.
References
- Lindemann [1910] F. Lindemann, The calculation of molecular vibration frequencies phys, Z 11, 609 (1910).
- Lozovik [1987] Y. E. Lozovik, Ion and electron clusters, Soviet Physics Uspekhi 30, 912 (1987).
- Zahn et al. [1999] K. Zahn, R. Lenke, and G. Maret, Two-stage melting of paramagnetic colloidal crystals in two dimensions, Phys. Rev. Lett. 82, 2721 (1999).
- Gasser et al. [2010] U. Gasser, C. Eisenmann, G. Maret, and P. Keim, Melting of crystals in two dimensions, ChemPhysChem 11, 963 (2010).
- Guillamón et al. [2009] I. Guillamón, H. Suderow, A. Fernández-Pacheco, J. Sesé, R. Córdoba, J. M. De Teresa, M. R. Ibarra, and S. Vieira, Direct observation of melting in a two-dimensional superconducting vortex lattice, Nature Physics 5, 651 (2009).
- Digregorio et al. [2018] P. Digregorio, D. Levis, A. Suma, L. F. Cugliandolo, G. Gonnella, and I. Pagonabarraga, Full phase diagram of active brownian disks: From melting to motility-induced phase separation, Phys. Rev. Lett. 121, 098003 (2018).
- Meisenheimer et al. [2023] P. Meisenheimer, H. Zhang, D. Raftrey, X. Chen, Y.-T. Shao, Y.-T. Chan, R. Yalisove, R. Chen, J. Yao, M. C. Scott, W. Wu, D. A. Muller, P. Fischer, R. J. Birgeneau, and R. Ramesh, Ordering of room-temperature magnetic skyrmions in a polar van der waals magnet, Nature Communications 14, 3744 (2023).
- Kosterlitz and Thouless [1972] J. M. Kosterlitz and D. J. Thouless, Long range order and metastability in two dimensional solids and superfluids. (application of dislocation theory), Journal of Physics C: Solid State Physics 5, L124 (1972).
- Kosterlitz and Thouless [1973] J. M. Kosterlitz and D. J. Thouless, Ordering, metastability and phase transitions in two-dimensional systems, J. Phys. C 6, 1181 (1973).
- Halperin and Nelson [1978] B. I. Halperin and D. R. Nelson, Theory of two-dimensional melting, Phys. Rev. Lett. 41, 121 (1978).
- Nelson and Halperin [1979] D. R. Nelson and B. I. Halperin, Dislocation-mediated melting in two dimensions, Phys. Rev. B 19, 2457 (1979).
- Young [1979] A. P. Young, Melting and the vector coulomb gas in two dimensions, Phys. Rev. B 19, 1855 (1979).
- Kapfer and Krauth [2015] S. C. Kapfer and W. Krauth, Two-dimensional melting: From liquid-hexatic coexistence to continuous transitions, Phys. Rev. Lett. 114, 035702 (2015).
- Chui [1983] S. T. Chui, Grain-boundary theory of melting in two dimensions, Phys. Rev. B 28, 178 (1983).
- Qi et al. [2014] W. Qi, A. P. Gantapara, and M. Dijkstra, Two-stage melting induced by dislocations and grain boundaries in monolayers of hard spheres, Soft Matter 10, 5449 (2014).
- Mazars [2015] M. Mazars, The melting of the classical two-dimensional wigner crystal, Europhysics Letters 110, 26003 (2015).
- Nelson [1983] D. R. Nelson, Reentrant melting in solid films with quenched random impurities, Phys. Rev. B 27, 2902 (1983).
- Qi and Dijkstra [2015] W. Qi and M. Dijkstra, Destabilisation of the hexatic phase in systems of hard disks by quenched disorder due to pinning on a lattice, Soft Matter 11, 2852 (2015).
- Guillamón et al. [2014] I. Guillamón, R. Córdoba, J. Sesé, J. M. De Teresa, M. R. Ibarra, S. Vieira, and H. Suderow, Enhancement of long-range correlations in a 2d vortex lattice by an incommensurate 1d disorder potential, Nature Physics 10, 851 (2014).
- Deutschländer et al. [2013] S. Deutschländer, T. Horn, H. Löwen, G. Maret, and P. Keim, Two-dimensional melting under quenched disorder, Phys. Rev. Lett. 111, 098301 (2013).
- Ganguli et al. [2016] S. C. Ganguli, H. Singh, I. Roy, V. Bagwe, D. Bala, A. Thamizhavel, and P. Raychaudhuri, Disorder-induced two-step melting of vortex matter in co-intercalated single crystals, Phys. Rev. B 93, 144503 (2016).
- Duhan et al. [2023] R. Duhan, S. Sengupta, R. Tomar, S. Basistha, V. Bagwe, C. Dasgupta, and P. Raychaudhuri, Structure and dynamics of a pinned vortex liquid in superconducting -rexzr (x 6) thin film (2023), arXiv:2304.10926 [cond-mat.supr-con] .
- Li et al. [2023] Y.-W. Li, Y. Yao, and M. P. Ciamarra, Two-dimensional melting of two- and three-component mixtures, Phys. Rev. Lett. 130, 258202 (2023).
- Tsiok et al. [2021] E. N. Tsiok, Y. D. Fomin, E. A. Gaiduk, and V. N. Ryzhov, Structural transition in two-dimensional hertzian spheres in the presence of random pinning, Phys. Rev. E 103, 062612 (2021).
- Gaiduk et al. [2019] E. A. Gaiduk, Y. Fomin, E. N. Tsiok, and V. N. Ryzhov, The influence of random pinning on the melting scenario of two-dimensional soft-disk systems, Molecular Physics 117, 2910 (2019), https://doi.org/10.1080/00268976.2019.1607917 .
- Shankaraiah et al. [2020] N. Shankaraiah, S. Sengupta, and G. I. Menon, Disorder-induced enhancement of local hexatic correlations in two-dimensional fluids, Journal of Physics: Condensed Matter 32, 184003 (2020).
- Arjun H and Chaudhuri [2020] Arjun H and P. Chaudhuri, Dense hard disk ordering: influence of bidispersity and quenched disorder, Journal of Physics: Condensed Matter 32, 414001 (2020).
- Tsiok et al. [2015] E. N. Tsiok, D. E. Dudalov, Y. D. Fomin, and V. N. Ryzhov, Random pinning changes the melting scenario of a two-dimensional core-softened potential system, Phys. Rev. E 92, 032110 (2015).
- Melzer et al. [2012] A. Melzer, A. Schella, T. Miksch, J. Schablinkski, D. Block, A. Piel, H. Thomsen, H. Kählert, and M. Bonitz, Phase transitions of finite dust clusters in dusty plasmas, Contributions to Plasma Physics 52, 795 (2012), https://onlinelibrary.wiley.com/doi/pdf/10.1002/ctpp.201200028 .
- Ash et al. [2017] B. Ash, J. Chakrabarti, and A. Ghosal, Static and dynamic properties of two-dimensional coulomb clusters, Phys. Rev. E 96, 042105 (2017).
- Ash et al. [2018] B. Ash, C. Dasgupta, and A. Ghosal, Analysis of vibrational normal modes for coulomb clusters, Phys. Rev. E 98, 042134 (2018).
- Cha and Fertig [1995] M.-C. Cha and H. A. Fertig, Disorder-induced phase transitions in two-dimensional crystals, Phys. Rev. Lett. 74, 4867 (1995).
- Zeng et al. [1999] C. Zeng, P. L. Leath, and D. S. Fisher, Absence of two-dimensional bragg glasses, Phys. Rev. Lett. 82, 1935 (1999).
- Chudnovsky [1989] E. M. Chudnovsky, Hexatic vortex glass in disordered superconductors, Phys. Rev. B 40, 11355 (1989).
- Chudnovsky [1991a] E. M. Chudnovsky, Orientational and positional order in flux lattices of type-ii superconductors, Phys. Rev. B 43, 7831 (1991a).
- Toner [1991a] J. Toner, Orientational order in disordered superconductors, Phys. Rev. Lett. 66, 2523 (1991a).
- Chudnovsky [1991b] E. M. Chudnovsky, Comment on “orientational order in disordered superconductors.”, Phys. Rev. Lett. 67, 1809 (1991b).
- Toner [1991b] J. Toner, Toner replies, Phys. Rev. Lett. 67, 1810 (1991b).
- Singh et al. [2022] N. Singh, A. Sood, and R. Ganapathy, Observation of two-step melting on a sphere, Proceedings of the National Academy of Sciences 119, e2206470119 (2022).
- Stillinger [2008] F. H. Stillinger, Phase transitions in the Gaussian core system, The Journal of Chemical Physics 65, 3968 (2008), https://pubs.aip.org/aip/jcp/article-pdf/65/10/3968/11360037/3968_1_online.pdf .
- Prestipino et al. [2011] S. Prestipino, F. Saija, and P. V. Giaquinta, Hexatic phase in the two-dimensional gaussian-core model, Phys. Rev. Lett. 106, 235701 (2011).
- Frenkel and Smit [2001] D. Frenkel and B. Smit, Understanding molecular simulation: from algorithms to applications, Vol. 1 (Elsevier, 2001).
- Plimpton [1995] S. Plimpton, Fast parallel algorithms for short-range molecular dynamics, Journal of Computational Physics 117, 1 (1995).
- Gann et al. [1979] R. C. Gann, S. Chakravarty, and G. V. Chester, Monte carlo simulation of the classical two-dimensional one-component plasma, Phys. Rev. B 20, 326 (1979).
- Tipper [1991] J. C. Tipper, Fortran programs to construct the planar voronoi diagram, Computers & Geosciences 17, 597 (1991).
- Note [1] The three phases are clearly identified by the snapshots at three representatives s in the SM, Fig. S1(a-c).
- Note [2] The low- phase support significant hexatic order for our model parameters, while and the snapshots establish the amorphous and glassy nature. The -dependence of and is indicative of a crossover from a hexatic-glass to a hexatic-liquid, before the RP-system transits to a liquid at . However, the resolution of our simulation is inadequate for drawing a firm conclusion.
- [48] The URL for SM will appear here.
- Kuhn [1955] H. W. Kuhn, The hungarian method for the assignment problem, Naval research logistics quarterly 2, 83 (1955).
- Lau and Dasgupta [1989] M.-h. Lau and C. Dasgupta, Numerical investigation of the role of topological defects in the three-dimensional heisenberg transition, Phys. Rev. B 39, 7212 (1989).
- Levenberg [1944] K. Levenberg, A method for the solution of certain non-linear problems in least squares, Quarterly of applied mathematics 2, 164 (1944).
Supplementary material for ‘The effect of disorder on phases across two-dimensional thermal melting’
In order to support the key conclusions reported in the main manuscript, we include below additional results in this supplementary materials (SM).
I Model and Methods
For our study, we consider the Gaussian-core model in a 2D system with periodic boundary conditions, within which particles act via the following interaction. , with , and are the energy and length scales, respectively. We carry out molecular dynamics (MD) simulations of this model system, using LAMMPS, starting with a high temperature and cooling the system down to the desired temperature, as detailed in the main text. We use MD steps () with sampling time window of , which are recorded after sweeps of equilibration runs. The desired temperatures are maintained via the Berendsen thermostat. To ensure correct equilibration before taking statistics, we looked into the distribution of velocities of the particles, which assumes the form of an Maxwell-Boltzmann distribution in thermal equilibrium as well as independence of the temporal correlation of the observables on the time origin, i.e. , where is any temporal correlation defined between two time points and .
II Snapshots of particle trajectories
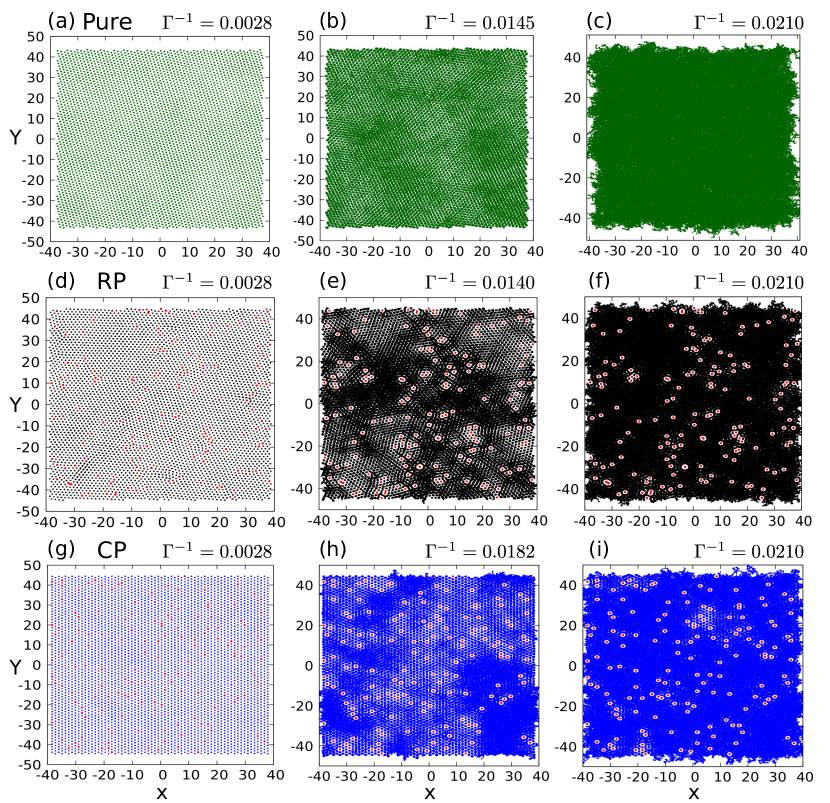
Here we plot the trajectories of particles during their equilibrium dynamics for the clean, RP- and CP-systems. Such motional signatures are displayed in Fig.S1 for three representative temperatures, one at low- in the solid phase (likely a hexatic glass in case of RP-system), at intermediate temperature (just before the system melts into an isotropic liquid (in hexatic phase in case of the clean system), and finally at a high temperature (deep into the liquid state).
The following points are worth mentioning:
The results for clean system in Fig. S1(a-c) are consistent with the KTHNY picture of 2D-melting in a pure systems. Note that the particles in a hexatic phase (Fig. S1(b)) preferentially move along the three principal directions of the underlying triangular lattice of the solid.
The lowest temperature phase for the RP-system in Fig. S1(d) represents a hexatic glass (or, an amorphous solid) in which the pinned impurities are marked red, with no apparent positional order. The snapshot at for RP-system in Fig.S1(e) appears inhomogeneous, where the mobile particles close to pinned particles delocalize more. Other particles tend to carry the motional signature of a hexatic phase in a clean system. The snapshot in Fig.S1(f) for RP-system for indicates that delocalization of mobile particles is nearly engulfed the whole space, except for small region surrounding the repulsive pinning centers.
The snapshots in the CP-system in Fig.S1(g-i) supports the notion of enhanced solidity in the following manner: The solidity is nearly perfect at low (solidity here is stronger than in clean system) – the impurities are pinned at commensurate locations of the underlying triangular lattice hold onto perfect solidity. Unlike for RP-system, here the regions rich in pinning centers anchors solidity around them, whereas, the regions relatively free of impurity feature incipient melting. This is seen from Fig.S1(h) for , i.e. at a temperature just below the onset of melting. As a result, the CP-system displays a local pockets of ‘remnant solidity’ around impurities. This remnant solidity weakens with , however, persists up to a large temperature (Fig.S1(i) at ). Note that the pinning centers maintain solid-like correlation at all .
The remnant solidity has discernible effects on the bond-orientational correlations , discussed in connection with Fig. 5(d) in the main manuscript, and is elaborated further in the later part of this SM.
III Identification of critical distances of defects unbinding
In fig. S2, we report the distribution of the separation of the two dislocations with equal and opposite Burger’s vector (here the two constitute a bound pair of dislocations). We denote this distribution by , where is the separation in question. At lower (), Fig. S2(a) show that in a clean system is sharply peaked at , the average inter-particle distance, with some additional weight for larger . In contrast, a weak yet very long tail in (Fig. S2(b)) is found for the RP-system at low-. This demonstrates the presence of unbound dislocations even at the lowest (), prohibiting true solidity. In contrast, the first peak in for CP-systems at low- in Fig. S2(g) is even sharper than the one in clean system (Fig. S2(a)). This reflects an enhanced solidity in the CP-system. The nature of the changes with , and when the dislocation pairs start unbinding, begins to develops smooth tails, see Fig. S2(b, e, h). At these ’s and beyond becomes qualitatively similar for clean, RP- and CP-systems. The distributions become nearly identical deep into the liquid phase (hight-) as shown in Fig. S2(c, f, i).
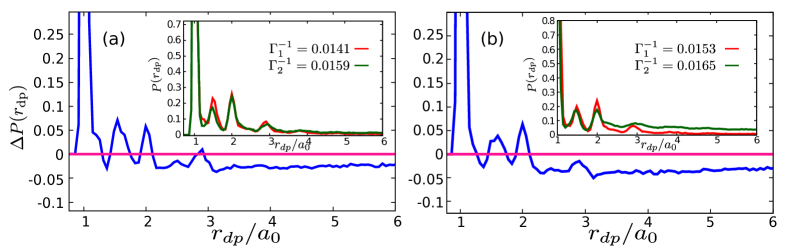
Fig. S3 supplements the Fig. 3(d) in the main text, and illustrates the insensitivity of on the chosen -values for its extraction, as long as those temperatures are close to . We plot in Fig. S3 the difference of for two different pair of temperatures around the , while the corresponding distributions are shown as the inset. Both plots yield – the same value obtained in the main test for a yet another pair of ’s.
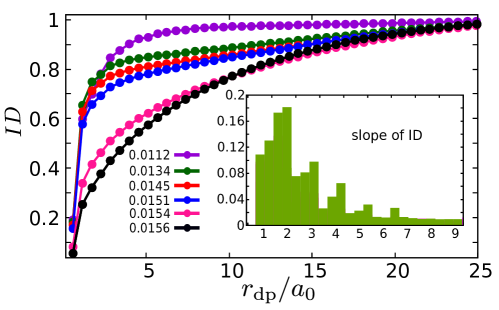
An alternative extraction of for the pure system, employing differently the same concept as above is the following: In Fig. S4, we plot the integrated distribution (ID) of for various ’s. The traces of ID shows a threshold behaviour marking the solid-to-hexatic transition. ID comes up very steeply for the lower ’s corresponding the solid phase (as inerred from the Fig. 2 of the main text), whereas the rise of ID becomes distinctively gradual for the two higher ’s representing a hexatic phase. In the inset, we plot the distribution of the change of the slope of ID-traces in the solid phase, which attains the peak-value for .
We also studied the thermal evolution of the distribution of the disclination pair () and we present our results in fig .S5 for three representative ’s. This distribution features a single peak at for up to , and identify a second peak for larger ’s at . Thus, we conclude that .
IV Correlations:
The pair correlation is given by
| (1) |
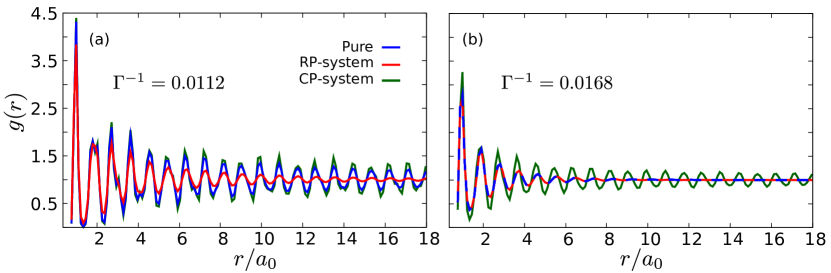
with . We present the low- behavior of in Fig. S6(a). Its evolution in the clean (blue) and CP (green) systems is nearly identical, consistent with the findings of Fig. 2(a) and Fig. 2(b) in the main text. The for the RP-system exhibit damped modulations which prohibits solidity even at low temperatures. However, these damped modulations are long-ranged than what’s expected in a liquid. Fig. S6(b) shows for large where all three systems turns into ‘liquid.’ A role reversal occurs – for clean and RP-system overlap this time, yielding a liquid-like behavior, while the long-range modulations for CP-systems survives implying ‘remnant solidity’ as discussed already in other context.
The -dependence of orientational correlations in the clean system is shown in Fig. S7 implies that remains nearly independent of for up to . It shows a power-law decay , in the hexatic phase for (exponents are listed in Fig. S7). Finally, features an exponential decay in the liquid phase for . We find, e.g., , , , while and .
In order to address ‘remnant solidity’ in the CP-system at high , we plot the two separate components of in Fig. S8. Once component estimates the contribution of (dotted trace) only for the particles which lie within a distance of from pinned particles. The other component measures (solid trace) contributed by all other particles. We present data of such two contributions for two values of (both in the high- liquid phase). The message from Fig. S8 is clear – the particles close to the pinning centers at commensurate locations of a perfect crystal anchor the crystallinity around them, which is reflected in the corresponding which remains nearly constant at large like in a solid. The particles further away from the pinned particles, on the other hand, expectedly behaves like a liquid. Thus, it is the particles near pinning centers which contribute to the ‘remnant solidity.’ As such, that pinned particles must show a perfect solid like correlation by construction!