XX, YY \workinggroupXX/YY \icwg
UNDERSTANDING THE IMPACTS OF CROP DIVERSIFICATION IN THE CONTEXT OF CLIMATE CHANGE: A MACHINE LEARNING APPROACH
Abstract
The concept of sustainable intensification in agriculture necessitates the implementation of management practices that prioritize sustainability without compromising productivity. However, the effects of such practices are known to depend on environmental conditions, and are therefore expected to change as a result of a changing climate. We study the impact of crop diversification on productivity in the context of climate change. We leverage heterogeneous Earth Observation data and contribute a data-driven approach based on causal machine learning for understanding how crop diversification impacts may change in the future. We apply this method to the country of Cyprus throughout a 4-year period. We find that, on average, crop diversification significantly benefited the net primary productivity of crops, increasing it by . The effect generally synergized well with higher maximum temperatures and lower soil moistures. In a warmer and more drought-prone climate, we conclude that crop diversification exhibits promising adaptation potential and is thus a sensible policy choice with regards to agricultural productivity for present and future.
keywords:
Artificial Intelligence, Machine Learning, Causality, Earth Observation, Agriculture, Climate Change.1 INTRODUCTION
Globally, agriculture faces the unique challenge of reconciling a growing demand for its products with the substantial pressures stemming from climate change and environmental deterioration. As such, the sustainable intensification of agriculture [Tilman et al., 2011] calls for the application of management practices that are sustainable and can adapt to climate change without sacrificing productivity. It encompasses agricultural, social, and environmental dimensions of farming, including its profitability and resilience.
As a popular sustainable practice, crop diversification (i.e., cultivating different crops in space and/or time) has been studied extensively, with various positive consequences reported [Lin, 2011]. At the same time, the effects of crop diversification have been found to vary across different environmental conditions [Beillouin et al., 2021]. When analyzing the impacts of crop diversification, it is thus desirable to employ tools that allow for the impacts to depend on relevant environmental variables, such as temperature and soil moisture. An indirect benefit of doing this, is that we may also study questions relating to climate change: will the effects of crop diversification change in a warmer, more drought-prone planet?
With the volume and quality of Earth Observation (EO) data rapidly increasing, data-driven assessments of crop diversification impacts can benefit in terms of scale and reliability [Giannarakis et al., 2022b]. Earth Observations are frequently used to engineer large-scale datasets featuring diverse information on agriculture, climate, society and economy [Choumos et al., 2022, Drivas et al., 2022]. Artificial Intelligence (AI) techniques including Machine Learning (ML) are used to analyze such datasets, extract insights, and inform stakeholders [Sitokonstantinou et al., 2023, Sitokonstantinou et al., 2020]. Since impact assessment studies are fundamentally concerned with cause and effect, researchers have been recently using causal machine learning techniques to valorize EO data [Jerzak et al., 2023, Giannarakis et al., 2022a, Tsoumas et al., 2023, Nanushi et al., 2022] while avoiding the caveats of correlation based ML methods [Pearl, 2009]. Even if geospatial data provide ideal information for such analyses, the application of causal ML to tackle questions relating to climate change remains underexplored.
In this work, we propose a causal machine learning approach for investigating the impacts of crop diversification in the context of climate change. In particular, we use geospatial data to train a machine learning model that estimates the effect of crop diversification on productivity as a function of multiple environmental variables. We focus on the relationship of the effects with temperature and soil moisture, and in that way draw insights on the future performance of crop diversification in a warmer, more drought-prone planet.
2 DATASET AND METHODOLOGY
We focus on the country of Cyprus from 2019 to 2022 (4-year period). We use the annual MODIS Net Primary Productivity (NPP) product (MOD17A3HGF v006, gridded at 500m) that captures the difference between carbon sequestrated by crops during photosynthesis and carbon released during respiration (in kg C / m2 / year) [Running and Zhao, 2019]. We then use a dataset with all agricultural fields of Cyprus and their crop type from the Cypriot Land Parcel Identification System (LPIS). For each MODIS grid cell and crop type, we compute an annual “crop abundance” feature by calculating the percentage area of the cell that was covered by the crop type, and then calculate a “crop diversification” value equal to the number of different crops with non-zero abundance in it. We note that, in that sense, crop diversification is defined on a spatial basis. Similar work can be done by considering crop diversification in a temporal context, akin to crop rotation analyses [Gan et al., 2015].
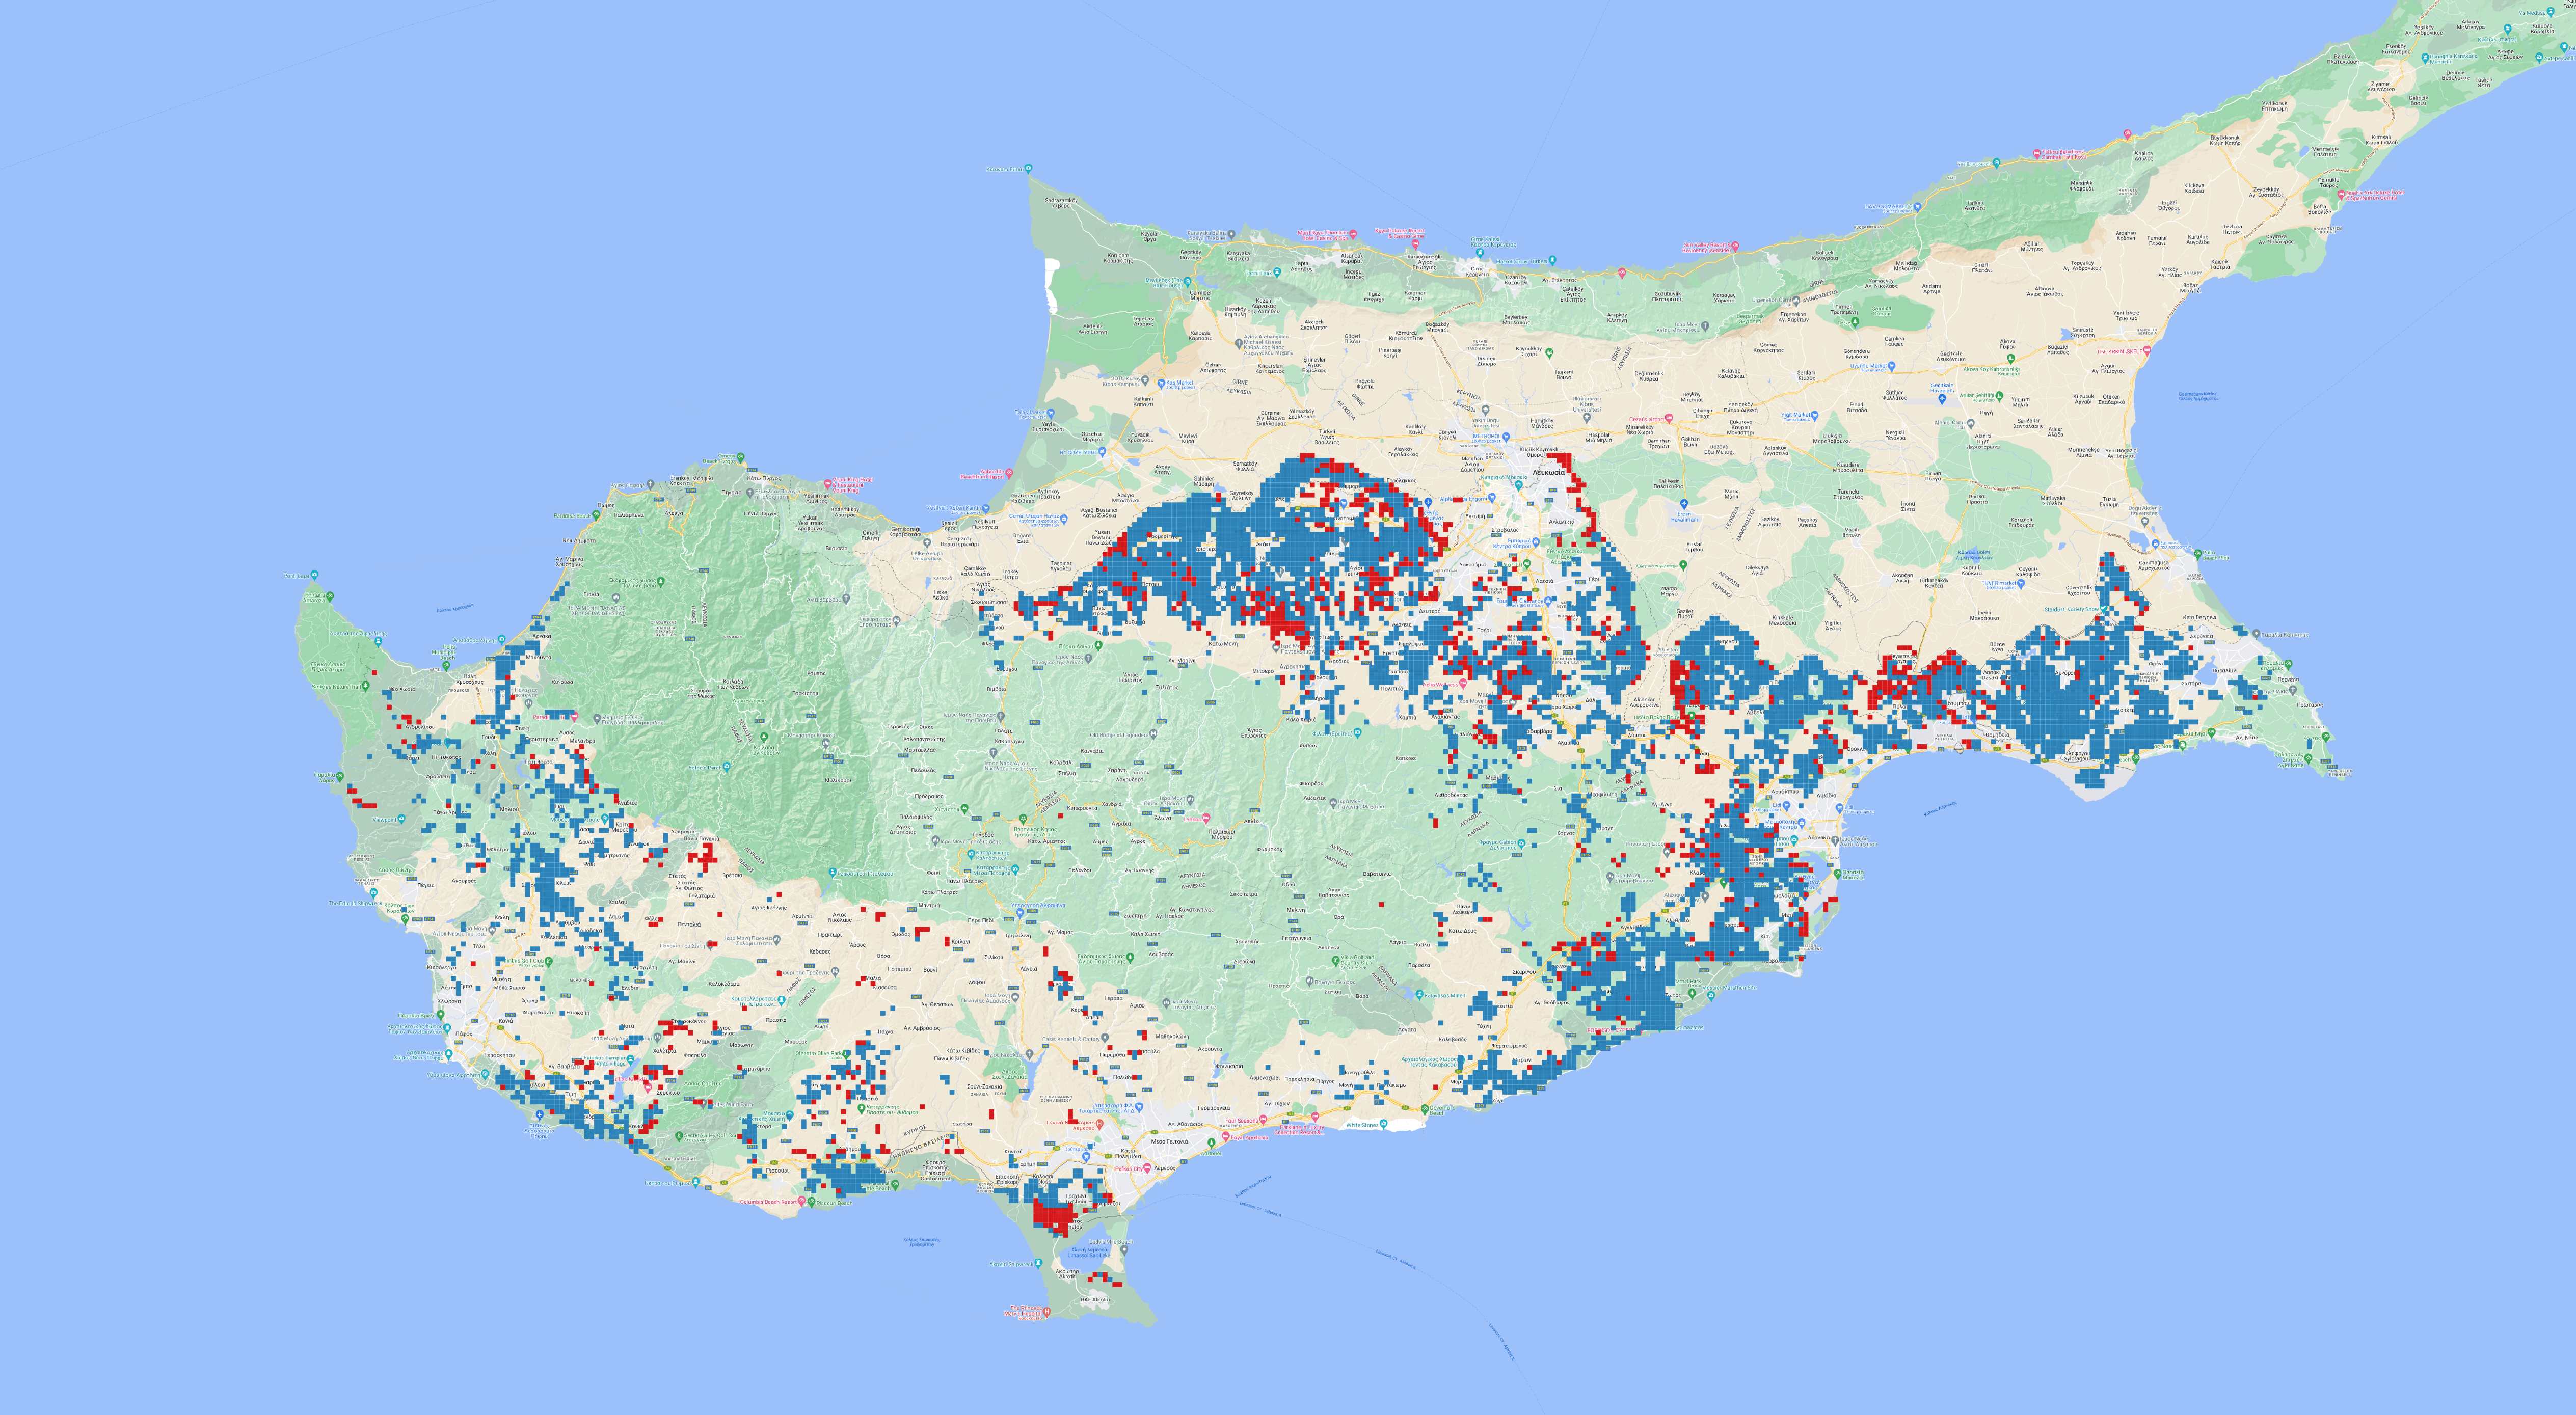
We join this dataset with climate [Abatzoglou et al., 2018] and soil information [Karydas and Panagos, 2016] that we downscale to the MODIS grid cell level (see Table 1). We finally temporally aggregate all features to obtain an average value for each cell throughout the 4-year study period, and binarize the crop diversification variable at its median value. Figure 1 contains the binary crop diversification values over the agricultural areas of Cyprus. Bright grid cells indicate the presence of crop diversification on the final dataset (value greater than median), while dark grid cells indicate the absence of crop diversification (value smaller than median).
| Id | Variable Description | Unit |
|---|---|---|
| ws | Wind speed | m/s |
| ppt | Precipitation | mm |
| q | Runoff | mm |
| def | Climate Water Deficit | mm |
| srad | Downward Surface Shortwave Radiation | W/m2 |
| tmin | Minimum Temperature | °C |
| tmax | Maximum Temperature | °C |
| soilm | Soil Moisture | mm |
| soile | Soil Erosibility | unitless |
In the context of climate change, we approach the task of comprehending the influence of crop diversification on Net Primary Productivity (NPP) as a Conditional Average Treatment Effect (CATE) estimation task. Using the Potential Outcomes [Imbens and Rubin, 2015] framework, let denote the value of a random variable if we were to treat a unit with a treatment . Given a vector of features describing the units, we want to learn the CATE function:
| (1) |
We use Double Machine Learning (DML) [Chernozhukov et al., 2018] to learn from data, where is a binary variable for crop diversification, is the NPP, and are the environmental parameters of Table 1. DML captures the data generating process using the Partially Linear Model [Robinson, 1988]:
| (2) | ||||
| (3) |
where is the CATE, and are arbitrary functions. Notably, (3) monitors confounding as features affect both the treatment and outcome . The CATE is learned though a two-stage estimation process. In the first stage, the outcome and treatment are independently predicted from features , using any ML model. In the second and final stage, is estimated by predicting the residuals of the first model from the residuals of the second model. In the context of the Partially Linear Model shown in (2) and (3), this translates to solving the following optimization problem:
| (4) |
Here, is the search space of CATE functions, are the residuals of the regression, and are the residuals of the regression. The linearity assumption imposed by (2) can be relaxed, allowing for non-parametric CATE estimation.
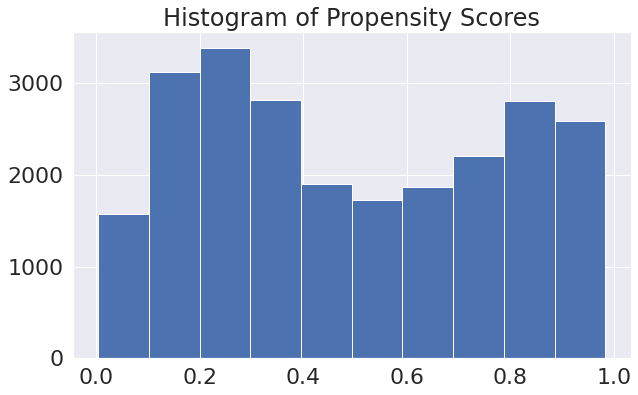
Before applying Double Machine Learning, we standardize the feature vector by subtracting the mean and dividing by the standard deviation of each variable. We also fit a Gradient Boosted Propensity Model [Chen et al., 2020] to estimate the propensity score of each sample, and filter extreme scores ( or ) to aid the overlap between the treatment and control groups [Imbens and Rubin, 2015]. The distribution of propensity scores prior to filtering is shown in Figure 2. After filtering, there are samples left, out of which belong to the treated (crop diversification) group and are part of the control (no crop diversification) group.
We split the dataset into train () and test () sets to fit the first stage DML models. We carry out a 3-fold cross validation on the train set and separately model and . A Random Forest model was selected for both the regression () and classification () tasks, outperforming Lasso regression, Logistic regression, and Gradient Boosting models. To diagnose overfitting, we then use the held-out test set to assess the predictive performance ( for regression, F-1 score for classification) of the trained models and compare it to the performance of the train test. Table 2 contains the results of the first stage models.
| Task | Train | Test |
|---|---|---|
The predictive performance on the train and test sets were comparable for both first stage DML tasks indicating the lack of overfitting. Having selected the Random Forest models through this procedure, we proceed to the final stage of DML, where we predict the residuals of from the residuals of . To retain model interpretability, we fit the Linear DML model shown in equations (2) and (3).
3 EVALUATION AND RESULTS
A significant Average Treatment Effect (ATE) of crop diversification on NPP is found (point estimate = , 95% CI = ). This indicates that, on average, diversifying crops had a positive impact on their primary productivity (i.e., it increased it by kg C / m2 / year). Interpreted in the context of the mean net primary productivity (which was equal to kg C / m2 / year), this translates to an estimated average increase of due to the implementation of a crop diversification practice on a cell over a single year. The effect is both positive and statistically significant (p-value ), corroborating growing evidence on the productivity benefits of the practice [Beillouin et al., 2019].
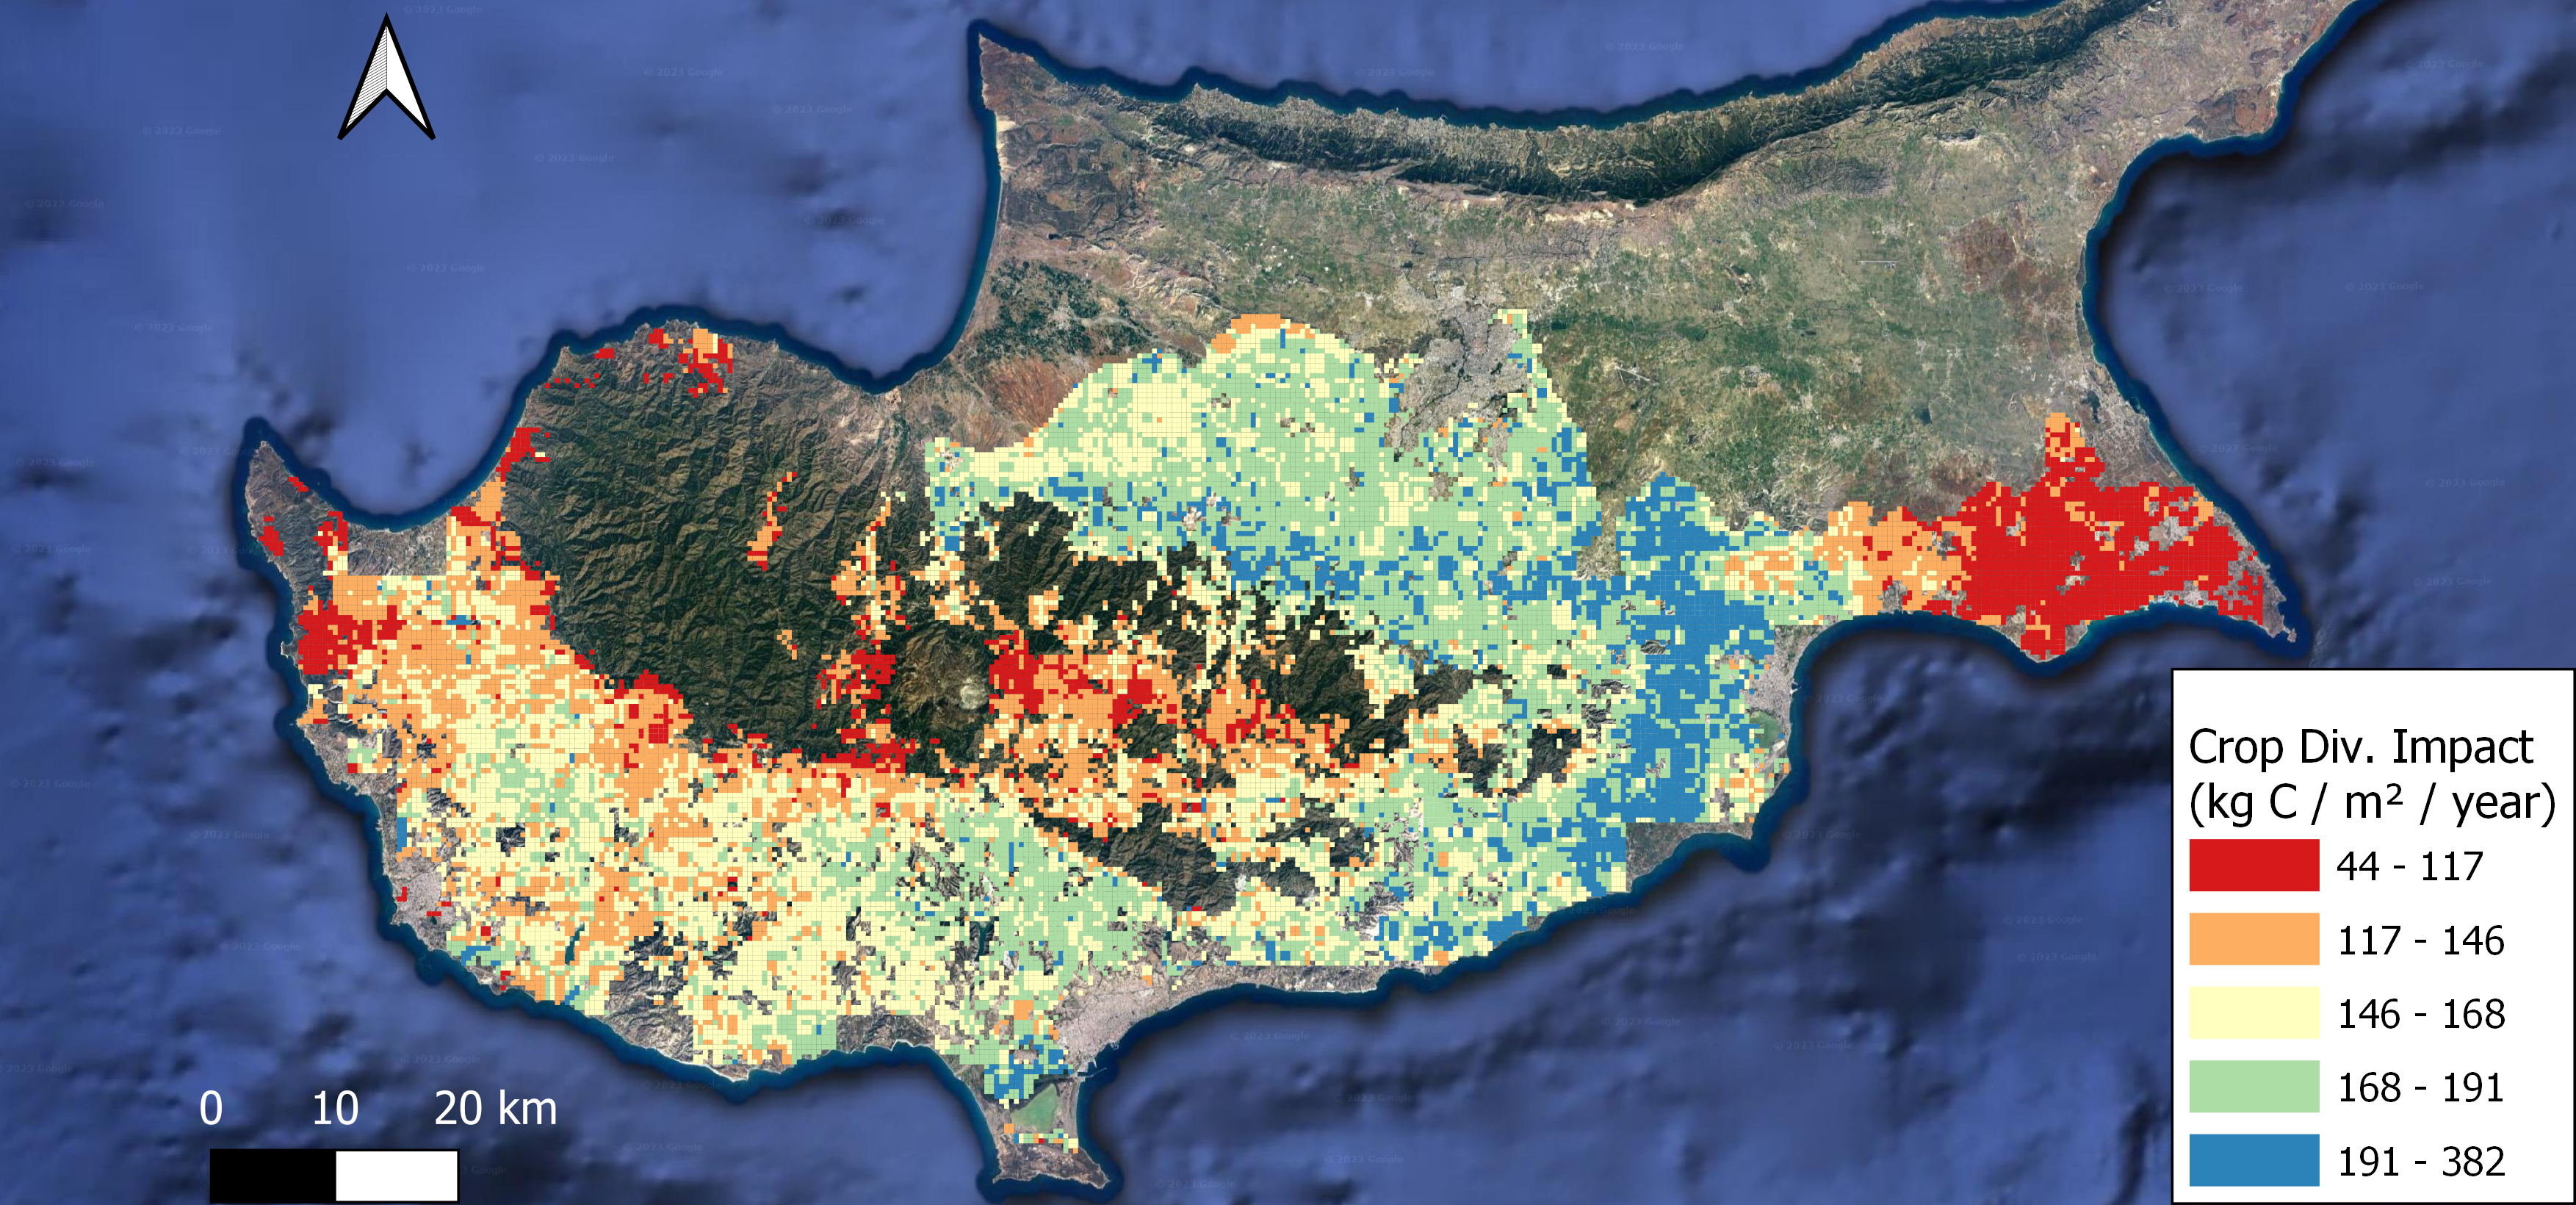
Figure 3 shows all CATE estimates (i.e., expected crop diversification impacts) provided by the trained model. As expected, spatial proximity coincides with similar crop diversification impacts [Tobler, 1970]. The geospatial information featured in Figure 3 can be exploited for targeted agricultural policy making, e.g. by incentivizing the implementation of crop diversification on the basis of its predicted impact.
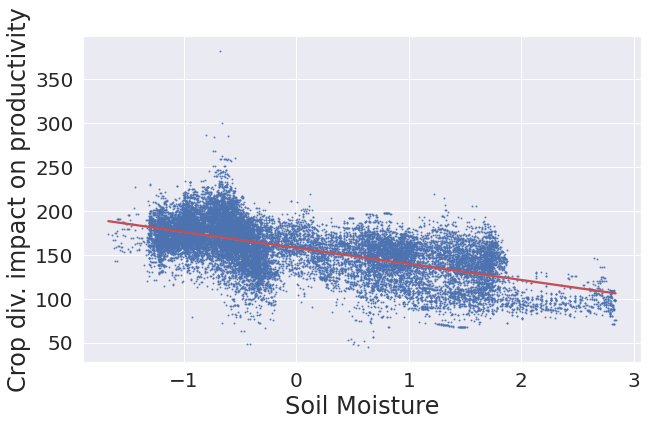
The relationship between maximum temperature, soil moisture and crop diversification impacts on NPP is seen in Figures 4 and 5. We observe a linear trend for both relationships, albeit of opposite slope; the impact of diversification on productivity appears to increase with temperature and decrease with soil moisture. Because both maximum temperature and soil moisture variables are standardized, the horizontal axis unit is the number of standard deviations away from the variable mean. Table 3 features these statistics for both variables.
| Variable | Mean | Std. Deviation | Unit |
|---|---|---|---|
| Maximum temperature | °C | ||
| Soil moisture | mm |
Examining Figure 4, we are therefore able to study crop diversification impacts in the context of climate change. Due to the increasing trend found, we can infer that an increase in maximum temperature by °C (i.e., by standard deviation) will generally lead to higher crop diversification impacts. We note that an increase of this magnitude is associated with low GHG emissions scenarios (RCP1.9, RCP2.6). For higher emission, less optimistic scenarios that lead to greater maximum temperature values the extrapolation needed is larger. In this case, while the overall outlook for future crop diversification impacts remains positive, more uncertainty is introduced.

Similar insights are derived from Figure 5, by interpreting the relation between soil moisture and crop diversification impacts in climate change terms. An increase in maximum temperature will lead to dryer soils that are associated with higher crop diversification impacts on productivity. The decreasing trend of crop diversification impacts as a function of soil moisture is stable for more than 1 standard deviation to the left of the mean. This remark provides confidence on the robustness of crop diversification (with regards to productivity) against dryer environmental conditions that may be encountered in the future.
The DML model also provides uncertainty estimates on the grid cell level CATE predictions of crop diversification impacts in the form of standard errors. Figure 6 shows the standard error that corresponds to each CATE estimate. We remark that compared to the average crop diversification effect of kg C / m2 / year, standard error values are small, ranging from to kg C / m2 / year for most areas. This translates to statistically significant individual CATE estimates, with of the grid cells having a p-value .
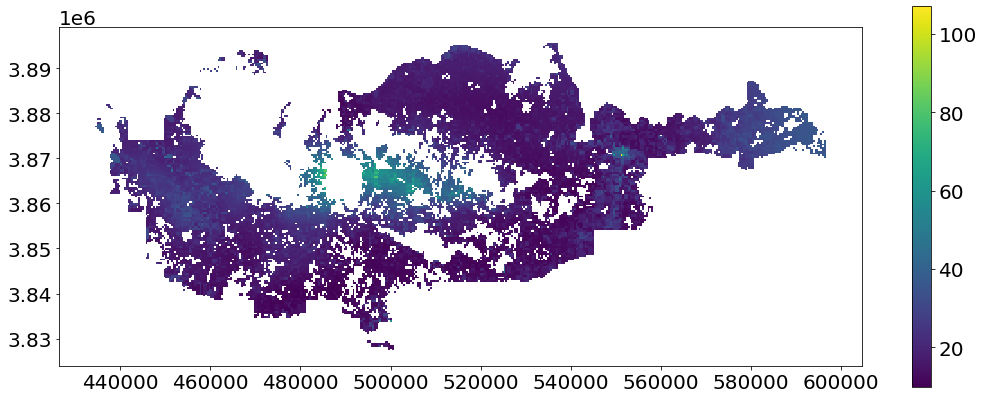
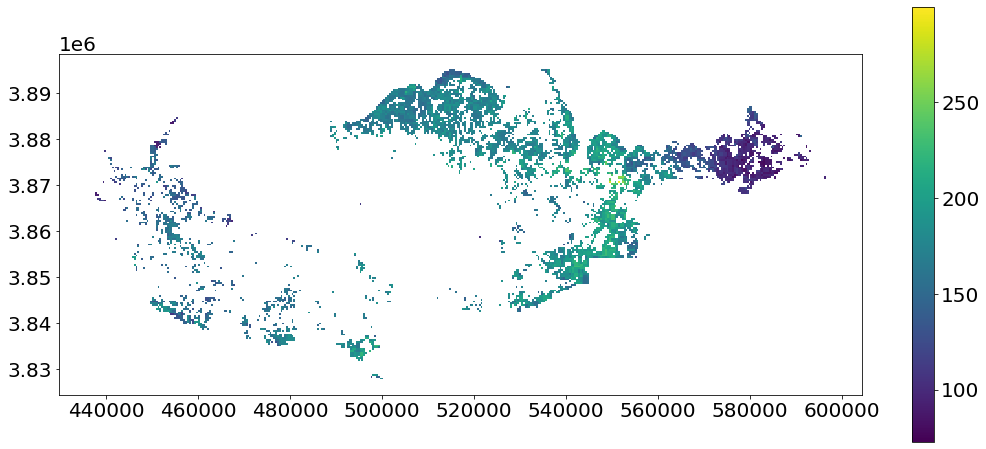
It should be noted that for visualization purposes, we so far chose to visualize CATE results throughout the entire Cyprus area over which we had data (Figures 3 and 6). For sensible agricultural policy making, we should exclusively focus on agricultural areas and derive insights based on them. Here we define “agricultural areas” as the grid cells whose area is covered by agricultural parcels by at least . Figure 7 visualizes those areas, and reports the corresponding crop diversification impacts over them. The distribution of the estimated impacts does not differ significantly from the one reported across the entire country in Figure 3.
The trained Double Machine Learning model can also be interpreted using explainable AI (XAI) methods in order to reveal the conditions that determine the magnitude of crop diversification impacts. Here, we are using a tree interpreter [Battocchi et al., 2019] to reveal the environmental factors (Table 1) that are driving the estimated effect magnitudes (Figure 8). Soil erosibility is found to be the most influential environmental parameter for crop diversification impacts, followed by soil moisture. In particular, higher soil erosibility conditions, combined with lower soil moisture lead to the highest diversification productivity impacts, while lower soil erosibility combined with high soil moisture lead to lower crop diversification impacts.

4 CONCLUSIONS
This study investigated the effect of diversifying crops in space on the net primary productivity of land. We combined satellite remote sensing data with geo-referenced crop type maps to engineer a heterogeneous Earth Observation dataset. We then trained a Double Machine Learning model that is able to estimate the impacts of crop diversification on productivity, as a function of environmental conditions. The trained model provided robust uncertainty estimates, and was analyzed with an explainable AI method to unveil the environmental drivers of crop diversification performance.
A statistically significant Average Treatment Effect of crop diversification on net primary productivity was found, that was further modified by both maximum temperature and soil moisture. Results were robust from the statistical perspective, as indicated by small standard errors of estimates, and by the overwhelming majority of estimates () having a p-value smaller than .
Overall, our work contributes to the growing literature on the effects of crop diversification across multiple dimensions [Feliciano, 2019, Louhichi et al., 2017, Kumar et al., 2019]. While the average effect of crop diversification on NPP is found to be both positive and statistically significant, we note that analogous works in other areas of the world do not report similar productivity gains due to diversification, either of crops [Giannarakis et al., 2022b] or of biodiversity [Dee et al., 2023]. In the context of the European Union’s Common Agricultural Policy, this remark highlights the importance of targeted policy making, as a crop diversification measure might be significantly positive for ecosystem productivity in one area, and fail to deliver any tangible benefits in another.
Importantly, our approach also allows for the interpretation of crop diversification in the context of a changing climate. From the perspective of climate change adaptation in particular, the impact of crop diversification on productivity appears to benefit from the imminent increase in maximum temperature and decrease in soil moisture. We thus conclude that encouraging the diversification of crops in Cyprus is a sensible policy choice as far as productivity is concerned, for both present and future. Enriching the analysis with other environmental, social, and economic parameters to obtain a more holistic view of crop diversification impacts towards the sustainable intensification of agriculture is future work.
5 ACKNOWLEDGEMENTS
We acknowledge the “EXCELSIOR”: ERATOSTHENES: Excellence Research Centre for Earth Surveillance and Space Based Monitoring of the Environment H2020 Widespread Teaming project (www.excelsior2020.eu). The “EXCELSIOR” project has received funding from the European Union’s Horizon 2020 research and innovation programme under Grant Agreement No 857510, from the Government of the Republic of Cyprus through the Directorate General for the European Programmes, Coordination and Development and the Cyprus University of Technology. We thank the Cyprus Agricultural Payments Organization (CAPO) for providing the LPIS data.
References
- [Abatzoglou et al., 2018] Abatzoglou, J. T., Dobrowski, S. Z., Parks, S. A., Hegewisch, K. C., 2018. TerraClimate, a high-resolution global dataset of monthly climate and climatic water balance from 1958–2015. Scientific data, 5(1), 1–12.
- [Battocchi et al., 2019] Battocchi, K., Dillon, E., Hei, M., Lewis, G., Oka, P., Oprescu, M., Syrgkanis, V., 2019. EconML: A Python package for ML-Based heterogeneous treatment effects estimation. Version 0.13.
- [Beillouin et al., 2019] Beillouin, D., Ben-Ari, T., Makowski, D., 2019. Evidence map of crop diversification strategies at the global scale. Environmental Research Letters, 14(12), 123001.
- [Beillouin et al., 2021] Beillouin, D., Ben-Ari, T., Malézieux, E., Seufert, V., Makowski, D., 2021. Positive but variable effects of crop diversification on biodiversity and ecosystem services. Global Change Biology, 27(19), 4697–4710.
- [Chen et al., 2020] Chen, H., Harinen, T., Lee, J.-Y., Yung, M., Zhao, Z., 2020. Causalml: Python package for causal machine learning. arXiv preprint arXiv:2002.11631.
- [Chernozhukov et al., 2018] Chernozhukov, V., Chetverikov, D., Demirer, M., Duflo, E., Hansen, C., Newey, W., Robins, J., 2018. Double/debiased machine learning for treatment and structural parameters.
- [Choumos et al., 2022] Choumos, G., Koukos, A., Sitokonstantinou, V., Kontoes, C., 2022. Towards space-to-ground data availability for agriculture monitoring. 2022 IEEE 14th Image, Video, and Multidimensional Signal Processing Workshop (IVMSP), IEEE, 1–5.
- [Dee et al., 2023] Dee, L. E., Ferraro, P. J., Severen, C. N., Kimmel, K. A., Borer, E. T., Byrnes, J. E., Clark, A. T., Hautier, Y., Hector, A., Raynaud, X. et al., 2023. Clarifying the effect of biodiversity on productivity in natural ecosystems with longitudinal data and methods for causal inference. Nature Communications, 14(1), 2607.
- [Drivas et al., 2022] Drivas, T., Sitokonstantinou, V., Tsardanidis, I., Koukos, A., Kontoes, C., Karathanassi, V., 2022. A data cube of big satellite image time-series for agriculture monitoring. 2022 IEEE 14th Image, Video, and Multidimensional Signal Processing Workshop (IVMSP), IEEE, 1–5.
- [Feliciano, 2019] Feliciano, D., 2019. A review on the contribution of crop diversification to Sustainable Development Goal 1 “No poverty” in different world regions. Sustainable development, 27(4), 795–808.
- [Gan et al., 2015] Gan, Y., Hamel, C., O’Donovan, J. T., Cutforth, H., Zentner, R. P., Campbell, C. A., Niu, Y., Poppy, L., 2015. Diversifying crop rotations with pulses enhances system productivity. Scientific reports, 5(1), 14625.
- [Giannarakis et al., 2022a] Giannarakis, G., Sitokonstantinou, V., Lorilla, R. S., Kontoes, C., 2022a. Personalizing sustainable agriculture with causal machine learning. arXiv preprint arXiv:2211.03179.
- [Giannarakis et al., 2022b] Giannarakis, G., Sitokonstantinou, V., Lorilla, R. S., Kontoes, C., 2022b. Towards assessing agricultural land suitability with causal machine learning. Proceedings of the IEEE/CVF Conference on Computer Vision and Pattern Recognition, 1442–1452.
- [Imbens and Rubin, 2015] Imbens, G. W., Rubin, D. B., 2015. Causal inference in statistics, social, and biomedical sciences. Cambridge University Press.
- [Jerzak et al., 2023] Jerzak, C. T., Johansson, F., Daoud, A., 2023. Integrating earth observation data into causal inference: challenges and opportunities. arXiv preprint arXiv:2301.12985.
- [Karydas and Panagos, 2016] Karydas, C. G., Panagos, P., 2016. Modelling monthly soil losses and sediment yields in Cyprus. International Journal of Digital Earth, 9(8), 766–787.
- [Kumar et al., 2019] Kumar, N., Nath, C., Hazra, K., Das, K., Venkatesh, M., Singh, M., Singh, S., Praharaj, C., Singh, N., 2019. Impact of zero-till residue management and crop diversification with legumes on soil aggregation and carbon sequestration. Soil and Tillage Research, 189, 158–167.
- [Lin, 2011] Lin, B. B., 2011. Resilience in agriculture through crop diversification: adaptive management for environmental change. BioScience, 61(3), 183–193.
- [Louhichi et al., 2017] Louhichi, K., Ciaian, P., Espinosa, M., Colen, L., Perni, A., y Paloma, S. G., 2017. Does the crop diversification measure impact EU farmers’ decisions? An assessment using an Individual Farm Model for CAP Analysis (IFM-CAP). Land Use Policy, 66, 250–264.
- [Nanushi et al., 2022] Nanushi, O., Sitokonstantinou, V., Tsoumas, I., Kontoes, C., 2022. Pest presence prediction using interpretable machine learning. 2022 IEEE 14th Image, Video, and Multidimensional Signal Processing Workshop (IVMSP), IEEE, 1–5.
- [Pearl, 2009] Pearl, J., 2009. Causality. Cambridge university press.
- [Robinson, 1988] Robinson, P. M., 1988. Root-N-consistent semiparametric regression. Econometrica: Journal of the Econometric Society, 931–954.
- [Running and Zhao, 2019] Running, S., Zhao, M., 2019. Mod17a3hgf modis/terra net primary production gap-filled yearly l4 global 500 m sin grid v006. NASA EOSDIS Land Processes DAAC, 6.
- [Sitokonstantinou et al., 2020] Sitokonstantinou, V., Drivas, T., Koukos, A., Papoutsis, I., Kontoes, C., 2020. Scalable distributed random forest classification for paddy rice mapping. zenodo. org, 11.
- [Sitokonstantinou et al., 2023] Sitokonstantinou, V., Koukos, A., Tsoumas, I., Bartsotas, N. S., Kontoes, C., Karathanassi, V., 2023. Fuzzy clustering for the within-season estimation of cotton phenology. Plos one, 18(3), e0282364.
- [Tilman et al., 2011] Tilman, D., Balzer, C., Hill, J., Befort, B. L., 2011. Global food demand and the sustainable intensification of agriculture. Proceedings of the national academy of sciences, 108(50), 20260–20264.
- [Tobler, 1970] Tobler, W. R., 1970. A computer movie simulating urban growth in the Detroit region. Economic geography, 46(sup1), 234–240.
- [Tsoumas et al., 2023] Tsoumas, I., Giannarakis, G., Sitokonstantinou, V., Koukos, A., Loka, D., Bartsotas, N., Kontoes, C., Athanasiadis, I., 2023. Evaluating digital agriculture recommendations with causal inference. Proceedings of the AAAI Conference on Artificial Intelligence, 37(12), 14514–14522.