Spatial-spectral mapping to prepare the frequency entangled qudits
Abstract
Entangled qudits, the high-dimensional entangled states, play an important role in the study of quantum information. How to prepare entangled qudits in an efficient and easy-to-operate manner is still a challenge in quantum technology. Here, we demonstrate a method to engineer frequency entangled qudits in a spontaneous parametric downconversion process. The proposal employs an angle-dependent phase-matching condition in a nonlinear crystal, which forms a classical-quantum mapping between the spatial (pump) and spectral (biphotons) degrees of freedom. In particular, the pump profile is separated into several bins in the spatial domain, and thus shapes the down-converted biphotons into discrete frequency modes in the joint spectral space. Our approach provides a feasible and efficient method to prepare a high-dimensional frequency entangled state. As an experimental demonstration, we generate a three-dimensional entangled state by using a homemade variable slit mask.
I Introduction
Quantum entangled states are serving as essential resources in quantum technologies, e.g., quantum computation Knill2001 , communications gisin2007quantum , and measurements clerk2010introduction . The high-dimensional entangled states (or named as entangled qudits with a dimension number of ) demonstrate significant progress in the aforementioned quantum applications Erhard2020 . In quantum communication, a high-dimensional quantum state could carry more information, thus increasing the channel capacities and also the noise resilience Chen2021 ; dada2011experimental . In quantum computation, entangled qudits not only have a larger state space to store and process information but also have the ability to do multiple control operations simultaneously Lu2019 . These features are significant in the reduction of the circuit complexity and the acceleration of the algorithm Reimer2018 . In quantum measurement, a strong reduction in the number of operations can be achieved by using qudit systems satisfying a certain relation between their dimensionality and topology Giovannetti2004 . In addition, entangled qudits are crucial for studies of fundamental quantum mechanics, i.e., the non-locality in high-dimensional quantum systems dada2011experimental .
The high-dimensional entangled state could be realized in various degrees of freedom of the photon, including time LagoRivera2021 , frequency Kues2017 ; Chen2021 ; Imany2018 , hybrid time-frequency modes Reimer2018 ; Xiang2020 , paths Lu2020 , and orbital angular momentum (OAM) liu2018coherent . Regarding the time-frequency entangled qudits, they are intrinsically suitable for long-distance transmission in optical fibers, waveguides, as well as free space. Therefore, it has attracted much attention in recent years Chen2021 ; Lingaraju:19 ; PhysRevLett.123.123603 ; Bernhard2013 ; XieZhongShresthaEtAl2015 ; KuesReimerRoztockiEtAl2017 ; Jin2016QST ; Jin2021APLphoton ; Lixiaoying2020APL ; Morrison2022APL ; Yang2020 .
Generally speaking, the previous methods for the generation of the frequency-entangled qudits could be classified into four categories: (1) using a linear pulse shaper, which may include two optical gratings and one spatial light modulator (SLM) Bernhard2013 ; Liu2022SM ; (2) utilizing a nonlinear cavity, such as a Fabry-Perot cavity or ring-cavity XieZhongShresthaEtAl2015 ; KuesReimerRoztockiEtAl2017 ; (3) employing an interferometer, for example, the spectrally resolved Hong-Ou-Mandel(HOM) interferometer Jin2016QST , quantum optical synthesis in a dual pump interferometer Jin2021APLphoton , or a nonlinear interferometer in fibers Lixiaoying2020APL ; (4) developing quantum state engineering in a nonlinear material, such as a customized poling nonlinear crystal Morrison2022APL . All the above schemes require sophisticated modulation devices or specially designed crystals, which may lead to a large loss or high cost during the preparation. Therefore, it’s meaningful to explore one simple and efficient method to generate a high-dimensional frequency entangled state.
Here, we propose and experimentally demonstrate a feasible method to generate frequency-entangled qudits using a -barium borate (BBO) crystal. This is possible by employing two improvements in our regime. On the one hand, we employ an angle-dependent phase-matching (also called birefringent phase-matching) condition of the BBO crystal, to form a classical-quantum mapping between the spatial (pump) and spectral (photon pairs) degrees of freedom. On the other hand, we build a homemade spatial mask, which could make a spatial modulation on the pump profile. For example, it could separate the pump into several spatial bins and thus on-demand control the entangled spectral modes in the joint spectral space. The proposed regime is of great feasibility and provides one efficient way to prepare the high-dimensional entangled qubit in the frequency domain.
II Theory and simulation
The biphoton state generated in a spontaneous parametric down conversion (SPDC) process can be expressed asMosley2008PRL :
| (1) |
where the subscripts and represent the signal and idler photon, respectively; is the angular frequency; is the creation operator; is the joint spectral amplitude (JSA) of the biphoton, where is the incident angle of the pump, i.e., the angle between the pump laser and the optical axis of the crystal (See Fig. 1 (e)). is the product of the pump-envelope function and the phase-matching function Mosley2008PRL , i.e.,
| (2) |
The widely used pump-envelope function is a Gaussian function, i.e.,
| (3) |
where and are the central frequency and bandwidth of the pump, respectively. The phase-matching function in a nonlinear crystal can be expressed as Mosley2008PRL
| (4) |
where is the crystal length; is the wave vector difference between the signal, idler, and pump, respectively. The wave vector is a function of the incident angle .
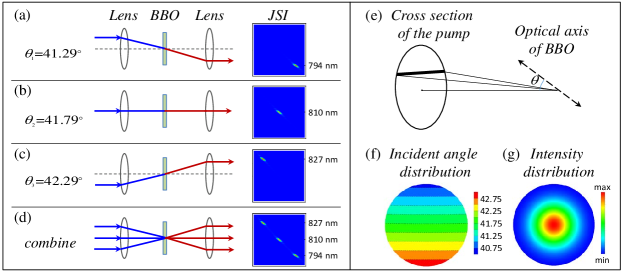
The principle for generating qudits is shown in Fig. 1. Thanks to the angle phase-matching (also called birefringent phase-matching) condition, the different incident angle corresponds to the different discrete spectral mode in the joint spectral intensity (JSI) . For example, Fig. 1 (a-c) shows the cases of , , and , respectively. The corresponding central wavelengths are 794 nm (827 nm), 810 nm (810 nm), and 827 nm (794 nm) for the signal (idler) photon, respectively. If we shape the pump profile to spatial rays, the output state will become a separate but superposed -dimensional entangled state:
| (5) |
Here, is the coefficient that depends on both the spatial pump beam and JSA (JSI). In this case, the JSI could be expressed as:
| (6) |
As a demonstration, Fig. 1(d) shows three-dimensional entangled qudits.
Under the paraxial approximation, the incident angle of the pump beam is only determined by the vertical axis. In other words, all the positions on the same horizontal line have the same incident angle, as shown in Fig. 1(e). This phenomenon can be intuitively understood in the following way: since the focusing range (e.g., 50 mm in our scheme) is much larger than the focused beam radius (less than 1 mm) on the BBO crystal, the contribution from the horizontal angle can be neglected. Fig. 1(f, g) shows the incident angle and intensity distribution on the cross section of the pump beam.
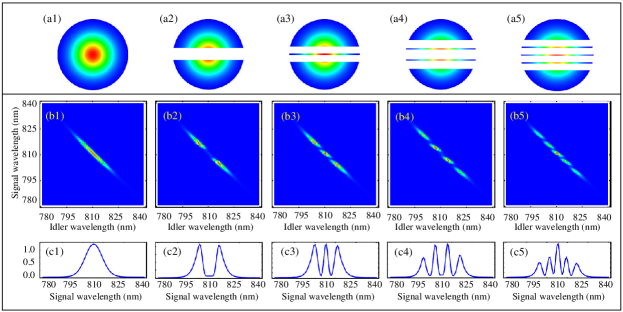
Based on the incident angle distribution in Fig. 1(f), we can shape the pump beam using homemade masks. Fig. 2(a1-a5) and (b1-b5) show the simulations, where the different masks correspond to the unique JSIs. When no slit impinges on the pump beam, a tilt and long JSI can be generated, as shown in Fig. 2(a1, b1). When the center position of the pump beam is blocked using a mask in Fig. 2(a2), the center position in the JSI is lost and a two-mode frequency entangled state is generated, as shown in Fig. 2(b2). When the two sections between the center are blocked using the mask in Fig. 1(a3), two related sections in the JSI are also lost, resulting in a three-dimensional qudit in Fig. 1(b3). Following a similar way, four- and five-dimensional qudits in Fig. 2(b4, b5) could also be generated using three- and four-line masks in Fig. 2(a4, a5).
By projecting the two-dimensional distribution diagram of JSI onto the vertical and horizontal axes, the spectral distribution of the signal and idler photon can be obtained. Fig. 2(c1-c5) shows the corresponding distribution of the signal photon, which has a distribution of 1, 2, 3, 4, and 5 peaks. The full-width at half-maximum (FWHM) of the peak in Fig. 2(c1) is 19.7 nm. Note by adjusting the width and the center position of the mask, different JSIs and spectra can be prepared. See the supplemental document for more simulations. Next, we verify this scheme in an experiment.
III Experiment and Results
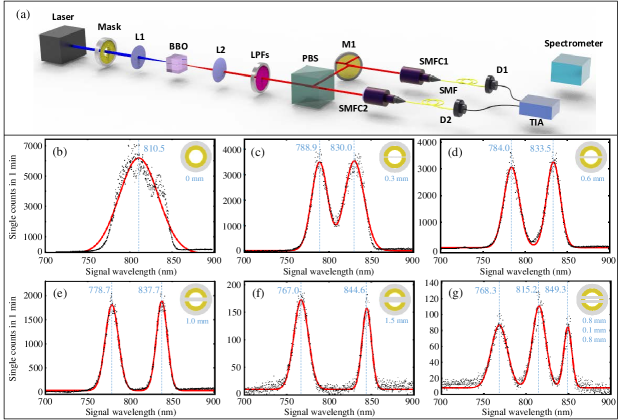
The experimental setup for generating frequency entangled qudits is shown in Fig. 3 (a). The laser used in this experiment is a single-transverse-mode and multi-longitudinal-mode laser diode (LD), which has a central wavelength of 405 nm and a bandwidth of 0.53 nm Cai2022 . The laser beam (with a diameter of around 2 mm) is spatially filtered by a mask and then focused using a lens (L1, f=50 mm). The 5-mm-long BBO crystal is designed for a type-II phase-matched (eo+e) SPDC at 810 nm (cut angle: and ). The downconverted biphotons are collimated by the second lens (L2, f=50 mm) and then filtered by a set of long-pass filters (LPFs). Here, we define the reflected (transmitted) photon from the PBS as the signal (idler). After being separated by a polarization beam splitter (PBS), the biphotons are coupled into the single-mode fibers (SMFs), which are connected to two single-photon detectors D1 and D2 (SPCM-AQRH-10-FC from Excelitas) and a time interval analyzer (TIA, Picoharp300 from Pico Quanta Co.). When the pump power is set to 40 mW, we obtain single counts of 762 kHz for the signal and 325 kHz for the idler. Here, the gap in single counts is due to the different coupling efficiencies of each channel. The measured coincidence count is 4.1 kHz.
After the photon counting test, the biphotons’ spectra are measured by a single-photon level spectrometer (SP2300, Princeton Instrument Co.). Figure 3(b) is the spectrum of the signal photon using a homemade mask with no block line inside. The FWHM of this spectrum is 54.2 nm. This mask is made of photocurable resin using a 3D printer. By inserting a mask with one block line, we obtain the spectrum of the two-dimensional qudits, as shown in Fig. 3(c, d, e, f). To investigate the orthogonality of the frequency qudits, we set the width of the center block line as 0.3 mm, 0.6 mm, 1.0 mm, and 1.5 mm in Fig. 3(c, d, e, f), respectively. It can be noticed that the two peaks in Fig. 3(c, d) are partially overlapped, while the two peaks in Fig. 3(e, f) are completely separated, indicating that the two frequency components are orthogonal. The spacing between the two peak centers is 41.1 nm, 49.5 nm, 59.0 nm, and 77.6 nm, respectively. Figure 3(g) depicts the spectrum of the three-dimensional entangled qudits using a mask with two block lines inside. The width of each block line is 0.8 mm and the spacing between the two lines is 0.1 mm. The three frequency components in Fig 3(g) are also well separated.
IV Conclusion
In conclusion, the present scheme may provide a useful platform to engineer the more complex frequency entangled state. For example, by employing a flattop spectrum of the pump, the regime could generate a high-dimensional maximum entangled state liu2020increasing . By selecting one spatial mask with a high resolution, i.e., an SLM, the dimensional space of the entangled state could be further improved. Also, a high-dimensional Bell state may be possible to perform with the help of the pump modulation technique liu2018coherent . In addition, the reported spatial-spectral mapping scheme is beneficial to study the spatial-temporal entangled states Brecht2015PRX .
Acknowledgments
This work was supported by the National Natural Science Foundations of China (Grant Numbers 91836102, 12074299, 11704290, and 11904112); Guangdong Provincial Key Laboratory (Grant No. GKLQSE202102) and Natural Science Foundation of Hubei Province (2022CFA039).
References
- (1) E. Knill, R. Laflamme, and G. J. Milburn, “A scheme for efficient quantum computation with linear optics,” Nature 409, 46–52 (2001).
- (2) N. Gisin and R. Thew, “Quantum communication,” Nat. Photon. 1, 165–171 (2007).
- (3) A. A. Clerk, M. H. Devoret, S. M. Girvin, F. Marquardt, and R. J. Schoelkopf, “Introduction to quantum noise, measurement, and amplification,” Rev. Mod. Phys. 82, 1155 (2010).
- (4) M. Erhard, M. Krenn, and A. Zeilinger, “Advances in high-dimensional quantum entanglement,” Nature Reviews Physics 2, 365–381 (2020).
- (5) Y. Chen, S. Ecker, L. Chen, F. Steinlechner, M. Huber, and R. Ursin, “Temporal distinguishability in Hong-Ou-Mandel interference for harnessing high-dimensional frequency entanglement,” npj Quantum Inform. 7 (2021).
- (6) A. C. Dada, J. Leach, G. S. Buller, M. J. Padgett, and E. Andersson, “Experimental high-dimensional two-photon entanglement and violations of generalized bell inequalities,” Nature Phys. 7, 677–680 (2011).
- (7) H.-H. Lu, Z. Hu, M. S. Alshaykh, A. J. Moore, Y. Wang, P. Imany, A. M. Weiner, and S. Kais, “Quantum phase estimation with time-frequency qudits in a single photon,” Advanced Quantum Technologies 3, 1900074 (2019).
- (8) C. Reimer, S. Sciara, P. Roztocki, M. Islam, L. R. Corté, Y. Zhang, B. Fischer, S. Loranger, R. Kashyap, A. Cino, S. T. Chu, B. E. Little, D. J. Moss, L. Caspani, W. J. Munro, J. Azańa, M. Kues, and R. Morandotti, “High-dimensional one-way quantum processing implemented on d-level cluster states,” Nature Phys. 15, 148–153 (2018).
- (9) V. Giovannetti, S. Lloyd, and L. Maccone, “Quantum-enhanced measurements: Beating the standard quantum limit,” Science 306, 1330–1336 (2004).
- (10) D. Lago-Rivera, S. Grandi, J. V. Rakonjac, A. Seri, and H. de Riedmatten, “Telecom-heralded entanglement between multimode solid-state quantum memories,” Nature 594, 37–40 (2021).
- (11) M. Kues, C. Reimer, P. Roztocki, L. R. Cortés, S. Sciara, B. Wetzel, Y. Zhang, A. Cino, S. T. Chu, B. E. Little, D. J. Moss, L. Caspani, J. Azaña, and R. Morandotti, “On-chip generation of high-dimensional entangled quantum states and their coherent control,” Nature 546, 622–626 (2017).
- (12) P. Imany, J. A. Jaramillo-Villegas, O. D. Odele, K. Han, D. E. Leaird, J. M. Lukens, P. Lougovski, M. Qi, and A. M. Weiner, “50-GHz-spaced comb of high-dimensional frequency-bin entangled photons from an on-chip silicon nitride microresonator,” Opt. Express 26, 1825–1840 (2018).
- (13) X. Xiang, R. Dong, R. Quan, Y. Jin, Y. Yang, M. Li, T. Liu, and S. Zhang, “Hybrid frequency-time spectrograph for the spectral measurement of the two-photon state,” Opt. Lett. 45, 2993–2996 (2020).
- (14) L. Lu, L. Xia, Z. Chen, L. Chen, T. Yu, T. Tao, W. Ma, Y. Pan, X. Cai, Y. Lu, S. Zhu, and X.-S. Ma, “Three-dimensional entanglement on a silicon chip,” npj Quantum Inform. 6 (2020).
- (15) S. Liu, Z. Zhou, S. Liu, Y. Li, Y. Li, C. Yang, Z. Xu, Z. Liu, G. Guo, and B. Shi, “Coherent manipulation of a three-dimensional maximally entangled state,” Phys. Rev. A 98, 062316 (2018).
- (16) N. B. Lingaraju, H.-H. Lu, S. Seshadri, P. Imany, D. E. Leaird, J. M. Lukens, and A. M. Weiner, “Quantum frequency combs and Hong-Ou-Mandel interferometry: the role of spectral phase coherence,” Opt. Express 27, 38683–38697 (2019).
- (17) V. V. Orre, E. A. Goldschmidt, A. Deshpande, A. V. Gorshkov, V. Tamma, M. Hafezi, and S. Mittal, “Interference of temporally distinguishable photons using frequency-resolved detection,” Phys. Rev. Lett. 123, 123603 (2019).
- (18) C. Bernhard, B. Bessire, T. Feurer, and A. Stefanov, “Shaping frequency-entangled qudits,” Phys. Rev. A 88, 032322 (2013).
- (19) Z. Xie, T. Zhong, S. Shrestha, X. Xu, J. Liang, Y.-X. Gong, J. C. Bienfang, A. Restelli, J. H. Shapiro, F. N. C. Wong, and C. Wei Wong, “Harnessing high-dimensional hyperentanglement through a biphoton frequency comb,” Nat. Photon. 9, 536–542 (2015).
- (20) M. Kues, C. Reimer, P. Roztocki, L. R. Cortés, S. Sciara, B. Wetzel, Y. Zhang, A. Cino, S. T. Chu, B. E. Little, D. J. Moss, L. Caspani, J. Azaña, and R. Morandotti, “On-chip generation of high-dimensional entangled quantum states and their coherent control,” Nature 546, 622–626 (2017).
- (21) R.-B. Jin, R. Shimizu, M. Fujiwara, M. Takeoka, R. Wakabayashi, T. Yamashita, S. Miki, H. Terai, T. Gerrits, and M. Sasaki, “Simple method of generating and distributing frequency-entangled qudits,” Quantum Sci. Technol. 1, 015004 (2016).
- (22) R.-B. Jin, K. Tazawa, N. Asamura, M. Yabuno, S. Miki, F. China, H. Terai, K. Minoshima, and R. Shimizu, “Quantum optical synthesis in 2D time–frequency space,” APL Photon. 6, 086104 (2021).
- (23) J. Li, J. Su, L. Cui, T. Xie, Z. Y. Ou, and X. Li, “Generation of pure-state single photons with high heralding efficiency by using a three-stage nonlinear interferometer,” Appl. Phys. Lett. 116, 204002 (2020).
- (24) C. L. Morrison, F. Graffitti, P. Barrow, A. Pickston, J. Ho, and A. Fedrizzi, “Frequency-bin entanglement from domain-engineered down-conversion,” APL Photon. 7, 066102 (2022).
- (25) Y. Yang, X. Xiang, F. Hou, R. Quan, B. Li, W. Li, N. Zhu, T. Liu, S. Zhang, R. Dong, and M. Li, “Inherent resolution limit on nonlocal wavelength-to-time mapping with entangled photon pairs,” Opt. Express 28, 7488–7497 (2020).
- (26) S. Liu, Y. Cui, E. Karimi, and B. A. Malomed, “On-demand harnessing of photonic soliton molecules,” Optica 9, 240–250 (2022).
- (27) P. J. Mosley, J. S. Lundeen, B. J. Smith, P. Wasylczyk, A. B. U’Ren, C. Silberhorn, and I. A. Walmsley, “Heralded generation of ultrafast single photons in pure quantum states,” Phys. Rev. Lett. 100, 133601 (2008).
- (28) N. Cai, W.-H. Cai, S. Wang, F. Li, R. Shimizu, and R.-B. Jin, “Broadband-laser-diode pumped periodically poled potassium titanyl phosphate-sagnac polarization-entangled photon source,” J. Opt. Soc. Am. B 39, 77–82 (2022).
- (29) S. Liu, Y. Zhang, C. Yang, S. Liu, Z. Ge, Y. Li, Y. Li, Z. Zhou, G. Guo, and B. Shi, “Increasing two-photon entangled dimensions by shaping input-beam profiles,” Phys. Rev. A 101, 052324 (2020).
- (30) B. Brecht, D. V. Reddy, C. Silberhorn, and M. G. Raymer, “Photon temporal modes: A complete framework for quantum information science,” Phys. Rev. X 5, 041017 (2015).
Spatial-spectral mapping to prepare the frequency entangled qudits: supplemental document
In this supplemental document, we present the simulations of joint spectral intensity (JSI) and the spectra of biphotons by adjusting the width and the center position of the mask. Figure S1 shows the case of changing the width of a single slit.
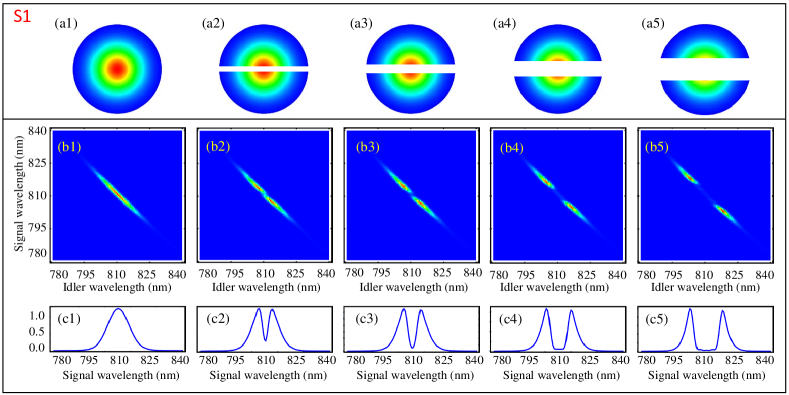
Figure S2 shows the case of changing the position of a single slit (moving up).
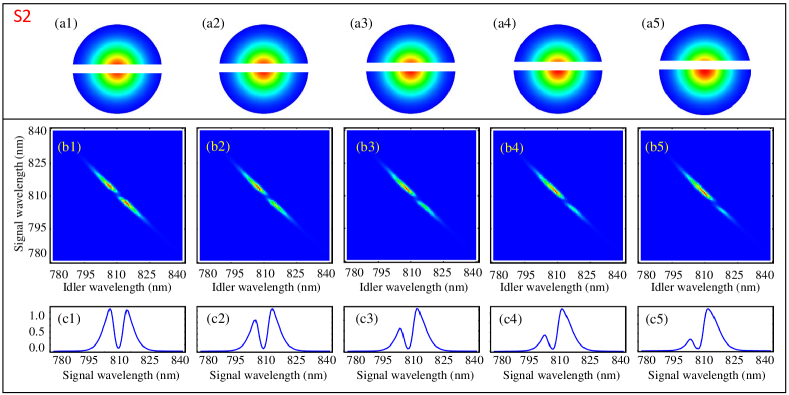
Figure S3 shows the case of changing the position of a single slit (moving down).

Figure S4 shows the case of changing the width and position of two slits.
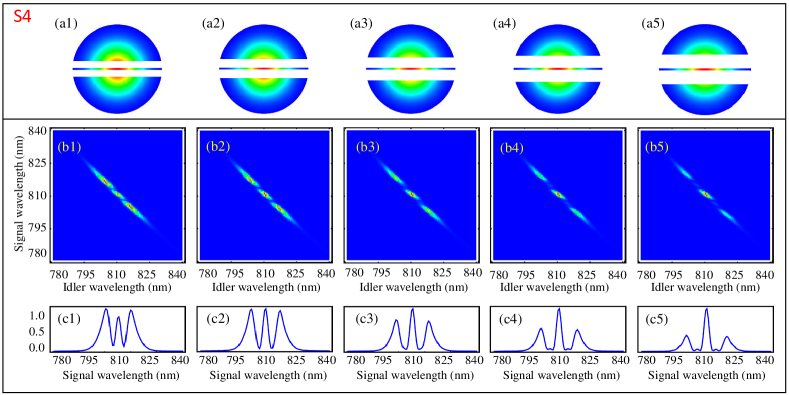
Figure S5 shows the case of changing the width and position of three or four slits.
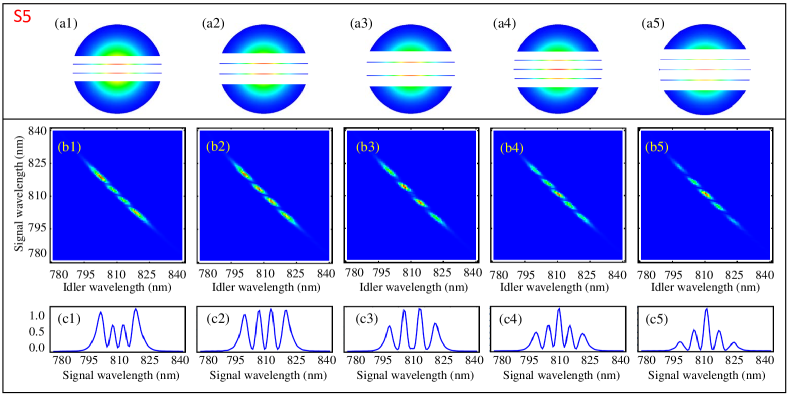
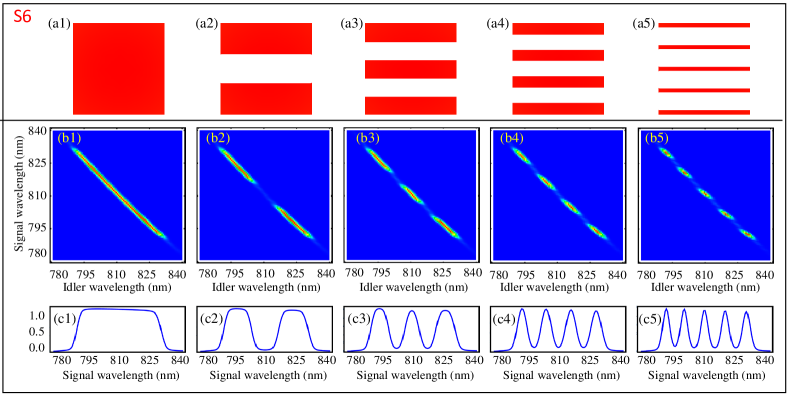
Figure S6 shows the case of utilizing a pump beam with a flat-top distribution rather than a Gaussian distribution.