Modeling Physical Activity Impact on Glucose Dynamics in People with Type 1 Diabetes for a Fully Automated Artificial Pancreas
Abstract
Artificial Pancreas, Physical Activity Modeling, Type 1 Diabetes, Glycemic control, Glucose dynamics modeling.
Index Terms:
Artificial Pancreas, Physical Activity Modeling, Type 1 Diabetes, Glycemic control, Glucose dynamics modeling.II INTRODUCTION
Type 1 diabetes (T1D) is a chronic disorder of impaired glucose metabolism characterized by the lack of insulin secretion by the pancreas. Exogenous insulin replacement is the hallmark of the therapy for the people affected, to mimic as closely as possible the physiological insulin secretion pattern of the healthy individual, and thus reducing markedly the long-term complications of the chronic hyperglycemia caused by insufficient insulin [1]. The American Diabetes Association recommends regular physical exercise of at least 150 minutes per week for the numerous health and wellbeing effects associated with it [3]. However, adapting insulin delivery both during and after physical exercise is particularly difficult because in people with T1D, glycemic response to exercise is highly variable, both within and among individuals, often increasing the risk for hypoglycemia and hyperglycemia, the reason(s) behind this variability being largely unknown. As a result, for most people, diabetes management is perceived as a barrier to exercise [5]. While continuous glucose monitors (CGMs) and automated insulin delivery (AID) systems including the artificial pancreas (AP) hold promise for improved glycemic control during and after exercise, the lack of accurate models able to describe the effect of physical activity (PA) on glucose metabolism is a key limiting factor to the development of insulin treatment strategies applicable to conditions of daily life. Against this background, the objective of this study is twofold. Firstly, we propose an extension to a well known simulation model of the glucoregulatory system able to accurately reproduce the effect of moderate intensity aerobic activity on glucose dynamics compared to actual data; secondly, we present a simple first-order transfer function with time delay modeling the PA disturbance useful for control design.
A few models describing the effect of exercise on glucose excursions are reported in the literature. Roy and Parker [7] developed a PA model as an extension to the Bergman Minimal Model [9], relating the maximum rate of oxygen consumption (VOmax) to glucose uptake in the periphery; in [11] Breton proposed a parsimonious exercise model linking the change in insulin action and glucose effectiveness to heart rate (HR); later Dalla Man et. al. [13] developed and tested three extension of [11] and included them into a simulation model of a glucose–insulin system [15]. More recently, Alkhateeb et. al. [17] developed six variations of the Bergman Minimal Model [9] to describe the impact of moderate exercise on T1D glucose dynamics fitting their models to data collected in closed-loop during continuous and interval exercise. In all previous studies, the authors presented in-silico experiments only without comparing model predictions back-to-back with actual data. When trying to replicate clinical protocols, assessment were only qualitative and limited to the exercise session alone, disregarding post-exercise effects. As far as data-driven black-box models are concerned, some recent contributions include using data collected with a wearable device as a proxy for exercise to identify linear model for prediction of BG dynamics in activity of daily life [19]; Xie et. el. [21] proposing a nonlinear ARMAX model where the effect of PA on the BG variation was characterized through a linear regression with respect to the activity input, and a bilinear regression with respect to the activity and insulin inputs; and [23] in which Dasanayake and colleagues estimated empirical dynamic models of the BG dynamics in reponse to PA measured by commercially available activity monitors, exploiting subspace-based methods for system identification.
The remainder of the paper is organized as follows. In the next section, the experimental conditions and clinical data acquisition in a series of experimental trials are presented; models of the effect of PA on BG dynamics in people with T1D are introduced in Sec. IV. Sec. V is devoted to the presentation of the results while Sec. LABEL:sec:conclusions summarizes the findings and concludes the paper.
III Experimental Conditions and Clinical Data Acquisition
Data acquisition was performed in a series of clinical visits within a randomized, 4-way crossover trial conducted in compliance with the ethical principles in the Declaration of Helsinki and with the standards of Good Clinical Practice. The protocol received Institutional Review Board approval at the clinical site, and was registered at clinicaltrials.gov (NCT02660242). Eligible subjects were between 18 and 65 years of age with T1D for at least two years, using an insulin pump for at least six months, were in good general health with no conditions that could influence the outcome of the trial, and exercised at least 3 times per week performing 30 minutes of moderate or more vigorous aerobic activity.
After the screening visit, during which informed consent was obtained and individual VOmax was assessed for the determination of the exercise intensity for the experimental trials, each participant underwent 4 aerobic exercise sessions (in random order) in the clinic, with different strategies for glucose regulation, as reported in Table III.
Interventions during the activity sessions Arm Intervention Control None Strategy Basal insulin reduction to 50 Strategy Dextrose tabs (20 [g]) orally 5 min prior and at 30 min Strategy Glucagon (150 [g]) subcutaneously 5 min prior Each arm consisted in a 45-minutes moderate intensity aerobic activity (treadmill jogging/brisk walking) performed in the fasted state at of the participants predetermined aerobic capacity. Continuous heart rate (HR [beats/min]) measurements were conducted along with CGMs. After the exercise session, participants rested for 30 minutes and then were given a standardized meal containing 44-50 [g] of carbohydrates. A meal bolus calculated on the basis of each individual insulin-to-carbohydrate ratio was administered 5 minutes prior to the meal intake. Paticipants were monitored for at least 2 hours after the meal and thereafter they were discharged from the clinic. In this work, data from the Control arm was used for our modeling and identification purposes, as described in Sec. IV, while data from Strategy 1 was used for validation and verification purposes (see Sec. V). Fifteen subjects (9 M/6 F, median age of 30 years (IQR 25–43 years), BMI of 24 (IQR 23–27 ), T1D duration of 22 years (IQR 14–31 years), HbA1c of 6.8 (IQR 6.5-6.7)) completed the study, but records from 12 patients only were available to us at the time of writing. Due to incomplete data records or missing samples in the CGM during at least one of the exercise sessions, the records of 3 out of the 12 subjects were discarded. Further, in our analysis, we ratained the data collected from 1 hour before the in-hospital visit to 2 hours and 30 minutes after the meal intake. Figure III shows glucose traces for the considered population, while Fig. III reports the maximum variation in glycemia [mg/dl] and heart rate [bpm] between start and end of the activity session, respectively.
![[Uncaptioned image]](/html/2307.07923/assets/x1.png)
Actual glucose concentration levels [mg/dl] vs. Time [min]. Each boxplot represent data over the considered population, where the central mark in green is the median while the edges are 25th and 75th percentiles, respectively. Dashed red: start of exercise session; Dashed yellow: end of exercise session; Dashed purple: meal intake.
Control arm: variation in glycemia [mg/dl] and heart rate [bpm] between start and end of the activity session, respectively. Population boxplots, where the central mark is the median while the edges are 25th and 75th percentiles, respectively.
IV Models of Glucose Dynamics Affected by Physical Activity
IV-A First-principles modeling
In order to accelerate the development of enhanced glucose control algorithms by performing in-silico trials and to verify feasibility and effectiveness of novel treatment strategies on a population of virtual patients prior to their deployment in clinical studies, we propose a mathematical model of the glucoregulatory system in people with diabetes capable of reproducing the glucose perturbations caused by moderate intensity aerobic activity. The model we propose is an extension to [15, 25]. In brief, the model is comprised of a gastro-intestinal tract subsystem describing meal digestion, absorption of the carbohydrate content and subsequent glucose rate of appearance in blood; a glucose subsystem which describes insulin-independent glucose utilization by the brain and the erythrocytes which is constant and takes place in the first compartment (plasma and rapidly equilibrating tissues) and insulin-dependent glucose uptake [mg/kg/min] in the remote compartment (slowly equilibrating tissues); endogenous glucose production (EGP) in the liver; a subcutaneous insulin infusion module to simulate insulin transit from the subcutaneous space to plasma and finally an insulin subsystem representing the absorbed insulin in liver and plasma. More details about the complete metabolic model can be found in [15, 25], suffices it here to highlight that the primary effect of PA on glucose dynamics is to enhance insulin-dependent glucose utilization by the tissues [27, 13], which in nominal conditions is given by the following expression [15, 25]:
| (3) |
where [mg/kg] is glucose mass in the perifery, [pmol/l] is insulin action on glucose utilization:
| (4) |
![[Uncaptioned image]](/html/2307.07923/assets/x3.png)
Evolution of , and vs Time [Hours] for equal to a step of magnitude 52 [bpm] and [bpm], , , [min], [min] and [min].
represents plasma insulin concentration, the suffix denoting basal state, and [mg/kg/min], [mg/kg/min per pmol/l], [mg/kg] and [min] are model parameters. In particular, denotes insulin sensitivity, i.e., the ability of insulin to stimulate glucose utilization, and denotes the rate constant of insulin action on peripheral glucose utilization. In this work, in order to account for the metabolic changes in glucose physiology during and after PA, we propose a set of variations to Eq.(3), which are motivated by findings and observations reported in the medical literature. We make the assumption that the activity is of moderate intensity and aerobic, and therefore the main substrate metabolism for the required energy is that of glucose. Further, we assume that glucose metabolism during exercise depends on its duration and intensity, and that PA intensity correlates with heart rate, following [11, 13]. In contrast to healthy subjects, BG has been observed to decline during prolonged exercise in people with diabetes [29, 31] caused by impaired EGP and concomitant increase in plasma glucose uptake by the skeletal muscles [33]. Immediately after the start of exercise, the number of glucose transporter-4 (GLUT4) proteins on the plasma membrane and transverse tubules dramatically increases, associated with muscle contractions [35, 37, 39]. This leads to an increased glucose transport capacity into the muscle cells, and an increase in the rate of glucose uptake [41, 43]. Within 2 hours after exercise is discontinued, however, GLUT4 levels return to resting values [35]. We have modeled these rapid mechanisms and short-term effects causing a drop in BG concentration in people with diabetes, by raising insulin-independent glucose clearance after the onset of exercise as a function of exercise intensity measured by heart rate: , where is an individual-specific parameter and is a delayed function of the net difference in heart rate from baseline, paralleling [11], which slowly decays after the end of the exercise and becomes negligible after 2 hours. In addition, we have enhanced glucose utilization by lowering insulin action: , where is a constant and is a function of the heart rate, which remains steady during the session and exponentially decays right after to become negligible after 2 hours. In the post-exercise period, more GLUT4 translocates to the plasma membrane upon insulin stimulation, possibly involving mechanisms initiated by glycogen depletion [33], causing prolonged effects on glucose uptake through an increased insulin sensivity for at least 16 hours post exercise bout. To capture this, we have introduced the term , is individual-specific and in agreement with published literature reporting insulin sensitivity to almost double due to exercise [45], and is a function reaching the value of 1 very rapidly at the beginning of exercise and slowly decreasing over 16 hours to replicate the findings in [33]. Based on these observations, we propose the following equation to describe accounting for PA:
| (5) |
where: = -1τh(h(t)-u_hr(t)), u_hr(t)= HR(t)-HR_b ˙θ(t)= -(φ(t)+1τθ) θ(t) + φ(t) φ(t) = uhr(t)1+uhr(t) w(t) = {0 prior to exerciseuhr(t) during exerciseuhr(tend) e-κtafter exercise and is an external input measuring exercise intensity and duration based on HR [bpm], HR indicating baseline before the start of exercise, initial conditions are , , , and finally, [bpm], , , [min], [min] and [min] are model parameters. Fig. IV-A illustrates the evolution over time of the functions , and for a nominal step-like heart rate increase [bpm] and [bpm], , , [min], [min] and [min].
IV-B Control-oriented modeling
The metabolic model equations describing PA outlined in Sec. IV-A constitute a very useful tool to reproduce real-life scenarios in simulation. However, they are not appealing to be used for control design due to their complexity. Hence, we propose a simpler lower order model able to capture the main dynamics of glycemia during an exercise bout from the perspective of controller synthesis. Specifically, we propose a model able to predict the glucose change during PA in response to a step increase in heart rate, to be used as a model of the PA disturbance. While in real life heart rate may change with several patterns, our assumption of a step increase mimicks the case of a constant moderate effort aerobic activity, and thus it is valid within the scope of our paper. That said, denoting with [bpm] the input and [mg/dl] the output, the following relation is derived:
| (6) |
where [min] is the time constant, [min] is the time delay between input and output, and [mg/dl/bpm] is the gain. Taking Laplace transform of Eq. (6), one obtains:
| (7) |
where is given by
| (8) |
The parameters , and are individual specific and can be estimated from actual data, in a grey-box identification fashion.
IV-C Parameter estimation
We have tuned the time constants , , in Eqs. (LABEL:eq:upa)–(LABEL:eq:kappa) according to the physiological considerations and findings presented in Sec. IV-A, while and were chosen empirically. While we acknowledge the implicit limitations in the use of a nominal parameter set, the lack of suitable experimental data supporting system identification, i.e., data collected with the triple-tracer technique, allowing the estimation of the glucose fluxes between compartments, at the time of writing, prevented a data-driven individual specific parameter estimation procedure. We would like to remind the reader, however, that the development of a validated parsimonious simulator of glucose metabolism during PA, equipped with validated virtual subjects, was extraneous to the scope of this work. Our objective in this contribution was to propose a description of the relationship between PA and changes in crucial parameters such as insulin sensitivity, glucose utilization and ultimately BG dynamics capable of mimicking as closely as possible that of the actual diabetes population, allowing us to replicate in-silico previous protocols and simulate novel treatment strategies and insulin dosing algorithms for the AP on a variety of real-life scenarios.
That said, we have introduced some personalization in our model via the parameter in Eq. (5). For its estimation we used a prediction error method (PEM) with quadratic cost [47]:
| (9) |
where , denotes actual BG level collected during the Control arm of the trial, for each of the available patients, from the start of the exercise session up until the end, is the simulated BG level obtained with the metabolic model, reproducing the same in-silico protocol of the Control arm, and is the number of available data points. For the exercise model we used the nominal parameter set discussed hereinabove, while for the gastro-intestinal tract subsystem, glucose subsystem, EGP, insulin subsystem and subcutaneous insulin kinetics, we used the parameter values from the 10 in-silico adults in [49]. Input was taken from actual available data. Initial conditions were [bpm]and [mg/dl].
As for the unknown coefficients in the transfer function model given in Eq. (8), their estimation was carried out as follows. First, the time delay was derived by visual inspection of the BG time series from the Control arm. Next, with the newly estimated time delay, and as input a step of amplitude and duration that of the exercise session, the coefficients were calculated fitting model (8) to the simulated adopting a PEM with cost given in Eq. (9).
V Results
V-A In-silico experiments
The nominal parameter set for our proposed exercise model in Eqs. (LABEL:eq:upa)–(LABEL:eq:kappa), is reported in Table V-A, while the individual specific is given in Table LABEL:tab:beta.
![[Uncaptioned image]](/html/2307.07923/assets/x4.png)
![[Uncaptioned image]](/html/2307.07923/assets/x5.png)
Comparison between actual patient data (Green) and simulated data (Blue) vs. Time [hours]. The thick line is the population median, the shaded area represents the range between 25th and 75th percentiles. Dashed red: start of exercise session; Dashed yellow: end of exercise session; Dashed purple: meal intake. Top: Control, Bottom Strategy 1.
To verify the correctness of our proposed extension to the metabolic model, we performed in-silico simulations to reproduce, at a population level, the glucose traces collected during the Control and Strategy 1 arms of the previously described clinical trial, succintely reported in Table III. We generated a population of 10 virtual subjects with T1D, where parameter values from the 10-in-silico adults in [49] were used for the gastro-intestinal tract subsystem, glucose subsystem, EGP, insulin subsystem and subcutaneous insulin kinetics, while values in Tables V-A and LABEL:tab:beta were used for the parameter set in Eqs. (5)–(LABEL:eq:kappa). Last, the input to Eq. (LABEL:eq:upa), was assumed to be a step function with amplitude matching that of the actual patient data. Figure V-A shows the actual patients data vs. the simulated ones. In each panel, the thick lines denote the median, while the shaded areas are the range between 25th and 75th percentiles, respectively. Before the start of the sessions, identified by the red dashed line in the panels, the large inter-patient variability in the actual population is apparent for each of the study arm, as expected. This was not the case for the simulated data because all our simulations started with the same initial fasting BG value of 125 [mg/dl]. From the top panel, comparing results over the Control arm, we can see that during the session, the simulated data are well in agreement with the actual data, meaning that our model is able to reproduce the impact of moderate intensity aerobic activity on BG dynamics. Moreover, our model is able to accurately capture the nadir of the BG time-series. In the actual population, glycemia seem to return almost to its pre-activity value within 30 minutes from the end of the session, while still fasting. Our model exhibits a time lag in the recovery post-exercise compared to the true data. This time delay may be attributed to a mismatch of the EGP model for the window of time immediately after activity is suspended. We remind the reader in passing the without ad-hoc experiments enabling collection of glucose tracers concentration, it is not possible to estimate glucose fluxes between compartments, and hence it is not possible at this stage to make any assumptions or draw conclusions on the change in EGP dynamics. The simulated data follow the actual data with good accuracy after the meal intake, confirming the long-term change in insulin sensitivity post-exercise that we have introduced. Similar observations can be made by inspection of the bottom panel, which presents results pertaining to Strategy 1. Simulated data follows the actual data well during the activity and after the meal, however shows a delayed response immediately after exercise.
Physical Activity Model Parameters
Value Unit 1.2 Dimensionless 0.01 Dimensionless 10 [min] 0.1151 [min] 180 [min]
| Patient ID | Value |
|---|---|
| 1 | 0.0143 |
| 2 | 0.0566 |
| 3 | 0.1016 |
| 4 | 0.0173 |
| 5 | 0.0144 |
| 6 | 0.0149 |
| 7 | 0.1655 |
| 8 | 0.0521 |
| 9 | 0.0446 |
| median(25th,75th) | 0.0046(0.0148,0.0678) |
| Patient ID | [min] | [mg/dl/bpm] | [min] |
|---|---|---|---|
| 1 | 10 | 0.7334 | 51.3 |
| 2 | 15 | 2.714 | 72.3 |
| 3 | 15 | 3.946 | 103.8 |
| 4 | 10 | 5.272 | 549.5 |
| 5 | 10 | 0.7402 | 62.8 |
| 6 | 15 | 1.6950 | 22.7 |
| 7 | 15 | 5.1460 | 535.0 |
| 8 | 10 | 1.8150 | 105.4 |
| 9 | 15 | 5.5840 | 652.0 |
| median(IQR) | 15(10,15) | 2.72(1.45,5.17) | 103.80(59.92,538.62) |
V-B Data-driven transfer function identification
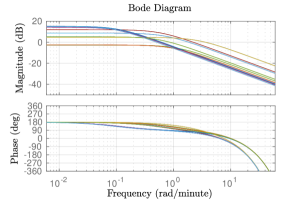
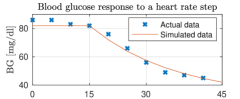
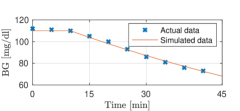
Table LABEL:tab:TF_estimates presents the values of the unknown coefficients in the transfer function model of Eq. (8) identified from patients data, while Fig. LABEL:fig:bode depicts the Bode diagrams of each transfer function. A comparison between actual and simulated BG concentration, for two representative patients, is given in Fig. LABEL:fig:patient18. We investigated the accuracy of the identified model in terms of FIT and Root Mean Square Error (RMSE), defined as follows:
| (38) |
| (39) |
where is the simulated BG profile during the exercise session obtained feeding our proposed transfer function with a step in heart rate as input, are the true BG values, is the mean of and is the number of samples. The results are reported in Table LABEL:tab:performances and show very good predictive capabilities of our simple model.
| Patient ID | [mg/dl] | |
|---|---|---|
| 1 | 0.8861 | 0.7243 |
| 2 | 0.9370 | 8.1852 |
| 3 | 0.9499 | 1.2090 |
| 4 | 0.8541 | 1.5913 |
| 5 | 0.8155 | 1.8981 |
| 6 | 0.8775 | 2.5980 |
| 7 | 0.7980 | 10.27 |
| 8 | 0.9152 | 1.2018 |
| 9 | 0.7184 | 3.1144 |
| median(IQR) | 0.8775(0.8111,0.9206) | 1.8981(1.2072,4.3821) |
VI Summary and Conclusions
One of the major obstacles to the development of a fully automated AP to be used by the patients in daily life conditions, is the adaptation of insulin therapy during PA. The availability of models able to predict the effect of exercise on glucose disposal accurately and reliably constitutes the first step toward realizing such a fully automated closed-loop system. In this work, we proposed a physiology-based parsimonious model of activity, building on the work of [[\@@bibref{}{breton2008, dallaMan2009}{}{}], cite]. We incorporated our proposed model into a metabolic simulator of the glucose-insulin system [[\@@bibref{}{dallaMan2007}{}{}], cite] to obtain a simulation tool able to reproduce actual data collected from people with T1D during a clinical trial. To the best of our knowledge, this is the first effort of this kind, where the prediction capabilities of the candidate physiological model with respect to glucose dynamics both during and after exercise and meal intake are directly compared to actual patients data. While parsimonious models represents a very useful tool to simulate real-life scenarios, their value is limited in the context of control design due to their complexity. Motivated by this, we proposed simple transfer function models able to replicate BG response to a step in HR. The use of the HR signal as an external input makes the proposed models suitable for a practical implementation, since HR can be easily measured in-vivo with wearable devices. Validation of the models on an independent dataset was not possible at this stage, and it is left to future work. Moving forward, we plan on integrating the transfer functions in a decision support tool to be used as hypoglycemia predictor during an exercise bout and to modulate insulin therapy accordingly, by means of a model-based controller. We intend to use our proposed simulator to verify our closed-loop strategy in-silico.
References
- [1] Americ. Diabetes Assoc., “Pharmacologic approaches to glycemic treatment: Standards of medical care in diabetes–2018,” Diabetes Care, vol. 41, no. Supplement 1, pp. S73–S85, 2018.
- [2]
- [3] ——, “Lifestyle management: Standards of medical care in diabetes–2018,” Diabetes Care, vol. 41, no. Supplement 1, pp. S38–S50, 2018.
- [4]
- [5] A. Brazeau, R. Rabasa-Lhoret, I. Strychar, and H. Mircescu, “Barriers to physical activity among patients with type 1 diabetes,” Diabetes Care, vol. 31, no. 11, pp. 2108–2109, 2008.
- [6]
- [7] A. Roy and R. S. Parker, “Dynamic modeling of exercise effects on plasma glucose and insulin levels,” J. Diab. Sci. Tech., vol. 1, no. 3, pp. 338–347, 2007.
- [8]
- [9] R. Bergman, G. Bortolan, C. Cobelli, and G. Toffolo, “Identification of a minimal model of glucose disappearance for estimating insulin sensitivity,” IFAC Proc. Vol., vol. 12, no. 8, pp. 883–890, 1979.
- [10]
- [11] M. Breton, “Physical activity-the major unaccounted impediment to closed loop control,” J Diab. Sci. Tech., vol. 2, no. 1, pp. 169–74, 2008.
- [12]
- [13] C. Dalla Man, M. Breton, and C. Cobelli, “Physical activity into the meal glucose-insulin model of type 1 diabetes: in silico studies,” J Diab. Sci. Tech., vol. 3, no. 1, pp. 56–67, 2009.
- [14]
- [15] C. Dalla Man, R. Rizza, and C. Cobelli, “Meal simulation model of the glucose-insulin system,” IEEE Trans. Biomed. Eng., vol. 54, no. 10, p. 1740–1749, 2007.
- [16]
- [17] H. Alkhateeb, A. El Fathi, M. Ghanbari, and A. Haidar, “Modelling glucose dynamics during moderate exercise in individuals with type 1 diabetes,” Plos one, vol. 16, no. 3, p. e0248280, 2021.
- [18]
- [19] S. Faccioli, B. Ozaslan, J. F. Garcia-Tirado, M. Breton, and S. Del Favero, “Black-box model identification of physical activity in type-l diabetes patients,” in Proc. IEEE Eng. Med. Biol. Soc. (EMBC). IEEE, 2018, pp. 3910–3913.
- [20]
- [21] J. Xie and Q. Wang, “A data-driven personalized model of glucose dynamics taking account of the effects of physical activity for type 1 diabetes: an in silico study,” J. Biomech. Eng., vol. 141, no. 1, 2019.
- [22]
- [23] I. Dasanayake, D. Seborg, J. Pinsker, F. Doyle, and E. Dassau, “Empirical dynamic model identification for blood-glucose dynamics in response to physical activity,” in Proc IEEE Conf Dec. Control (CDC2015). IEEE, 2015, pp. 3834–3839.
- [24]
- [25] C. Dalla Man, D. Raimondo, R. Rizza, and C. Cobelli, “GIM, simulation software of meal glucose-insulin model,” J. Diab. Sci. Tech., vol. 1, no. 3, 2007.
- [26]
- [27] S. Carter, C. Rennie, and M. Tarnopolsky, “Substrate utilization during endurance exercise in men and women after endurance training,” Am. J. Physiol. Endocrinol. Metab., vol. 280, no. 6, pp. E898–E907, 2001.
- [28]
- [29] I. Martin, A. Katz, and J. Wahren, “Splanchnic and muscle metabolism during exercise in niddm patients,” Am J Physiol., vol. 269, no. 3 Pt 1, pp. E583–90, 1995.
- [30]
- [31] H. Minuk, M. Vranic, E. Marliss, A. Hanna, A. AM, and B. Zinman, “Glucoregulatory and metabolic response to exercise in obese noninsulin-dependent diabetes,” Am J Physiol., vol. 240, no. 5, pp. E458–64, 1981.
- [32]
- [33] L. Borghouts and H. Keizer, “Exercise and insulin sensitivity: a review,” Int J Sports Med., vol. 21, no. 1, pp. 1–12, 2000.
- [34]
- [35] L. Goodyear, M. Hirshman, P. King, E. Horton, C. Thompson, and E. Horton, “Skeletal muscle plasma membrane glucose transport and glucose transporters after exercise,” J Appl Physiol., vol. 68, no. 1, pp. 193–8, 1990.
- [36]
- [37] L. Goodyear, M. Hirshman, R. Smith, and E. Horton, “Contractile activity increases plasma membrane glucose transporters in absence of insulin,” Am J Physiol., vol. 258, no. 4 Pt 1, pp. E667–72, 1990.
- [38]
- [39] D. Roy and A. Marette, “Exercise induces the translocation of glut4 to transverse tubules from an intracellular pool in rat skeletal muscle,” Biochem Biophys Res Commun, vol. 223, no. 1, pp. 147–52, 1996.
- [40]
- [41] D. James, R. Brown, J. Navarro, and P. Pilch, “Insulin-regulatable tissues express a unique insulin-sensitive glucose transport protein,” Nature, vol. 333, no. 6169, pp. 183–5, 1988.
- [42]
- [43] L. Goodyear, M. Hirshman, R. Smith, and E. Horton, “Glucose transporter number, activity, and isoform content in plasma membranes of red and white skeletal muscle,” Am J Physiol., vol. 261, no. 5 Pt 1, pp. E556–61, 1991.
- [44]
- [45] M. Schiavon, L. Hinshaw, A. Mallad, C. Dalla Man, G. Sparacino, M. Johnson, R. Carter, R. Basu, Y. Kudva, C. Cobelli, and A. Basu, “Postprandial glucose fluxes and insulin sensitivity during exercise: a study in healthy individuals,” Am J Physiol Endocrinol Metab, vol. 305, no. 4, pp. E557–E566, 2013.
- [46]
- [47] L. Ljung, System Identification: Theory for the User. 2nd Edition. Upper Saddle River: Prentice Hall, 1999.
- [48]
- [49] B. Kovatchev, M. Breton, C. Cobelli, and C. Dalla Man, “Method, system and computer simulation environment for testing of monitoring and control strategies in diabetes,” 2010, US 2010/0179768 A1.
- [50]