Ab initio studies of the impact of the Debye-Waller factor on the structural and dynamical properties of amorphous semiconductors: The case of a-Si.
Abstract
This paper presents a first-principles study of the Debye-Waller factor and the Debye temperature for amorphous silicon (a-Si) from lattice-dynamical calculations and direct molecular-dynamics simulations using density-functional theory (DFT). The effects of temperature and structural disorder on the intensity of the diffraction maxima and the vibrational mean-square displacement (MSD) of Si atoms are studied in the harmonic approximation, with particular emphasis on the bond-length disorder, the presence of coordination defects, and microvoids in a-Si networks. It has been observed that the MSDs associated with tetrahedrally-bonded Si atoms are considerably lower than their dangling-bond counterparts – originating from isolated and vacancy-induced clustered defects – and those on the surface of microvoids, leading to an asymmetric non-gaussian tail in the distribution of atomic displacements. An examination of the effect of anharmonicity on the MSD at high temperatures using direct ab initio molecular-dynamics simulations (without the harmonic approximation) suggests that the vibrational motion in a-Si is practically unaffected by anharmonic effects at temperatures below 400 K, as far as the present DFT calculations are concerned. The Debye temperature of a-Si is found to be in the range of 488–541 K from specific-heat and MSD calculations using first-principles lattice-dynamical calculations in the harmonic approximation, which matches closely with the experimental value of 487–528 K obtained from specific-heat measurements of a-Si at low temperatures.
I Introduction
The influence of thermal vibrations on the intensity of diffraction maxima in crystals has been extensively studied in the literature [1, 2, 3, 4, 5]. Following Debye’s original work [1], where vibrations in crystals were assumed to be independent of the position of atoms in a lattice, more accurate calculations by Faxén [2] and Waller [3] showed that thermal vibrations reduce the intensity of the diffraction maxima but do not affect the sharpness of the diffraction lines. The missing intensity from the spectra was found to be present in the general background, which is known as the temperature diffuse scattering (TDS). The intensity reduction factor, , is known as the Debye-Waller factor [6], where for elemental solids. The mean-square displacement (MSD) of atoms, , along a direction , is perpendicular to the reflecting plane and is the glancing angle of incidence with the plane. The vector is given by (), where and are the wavevectors for the scattered and incident beams, respectively. In Bragg geometry, the scattering angle is given by the angle between and , and = for elastic scattering with , where is the wavelength of the scattering radiation.
The relationship between the Debye-Waller factor and finite-temperature atomic vibrations in solids was extensively studied in the last century [1, 2, 3, 4, 5, 7, 8, 9, 10, 11, 12]. However, the great majority of these studies are primarily focused on elemental and molecular crystals using a variety of theoretical methods. Among these methods, the so-called statistical-moment approach [13], Green function techniques [7, 8], and lattice-dynamical calculations, employing valence force fields, shell models, and adiabatic bond-charge models [9, 10], are particularly noteworthy. In recent years, the calculation of the Debye-Waller factor of crystalline materials has been addressed by using total-energy and forces from density-functional theory (DFT) [14, 11, 12]. By contrast, there exist only few studies that address the effect of the Debye-Waller factor in the amorphous state, e.g. As, SiO2 and InP [15, 16, 17]. Unlike elemental crystals, the MSD of an atom in an amorphous solid varies from site to site and depends on the local topology of the network. As a result, the MSD of amorphous solids can significantly depend on the structural quality of the models employed in the calculations. It is therefore absolutely necessary to compute the Debye-Waller factor using high-quality structural models of amorphous solids obtained from ab initio density-functional calculations. A number of material properties, for example, the first sharp diffraction peak (FSDP) and the principal peak of the diffraction intensity spectrum can be affected by the presence of thermal vibrations. For amorphous materials, these changes are particularly important as the diffraction data or the structure factor plays an important role in characterizing the structure of the materials.
The absence of translational symmetry in amorphous solids means that the normal modes and frequencies of vibrations have to be determined in the coordinate space by computing the environment-dependent atomic force constants without the benefit of any symmetry considerations. It is therefore necessary to calculate the Debye-Waller factor of amorphous solids in real space. Since the MSD of an atom at high temperatures can be shown to be proportional to the sum of the inverse square of the normal-mode frequencies in the harmonic approximation (see section IIB), it is also necessary to employ a reasonably large model of amorphous solids in an effort to include the contribution of atomic displacements from low-frequency normal modes of the system. This requirement can pose a major computational impediment to accurate ab initio calculations of the MSD of atoms in real space for large models using an extended set of basis functions [18]. In this paper, we undertake such a task and study the effect of local disordering and atomic coordination on the MSD of atoms in amorphous silicon (a-Si). The effect of the Debye-Waller factor on the intensity of diffraction peaks is studied, with emphasis on the first sharp diffraction peak (FSDP) and the principal peak of a-Si. The variation of the MSD of atoms with temperature in the presence of coordination defects and short-range and medium-range ordering in a-Si networks is discussed. We also examine the effect of the temperature-induced anharmonicity on the vibrational dynamics of Si atoms in a-Si at high temperatures and the possible role of low-frequency vibrations on the molar specific heat of a-Si at low temperatures. Specifically, the Debye temperature of a-Si is computed using the harmonic approximation and the results are compared with those obtained from experiments. This is particularly challenging for non-crystalline solids using ab initio density-functional calculations in real space. The use of the Debye approximation entails that one must employ sufficiently large models of a-Si to compute the low-frequency vibrational modes which play a major role in the contribution of the specific heat at low temperatures.
The rest of the paper is arranged as follows. Section II is devoted to the development of model a-Si networks and incorporation of defects and extended-range inhomogeneities, which are followed by quantum-mechanical lattice-dynamical calculations of the MSD of atoms in real space in the harmonic approximation, and direct ab initio molecular dynamics (AIMD) simulations without the use of the harmonic approximation. Section III presents results and discussion, where the role of short-range ordering and coordination defects on the MSD of atoms is examined at low and high temperatures. The Debye temperature and the molar specific heat of a-Si are calculated and compared with the corresponding experimental values from the literature. A discussion of the possible role of the low-frequency vibrations of a-Si and their effects on the molar specific heat is presented and the effect of anharmonicity on the MSD of atoms at high temperatures from direct AIMD calculations is discussed in this section. This is followed by the conclusions in section IV.
II Method and Models
In this study, we have used a set of high-quality a-Si models obtained from a combination of classical and AIMD simulations. The term ‘high-quality’ here refers to the fact that structural, electronic, and vibrational properties of the models are in good agreement with experimental data and that the models are free from any coordination defects for all model sizes. Below, we give a brief description of the simulation method for model construction, which is followed by lattice-dynamical calculations of the MSD of atoms in the harmonic approximation. The calculation of the MSD from direct AIMD simulations that take into account the volume expansion of a-Si and the anharmonicity in atomic forces at high temperatures is also discussed in this section.
II.1 Generation of a-Si models
The simulation method employed here consists of two steps. In the first step, several 500-atom and two 2000-atom defect-free configurations, confined in a cubic simulation cell with the experimental mass density of a-Si of 2.28 g cm-3 [19], were produced using the modified Stillinger-Weber (SW) potential [20] via classical MD simulations. The simulations were performed in canonical ensembles with a time step of 1 fs, and the temperature of the system was maintained by a chain of Nosé-Hoover thermostats [21, 22]. The second step involved thermalization of the resulting classical models at 300 K using AIMD simulations. The AIMD runs were conducted for 5 ps using the density-functional code Siesta [23] by employing a set of double-zeta (DZ) basis functions [18]. The use of the DZ basis functions is necessary for the calculation of the mean-square displacement (MSD) and the low-frequency vibrational modes of atoms, which were found to be dependent on the choice of the basis functions. The total energy and forces were computed by solving the Kohn-Sham equation in the self-consistent field approximation, and the exchange-correlation contribution to the total energy was obtained by using the generalized gradient approximation (GGA). The resulting configurations from the AIMD runs were further relaxed geometrically via the limited-memory Broyden-Fletcher-Goldfarb-Shanno algorithm [24] to obtain a set of final structures for studying the Debye-Waller factor in a-Si. A detailed discussion of the method employed here and the validation of the resulting models can be found in Ref. 25. For the calculation of the MSD of the (approximate) tetrahedral sites in a-Si, we have used two independent 500-atom models of a-Si with no coordination defects in the networks.
In order to examine the effect of coordination defects and extended-range inhomogeneities on the Debye-Waller factor of a-Si, we have also studied a few defective models with dangling bonds and voids. Specifically, we have used five independent 500-atom configurations with 2–3 at. % of dangling bonds and two additional independent 500-atom configurations with no coordination defects but a pair of spherical voids of radius 4 Å to generate robust MSD statistics. The dangling bonds (DB) studied in this work are of two types. The first type of DBs are vacancy-induced, which can be produced by removing a tetrahedrally-bonded Si atom from a 100% defect-free a-Si network. The removal of a tetrahedrally-bonded atom creates four neighboring dangling bonds (DB) at the vacancy site. Several such quartets of DBs were introduced in the network and the resulting network was annealed at 300 K (and 600 K) for a time period of 5 ps, followed by ab initio total-energy relaxation of the networks using Siesta. Care was taken to ensure that at least 2–3 at. % of the total DBs persist in the final relaxed configurations. The second type of DBs studied here are sparsely distributed in the network, with no neighboring DBs in the vicinity of 10 Å. Since direct MD simulations cannot produce these isolated DBs in a controlled manner, we have employed an accelerated metadynamics simulation method to generate these models. Metadynamics simulations of a-Si [26] can produce configurations with a given concentration of -fold-coordinated Si atoms, with =2–5, for generating a sparsely distributed DBs in the networks. A description of the method in the context of simulating a-Si models via metadynamics simulations was discussed by three of us in Ref. 26. The configurations obtained from metadynamics simulations were thermalized at 300 K (and 600 K) for 5 ps, followed by ab initio total-energy relaxation. Likewise, two independent 100% defect-free a-Si models were used to produce models with a pair of nanometer-size voids by thermalizing and relaxing the configurations. The final configurations were used to study the effect of voids on the MSD of Si atoms.
II.2 Debye-Waller factor from lattice-dynamical calculations
To study the temperature dependence of the MSD of atoms in a vibrating solid, we have taken two distinct approaches. The first approach involves lattice-dynamical calculations in the harmonic approximation, whereas the second approach relies on direct AIMD simulations in canonical and microcanonical ensembles. The latter enables us to include some aspects of temperature-induced anharmonic effects that can appear at high temperatures. Assuming that is the displacement of atom along the direction, where , the potential energy of the vibrating system can be written as a Taylor expansion about the equilibrium positions of the atoms. Neglecting the cubic and higher-order terms for small atomic displacements and noting that the linear terms vanish at the equilibrium position, the equations of motion can be written as
| (1) |
The coefficient is an element of the force-constant matrix and it denotes the magnitude of the force acting on the -th atom along the direction when the -th atom is displaced by a unit distance along the direction. Substituting , and assuming the solution of (1) to be simple harmonic, , the system of linear equations in (1) can be expressed in a matrix form
| (2) |
Here, is a real symmetric matrix, which is known as the mass-adjusted force-constant matrix or the dynamical matrix, , and is the identity matrix. The eigenvalues and the normalized eigenvectors of give the squared frequencies () and the polarization vectors () of the atoms for the normal modes, respectively. For a system in stable mechanical equilibrium, all the eigenvalues of are positive. The atomic displacement at site is obtained from a linear combination of the normal modes
| (3) |
In Eq. (3), is the vibrational amplitude for the -th normal mode, which may include a phase factor, and are the three polarization vectors of atom , for , associated with the mode . The value of is indeterminate from Eq. (2), but it can be obtained by calculating the average kinetic/potential energy of the system in thermal equilibrium. Assuming is the average kinetic energy, we have
| (4) |
where the last step in Eq. (4) follows from the non-interacting nature of the normal modes obtained in the harmonic approximation. A similar calculation shows that the average potential energy, , of the system is also given by Eq. (4). Since the normal modes can be treated as a set of independent harmonic oscillators, the average energy for each mode in thermal equilibrium at temperature is given by the quantum-mechanical expression
| (5) |
and the MSD follows from Eqs. (3)–(5)
| (6) | ||||
| (7) |
The MSD, , can be readily obtained from averaging over all atoms and coordinate directions and the Debye-Waller factor follows from
| (8) |
where and are the wavelength of the scattering radiation and the angle of scattering, respectively.
At high temperatures, when , one obtains the classical expression of the MSD by substituting in Eq. (6). The first term in Eq. (7) gives the contribution to the MSD from the zero-point motion (ZPM) of atoms, which leads to weak inelastic scattering, even at absolute zero temperature [27]. The effect of thermal vibrations of atoms is reflected in the second term. The computation of the MSD in the lattice-dynamical approach can now be summarized as follows: (i) Thermalize the models at each temperature of interest for 5 ps, followed by ab initio total-energy optimization to prepare the system for the calculation of the matrices; (ii) Construct the matrices numerically in the harmonic approximation using ab initio forces, by displacing each atom, say by 0.005 Å, along the six coordinate directions (, , and ); (iii) Diagonalize to obtain the squared frequencies and the polarization vectors of the atoms for each mode, and calculate the MSD from Eq. (7). To produce good statistics, the results in section IIIA were obtained from defect-free networks by averaging over two independent configurations, whereas those in section IIIB are obtained from five to ten independent configurations with 2–3% dangling bonds in the network.
II.3 Debye-Waller factor from direct AIMD simulations
The lattice-dynamical approach presented earlier does not include any anharmonic effects and it is suitable for temperatures well below the Debye temperature of solids. The effects of anharmonicity on the vibrational dynamics of atoms in a-Si can be studied via direct AIMD simulations in canonical and microcanonical ensembles. In this approach, the system is first equilibrated at a given temperature in canonical ensembles so that the vibrational dynamics of the atoms are reflective of any temperature-induced structural changes that may take place in the system. Once the system is in equilibrium at a given temperature in canonical ensembles, it is then allowed to evolve in microcanonical ensembles. The use of microcanonical ensembles maintains the hamiltonian structure of the dynamics and conserves the total energy of the system in the absence of any thermostatting mechanism. Since the use of constant-volume NVE ensembles can partly restrict the system to include the effect of anharmonicity due to thermal expansion, the volume of the system before the NVE runs was adjusted on an ad hoc basis for each temperature as
| (9) |
where is the coefficient of linear expansion of a-Si, is the volume of the system at temperature , and = 300 K. For annealed samples of a-Si, the experimental value of is of the order of K-1[28]. This value leads to a change of volume of about 0.36% at 600 K from the original volume at = 300 K. Thus, it is unlikely that a change of temperature from 300 K to 600 K would induce a notable change of MSD values due to the volume expansion of the solid.
The MSDs of the atoms were calculated from equilibrium microcanonical trajectories, and averaging the results over time and independent configurations during microcanonical runs. The MSD of atom at temperature can be written as
| (10) |
where is the position of atom at time and the symbol denotes averaging with respect to a variable . Since the approach involves conducting long AIMD simulations in canonical and microcanonical ensembles, using double-zeta (DZ) basis functions for several independent configurations and temperatures, it becomes computationally prohibitive for large system sizes. We shall see later in section IIID that the use of extended or DZ basis functions is of paramount importance to accurately calculate the MSD and the molar specific heat of a-Si. We have therefore restricted our simulations to three 216-atom models of a-Si for the calculation of the MSD. The canonical and microcanonical runs were conducted for a time period of 10 ps each, with a time step of 1 fs, and the atomic trajectories were collected by evolving the system for an additional 10-ps microcanonical run beyond equilibration. The MSDs of the atoms were then calculated from Eq. (10) for three independent configurations at several temperatures in the range from 300 K to 600 K.
III Results and Discussion
III.1 Temperature dependence of the Debye-Waller factor in a-Si
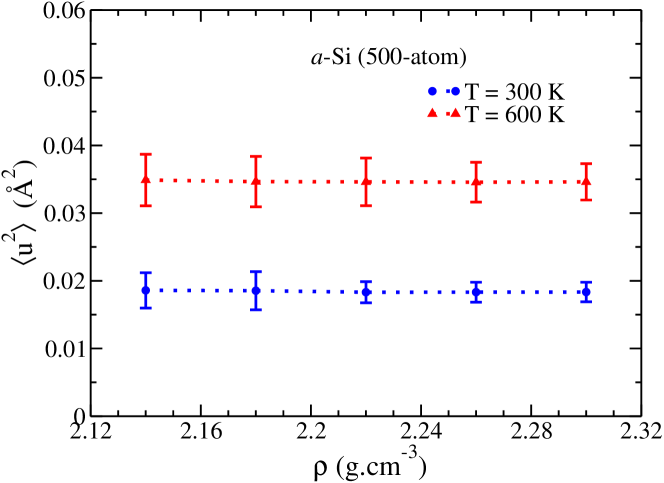
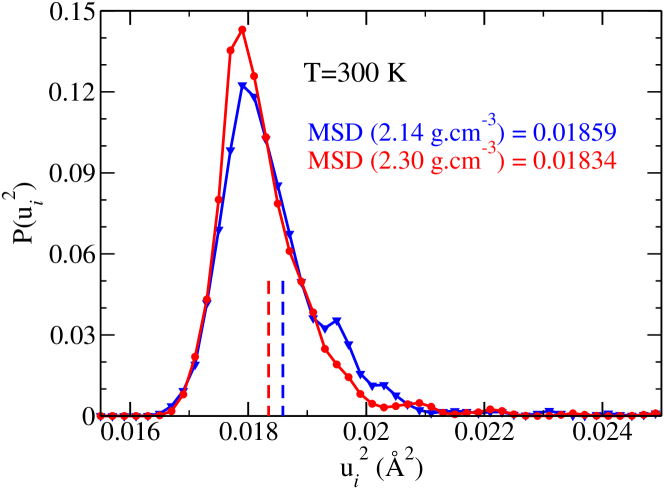
In discussing our results, we begin with the variation of the MSD of atoms with the density of model a-Si networks. Since the density of a-Si samples can depend on preparation methods and experimental conditions, which may affect the local structure of a-Si and hence local atomic force constants, it is important to examine whether the vibrational motion of Si atoms is sensitive to the density of a-Si in the temperature range of 300–600 K. Figure 1 shows the variation, or the lack thereof, of the MSD, , of atoms with the density of a-Si at 300 K and 600 K. The data correspond to the average values obtained from two independent 500-atom model configurations. The results suggest that the MSD is almost independent of the density of a-Si within the range of 2.14–2.30 g cm-3. This observation is not surprising, noting that the models studied in this work have no coordination defects and that a small variation of the density – obtained via a homogeneous scale transformation of atomic distances, followed by thermalization at 300 K (and 600 K) for 5 ps and total-energy optimization – from 2.3 to 2.14 g cm-3 affects atomic distances by a linear scale factor of = 1.024. Assuming that the system behaves as a harmonic solid, it can be shown that the MSD remains practically unchanged in the long-wavelength limit under a scale transformation from in the nearest-neighbor approximation between atoms [29]. However, a small change of the MSD may result from the high-frequency modes and the deviation from the nearest-neighbor approximation of the atomic force constants. This is apparent from the results shown in Fig. 2, where a small shift of the MSD is found to lie well within one standard deviation of the distribution. It may be noted that the results presented in Fig. 1 for 300 K have been explicitly verified for the two terminal densities of 2.14 and 2.3 g cm-3 by generating two independent models from random configurations and computing the MSD of the atoms for the resulting a-Si models.
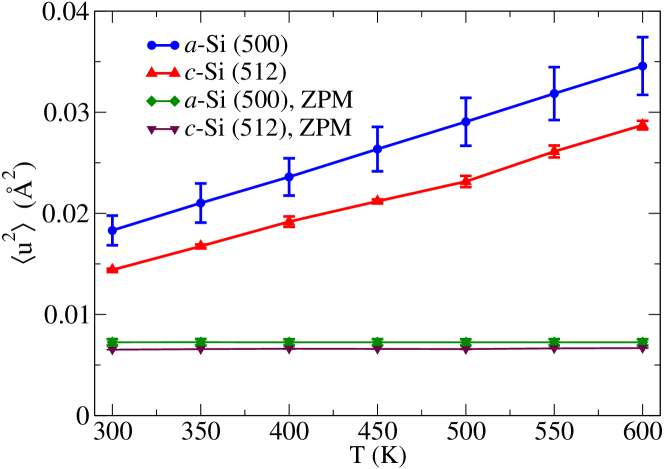
In the lattice-dynamical approach, the dependence of the MSD on temperature is generally studied in the harmonic approximation. Elementary calculations in section IIB show that, for small oscillations in the classical limit, the contribution to the MSD from thermal vibrations is directly proportional to the temperature of the system. Figure 3 shows the variation of the MSD, , with temperature for model a-Si networks with a density of 2.28 g cm-3. The contributions to from the zero-point motion (ZPM) and thermal vibrations of the atoms are shown separately in the figure. The MSD values due to thermal vibrations can be seen to increase linearly with temperature in Fig. 3, an observation which is consistent with the theoretical results obtained from the harmonic approximation in the temperature range of 300–600 K. The linear behavior also signifies that the normal-mode frequencies themselves are practically independent of the temperature in the range of 300–600 K. For comparison, the MSD values for diamond-structure c-Si are also presented in Fig. 3. A somewhat higher value of in a-Si compared to c-Si can be attributed to the disorder associated with the local tetrahedral environment of a-Si. In a-Si, the atoms are bonded to four neighboring atoms in an approximate tetrahedral arrangement, which is characterized by the disorder in the bond-angle and bond-length distributions. The presence of disorder reduces the strength of Si–Si bonds in the amorphous phase. This is in contrast to c-Si, where Si atoms are strongly bonded to each other in an ideal tetrahedral arrangement. This strong and compact ideal tetrahedral bonding results in slightly stiffened atomic force constants (and relatively high values for normal-mode frequencies in the harmonic approximation) compared to its amorphous counterpart. Thus, following Eq. (6), the MSD of Si atoms in a-Si can be expected to be somewhat larger than that in c-Si when an identical thermal perturbation is applied to excite the system.
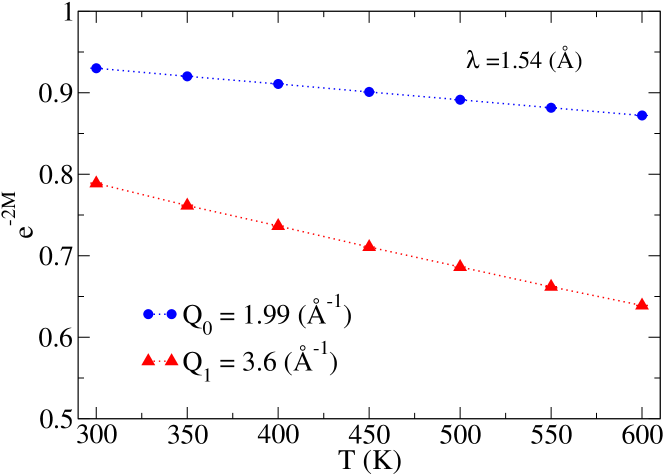
The temperature dependence of the Debye-Waller factor, , is plotted in Fig. 4 for = 1.99 Å-1 and 3.6 Å-1. These two values of correspond to the position of the first sharp diffraction peak (FSDP) and the principal peak in the static structure factor of a-Si, respectively. Since the wavevector transfer , the value of the Debye-Waller factor at different temperatures for the two peaks can be readily calculated for a given scattering wavelength . Figure 4 shows a plot of versus for CuKα X-radiation with = 1.54 Å. The results suggest that the intensity of the principal peak in a-Si is considerably affected by thermal motion of the atoms in solids, even at 300 K. The intensity of the FSDP at 300 K, however, is reduced by a factor of about 0.94, leading to small inelastic scattering at 300 K. The missing intensity can be found to be present in the background, which originates from temperature-diffuse scattering. These results are quite important in comparing the static structure factor obtained from the atomic coordinates of a computer model to the experimental structure-factor data at room temperature, as the former does not include any temperature-induced changes in the computed data.
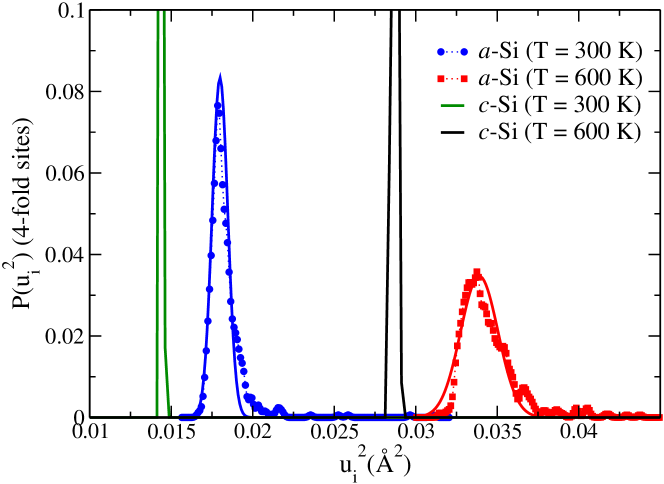
We now examine the role of short-range ordering on the MSD of atoms in amorphous Si networks. Unlike elemental crystals, where one expects a narrow distribution of , induced by thermal vibrations of atoms in an identical atomic environment, the MSD of an atom in amorphous networks varies from site to site, and it largely depends on the local atomic coordination and the disorder associated with bond lengths and bond angles. Figure 5 shows the distributions of atomic displacements, versus , in a-Si at temperatures 300 K and 600 K, along with their crystalline counterparts. The results correspond to the average values of obtained from two independent defect-free configurations of 500 atoms. Owing to the crystalline symmetry of atomic positions, the distributions for c-Si in Fig. 5 are found to be rather narrow and with a root-mean-square width that increases with the temperature of the system. The heights of these distributions are intentionally truncated at a value of 0.1 for clarity of presentation and comparison. By contrast, the distributions for a-Si appear almost gaussian for small atomic displacements, except for a weak non-gaussian tail for high values of . For crystals, the gaussian shape of readily follows from lattice-dynamical considerations and it can be shown analytically [30] that the Fourier transform of is directly related to the temperature factor of an atom. However, the presence of local atomic ordering/disordering in amorphous networks can considerably influence the otherwise random thermal motion of atoms, leading to a notable deviation from an ideal gaussian behavior arising from a set of highly disordered sites. We shall see soon that this non-gaussian behavior of is significantly enhanced in the presence of coordination defects and other inhomogeneities in the network.
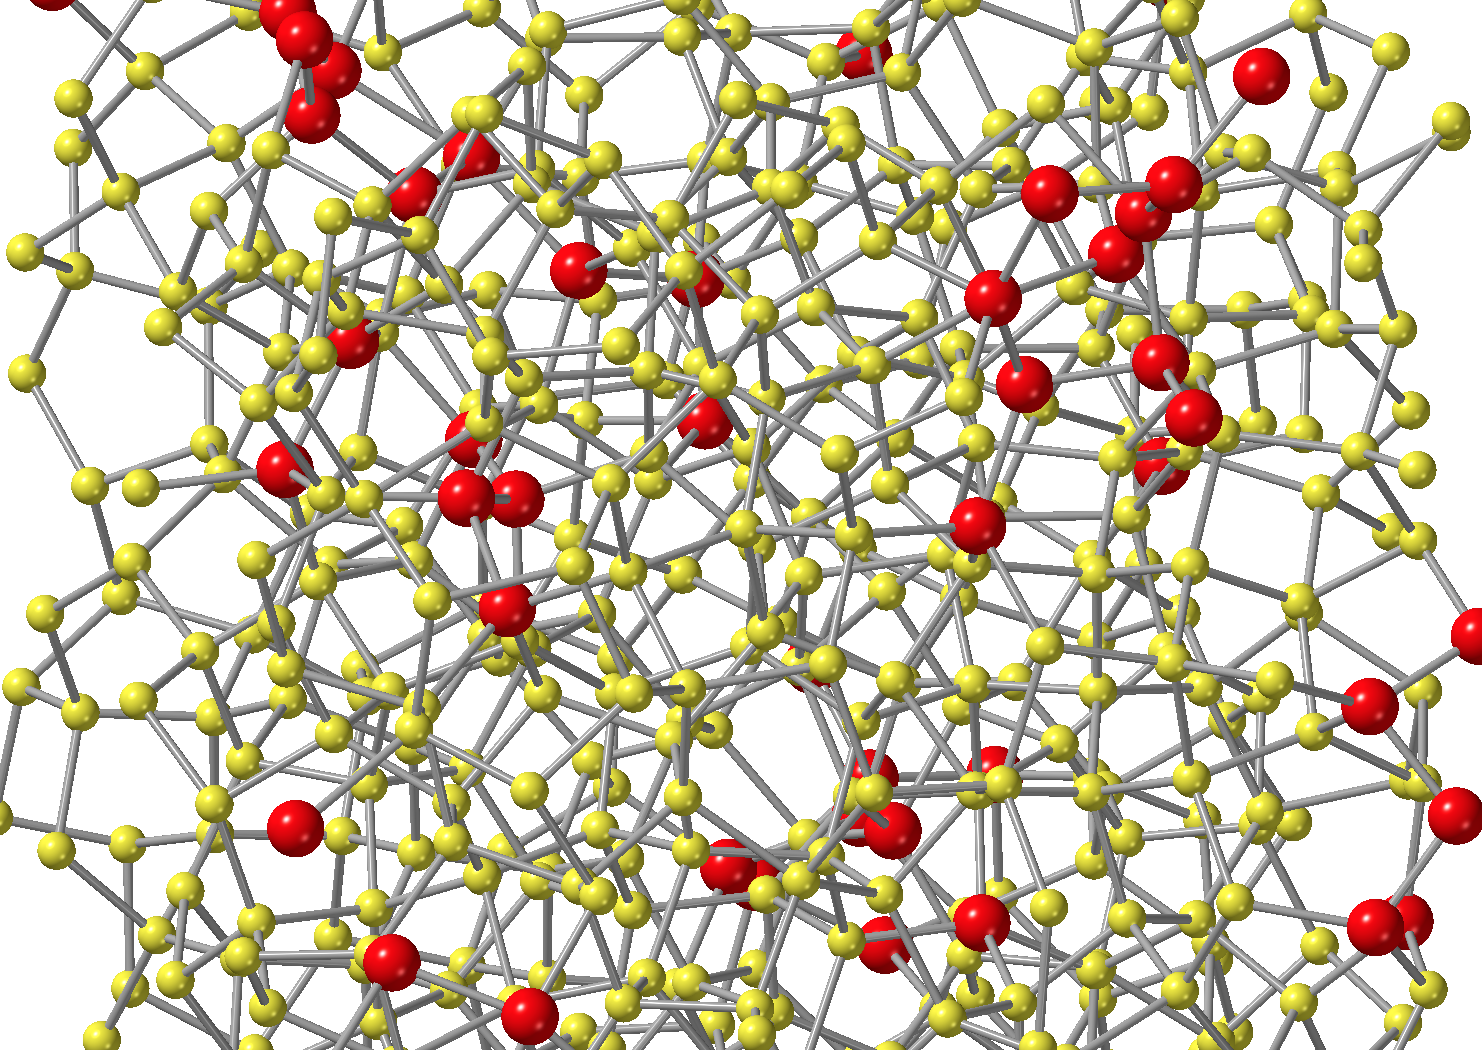
The origin of the non-gaussian tail, associated with high values, in defect-free a-Si networks can be traced back to a few clusters of Si atoms, which are sporadically distributed in the network. These atoms vibrate with relatively high amplitudes compared to the rest of the atoms in the network. This is illustrated in Fig. 6, using a 500-atom model of a-Si at 300 K. Silicon atoms that are associated with high values, with 0.0195 Å2, are shown in red color. This translates into a value of the atomic displacement, which is about 6% of the average Si–Si bond length of 2.36 Å. An examination of the sites with high values reveals that these sites are characterized by the presence of long Si–Si bonds, the length of which is about 2–5% larger than the average bond length of 2.36 Å. This affects the nearest-neighbor force constants () between Si atoms with longer bond lengths and results in a reduction of some normal mode frequencies (as typically decreases with decreasing ), leading to a larger value of for these sites from Eq. (6) upon thermal excitation.
III.2 Effects of defects and inhomogeneities on the MSD
Turning now to discuss the role of structural defects on the MSD and individual squared displacements, we examine the effect of three-fold-coordinated atoms, or dangling bonds, and extended inhomogeneities, such as voids, on the vibrational MSD of atoms. To this end, we have studied two types of dangling bonds. The first type of DBs are vacancy induced, which were produced by removing a tetrahedrally-bonded Si atom, whereas the second type of DBs are sparsely distributed in the network. The creation of these DBs is discussed in section IIA. In the following, we shall refer to these dangling bonds as clustered and isolated DBs, respectively. The results of our calculations, which are presented in Figs. 7–10, enable us to make the following remarks.
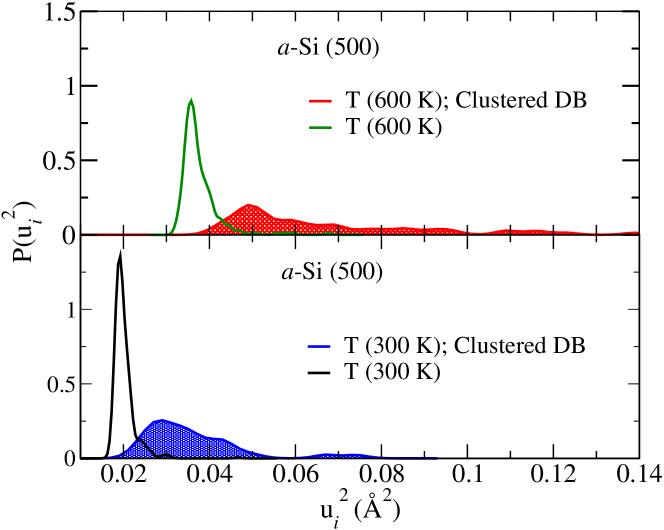
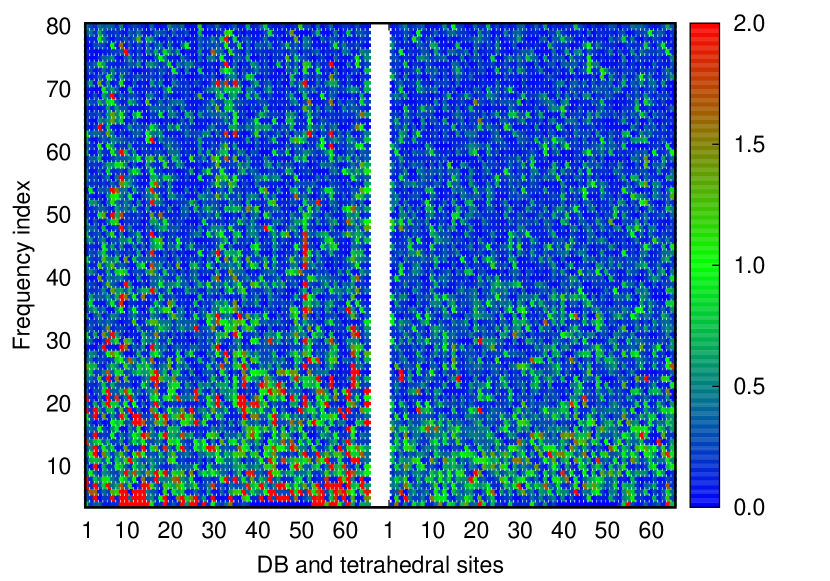
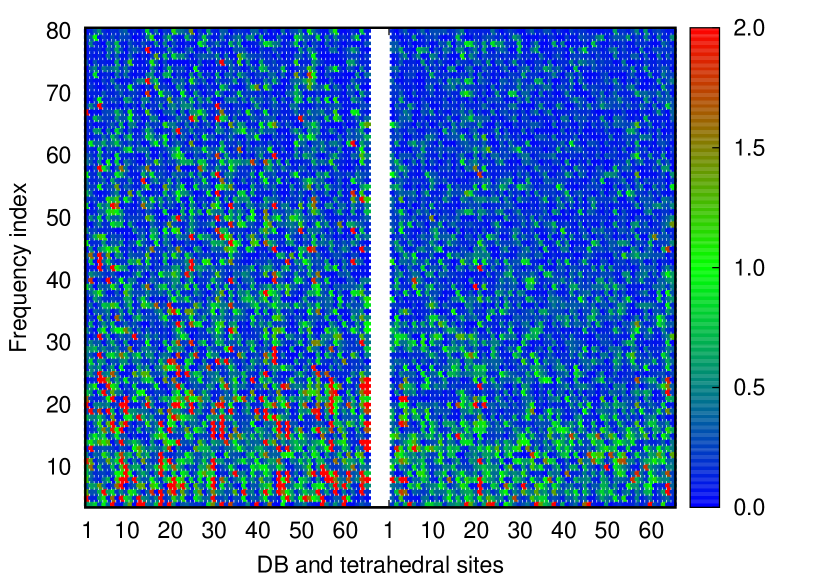
First, a comparison of values obtained for the tetrahedral sites with no defects and clustered DB sites (in Fig. 7) shows that atomic displacements of the DB atoms are notably larger than their tetrahedral counterpart by a factor of two or more. Second, a small number of DB atoms can be seen to have values larger than 0.05 Å2 at 300 K, and 0.1 Å2 at 600 K. This indicates substantial local movement of some atoms near the defective sites and the subsequent healing (or reconstruction) of a dangling bond to form a tetrahedrally-bonded Si atom. Indeed, it was observed that a considerable number of clustered DBs introduced in the network reorganized themselves to form stable tetrahedral bonding following thermalization and structural relaxation. Third, a relatively large value of at the DB sites can be partly attributed to the presence of reduced atomic coordination, which renders the atoms more susceptible to move. A normal-mode analysis reveals that a few low-energy modes contribute considerably to of the DBs compared to the tetrahedral sites. This is evident from Fig. 8, where a color-map representation of – the contribution to at the DB site from the normal mode – is presented against the normal-mode frequencies (along the Y axis) and atomic sites (along the X axis). The left panel in Fig. 8 corresponds to the results obtained for the clustered DBs at 300 K, whereas the right panel shows the same for an identical number of tetrahedrally-bonded atoms. Atomic indices of sixty-five clustered/tetrahedral sites are indicated along the abscissa, whereas the first eighty low-frequency normal modes are indicated along the ordinate. The color in the plot is indicative of the partial contribution of (in percent) to the total MSD of atom . The significant presence of red speckles in the left panel is indicative of high contributions arising from a few tens of low-frequency normal modes at the clustered DB sites. The vertical indices along the Y axis correspond to the frequency range of 0 to 110 cm-1 for =1 to 80. A similar observation applies to Fig. 9 where the results for the isolated DBs are presented.
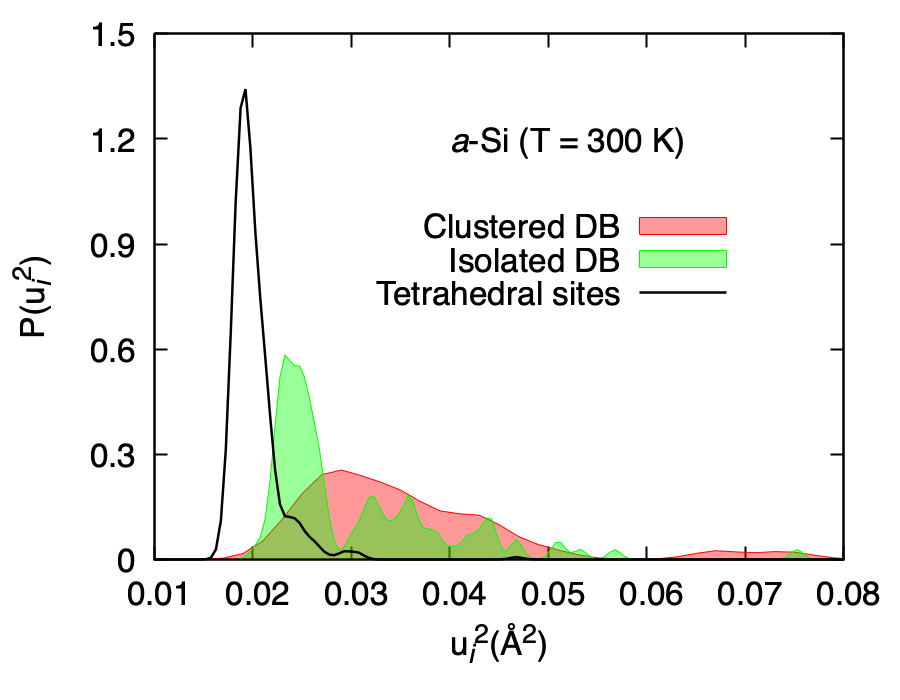
The distributions of obtained for the clustered and isolated DBs are found to be quite different from each other. This is evident from Fig. 10, where the distributions resulting from the clustered (filled red) and isolated (filled green) DBs at 300 K are plotted. The fine structure in the distribution for the latter is reflective of the degree of sparsity and the disorder associated with the isolated DBs in the network. The first green peak in Fig. 10 indicates the presence of several truly isolated DBs in the network. The subsequent green peaks are reflective of a somewhat lesser degree of sparsity of the remaining isolated DBs in the network. An analysis of the distribution of the isolated DBs in the networks shows that almost half of the 65 DBs are sparsely distributed in the network with an average separation distance of 10.3 Å, and a good majority of these sites contribute to the first (green) peak.
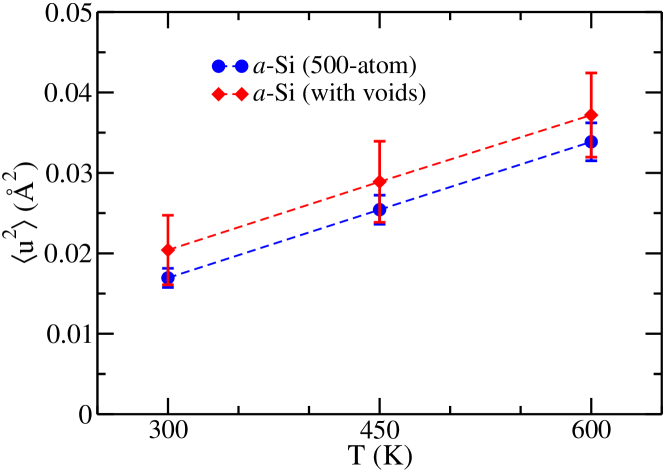
Likewise, the effect of microvoids on the MSD of atoms can be studied by introducing a couple of voids in the network. Figure 11 shows the MSD at 300 K, 450 K and 600 K, before and after introducing two voids of diameter 8 Å in two 500-atom models of a-Si. The plots in Fig. 11 show that the MSD has considerably increased due to the presence of several defective atoms on the surface of the voids. The presence of local disorder and reduced coordination considerably weakens the effective force constants between neighboring atoms that lead to an increase of the MSD of the atoms on the surface of the voids.
III.3 Debye temperature of a-Si from the MSD of atoms
Having discussed the variation of the MSD of atoms with temperature in the presence of disorder and defects, we now obtain estimates of the Debye temperature, , and compare the results with those from experiments. To this end, we first note the following assumption about the definition of the Debye temperature for amorphous solids. In experiments, the Debye temperature of crystalline solids is generally determined by comparing the measured specific-heat data at low temperatures (typically below 30 K) with the expression for the specific heat, = , in the Debye approximation, where the coefficient involves the Debye temperature . At sufficiently low temperatures, the contribution to originates from the (distribution of) low-frequency vibrational modes in crystals, which can be adequately represented by a quadratic function of the frequency. This results in a dependence of the specific heat in crystals. As a result, one can justify the use of the Debye approximation and the resulting Debye temperature as a physical parameter for crystalline solids. For amorphous solids, however, the above reasoning is weakened by the presence of excess low-frequency vibrations (near 1-2 THz) in many systems, leading to a vibrational density of states that may not be well represented by a quadratic function of frequency in the low-frequency region. This can affect the temperature dependence of the specific heat of amorphous solids. It has been shown [31] that for a number of glassy systems, the coefficient can be greater than the Debye coefficient even if the dependence of the specific heat is assumed to hold at low temperatures. Since the experimental values of of a-Si reported in the literature [32, 33] are obtained by assuming , we shall make the same assumption to calculate for the purpose of comparison.
To calculate a theoretical estimate of the Debye temperature of a-Si, we adopt here two distinct approaches. The first approach involves the use of the computed values of the MSDs at low temperatures by comparing with those obtained from the Debye theory. This can be achieved by writing the expression for the MSD at temperature in the Debye approximation [30]
| (11) |
where and is the Debye frequency. In our approach, we proceed to calculate from Eq. (11) by replacing with . To ensure that the Debye approximation remains valid, we limit ourselves to values obtained at low temperatures of up to 50 K from two 500-atom models. The Debye temperature is obtained numerically by computing the value of for which Eq. (11), with , is satisfied at temperatures of 10 K, 30 K and 50 K, and the average value of and are computed from the results. Table 1 lists the results from our calculations. The estimated value of the average Debye temperature, , and the corresponding value of the average Debye frequency, , for a-Si are found to be 541.54 K and 11.3 THz, respectively, over a temperature range of 10–50 K. We should mention that the absence of low-frequency vibrational modes in small 500-atom a-Si models may underestimate the MSD values at low temperatures due to the inverse-square dependence of the MSD on the frequency (cf. Eq. 6). Since the value in Eq. (11) is found to decrease with an increasing value of [34], the value of obtained here from 500-atom models provides an upper bound of the Debye temperature of a-Si.
The computed values of obtained from the MSDs at three different temperatures are presented in table 1. These values are found to be considerably higher than the theoretical value of 430–470 K obtained by Feldman et al [35]. The latter employed 216-atom models of a-Si and classical potentials to compute the elastic constants of a-Si and hence the Debye temperature. The difference between these two sets of values is not unexpected as the computation of from different theoretical approaches may vary notably, depending upon model sizes, the structural quality of models, and the accuracy of total-energy and forces used in the calculations. On the other hand, experimental values of , obtained from specific-heat measurements of a-Si at low temperatures in the Debye approximation, suggest that varies from 4875 K [32] to 52820 K [33]. The value obtained from the inversion of Eq. (11) is quite close to that of Mertig et al. [33] but notably higher than that observed by Zink et al. [32] recently. In the next section, we shall further address this issue by calculating the specific heat of a-Si at low temperatures and obtaining a value of from the Debye approximation for amorphous solids.
| T | (Expt.) | (Elastic) | ||||
|---|---|---|---|---|---|---|
| (K) | (Å2) | (K) | (K) | (K) | ||
| 10 | 0.00725 | 53.632 | 536.31 | |||
| 30 | 0.00730 | 18.092 | 542.76 | 541.5 | 487 5111From Refs. [32] | 430-470222From Refs. [35] |
| 50 | 0.00752 | 10.903 | 545.17 | 528 20333From Refs. [33] |
III.4 Debye temperature of a-Si from specific-heat calculations
The quantum-mechanical calculation of the molar specific heat () of a-Si is rather straightforward and has been reported by a number of workers in recent years [36, 37, 38]. In ab initio lattice-dynamical calculations in the harmonic approximation, can be obtained from
| (12) |
and the corresponding Debye expression is given by
| (13) |
However, the calculation of the Debye temperature from a -vs- plot for small models of a-Si is highly nontrivial as it requires the calculation of values at very low temperatures for which the major contribution to comes from the low-frequency vibrational modes. Since these low-frequency modes (with for = 10–30 K) cannot be realized/formed in small finite-size models and the full self-consistent field density-functional calculation of the vibrational modes for large models using extended basis states is computationally intractable, it is extremely difficult to obtain a realistic estimate of from small models in ab initio calculations. Below, we illustrate this point by studying results from 500-atom and 2000-atom a-Si models.
The results from Eqs. (12) and (13) are plotted in Figs. 12–13, and Fig. 14 as a function of and , respectively. An analysis of the plots leads to the following observations:
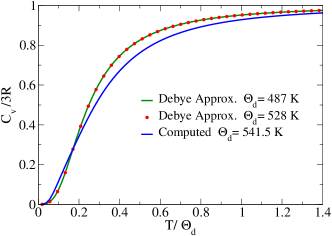
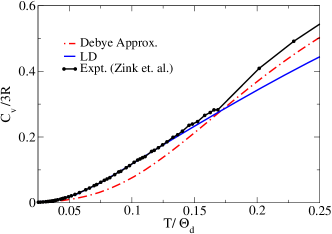
1) A small change of , and hence , has very little to no effect on vs. plots. This is not unexpected in view of the integral nature of Eq. (13) and it is reflected in Fig. 12, where = 487 K and 528 K were used to obtain in the Debye approximation, leading to almost identical values of . It is evident from Fig. 12 that the Debye approximation considerably overestimates the value of in a-Si – compared to that from ab initio lattice-dynamical calculations – above a certain temperature ( 92 K) and slightly underestimates it below . Figure 13 zooms in on the low-temperature region of , which clearly indicates that the crossover temperature is in the vicinity of 0.17 or about 92 K for = 541.5 K;
2) The linear variation of with in the low-temperature region of 40–80 K (i.e., 0.07 to 0.15) in Fig. 13 markedly deviates from the Debye- law at low temperatures. A linear behavior of is well-known in the experimental literature of non-crystalline solids, including for a-SiO2, a-Se [32, 39, 40] and dilute magnetic alloys [41], at temperatures of up to 10 K. However, this behavior is often attributed to the presence of tunneling modes in two-level systems (TLS) [42] at very low temperatures or due to the presence of vibrational modes in reduced dimensions, where the presence of ordered/disordered parallel atomic chains (e.g., in Se/a-Se) can lead to a linear behavior over a certain range of temperature. By contrast, the linear variation of observed here in Fig. 13 for a-Si, which is evident in both experimental and theoretical results, appears at considerably higher temperatures of 40-80 K than 10 K. This observation is quite remarkable as we are not aware of any earlier theoretical works on a-Si that demonstrate this experimentally observed linear behavior of with at temperatures of up to 80 K;
3) The peak positions in the experimental and computed data for vs. T plots in Fig. 14 are found to be at 28–30 K and 33–35 K, respectively. A small rightward shift of the computed peak for the 500-atom model with respect to its experimental counterpart plausibly arises from the absence of some low-frequency vibrational modes in the model. This also explains a considerable reduction of values at low temperatures (below 50 K); the system needs a relatively less amount of energy to excite the few low-frequency modes that are present in small 500-atom models.
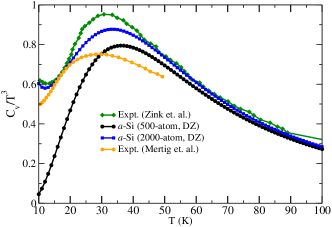
In view of the preceding observation, it is appropriate to conclude that the values obtained from small computer-generated models cannot accurately reproduce the experimental data of a-Si below 50 K, and hence the Debye temperature which is obtained from the low-temperature data in the Debye approximation. This is evident in Fig. 14, where the results from the lattice-dynamical calculations for 500-atom and 2000-atom a-Si models are compared with experimental data. The difference between the experimental and theoretical values of below 50 K is considerable for 500-atom models but the results improved significantly as the model size increases to 2000 atoms. Finkemeier and von Niessen [43] have shown using classical calculations that the size of a-Si models should be of the order of a few tens of thousands of atoms in order to produce the so-called excess low-frequency modes near 1 THz [44]. This possibly explains the observed deviation of theoretical values from experimental data in the region of 20–40 K in Fig. 14 for 2000-atom models. A comparison of the experimental data by Zink et al. [32] with those from 2000-atom models in the temperature range of 10 K to 20 K suggests that the theoretical value of the coefficient () is quite close to the experimental value of 0.6, leading to a theoretical value of the Debye temperature of 488 K.
III.5 Effects of anharmonicity on the MSD at high temperatures
We now briefly discuss the effects of anharmonicity on the MSD of atoms in a-Si at high temperatures. It goes without saying that the temperature-induced anharmonic effects at high temperatures can be truly taken into account by including thermal expansion of solids in simulations. Since the AIMD simulations presented in section IIC were conducted in canonical and microcanonical ensembles, where the volume expansion of a-Si was taken into account on an ad hoc basis, it is not possible to accurately address the role of anharmonicity on the MSD of atoms. Nonetheless, the results from direct AIMD simulations should provide a glimpse of the anharmonic effects on the MSD at high temperatures, as the volume-expansion factor, , in Eq. (9) turns out to be very small and of the order of 1.0036 for = 300 K and K-1 [28]. Thus, if we make allowances for not including such a small change of volume of the system, we should be able to observe the effects of temperature-induced anharmonicity in the potential, if present, on the MSD of atoms at high temperatures obtained from the direct AIMD results.
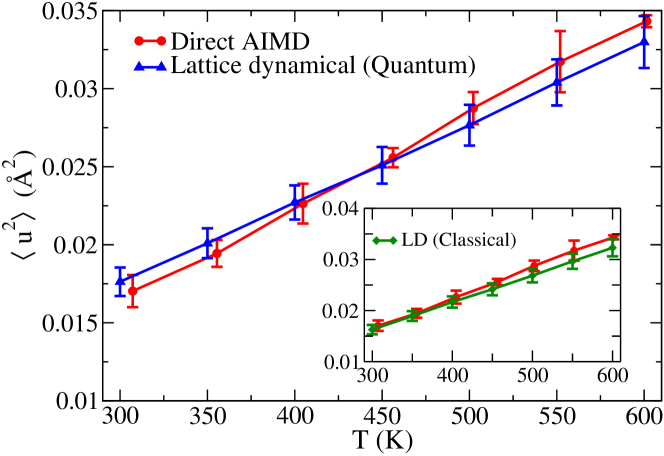
Figure 15 shows the results obtained from 216-atom models of a-Si using direct AIMD simulations in NVT and NVE ensembles, along with the results from lattice-dynamical calculations for an identical 216-atom model in the harmonic approximation. The results enable us to make the following remarks. First, a comparison of obtained from the lattice-dynamical calculations with those from direct AIMD simulations suggests that anharmonicity does not play a significant role at temperatures below 450 K. A small difference between two sets of data below 450 K can be attributed to the use of the phonon distribution function, with , in the lattice-dynamical calculations. This is apparent from the plot shown as an inset in Fig. 15, where the lattice-dynamical results are re-calculated in the classical limit using the value of in Eq. (6). Since the AIMD simulations are conducted by integrating the classical equations of motion, the results obtained from equilibrium atomic trajectories using Eq. (10) are reflective of the classical equipartition theorem. Consequently, the direct AIMD results are somewhat underestimated in the temperature range of 300–400 K. Second, the deviation at high temperatures, above 450 K, is likely to originate from anharmonic effects in the dynamics. This is partly due to large thermal vibrations, which can affect the linear dependence of the forces on atomic displacements, and in part due to disorder in the amorphous network affecting force constants between neighboring atoms. Since the experimental value of the Debye temperature in a-Si is about 487–528 K, one may assume that the MSD of atoms can be calculated fairly accurately in the classical limit from the direct AIMD trajectories at temperatures above 450 K. Lastly, the use of the volume-expansion factor of in our direct AIMD simulations does not yield any noticeable changes of the MSD of atoms, even at 600 K. This observation is consistent with the results observed in Fig. 1. It is therefore reasonable to conclude that the observed deviation of the direct AIMD results from its lattice-dynamical counterpart at temperatures above 450 K can only result from the presence of a weak anharmonic part in the Si-Si potential at high temperatures of up to 600 K.
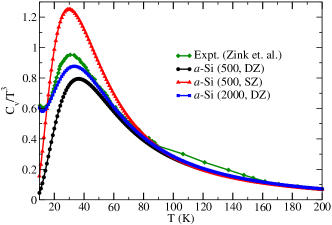
We end this section with a brief discussion of the dependence of the MSD of atoms and the specific heat on the size of the basis functions and the nature of exchange-correlation (XC) approximations. Since vibrational excitations in solids typically involve energies of a few tens of meV, it is crucially important to calculate the elements of the dynamical matrix as accurately as possible by using an extended set of basis functions and a suitable XC functional appropriate for the system to be studied. To examine this issue, the MSDs of atoms in a-Si were calculated using both single-zeta (SZ) and double-zeta (DZ) basis functions (from Siesta), and the local density approximation (LDA) of the XC functional and its generalized-gradient counterpart (GGA). The results of these calculations are shown in Fig. 16. It is evident from the plots that the use of SZ basis functions produces a somewhat larger value of at all temperatures compared to its DZ counterparts for identical models. By contrast, the XC approximation has little or no effect on values for a given basis set. Likewise, the computed values of are also found to be affected by the size of the basis functions used in the ab initio calculation of the vibrational frequency spectrum. This is apparent in Fig. 17, where the results for obtained from using SZ and DZ basis functions in Siesta are presented for the 500-atom and 2000-atom models using the generalized gradient approximation. The results from Figs. 16 and 17 are not surprising and they are a reflection of the fact that the accuracy of the total force acting on an atom – and hence the elements of the dynamical matrix that are obtained from numerical derivatives of atomic forces with respect to atomic displacements – depends on the size of the basis functions used in the calculations. In view of these findings, one may conclude that first-principles calculations of vibrational properties of amorphous silicon should be studied using an extended set of basis functions, whenever possible. Unfortunately, this requirement can considerably hinder our ability to carry out ab initio calculations of amorphous solids for large systems by constraining the size of the systems.

IV Conclusions
In this paper, we have studied the impact of the Debye-Waller factor on the structural and dynamical properties of a-Si using quantum-mechanical lattice-dynamical calculations in the harmonic approximation and from direct AIMD simulations. The quantitative effects of thermal vibrations on the intensity of the first two diffraction maxima, also known as the first sharp diffraction peak (FSDP) and the principal peak, are obtained by computing the MSD of atoms at 300 K and 600 K. The computed Debye-Waller factor at 300 K suggests that the intensities of the FSDP and the principal peak are reduced by a factor of 0.94 and 0.8, respectively, for CuKα X-radiation. This observation is quite important and useful in comparing the room-temperature experimental structure-factor data of a-Si with those from static model calculations, which do not account for thermal vibrations of atoms.
The squared displacement (SD) of atoms in the amorphous environment of silicon is found to vary from site to site and that it considerably depends on the degree of disorder in the local atomic environment, atomic connectivity, and the coordination number of atoms. In particular, it has been observed that while the distribution of the local SDs from tetrahedral sites exhibits a nearly-gaussian behavior, the presence of dangling bonds, defects, inhomogeneities, and a few highly disordered sites (involving long Si-Si bonds) in amorphous networks can lead to a highly stretched asymmetric non-gaussian tail in the distribution. This non-gaussian behavior is distinctly different from that in elemental crystals, where thermal vibrations of atoms in an ordered atomic environment give rise to a gaussian distribution in the harmonic approximation.
The accuracy of the MSD values from lattice-dynamical calculations is examined by computing the MSD from direct AIMD calculations. The latter incorporates any anharmonicity that may be present in the atomic potential at temperature of up to 600 K. The average Debye temperature, estimated from the MSD of Si atoms in the Debye approximation, is found to be 541.5 K in the temperature range of 10–50 K, which is somewhat larger than the experimental value of of 487–528 K obtained from specific-heat measurements at low temperatures. This observed deviation can be attributed to the absence of very low-frequency vibrational modes in small 500-atom models, which underestimate the MSD of atoms and overestimate in the Debye approximation via the inversion of Eq. (11). However, a direct determination of from specific-heat calculations using 2000-atom models of a-Si is found to be 488 K. This value agrees very well with the experimental value of the Debye temperature of 487 K, reported by Zink et al. [32], but it is somewhat smaller than the value of 528 K obtained by Mertig et al. [33] A comparison of from theory and experiments shows that the values obtained from the lattice-dynamical calculations match closely with those from experiments at temperatures above 40 K, but small deviations exist below 40 K.
A review of experimental specific-heat data and theoretical values obtained from varying model sizes leads to the surmise that the absence of a small number of excess vibrational modes (relative to the Debye model) near 1 THz could be partly responsible for the deviation at low temperatures below 40 K. This statement appears to be vindicated in our study by investigating a four-fold increase of the system size from 500 atoms to 2000 atoms. However, a definitive answer to this surmise is outside the scope of the present study as it requires accurate calculations of the vibrational spectra using larger a-Si models in order to examine the vibrational modes near the 1-THz region. Such calculations are prohibitively difficult from an ab initio density-functional point of view due to the requirement of using an extended basis set to construct the force-constant matrix of a-Si models involving several thousands of atoms in the self-consistent field approximation. The effects of anharmonicity on the atomic dynamics in a-Si have been studied by computing the MSD from the equilibrium trajectories of Si atoms obtained from direct AIMD simulations in microcanonical and canonical ensembles. Comparisons of results from the direct AIMD and lattice-dynamical calculations show a small anharmonicity-induced increase of the MSD values at temperatures above 450 K. This suggests that the harmonic approximation works very well below 400 K, which is lower than the Debye temperature of 487–541 K for a-Si.
V Acknowledgments
The work was partially supported by the U.S. National Science Foundation (NSF) under Grant No. DMR 1833035. DD thanks the University of Southern Mississippi for financial support in the form a graduate assistantship.
References
- Debye [1913] P. Debye, Interferenz von röntgenstrahlen und wärmebewegung, Annalen der Physik 348, 49 (1913).
- Faxén [1923] H. Faxén, Die bei interferenz von röntgenstrahlen infolge der wärmebewegung entstehende streustrahlung, Zeitschrift für Physik 17, 266 (1923).
- Waller [1923] I. Waller, Zur frage der einwirkung der wärmebewegung auf die interferenz von röntgenstrahlen, Zeitschrift für Physik 17, 398 (1923).
- Ott [1935] H. Ott, Der einfluß der temperatur auf die röntgenstreuung fester körper nach der quantenmechanik, Annalen der Physik 415, 169 (1935).
- Born [1942] M. Born, Theoretical investigations on the relation between crystal dynamics and x-ray scattering, Reports on Progress in Physics 9, 294 (1942).
- [6] The Debye-Waller factor depends on the elemental species () of an atom and it is often written as the square of the temperature factor , with indicating a time average. Assuming that the displacements are small (i.e., harmonic) and random, is given by , where the vector is parallel to .
- Shukla and Plint [1989] R. C. Shukla and C. A. Plint, Anharmonic contributions to the Debye-Waller factor: Calculation and application to aluminum, Phys. Rev. B 40, 10337 (1989).
- Shukla and Taylor [1992] R. C. Shukla and D. W. Taylor, Debye-Waller factor of sodium: A comparison of theory and experiment, Phys. Rev. B 45, 10765 (1992).
- Reid and Pirie [1980] J. S. Reid and J. D. Pirie, Dynamic deformation and the Debye–Waller factors for silicon-like crystals, Acta Crystallographica Section A 36, 957 (1980).
- Flensburg and Stewart [1999] C. Flensburg and R. F. Stewart, Lattice dynamical Debye-Waller factor for silicon, Phys. Rev. B 60, 284 (1999).
- Rignanese et al. [1996] G.-M. Rignanese, J.-P. Michenaud, and X. Gonze, Ab initio study of the volume dependence of dynamical and thermodynamical properties of silicon, Phys. Rev. B 53, 4488 (1996).
- Lee and Gonze [1995] C. Lee and X. Gonze, Ab initio calculation of the thermodynamic properties and atomic temperature factors of SiO2 -quartz and stishovite, Phys. Rev. B 51, 8610 (1995).
- Van Hung et al. [2014] N. Van Hung, C. S. Thang, N. C. Toan, and H. K. Hieu, Temperature dependence of Debye–Waller factors of semiconductors, Vacuum 101, 63 (2014).
- Vila et al. [2007] F. D. Vila, J. J. Rehr, H. H. Rossner, and H. J. Krappe, Theoretical x-ray absorption Debye-Waller factors, Phys. Rev. B 76, 014301 (2007).
- Lottici [1987] P. P. Lottici, Extended x-ray-absorption fine-structure Debye-Waller factors and vibrational density of states in amorphous arsenic, Phys. Rev. B 35, 1236 (1987).
- Taraskin and Elliott [1999] S. N. Taraskin and S. R. Elliott, Anharmonicity and localization of atomic vibrations in vitreous silica, Phys. Rev. B 59, 8572 (1999).
- Schnohr et al. [2009] C. S. Schnohr, P. Kluth, L. L. Araujo, D. J. Sprouster, A. P. Byrne, G. J. Foran, and M. C. Ridgway, Anisotropic vibrations in crystalline and amorphous InP, Phys. Rev. B 79, 195203 (2009).
- [18] Although it is not necessary to use DZ basis functions for constructing a-Si models, the specific heat and MSD of a-Si from lattice-dynamical calculations are found to be dependent on the basis functions used to obtain the dynamical matrix in Eq. (2). For numerical consistency, we therefore used the DZ basis functions throughout this work (see Figs. 16 and 17).
- Custer et al. [1994] J. S. Custer, M. O. Thompson, D. C. Jacobson, J. M. Poate, S. Roorda, W. C. Sinke, and F. Spaepen, Density of amorphous Si, Appl. Phys. Lett. 64, 437 (1994).
- Vink et al. [2001] R. Vink, G. Barkema, W. van der Weg, and N. Mousseau, Fitting the Stillinger–Weber potential to amorphous silicon, J. Non-Cryst. Solids 282, 248 (2001).
- Nosé [1984] S. Nosé, A unified formulation of the constant temperature molecular dynamics methods, J. Chem. Phys. 81, 511 (1984).
- Hoover [1985] W. G. Hoover, Canonical dynamics: Equilibrium phase-space distributions, Phys. Rev. A 31, 1695 (1985).
- Soler et al. [2002] J. M. Soler, E. Artacho, J. D. Gale, A. García, J. Junquera, P. Ordejón, and D. Sánchez-Portal, The SIESTA method for ab initio order-n materials simulation, J. Phys.: Condens. Matter 14, 2745 (2002).
- Fletcher [1987] R. Fletcher, Practical Methods of Optimization (John Wiley and Sons, 1987).
- Atta-Fynn and Biswas [2018] R. Atta-Fynn and P. Biswas, Nearly defect-free dynamical models of disordered solids: The case of amorphous silicon, J. Chem. Phys. 148, 204503 (2018).
- Biswas et al. [2016] P. Biswas, R. Atta-Fynn, and S. R. Elliott, Metadynamical approach to the generation of amorphous structures: The case of -Si:h, Phys. Rev. B 93, 184202 (2016).
- Kittel [1976] C. Kittel, Introduction to Solid State Physics, 5th Edition (John Wiley & Sons,, 1976).
- Takimoto et al. [2002] K. Takimoto, A. Fukuta, Y. Yamamoto, N. Yoshida, T. Itoh, and S. Nonomura, Linear thermal expansion coefficients of amorphous and microcrystalline silicon films, Journal of Non-Crystalline Solids 299-302, 314 (2002).
- [29] The argument can be readily presented for a one-dimensional ordered chain of lattice constant and spring constant , where in the nearest-neighbor interaction between atoms. A scale transformation leads to and assuming remains unchanged for small , we have .
- Willis and Pryor [1975] B. T. M. Willis and A. W. Pryor, Thermal Vibrations in Crystallography (Cambridge Univ. Press, 1975).
- Pohl [1981] R. O. Pohl, Amorphous Solids, Low Temperature Properties (Edited by W. A. Phillips) (Springer Verlag, 1981).
- Zink et al. [2006] B. L. Zink, R. Pietri, and F. Hellman, Thermal conductivity and specific heat of thin-film amorphous silicon, Phys. Rev. Lett. 96, 055902 (2006).
- Mertig et al. [1984] M. Mertig, G. Pompe, and E. Hegenbarth, Specific heat of amorphous silicon at low temperatures, Solid State Communications 49, 369 (1984).
- U [2] A numerical inversion of Eq. (11) shows that the value of decreases rapidly as increases. This follows from the structure of the integral in (11), and it is independent of the approximation, , used to obtain from the MSDs.
- Feldman et al. [1991] J. L. Feldman, J. Q. Broughton, and F. Wooten, Elastic properties of amorphous Si and derived debye temperatures and grüneisen parameters: Model calculation, Phys. Rev. B 43, 2152 (1991).
- Limbu et al. [2019] D. K. Limbu, R. Atta-Fynn, and P. Biswas, Atomistic simulation of nearly defect-free models of amorphous silicon: An information-based approach, MRS Advances 4, 87–93 (2019).
- Igram et al. [2018] D. Igram, B. Bhattarai, P. Biswas, and D. Drabold, Large and realistic models of amorphous silicon, Journal of Non-Crystalline Solids 492, 27 (2018).
- Queen et al. [2013] D. R. Queen, X. Liu, J. Karel, T. H. Metcalf, and F. Hellman, Excess specific heat in evaporated amorphous silicon, Phys. Rev. Lett. 110, 135901 (2013).
- Zeller and Pohl [1971] R. C. Zeller and R. O. Pohl, Thermal conductivity and specific heat of noncrystalline solids, Phys. Rev. B 4, 2029 (1971).
- Hornung et al. [1969] E. W. Hornung, R. A. Fisher, G. E. Brodale, and W. F. Giauque, Isotope sieve for 4He vs 3He: The low temperature heat capacity of SiO2 glass before and after contact with 4He and 3He, The Journal of Chemical Physics 50, 4878 (1969).
- Marshall [1960] W. Marshall, Specific heat of dilute alloys, Phys. Rev. 118, 1519 (1960).
- Anderson et al. [1972] P. W. Anderson, B. I. Halperin, and C. M. Varma, Anomalous low-temperature thermal properties of glasses and spin glasses, The Philosophical Magazine: A Journal of Theoretical Experimental and Applied Physics 25, 1 (1972).
- Finkemeier and von Niessen [2001] F. Finkemeier and W. von Niessen, Boson peak in amorphous silicon: A numerical study, Phys. Rev. B 63, 235204 (2001).
- [44] Although the large a-Si models used by the authors in Ref. [43] are not particularly realistic due to the presence of 18–20% coordination defects, which adversely affect the electronic gap and render the models quite unsuitable for the calculation of physical properties of a-Si (e.g., ), the presence of excess low-frequency modes is clearly visible in the vibrational spectra of these defective models.