Othering and low prestige framing of immigrant cuisines in US restaurant reviews and large language models
Abstract
Identifying and understanding implicit attitudes toward food can help efforts to mitigate social prejudice due to food’s pervasive role as a marker of cultural and ethnic identity. Stereotypes about food are a form of microaggression that contribute to harmful public discourse that may in turn perpetuate prejudice toward ethnic groups and negatively impact economic outcomes for restaurants. Through careful linguistic analyses, we evaluate social theories about attitudes toward immigrant cuisine in a large-scale study of framing differences in 2.1M English language Yelp reviews of restaurants in 14 US states. Controlling for factors such as restaurant price and neighborhood racial diversity, we find that immigrant cuisines are more likely to be framed in objectifying and othering terms of authenticity (e.g., authentic, traditional), exoticism (e.g., exotic, different), and prototypicality (e.g., typical, usual), but that non-Western immigrant cuisines (e.g., Indian, Mexican) receive more othering than European cuisines (e.g., French, Italian). We further find that non-Western immigrant cuisines are framed less positively and as lower status, being evaluated in terms of affordability and hygiene. Finally, we show that reviews generated by large language models (LLMs) reproduce many of the same framing tendencies. Our results empirically corroborate social theories of taste and gastronomic stereotyping, and reveal linguistic processes by which such attitudes are reified.
Introduction
Identifying and understanding implicit attitudes toward food is important for efforts to mitigate social prejudice because of food’s pervasive role as a marker of cultural identity. Stereotypes about food and cuisines are microaggressions that contribute to harmful public discourse, that may in turn perpetuate prejudice toward ethnic groups and negatively impact restaurants’ economic outcomes (Luca 2016; Muchnik, Aral, and Taylor 2013). For example, in the United States, Chinese food is commonly associated with dirty kitchens and cheap takeout, while French food is associated with romanticism and upscale dining (Hirose and Pih 2011; Lee et al. 2012; Ray 2007). Studying attitudes toward food may be especially revealing, since people may be less likely to self-censor when sharing their opinions of food compared to opinions of ethnic groups per se.
Prior work on immigrant food attitudes has used coarser-grained signals such as numerical restaurant ratings (Ray 2007) or studied review language within smaller scale datasets, such as Yelp reviews of Mexican restaurants in Philadelphia (Gottlieb 2015) or writings from food critics (Johnston and Baumann 2007). Meanwhile, larger-scale studies have ignored restaurant and neighborhood-related factors (e.g., price point, neighborhood racial diversity) that may be confounded with review sentiment (Boch, Jiménez, and Roesler 2021; Yu and Margolin 2022). Prior studies have moreover relied on naive word-count-based methods that do not distinguish between contextually different uses, e.g., a stinky restaurant vs. the stinky tofu (the latter being a compound dish name rather than an evaluative adjective).
We build upon previous work through a study of framing in 2.1M English language Yelp reviews, leveraging NLP parsing techniques to conduct careful linguistic analysis of how customers appraise restaurants while controlling for restaurant quality and neighborhood demographics (see Figure 1). We additionally investigate how differential framing may persist in downstream models trained on online text corpora through a prompting study of large language models (LLMs). Our research questions are the following:
Chinese Their menu includes the usual American Chinese flairs like sweet and sour (fill in the blank), and (fill in a meat) with black/white or sweet and sour sauce. But they also have a lot of actual authentic Chinese dishes, if you been eating the American Chinese food you can ask the waiter for some help on choosing from this part of the menu. So far in Tampa, they’re probably the best place to get the roast duck, pork, chicken etc. […] Their dim sum is the usual stuff, I’m not sure if they push it around in a cart at lunch since I only go there for dinner. The service is pretty good, but because I been going there for a while the owner is even nicer to my party if she happens to be our server. The place is very nice and clean and since they renovated, almost everything still look brand new […] Italian I would have to say this is currently my favorite local Italian-American restaurant by far. Their food is made with care and focus on presentation. The prices are more than reasonable for the breathtaking feasts sent to your table with each entree. Wonderful classic dishes and surely the most impressive chicken-parm you will find in the state. There’s probably enhancements that could be made to the decor and a few severing tips shared with the waitstaff but I like that Mazzella’s doesn’t try to be anything it’s not. Just a really satisfying homey restaurant […]
-
Q1
Framing of immigrant vs. non-immigrant food111We recognize that questions of immigrant identity are deeply nuanced and individual; we thus rely solely on restaurants’ self-identified cuisine categories and their associated geographic regions to designate restaurants as immigrant or not.: How are immigrant restaurants (i.e., those identified with a cuisine based outside the US) framed compared to non-immigrant restaurants (i.e., those identified with a cuisine based within the US)?
-
Q2
Framing within immigrant foods: Are cuisines of more assimilated immigrant groups framed differently from those of less assimilated groups?
-
Q3
Framing in synthetic reviews: Do LLMs transmit the same framing disparities as Yelp reviewers?
These questions are informed by work from the sociology of taste. Regarding Q1, the theory of cultural omnivorousness posits that immigrant food is climbing in social prestige, as part of a broader contemporary shift occurring in other forms of cultural consumption (e.g., music) from a small number of high-brow genres to a more democratic variety (Peterson 1997, 2005). Crucially, this shift is enabled by the perception and framing of immigrant food as exotic and authentic: by valorizing immigrant food as novel, as well as authentically so, consumers can legitimize their choice of a more omnivorous palate beyond traditional haute cuisine, while still maintaining a pretense of discerning taste over an indiscriminate appetite (Johnston and Baumann 2007). At the same time, the frames of exoticism and authenticity represent harmful forms of “othering” (Said 1978) that reinforce a mode of outsider cultural consumption that objectifies food in reductive and essentializing ways.
Regarding Q2, the theory of the ethnic succession of taste argues that there are prestige disparities among cuisines linked to migration patterns and resulting socioeconomic gaps between their associated immigrant groups. For example, as Italian immigration to the US slowed in the 20th century and Italian Americans assimilated up the socioeconomic ladder, so too did the prestige of Italian food; conversely, Asian and Hispanic food remain lower status, since ongoing Asian and Hispanic immigration continues to populate low-prestige jobs, particularly within the restaurant industry (Ray 2007, 2017).
Together, these theories paint a portrait of US culinary attitudes in which immigrant foods are objectified and othered compared to non-immigrant foods, and within immigrant foods, those of less assimilated ethnic groups are viewed more negatively and afforded less prestige. Furthermore, we expect LLMs to show similar framing tendencies, in line with work on representational harms and reporting bias, e.g., Crawford (2017); Paik et al. (2021); Cheng, Durmus, and Jurafsky (2023). Thus, our hypotheses are the following:
-
H1
Immigrant restaurants are othered (i.e., framed as more exotic H1a, prototypical H1b, and authentic H1c) compared to non-immigrant restaurants.
-
H2
Restaurants associated with more assimilated immigrant groups are framed with more prestige (i.e., positivity H2a and luxury H2b); conversely, restaurants of less assimilated groups are framed in more low prestige terms of cost H2c and hygiene H2d.
-
H3
LLMs reproduce the same framing differences as Yelp reviewers.
Using restaurants’ self-reported cuisine designations, we measure framing in 2.1M reviews of immigrant and non-immigrant restaurants in 14 US states. We use the three largest groups of immigrant food in the US: European, Asian, and Latin American. Controlling for factors such as restaurant price point and neighborhood racial diversity, we find evidence supporting our hypotheses: H1c is true for all immigrant cuisines, and H1a-b are true for Asia and Latin America. In other words, immigrant cuisines are subject to more othering, but this disparity is driven mostly by Asian and Latin American restaurants, reflecting and reinforcing a White, Western perspective as the default.
We also find evidence to support H2: European cuisines receive more positive framing (e.g., excellent, wonderful), as well as high status framing of luxury (e.g., elegant, sophisticated) compared to restaurants associated with the cuisines of less assimilated Asians and Latin Americans. Conversely, Asian and Latin American restaurants are more likely to receive low status framing in terms of hygiene and cost. These disparities persist after controlling for the expensiveness of restaurants (Yelp categorizes restaurant expense into 4 levels based on menu prices: $, $$, $$$, and $$$$), and persist within high price point restaurants, supporting the idea of a culinary glass ceiling preventing non-Western immigrant cuisines from attaining the same level of prestige as their Western counterparts (Ray 2017).
We also corroborate H3: GPT-3.5-generated reviews exhibit similar framing disparities to human consumers, with immigrant cuisines subject to more othering and non-Western immigrant cuisines receiving more low prestige framing compared to European cuisines. Together, our results empirically corroborate social theories about perceptions of immigrant cuisines and reveal linguistic markers by which their attendant attitudes are reified. We release data and code at: https://github.com/yiweiluo/immigrant-food-framing/.
Data and Methods
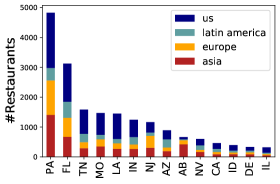
Real consumer reviews. We use the latest release of Yelp’s open dataset,222www.yelp.com/dataset, retrieved January 2023 containing 5.2M reviews from 2005-2022 of 64K US-based businesses (after subsetting to restaurants only). We additionally exclude chain restaurants, cafes, and fast food. We use businesses’ self-declared category tags to obtain cuisine labels for each business (e.g., Italian, Mexican) and perform analyses on the top 25 cuisines, excluding Asian fusion, ethnic food, Caribbean, Middle Eastern, and Tex-Mex as these are difficult to associate with a single region. We then map cuisine labels to broader regions (e.g., Italian Europe, Mexican Latin America). Since some restaurants belong to multiple regions (e.g., Mexican & Spanish), we subset to restaurants whose cuisines all map to a single region. The above filtering steps yield 2.1M reviews of 16K restaurants based primarily in 14 states, mapping onto the 3 primary sources of immigrant food in the US: Europe, Asia, and Latin America, in addition to non-immigrant food (i.e., associated with a US-based cuisine). Since cuisine distribution within regions is non-uniform, we replicate analyses with the most frequent cuisine per region removed and at the level of individual cuisines (see Appendix). Table 1 summarizes dataset totals and Figure 2 shows distribution over cuisines per state.
LLM reviews. For synthetically generated reviews, we prompt the gpt-3.5-turbo model via Chat Completion API. We varied 1) price point ($ – $$$$), 2) cuisine (listed in Table 1), and 3) sentiment (very positive, positive, neutral, negative, very negative). To collect a variety of review content comparable to Yelp reviews, we also varied 4) the focus of the review, including concepts related to the food, staff, and venue. We collected reviews allowing for all potential combinations of the four varied dimensions. To mimic Yelp reviews, we set the max tokens parameter to 200 and matched the actual distribution of sentiment ratings in consumer-written reviews, which skews highly positive (45% 5-stars). See Appendix for the prompting template used.
Occasionally, generated reviews contain disclaimer text (e.g., “As an AI language model, I can say that this customer seems happy with their experience at a French restaurant. They specifically mention that the prices are affordable […]”). We removed such disclosure text from synthetic reviews so as to analyze only instances of framing from the first person perspective rather than the LLM’s meta-commentary (i.e., in the above example, we did not count “prices are affordable” toward cost framing). After subsampling to stratify evenly across cuisine regions, our dataset contained 7.6K total synthetic reviews.
| Region | Cuisine | #restaurants | #reviews |
|---|---|---|---|
| US | american (trad.) | 3663 | 546424 |
| american (new) | 3108 | 560908 | |
| cajun/creole333Note that Yelp collapses Cajun and Creole into a single category. Since both cuisines arguably have immigrant origins, being the product of West African, Spanish, French, (and Native American) influences, we also perform analyses excluding this category and the main results still replicate. | 526 | 160718 | |
| southern | 509 | 141077 | |
| soul food | 279 | 43654 | |
| Lat. Amer. | mexican | 1684 | 184483 |
| latin american | 369 | 42893 | |
| cuban | 146 | 14418 | |
| Europe | italian | 2220 | 228079 |
| mediterranean | 541 | 63425 | |
| greek | 328 | 32860 | |
| french | 199 | 26152 | |
| irish | 104 | 10127 | |
| spanish | 60 | 11579 | |
| Asia | chinese | 1561 | 122219 |
| japanese | 1100 | 145568 | |
| thai | 663 | 81594 | |
| vietnamese | 527 | 57296 | |
| indian | 442 | 46140 | |
| korean | 306 | 36388 |
Extracting linguistic features. We focus on the framing of three basic restaurant attributes: food (e.g., chicken, noodles), staff (e.g., waiter, server), and the venue (e.g., place, atmosphere). We measure framing with the adjectives modifying tokens from each of these three anchor sets. By targeting the framing of specific attributes, we obtain higher precision and more interpretable results compared to aggregate measures of sentiment over the entire text of reviews. For instance, we distinguish genuine evaluative uses of words (e.g., a regular burrito; the restaurant was stinky) from false positives (e.g., I am a regular, I ordered the stinky tofu).
We curate anchor sets with WordNet (Miller 1995) and augment our set of food anchors with a dataset of menu items (Jurafsky et al. 2016). We parse all review texts with spaCy with the Coreferee add-on and leverage dependency parse relations to retrieve adjectival features, excluding adjectives under the scope of negation (e.g., not clean). We then aggregate adjectival features over all anchor sets.444In early analyses, we examined framing along each attribute individually but found no notable differences.
Quantifying framing. We quantify framing along broader dimensions of interest with hand-crafted dictionaries. We measure raw counts of linguistic features belonging to each dictionary within review texts to obtain numerical framing scores along each dimension. We next aggregate framing dimensions into broader theoretical constructs as follows: we measure othering as 1) exoticism, which asserts difference and unfamiliarity; 2) authenticity, which asserts faithfulness to something’s ethnic origins and thus implicitly situates it outside the mainstream (Kovács, Carroll, and Lehman 2014; Boch, Jiménez, and Roesler 2021), and 3) prototypicality, a related form of the “outsider gaze” that asserts all X are alike (Rhodes, Leslie, and Tworek 2012; O’Toole and Natu 2013; Golash-Boza 2016). We measure general prestige as 1) positive sentiment, and finer-grained dimensions of perceived high and low status as 2) luxury and fine dining, 3) hygiene (a marker of low perceived status (Zukin, Lindeman, and Hurson 2017; Yu and Margolin 2022)), and 4) cost/value (another marker of low perceived status (Williamson et al. 2009)).
Our dictionaries for exoticism and authenticity are based on social science work (Johnston and Baumann 2007; Yu and Margolin 2022; Kovács, Carroll, and Lehman 2014) and augmented with a thesaurus. For prototypicality, luxury, cost, and hygiene, we use the Empath tool for lexicon induction (Fast, Chen, and Bernstein 2016) and manually filter false positives. We measure positivity using the positive emotion lexicon from Linguistic Inquiry and Word Count (LIWC) (Tausczik and Pennebaker 2010) and removing lemmas that may have distinct meanings in a dining context (e.g., generous often refers to portion sizes). Examples of lemmas within each framing dimension and construct are shown in Table 2. See Appendix for full lexicons.
| Construct | Frame | Example features |
| Othering | Exoticism | different, distinctive, |
| exotic, foreign, odd | ||
| Prototypicality | archetypal, classic, | |
| stereotypical, usual | ||
| Authenticity | authentic, handmade, | |
| legit, traditional | ||
| Prestige (high) | Positivity | brilliant, cute, |
| flawless, romantic | ||
| Luxury | alluring, classy, | |
| elegant, posh, refined | ||
| Prestige (low) | Cost | affordable, budget, |
| cheap, overpriced | ||
| Hygiene | clean, dirty, grimy, | |
| nasty, sanitary, stinky |
Qualitatively measuring framing. Beyond measuring aggregate framing scores, we also wish to examine the individual features within each framing dimension most associated with a given cuisine. We use the Fightin’ Words method (Monroe, Colaresi, and Quinn 2008), which computes association strength as the weighted log-odds ratio between a feature occurring in a given sample over a reference sample. In our case, we compare a feature’s odds of occurring in a review of cuisine to its odds of occurring in a review of a non- cuisine. We also include an informative prior in the form of all review texts, and compute the z-score to measure the statistical significance of the association after controlling for variance in feature frequency. Formally, we compute the association strength, , for a word with a cuisine as:
| (1) |
where is the count of in reviews of , is the count of in reviews of non-, and is the count of in the prior corpus. is the likelihood of in reviews of cuisine and is the likelihood of in reviews of non-, and are defined as follows:
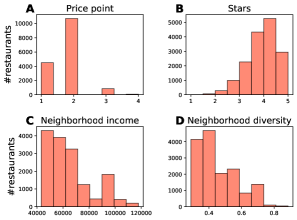
Controlling for confounds in real world reviews. In real world reviews, consumer sentiment is confounded with a number of factors beyond cuisine region, such as review length, a restaurant’s price point and average star rating, and attributes of the restaurant’s neighborhood, such as median income and racial diversity. We control for these confounds by including them as covariates in regression analyses to predict framing from cuisine region. We check for multicollinearity among features and find none (variance inflation factors all below 2.0). Figure 3 shows the distribution of restaurants used in our analyses along restaurant- and neighborhood-attributes. Restaurant price point and mean star rating data is supplied by the Yelp Academic dataset; neighborhood income and racial diversity figures were extracted from 2020 census data after linking each restaurant’s geographic coordinates to individual census tracts. Yelp does not release user-specific information, so we were not able to control for user attributes (e.g., age, gender, race). Instead, we replicate analyses on the reviews of 89 high-volume reviewers and find similar framing disparities across cuisines, within a single user (see Appendix).
Results
Study 1: Othering of immigrant cuisine in Yelp
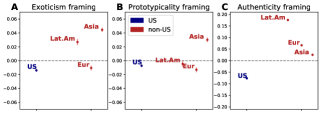
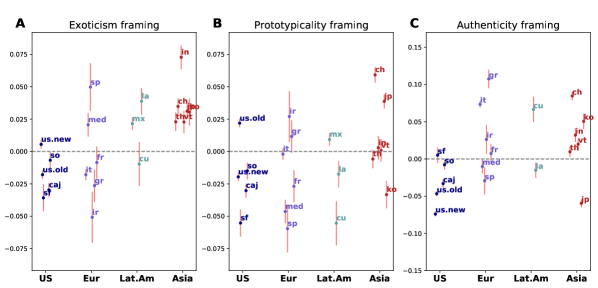
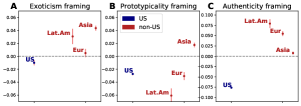
We fit linear regression models to predict framing along 3 dimensions of othering—exoticism, prototypicality, authenticity—from cuisine region, while controlling for review length, restaurant mean star rating, restaurant price point, neighborhood median income, and neighborhood racial diversity. We find that overall, H1a-c are all borne out: othering along all 3 dimensions is more prevalent in reviews of immigrant cuisine (see Figure 4). However, we also observe intra-cuisine variance: othering of immigrant cuisine is driven primarily by Asian and Latin American restaurants, with both regions’ cuisines consistently framed as more exotic, and Asian cuisine framed as more prototypical. In contrast, European cuisine is not framed as significantly more exotic or prototypical than non-immigrant cuisine (which is consistently associated with a decrease in othering). The negative coefficients for non-immigrant and European exoticism in particular support Janer (2005)’s suggestion that US dining culture remains strongly rooted in a Western culinary perspective, with non-Western immigrant cuisines perceived as different with respect to this implicit reference point.
Moreover, when we retrieve the specific features within each dimension most associated with each cuisine using the Fightin’ Words method (see Eq. 1), we observe notable differences in how European vs. Asian and Latin American cuisines are othered (see Table 3). Although all cuisines are described with neutral prototypicality features (e.g., regular, standard, typical), only European cuisine is described with positive features like classic and exemplary. Both the neutral and positive features represent essentializing language in that they reduce a cuisine to a prototype, but the positive features do so by placing favorable emphasis on certain representative elements of a cuisine.
| Frame | Europe | Latin America | Asia |
|---|---|---|---|
| Exoticism | — | different (3.9) | exotic (5.0) distinct (2.7) unfamiliar (2.6) |
| Protoypicality | classic (6.4) regular (3.0) | typical (4.4) usual (2.6) | usual (11.7) typical (5.9) standard (5.5) |
| exemplary (2.0) | common (4.4) essential (2.2) stereotypical (2.0) | ||
| Authenticity | homemade (17.5) quaint (5.9) | authentic (51.1) handmade (4.6) | authentic (42.8) traditional (14.6) legit (4.6) |
| true (2.6) rustic (2.1) | unassuming (3.6) modest (2.1) |
We also find that authenticity is afforded to European cuisine through adjectives of simplicity, such as homemade, rustic, and quaint, whereas Latin American and Asian cuisines are afforded authenticity by being authentic or legit.555We fit additional regression models to predict distinct types of authenticity framing and find that authenticity of European cuisine is driven mostly by simplicity features (Eur=0.078, p=0.0; Lat.Am=0.038, p=1.4e-86; Asia=-0.053, p=8.0e-86), whereas authenticity of Asian and Latin American cuisines is driven by other kinds of authenticity features (Eur=0.018, p=0.0; Lat.Am=0.27, p=0.0; Asia=-0.099, p=0.0). In particular, European authenticity features evoke the current prestige fare of simple, artisanal, farm-to-table cooking championed by restaurateurs such as Alice Waters of Chez Panisse. As Ray (2007, p.100) writes: “The craftsmanship of bourgeois home-cooking was the new posture, contrasted with the mannered style of French haute cuisine […] Rusticity replaced elegance.” In other words, the framing of European authenticity via simplicity may reflect high cultural capital rather than authenticity per se.
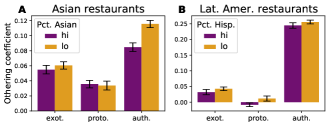
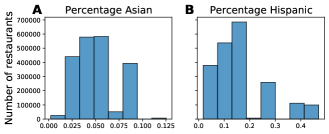
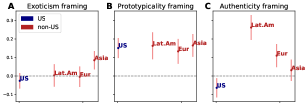
Othering by cultural outsiders. Since we posit that the above framing dimensions of exoticism, prototypicality, and authenticity are forms of gastronomic othering, in which a cuisine is objectified by outsiders, we expect othering to interact with the racial background of reviewers. Demographic information for Yelp users is not available in the dataset, so we examine the influence of the % population of self-identifying Asian and Hispanic residents in the neighborhood as a proxy, using 2020 census data linked to each restaurant’s postal code.666https://data.census.gov/ In cases where users self-divulge that they are non-local visitors (e.g., “I’m from out of state,” “I’m visiting from California”), we detect and exclude those users’ reviews using a regex filter. See Appendix for distributions of Asian and Hispanic residents, respectively, for restaurant neighborhoods.
We fit linear regression models to examine the effect of local self-identifying Asian and Hispanic population % on othering of Asian and Latin American restaurants, respectively. We find that a lower % population of the associated race increases authenticity framing of Asian restaurants and increases prototypicality framing of Latin American restaurants. Interestingly, the % population of Asian/Hispanic residents did not have significant effects on exoticism framing in reviews of Asian and Lat.Am. restaurants (see Figure 5).777As a sanity check, we fit linear regression models to examine interaction effects between pct. of Asian and Hispanic residents (as continuous variables) and cuisine region. We find that a lower pct. of Asian/Hispanic residents increases authenticity framing of Asian and Lat.Am. restaurants (auth.Asian=0.006, p=0.0; auth.Hisp.=0.02, p=0.0) and exoticism framing (ex.Asian=0.005, p=0.002; ex.Hisp=0.004, p=0.049). A lower pct. of Hispanic residents also increases prototypicality framing of Lat.Am. restaurants, but a lower pct. of Asian residents decreases prototypicality framing of Asian restaurants (proto.Hisp.=0.02, p=0.0; proto.Asian=-0.02, p=0.0). However, these results may also be skewed by the narrow range of geographic regions represented in our dataset, especially in the case of Asian neighborhoods: 83% of the neighborhoods with a high Asian % population are located in Pennsylvania, and 36% of high Hispanic % population neighborhoods are located in Florida (despite PA having only 4% of the overall US Asian population and FL having only 26% of the overall US Hispanic population).
Study 2: Lower prestige of non-Western immigrant cuisines in online reviews
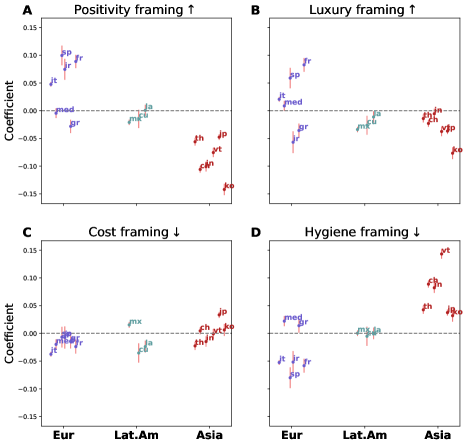
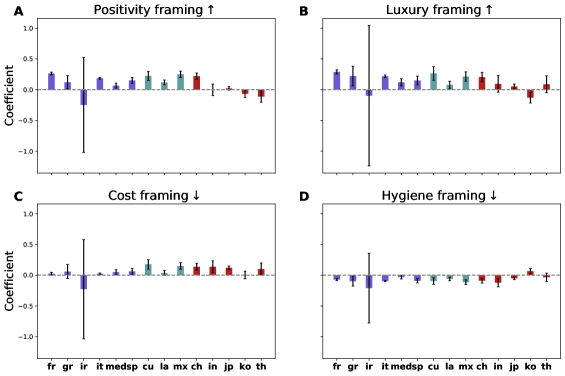
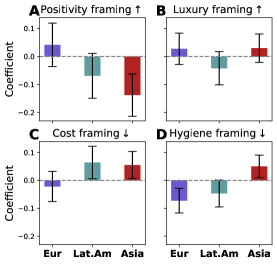
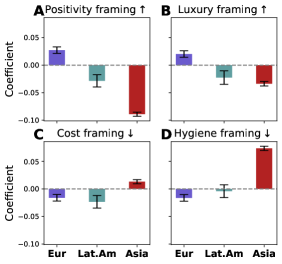
We fit linear regression models to predict high vs. low prestige framing from cuisine region, while controlling for the same confounds as in Study 1. We find that review language corroborates H2: cuisines of less assimilated Latin Americans and Asians are associated with less high-status positive sentiment and luxury framing, and more low-status cost and hygiene framing, compared to cuisines of more assimilated Europeans (see Figure 6A-D). Qualitatively, we notice that the positive features most associated with European cuisine are higher intensity (e.g., wonderful, perfect) compared to those associated with Latin American cuisine (e.g., great, cool) and with Asian cuisine (e.g., good, nice) (Table 4).
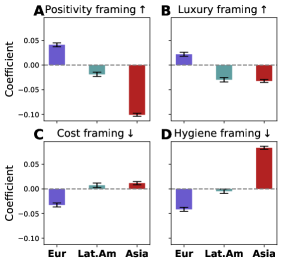
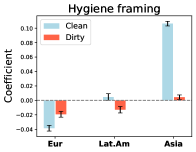
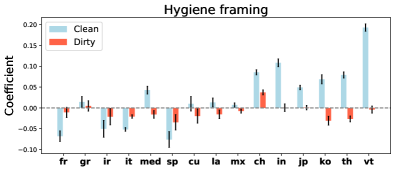
Disaggregating hygiene framing into positive hygiene (i.e., clean) and negative hygiene (i.e., dirty), we find that Asian cuisine continues to be reviewed the most in terms of both types of hygiene (see Figure 7). Latin American cuisine is framed more in terms of positive hygiene than European cuisine, but not significantly differently for negative hygiene. Interestingly, European cuisine is the only cuisine to receive more dirty than clean framing, suggesting that cleanliness may be taken for granted for European restaurants, and hygiene conditions are only noteworthy when dirty. Evaluating a restaurant in terms of hygiene, regardless of whether the framing is positive (clean) or negative (dirty), presupposes that cleanliness is a relevant and important dimension of discussion, reflecting and potentially reinforcing negative assumptions about sanitary conditions of Asian and Latin American cuisines.
| Frame | Most European | Most Latin American | Most Asian |
|---|---|---|---|
| Positivity | romantic (19.7) wonderful (17.5) | good (10.7) amazing (4.2) | good (38.3) special (16.1) tender (10.4) |
| cozy (13.6) excellent (12.8) lovely (11.6) | super (4.0) fun (3.8) | nice (8.5) delicate (7.0) satisfying (5.9) | |
| charming (9.2) perfect (8.5) | great (3.3) awesome (3.0) | calming (5.8) pleasant (5.0) rich (4.5) | |
| fabulous (8.0) rich (7.2) special (6.3) | bold (4.1) pleasing (3.5) original (2.9) | ||
| divine (5.8) fantastic (5.6) | pretty (2.8) welcoming (2.5) | ||
| Luxury | delicate (3.2) elegant (3.0) | outstanding (4.2) | delicate (8.7) sleek (5.9) |
| exquisite (2.8) | pleasing (4.6) tasteful (4.5) | ||
| ornate (3.0) posh (2.1) stylish (2.0) | |||
| Cost | expensive (3.7) pricey (2.5) | cheap (5.7) inexpensive (4.0) | cheap (13.2) affordable (8.5) |
| affordable (2.2) | inexpensive (6.2) | ||
| Hygiene | — | clean (5.4) | clean (34.1) stinky (4.9) unhygienic (2.5) |
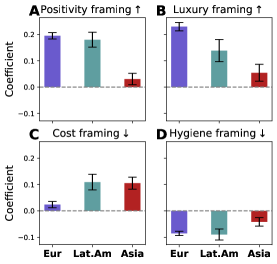
Glass ceiling effect. Since prestige is confounded with restaurant price point, we additionally study framing within reviews of $$$ and $$$$ restaurants (N=166K).888We group $$$$ with $$$ restaurants due to the small number of the former (N=326; 0.005%). Although we control for price point in all analyses, we wished to more carefully examine the extent of framing disparities: even within the most upscale price tier, do non-Western immigrant cuisines continue to receive more low status and less high status framing compared to European cuisine?
We find that framing disparities persist within reviews of high price point restaurants, pointing to a glass ceiling effect by which Asian and Latin American restaurants are afforded lower prestige than their European counterparts (see Figure 8).999We also examined framing within James Beard award-winning restaurants but found no significant effects. This effect is most pronounced for Asian cuisine, which continues to be evaluated as less positive, less luxurious, and more in terms of cost and hygiene, and slightly less pronounced for Latin American cuisine, which continues to be evaluated as less luxurious and more in terms of cost.
Study 3: Reporting bias in LLMs
Framing disparities in Yelp reviews potentially affect not only consumers’ perceptions of different immigrant cuisines, but also the way large language models (LLMs) represent cuisines in generated reviews. Because people may increasingly use LLMs to generate synthetic restaurant reviews,101010https://www.cnbc.com/2023/04/25/amazon-reviews-are-being-written-by-ai-chatbots.html; https://www.theverge.com/2017/8/31/16232180/ai-fake-reviews-yelp-amazon; see also Veselovsky, Ribeiro, and West (2023) along with the rapidly increasing use of LLMs to generate texts of all kinds, the presence of representational harms stands to reinforce existing prejudices and exacerbate economic inequalities between ethnic groups. Here we examine whether framing disparities in othering and prestige exist for LLM-generated reviews, such as in Figure 9.
Chinese Amazing food at a great value! This Chinese restaurant is a hidden gem. The staff is friendly and welcoming, and the menu offers a wide variety of dishes. Everything we tried was delicious and tasted authentic. The portion sizes are generous, and the prices are very reasonable. The restaurant is clean and cozy, and we felt comfortable dining in. We will definitely be coming back! French Wonderful experience at this charming French restaurant! The food was fantastic and very reasonably priced for the quality. The atmosphere was cozy and romantic, perfect for a date night or special occasion. The service was excellent, with friendly staff who were knowledgeable about the menu and wine pairings. Highly recommend the escargot and beef bourguignon. Can’t wait to come back and try more dishes!
Within 7.6K synthetic reviews, we find that GPT-3.5 exhibits many of the same tendencies as Yelp consumers, such as othering Asian and Latin American restaurants through frames of authenticity and exoticism (Table 6) and framing European restaurants with higher prestige compared to Asian and Latin American restaurants (Table 7). Example features most strongly associated with each region (Table 5) exemplify additional framing disparities, such as using the stereotype of tropicalism for Latin American restaurants (e.g., lively, vibrant) (Martynuska 2016). Nonetheless, we also observe differences between actual and synthetic reviews. For instance, we see that immigrant restaurants are framed as less prototypical compared to non-immigrant restaurants. However, qualitative inspection reveals that the main overlap between synthetic reviews and our prototypicality lexicon is due to the word classic (rather than words like stereotypical or standard), suggesting that our measurement of prototypicality captures a construct more akin to “iconicity” in the context of synthetic reviews.
| Region | Dominant features |
|---|---|
| US | southern (18.5) fried (9.8) soulful (5.1) rustic (4.9) crispy (4.4) cheesy (4.4) slow (2.9) classic (2.5) |
| gooey (2.5) dry (2.5) mediocre (2.4) terrible (2.2) local (2.2) creamy (2.1) overpriced (2.1) | |
| Eur. | romantic (5.8) charming (4.9) traditional (4.8) hearty (4.1) mashed (3.5) creamy (3.2) perfect (3.1) cozy (2.9) |
| warm (2.6) red (2.4) stuffy (2.1) soft (2.1) exquisite (2.0) stuffed (2.0) rich (2.0) thin (2.0) | |
| Lat. | vibrant (11.2) lively (11.2) colorful (6.7) authentic (4.7) black (3.6) energetic (3.4) fun (3.4) shredded (3.2) festive (3.1) |
| moist (2.6) upbeat (2.4) homemade (2.3) seasoned (2.2) mixed (2.1) tender (2.1) generous (2.0) friendly (2.0) | |
| Asia | wide (6.0) fresh (5.0) aromatic (4.9) clean (4.1) modern (4.1) sticky (3.9) iced (3.7) fragrant (3.5) spicy (3.5) |
| beautiful (3.2) authentic (3.2) elegant (3.2) steamed (3.2) serene (3.1) hot (2.9) soothing (2.6) helpful (2.6) peaceful (2.5) | |
| balanced (2.4) comfortable (2.3) marinated (2.3) pickled (2.2) light (2.1) quick (2.1) traditional (2.1) stunning (2.1) |
| Immigrant | ||||
|---|---|---|---|---|
| Eur. | Lat.Am. | Asia | (aggregate) | |
| Exot. | -0.01 | 0.09** | 0.07* | 0.05 |
| Proto. | -0.09** | -0.14*** | -0.23*** | -0.15*** |
| Auth. | 0.32*** | 0.33*** | 0.30*** | 0.32*** |
| Eur. | Lat.Am. | Asia | |
|---|---|---|---|
| Positivity | 0.13* | -0.13*** | -0.08*** |
| Luxury | 0.02 | -0.13*** | 0.06 |
| Hygiene (aggregate) | -0.18*** | -0.14 | 0.04*** |
| Hygiene (clean) | -0.15*** | -0.09 | 0.09*** |
| Hygiene (dirty) | -0.10* | -0.11 | -0.03* |
| Cost (aggregate) | -0.10* | -0.11 | -0.11 |
| Cost (expensive) | -0.06 | -0.09 | 0.15** |
| Cost (cheap) | -0.08 | -0.06 | 0.02** |
Discussion
In this work, we examined the framing of immigrant and non-immigrant cuisines within 2.1M Yelp reviews of US-based restaurants in 14 states. Despite the reputation of the US as a culinary melting pot, we find evidence for systematic othering of immigrant cuisines through socially constructed frames of exoticism, prototypicality, and authenticity. Further, within immigrant cuisines, we find that those associated with less assimilated immigrant groups are systematically framed as less positive and lower status. Our results are robust to differences in restaurant price, average star rating, and neighborhood income and racial diversity. In addition, we show that LLMs replicate many of the same framing tendencies.
Beyond creating representational harms, such as reinforcing negative perceptions of immigrant cultures, framing differences in online restaurant reviews may contribute to economic inequalities, since reviews stand to influence the decisions of millions of consumers. Future work could seek to better understand and quantify the link between differences in review language and restaurant revenue.
There are a number of limitations in our current studies that future work could address. For example, future work could adopt finer-grained controls for restaurant quality beyond average star rating and price point. We also made a number of simplifying assumptions in locating individual cuisines within broader culinary regions, and neglected entire regions due to data sparsity. Future work could explore within-region and within-cuisine variance more carefully, as well as study a wider range of cuisines. In addition, future work could study a more representative sample of US cities, as well as review language beyond the US.
Finally, our work points to a need for strategies to combat representational harms in online food discourse. Controlled psychological experiments could reveal the deeper mechanisms underlying observed framing differences, and AI-mediated tools could intervene during the review-writing process. For instance, web plug-ins could alert reviewers to harmful linguistic choices that they may not have been aware of and provide suggestions for rephrasing.
Related work
Our work extends theoretical and empirical work on the sociology of taste (Bourdieu 1987; Peterson 1997, 2005; Johnston and Baumann 2007; Williamson et al. 2009), especially as it relates to ethnic distinction (Janer 2005; Liu 2009; Ray 2007, 2017). We also draw from the broader theoretical literatures on othering, authenticity, and stereotyping (Said 1978; Martynuska 2016) and work examining these attitudes in Yelp reviews (Hirose and Pih 2011; Kovács, Carroll, and Lehman 2014; Gottlieb 2015; Boch, Jiménez, and Roesler 2021) and food contexts more broadly (Freedman and Jurafsky 2011; Lee et al. 2012; Chhabra, Lee, and Zhao 2013; Oleschuk 2017). Our work is also inspired by computational work studying representational harms in public discourse of race and ethnicity (Mendelsohn, Budak, and Jurgens 2021; Card et al. 2022; Ziems and Yang 2021) and machines (Crawford 2017; Barocas, Hardt, and Narayanan 2017; Blodgett et al. 2020; Wang et al. 2022; Cheng, Durmus, and Jurafsky 2023).
Analyzing broader social aspects of food through online text has been an active area of research. Previous work leveraged various data sources collected via the web, including menus (Jurafsky et al. 2016; Turnwald et al. 2017, 2020), search engine logs (West, White, and Horvitz 2013; Vosen and Schmidt 2011; Gligorić et al. 2022), online recipes (Wagner, Singer, and Strohmaier 2014a, b; Sajadmanesh et al. 2017; Rokicki, Trattner, and Herder 2018; Trattner, Moesslang, and Elsweiler 2018; Tobey et al. 2019), reviewing platforms (Danescu-Niculescu-Mizil et al. 2013; Chorley et al. 2016; Weber, Story, and Harnack 2006; Jurafsky et al. 2014; Harris et al. 2012), crowdsourcing platforms (Howell et al. 2016; Dunford et al. 2014), and geo-located signals (Sadilek et al. 2018).
Given the popularity and prevalence of food-related content, ICWSM research, in particular, has focused on studying diets through social media content, such as Instagram (Phan and Gatica-Perez 2017; Garimella, Alfayad, and Weber 2016; Sharma and De Choudhury 2015; Ofli et al. 2017) and Twitter (Mejova, Weber, and Macy 2015; Abbar, Mejova, and Weber 2015; Mejova, Abbar, and Haddadi 2016; Mejova et al. 2015; Widener and Li 2014; Gligorić, Djordjević, and West 2022).
Our work is also related to studies of the impact of social media reviews on restaurant performance (Luca 2016; Kim, Li, and Brymer 2016; Wang, Kim, and Kim 2021; Yu and Margolin 2022) and suggests directions for finer-grained impacts to study, as well as impacts that may affect ethnic groups differentially.
Ethics statement
All review data provided by the Yelp Academic Dataset is posted publicly and anonymized. We perform all our analyses on aggregate and avoid targeting any specific users or restaurants. We rely on restaurants’ self-declared cuisine tags rather than inferring cuisine labels from other attributes, which may encourage biased profiling practices. We also use purely geographic criteria to locate individual cuisines within broader regions, so as to limit similar profiling biases.
Due to data sparsity, we regrettably omitted cuisines from Africa, the Middle East, and Oceania, in addition to many individual countries and culinary traditions. We further excluded intersectional cuisines with connections to multiple regions, such as Caribbean cuisine and Tex-Mex. In next steps, we aim to explicitly include omitted cuisines to resist academic tendencies of marginalizing minorities. We also recognize that the Yelp user base skews toward college-educated people with high incomes.111111https://www.yelp-press.com/company/fast-facts/default.aspx Our findings should therefore not be taken as representative of US consumers as a whole.
In addition, our experiments with LLMs may engender risks associated with adversarial use (e.g., abuse of our prompting procedure to “review bomb”121212https://www.seattletimes.com/business/how-review-bombing-can-tank-a-book-before-its-published/ businesses with negative reviews).
Finally, by studying stereotypes and frames of cultural prejudice, we risk further reifying these constructs. At the same time, we hope this work stimulates reflection, conversation, and additional research to interrogate and dismantle the preconceived attitudes that each of us as a consumer and restaurant-goer may hold.
References
- Abbar, Mejova, and Weber (2015) Abbar, S.; Mejova, Y.; and Weber, I. 2015. You tweet what you eat: Studying food consumption through Twitter. In Proc. of the 33rd Conference on Human Factors in Computing Systems (CHI).
- Barocas, Hardt, and Narayanan (2017) Barocas, S.; Hardt, M.; and Narayanan, A. 2017. Fairness in machine learning. Nips tutorial, 1: 2017.
- Blodgett et al. (2020) Blodgett, S. L.; Barocas, S.; Daumé III, H.; and Wallach, H. 2020. Language (technology) is power: A critical survey of” bias” in nlp. arXiv preprint arXiv:2005.14050.
- Boch, Jiménez, and Roesler (2021) Boch, A.; Jiménez, T.; and Roesler, K. 2021. Mainstream flavor: Ethnic cuisine and assimilation in the United States. Social Currents, 8(1): 64–85.
- Bourdieu (1987) Bourdieu, P. 1987. Distinction: A social critique of the judgement of taste. Harvard University Press.
- Card et al. (2022) Card, D.; Chang, S.; Becker, C.; Mendelsohn, J.; Voigt, R.; Boustan, L.; Abramitzky, R.; and Jurafsky, D. 2022. Computational analysis of 140 years of US political speeches reveals more positive but increasingly polarized framing of immigration. Proceedings of the National Academy of Sciences, 119(31): e2120510119.
- Cheng, Durmus, and Jurafsky (2023) Cheng, M.; Durmus, E.; and Jurafsky, D. 2023. Marked Personas: Using Natural Language Prompts to Measure Stereotypes in Language Models. arXiv preprint arXiv:2305.18189.
- Chhabra, Lee, and Zhao (2013) Chhabra, D.; Lee, W.; and Zhao, S. 2013. Epitomizing the “other” in ethnic eatertainment experiences. Leisure/Loisir, 37(4): 361–378.
- Chorley et al. (2016) Chorley, M. J.; Rossi, L.; Tyson, G.; and Williams, M. J. 2016. Pub crawling at scale: tapping untappd to explore social drinking. In Proc. of the 10th International AAAI Conference on Web and Social Media (ICWSM).
- Crawford (2017) Crawford, K. 2017. The Trouble with Bias. NIPS.
- Danescu-Niculescu-Mizil et al. (2013) Danescu-Niculescu-Mizil, C.; West, R.; Jurafsky, D.; Leskovec, J.; and Potts, C. 2013. No country for old members: User lifecycle and linguistic change in online communities. In Proc. of the 22nd International Conference on World Wide Web (TheWebConf).
- Dunford et al. (2014) Dunford, E.; Trevena, H.; Goodsell, C.; Ng, K. H.; Webster, J.; Millis, A.; Goldstein, S.; Hugueniot, O.; and Neal, B. 2014. FoodSwitch: a mobile phone app to enable consumers to make healthier food choices and crowdsourcing of national food composition data. JMIR mHealth and uHealth.
- Fast, Chen, and Bernstein (2016) Fast, E.; Chen, B.; and Bernstein, M. S. 2016. Empath: Understanding topic signals in large-scale text. In Proceedings of the 2016 CHI conference on human factors in computing systems, 4647–4657.
- Freedman and Jurafsky (2011) Freedman, J.; and Jurafsky, D. 2011. Authenticity in America: Class distinctions in potato chip advertising. Gastronomica: The journal of food and culture, 11(4).
- Garimella, Alfayad, and Weber (2016) Garimella, V. R. K.; Alfayad, A.; and Weber, I. 2016. Social media image analysis for public health. In Proc. of the 2016 Conference on Human Factors in Computing Systems (CHI).
- Gligorić et al. (2022) Gligorić, K.; Chiolero, A.; Kıcıman, E.; White, R. W.; and West, R. 2022. Population-scale dietary interests during the COVID-19 pandemic. Nature Communications, 13(1).
- Gligorić, Djordjević, and West (2022) Gligorić, K.; Djordjević, I.; and West, R. 2022. Biased Bytes: On the Validity of Estimating Food Consumption from Digital Traces. Proc. of the ACM Conference on Computer Supported Cooperative Work and Social Computing (CSCW).
- Golash-Boza (2016) Golash-Boza, T. 2016. A critical and comprehensive sociological theory of race and racism. Sociology of race and ethnicity, 2(2): 129–141.
- Gottlieb (2015) Gottlieb, D. 2015. “Dirty, Authentic… Delicious” Yelp, Mexican Restaurants, and the Appetites of Philadelphia’s New Middle Class. Gastronomica: The Journal of Food and Culture, 15(2): 39–48.
- Harris et al. (2012) Harris, J. L.; Speers, S. E.; Schwartz, M. B.; and Brownell, K. D. 2012. US food company branded advergames on the Internet: Children’s exposure and effects on snack consumption. Journal of Children and Media, 6(1).
- Hirose and Pih (2011) Hirose, A.; and Pih, K. K.-H. 2011. ‘No Asians working here’: racialized otherness and authenticity in gastronomical Orientalism. Ethnic and Racial studies, 34(9): 1482–1501.
- Howell et al. (2016) Howell, P. D.; Martin, L. D.; Salehian, H.; Lee, C.; Eastman, K. M.; and Kim, J. 2016. Analyzing taste preferences from crowdsourced food entries. In Proc. of the 6th International Conference on Digital Health Conference (DH).
- Janer (2005) Janer, Z. 2005. Cooking Eurocentrism: Towards a Critical History of French Cuisine. In joint meetings of the Agriculture, Food and Human Values Society and Association for the Study of Food and Society, Portland, June.
- Johnston and Baumann (2007) Johnston, J.; and Baumann, S. 2007. Democracy versus distinction: A study of omnivorousness in gourmet food writing. American Journal of Sociology, 113(1): 165–204.
- Jurafsky et al. (2016) Jurafsky, D.; Chahuneau, V.; Routledge, B.; and Smith, N. 2016. Linguistic markers of status in food culture: Bourdieu’s distinction in a menu corpus. Journal of Cultural Analytics, 1(1).
- Jurafsky et al. (2014) Jurafsky, D.; Chahuneau, V.; Routledge, B. R.; and Smith, N. A. 2014. Narrative framing of consumer sentiment in online restaurant reviews. First Monday.
- Kim, Li, and Brymer (2016) Kim, W. G.; Li, J. J.; and Brymer, R. A. 2016. The impact of social media reviews on restaurant performance: The moderating role of excellence certificate. International Journal of Hospitality Management, 55: 41–51.
- Kovács, Carroll, and Lehman (2014) Kovács, B.; Carroll, G. R.; and Lehman, D. W. 2014. Authenticity and consumer value ratings: Empirical tests from the restaurant domain. Organization science, 25(2): 458–478.
- Lee et al. (2012) Lee, L. E.; Niode, O.; Simonne, A. H.; and Bruhn, C. M. 2012. Consumer perceptions on food safety in Asian and Mexican restaurants. Food Control, 26(2): 531–538.
- Liu (2009) Liu, H. 2009. Chop Suey as imagined authentic Chinese food: the culinary identity of Chinese restaurants in the United States. Journal of Transnational American Studies, 1(1).
- Luca (2016) Luca, M. 2016. Reviews, reputation, and revenue: The case of Yelp. com. Com (March 15, 2016). Harvard Business School NOM Unit Working Paper, (12-016).
- Martynuska (2016) Martynuska, M. 2016. The exotic other: Representations of Latina tropicalism in US popular culture. Journal of Language and Cultural Education, 4(2): 73–81.
- Mejova, Abbar, and Haddadi (2016) Mejova, Y.; Abbar, S.; and Haddadi, H. 2016. Fetishizing food in digital age:# foodporn around the world. In Proc. of the 10th International AAAI Conference on Web and Social Media (ICWSM).
- Mejova et al. (2015) Mejova, Y.; Haddadi, H.; Abbar, S.; Ghahghaei, A.; and Weber, I. 2015. Dietary habits of an expat nation: Case of Qatar. In 2015 International Conference on Healthcare Informatics.
- Mejova, Weber, and Macy (2015) Mejova, Y.; Weber, I.; and Macy, M. W. 2015. Twitter: A digital socioscope.
- Mendelsohn, Budak, and Jurgens (2021) Mendelsohn, J.; Budak, C.; and Jurgens, D. 2021. Modeling Framing in Immigration Discourse on Social Media. In Proceedings of the 2021 Conference of the North American Chapter of the Association for Computational Linguistics: Human Language Technologies, 2219–2263. Online: Association for Computational Linguistics.
- Miller (1995) Miller, G. A. 1995. WordNet: a lexical database for English. Communications of the ACM, 38(11): 39–41.
- Monroe, Colaresi, and Quinn (2008) Monroe, B. L.; Colaresi, M. P.; and Quinn, K. M. 2008. Fightin’words: Lexical feature selection and evaluation for identifying the content of political conflict. Political Analysis, 16(4): 372–403.
- Muchnik, Aral, and Taylor (2013) Muchnik, L.; Aral, S.; and Taylor, S. J. 2013. Social influence bias: A randomized experiment. Science, 341(6146): 647–651.
- Ofli et al. (2017) Ofli, F.; Aytar, Y.; Weber, I.; Al Hammouri, R.; and Torralba, A. 2017. Is saki# delicious?: The food perception gap on Instagram and its relation to health. In Proc. of the 26th International Conference on World Wide Web (TheWebConf).
- Oleschuk (2017) Oleschuk, M. 2017. Foodies of color: Authenticity and exoticism in omnivorous food culture. Cultural Sociology, 11(2): 217–233.
- O’Toole and Natu (2013) O’Toole, A. J.; and Natu, V. 2013. Computational perspectives on the other-race effect. Visual Cognition, 21(9-10): 1121–1137.
- Paik et al. (2021) Paik, C.; Aroca-Ouellette, S.; Roncone, A.; and Kann, K. 2021. The World of an Octopus: How Reporting Bias Influences a Language Model’s Perception of Color. arXiv preprint arXiv:2110.08182.
- Peterson (1997) Peterson, R. A. 1997. The rise and fall of highbrow snobbery as a status marker. Poetics, 25(2-3): 75–92.
- Peterson (2005) Peterson, R. A. 2005. Problems in comparative research: The example of omnivorousness. poetics, 33(5-6): 257–282.
- Phan and Gatica-Perez (2017) Phan, T.-T.; and Gatica-Perez, D. 2017. Healthy# fondue# dinner: analysis and inference of food and drink consumption patterns on instagram. In Proc. of the 16th International Conference on Mobile and Ubiquitous Multimedia.
- Ray (2007) Ray, K. 2007. Ethnic succession and the new American restaurant cuisine. The restaurants book: Ethnographies of where we eat, 97: 113.
- Ray (2017) Ray, K. 2017. Bringing the immigrant back into the sociology of taste. Appetite, 119: 41–47.
- Rhodes, Leslie, and Tworek (2012) Rhodes, M.; Leslie, S.-J.; and Tworek, C. M. 2012. Cultural transmission of social essentialism. Proceedings of the National Academy of Sciences, 109(34): 13526–13531.
- Rokicki, Trattner, and Herder (2018) Rokicki, M.; Trattner, C.; and Herder, E. 2018. The impact of recipe features, social cues and demographics on estimating the healthiness of online recipes. In Proc. of the 12th International AAAI Conference on Web and Social Media (ICWSM).
- Sadilek et al. (2018) Sadilek, A.; Caty, S.; DiPrete, L.; Mansour, R.; Schenk, T.; Bergtholdt, M.; Jha, A.; Ramaswami, P.; and Gabrilovich, E. 2018. Machine-learned epidemiology: real-time detection of foodborne illness at scale. npj Digital Medicine, 1(1).
- Said (1978) Said, E. 1978. Introduction to orientalism. 1978, 1279–95.
- Sajadmanesh et al. (2017) Sajadmanesh, S.; Jafarzadeh, S.; Ossia, S. A.; Rabiee, H. R.; Haddadi, H.; Mejova, Y.; Musolesi, M.; Cristofaro, E. D.; and Stringhini, G. 2017. Kissing cuisines: Exploring worldwide culinary habits on the web. In Proc. of the 26th International Conference on World Wide Web (TheWebConf).
- Sharma and De Choudhury (2015) Sharma, S. S.; and De Choudhury, M. 2015. Measuring and characterizing nutritional information of food and ingestion content in Instagram. In Proc. of the 24th International Conference on World Wide Web (TheWebConf).
- Tausczik and Pennebaker (2010) Tausczik, Y. R.; and Pennebaker, J. W. 2010. The psychological meaning of words: LIWC and computerized text analysis methods. Journal of lang. & social psych., 29(1): 24–54.
- Tobey et al. (2019) Tobey, L. N.; Mouzong, C.; Angulo, J. S.; Bowman, S.; and Manore, M. M. 2019. How low-income mothers select and adapt recipes and implications for promoting healthy recipes online. Nutrients, 11(2).
- Trattner, Moesslang, and Elsweiler (2018) Trattner, C.; Moesslang, D.; and Elsweiler, D. 2018. On the predictability of the popularity of online recipes. EPJ Data Science, 7(1).
- Turnwald et al. (2020) Turnwald, B. P.; Anderson, K. G.; Jurafsky, D.; and Crum, A. J. 2020. Five-star prices, appealing healthy item descriptions? Expensive restaurants’ descriptive menu language. Health Psychology.
- Turnwald et al. (2017) Turnwald, B. P.; Jurafsky, D.; Conner, A.; and Crum, A. J. 2017. Reading between the menu lines: Are restaurants’ descriptions of “healthy” foods unappealing? Health Psychology, 36(11).
- Veselovsky, Ribeiro, and West (2023) Veselovsky, V.; Ribeiro, M. H.; and West, R. 2023. Artificial Artificial Artificial Intelligence: Crowd Workers Widely Use Large Language Models for Text Production Tasks. arXiv preprint arXiv:2306.07899.
- Vosen and Schmidt (2011) Vosen, S.; and Schmidt, T. 2011. Forecasting private consumption: survey-based indicators vs. Google trends. Journal of Forecasting, 30(6).
- Wagner, Singer, and Strohmaier (2014a) Wagner, C.; Singer, P.; and Strohmaier, M. 2014a. The nature and evolution of online food preferences. EPJ Data Science, 3.
- Wagner, Singer, and Strohmaier (2014b) Wagner, C.; Singer, P.; and Strohmaier, M. 2014b. Spatial and temporal patterns of online food preferences. In Proc. of the 23rd International Conference on World Wide Web (TheWebConf).
- Wang et al. (2022) Wang, A.; Barocas, S.; Laird, K.; and Wallach, H. 2022. Measuring representational harms in image captioning. In 2022 ACM Conference on Fairness, Accountability, and Transparency, 324–335.
- Wang, Kim, and Kim (2021) Wang, Y.; Kim, J.; and Kim, J. 2021. The financial impact of online customer reviews in the restaurant industry: A moderating effect of brand equity. International Journal of Hospitality Management, 95: 102895.
- Weber, Story, and Harnack (2006) Weber, K.; Story, M.; and Harnack, L. 2006. Internet food marketing strategies aimed at children and adolescents: A content analysis of food and beverage brand web sites. Journal of the American Dietetic Association, (9).
- West, White, and Horvitz (2013) West, R.; White, R. W.; and Horvitz, E. 2013. From Cookies to Cooks: Insights on Dietary Patterns via Analysis of Web Usage Logs. In Proc. of the 22nd International Conference on World Wide Web (TheWebConf).
- Widener and Li (2014) Widener, M. J.; and Li, W. 2014. Using geolocated Twitter data to monitor the prevalence of healthy and unhealthy food references across the US. Applied Geography, 54.
- Williamson et al. (2009) Williamson, D.; Tregidga, H.; Harris, C.; and Keen, C. 2009. The working engines of distinction: Discourse for main course in restaurant reviews. Journal of Hospitality and Tourism Management, 16(1): 55–61.
- Yu and Margolin (2022) Yu, C.; and Margolin, D. 2022. Heightened scrutiny: The unequal impact of online hygiene scores on restaurant reviews. New Media & Society, 14614448221127674.
- Ziems and Yang (2021) Ziems, C.; and Yang, D. 2021. To protect and to serve? analyzing entity-centric framing of police violence. arXiv preprint arXiv:2109.05325.
- Zukin, Lindeman, and Hurson (2017) Zukin, S.; Lindeman, S.; and Hurson, L. 2017. The omnivore’s neighborhood? Online restaurant reviews, race, and gentrification. Journal of Consumer Culture, 17(3): 459–479.
Appendix

Full framing lexicons
Exoticism
abnormal, bizarre, different, distinct, distinctive, exotic, fascinating, foreign, intriguing, odd, peculiar, strange, unfamiliar, unnatural, unsettling, unusual, weird
Protoypicality
archetypal, archetype, average, basic, characteristic, classic, classical, common, commonplace, definitive, emblematic, essential, everyday, exemplary, generic, habitual, mundane, norm, normal, ordinary, predictable, quintessential, regular, standard, stereotypical, typical, unremarkable, usual
Authenticity
accurate, authentic, hand-made, handmade, home-made, homemade, homey, humble, idyllic, laid-back, laidback, legit, legitimate, modest, original, pastoral, proper, quaint, real, real deal, rural, rustic, simple, traditional, true, unassuming, uncomplicated, unfussy, unpretentious
Authenticity-simplicity
hand-made, handmade, home-made, homemade, homey, humble, idyllic, laid-back, laidback, modest, pastoral, quaint, rural, rustic, simple, unassuming, uncomplicated, unfussy, unpretentious
Positivity
keen, terrific, beloved, gorgeous, delighful, attractive, superior, pretty, likeable, fabulous, romantic, tender, wonderful, original, awesome, beautiful, bold, glamourous, nice, fantastic, grand, charming, fab, divine, delicate, ideal, perfect, pleasing, aok, precious, cute, inspiring, virtuosic, fun, jolly, agreeable, pleasant, graceful, splendid, brilliant, good, impressive, great, merry, magnificent, super, elegant, delectable, rich, optimal, scrumptious, fine, excellent, satisfying, flawless, wow, amazing, pleasing, sentimental, positive, cool, heavenly, creative, exciting, playful, special, lovely, dynamic, pleasurable, cosy, cozy, inviting, welcoming, calming, relaxing
Luxury
alluring, astonishing, breathtaking, classy, dazzling, delicate, dignified, elaborate, elegant, enchanting, enticing, exquisite, extraordinary, extravagant, fashionable, glamorous, glorious, graceful, grand, lavish, lush, luxurious, magnificent, majestic, marvelous, ornate, outstanding, picturesque, pleasing, polished, posh, refined, regal, remarkable, sleek, sophisticated, spectacular, stylish, tasteful, voluptuous
Cost/Value
affordable, bargain, budget, cheap, costly, economical, exorbitant, expensive, inexpensive, low-cost, low-priced, low cost, low priced, overpriced, pricey, uncostly, unexpensive
Hygiene
clean, dirty, disgusting, filthy, grimy, gross, hygienic, messy, nasty, sanitary, smelly, spotless, stinking, stinky, tidy, unhygienic, unsanitary
Per-cuisine analyses
User-controlled analysis
We replicate analyses from Study 1 and 2 on 89 high-volume reviewers that contribute 100 or more reviews and at least 10 reviews across each cuisine region (N=17K total reviews). We fit linear mixed effects models with random effects per user and fixed effects per cuisine region. Results, when significant, corroborate main study results (see Figures 17-18).
Top-cuisine removed analysis
LLM prompting
For reproducibility, below we state the exact prompt template used to collect the synthetic reviews.
A customer posted the following restaurant review to an online restaurant review website: span class=“headline” title=“[sentiment] review about a [price point] [cuisine] restaurant, focused on the [aspect in focus]”
The template was filled with the following specific values:
-
1.
sentiment: very positive, positive, neutral, negative, very negative
-
2.
price point: $ ($10 and under), $$ ($10-$25), $$$ ($25-$45), $$$$ ($50 and up)
-
3.
cuisine: listed in table 1
-
4.
aspect in focus: staff, waitstaff, employees, waiter, waitress, food, drinks, main courses, appetizers, desserts, place, spot, atmosphere, experience, ambiance