Optical Studies of Seven Bright Southern Cataclysmic Variable Stars
Abstract
We report spectroscopic observations of seven bright southern cataclysmic variable stars, collected on a single two-week observing run using the 1.9-m Radcliffe telescope at the South African Astronomical Observatory. We used radial velocity time series, in some cases in combination with other data, to determine or clarify orbital periods for five of them, namely ATO J061.147831.0634, BMAM-V547, MGAB-V202, NSV 4202, and V1147 Cen. For BMAM-V547, we use data from the Transiting Exoplanet Survey Satellite (TESS) to corroborate and sharpen the orbital period; the TESS data also show a photometric period near 3.93 d, likely indicating precession of the accretion disk. Also, we find a periodic modulation in the radial velocities of the SU UMa-type dwarf nova Var Ret2005, but are unable to specify a unique cycle count. Finally, we show a spectrum of ASASSN-V J061528.41412007.3 that appears typical of a luminous novalike variable.
1 INTRODUCTION
Cataclysmic variables (CVs) are a subclass of mass-exchange binary stars, in which a white dwarf (WD; the primary) accretes matter from a more extended companion (or secondary) that fills its Roche critical lobe. Most commonly, the companion resembles a main-sequence star, but with differences in detail caused by the complicated history of mass transfer (Knigge, 2006; Knigge et al., 2011). Material transferred from the secondary through the inner Lagrangian point usually settles into an accretion disk around the white dwarf primary, and in most CVs the disk dominates the optical luminosity.
The class is diverse; Warner (1995) gives a comprehensive review. If the WD has a strong magnetic field, it can disrupt the formation of the disk; material instead threads onto the field and falls down the field lines onto the polar caps, leading to an AM Herculis star, or ‘polar’, so-called due to the polarization of their optical light. If the accretion is very slow, the disk can be faint enough for the WD to make a strong spectral contribution, especially in the ultraviolet; such systems tend to have very short orbital periods . If is 4-6 hours or longer, the secondary’s contribution to the combined spectrum often becomes visible. CVs with 1 d are rare.
As their name implies, all CVs are variable stars. Accretion disks evidently are subject to a limit-cycle instability, leading to dramatic brightening of typically a few magnitudes, developing over hours and lasting for several days, during which enough mass is dropped onto the white dwarf to re-establish the low-density state of the disk. Systems that do this are called dwarf novae (DNae). Most known CVs are DNae, and there is an elaborate taxonomy that describes their outbursts. Other disk CVs persist in their high-accretion states; these are the novalike variables (NLs).
Spectroscopically, DNe at minimum light show strong Balmer and He I lines, greatly broadened by motions in the disk, while NLs show strong continua. Some novalikes show almost no emission, while others show complex line profiles that vary with orbital phase; most of these are SW Sextantis stars (Thorstensen et al., 1991; Rodríguez-Gil et al., 2007).
Population. All CVs vary, and most call attention to themselves through their optical variation, though many have been discovered because of their unusually blue or ultraviolet color, or through X-ray emission. The data have become rich and complete enough that Pala et al. (2020) created a sample of CVs within 110 pc that they claim is essentially complete. However, the pace of discovery remains extremely high due to the proliferation of high-cadence surveys of sufficient depth such as ZTF (Bellm et al., 2019), ASAS-SN (Shappee et al., 2014), and ATLAS (Tonry et al., 2018). With increasingly-complete samples, it should be possible to extend Pala’s project to much greater depth. Complete samples are key observables for CV population synthesis models such as those of Goliasch & Nelson (2015) and Kalomeni et al. (2016).
We undertook this study to elucidate the nature of several CVs and candidate CVs in the south celestial hemisphere, which remains somewhat less explored than the north. We selected our targets from a master CV list maintained by the lead author. Because of time and aperture constraints, we targeted CVs that remained little-studied, in particular objects with unknown or uncertain .
2 OBSERVATIONS
All our observations are from the 1.9 m Radcliffe telescope operated by the South African Astronomical Observatory. We used the SpUpNIC spectrograph (Crause et al., 2019) with Grating 6, which covered from 4220 to 6860 Å. The 1.′′1 slit yielded a FWHM resolution of Å. Most of our individual exposures were between 8 and 20 min. We took spectra of a CuAr arc at each new setting of the telescope, and about once an hour as the telescope tracked. For our final calibration we used the night-sky airglow lines, especially the strong [OI] lines at 5577 and 6300, to adjust the calibration slightly, typically by km s-1. The night-sky adjustment failed for a few spectra; for those, we reverted to the arc calibration. When the weather was clear, we observed flux standards in twilight. From the scatter in the standard star normalizations – most likely caused by seeing variations and the narrow slit – we estimate that the absolute calibration is accurate to per cent, but the relative flux scale should be better than that.
To reduce the data we used a combination of IRAF routines called from pyraf, and python scripts that made extensive use of astropy routines. In particular, we extracted 1-dimensional spectra from the images using our own implementation of the variance-weighted extraction algorithm of Horne (1986), as well as the modified wavelength calibration described earlier.
We measured radial velocities of the H emission line – the strongest emission feature in all these objects – using convolution techniques described by Schneider & Young (1980) and Shafter (1983). When a contribution from a late-type star was present, we also measured its radial velocity using the fxcor task in IRAF, which implements a cross-correlation technique similar to Tonry & Davis (1979). For the correlation template, we used the sum of 76 spectra of IAU velocity standards, mostly early K stars, which were individually shifted to zero velocity before summing.
To search for periods we created an oversampled grid of test frequencies , and at each fit the velocities with a general least-squares sinusoid
and transformed this to
The periodograms we present are derived from these fits; the quantity plotted as a function of is
where the are the measured velocities, and are their estimated uncertainties. The term in the denominator arises because at each , the three parameters , , and are adjusted.
When a late-type star was present, we estimated its spectral type and contribution to the total spectrum using the procedure described by Peters & Thorstensen (2005).
Table 2 lists the stars we observed. The first column gives the primary name used in the American Association of Variable Star Observer’s International Variable Star Index (VSX) 111 at https://www.aavso.org/vsx/. Some of these objects have multiple designations, generally because they have appeared in multiple surveys, and VSX lists these designations. All the objects here are variable, so the magnitude is only illustrative. In the discussion below, we shorten the lengthier coordinate-based names.
| VSX Name | SIMBAD name | ||||
|---|---|---|---|---|---|
| [h:m:s] | [d:m:s] | [mag] | [pc] | ||
| ATO J061.147831.0634 | 4 04 35.483 | 31 03 48.38 | 14.4 | 481(4) | Gaia 19fes |
| Var Ret2005 | 4 11 09.288 | 59 11 16.27 | 16.1 | 329(4) | EC 04102-5918 |
| ASASSN-V J061528.41412007.3 | 6 15 28.406 | 41 20 07.24 | 13.2 | 636(6) | UCAC4 244-008602 |
| BMAM-V547 | 6 57 33.663 | 53 34 22.03 | 14.1 | 1072(17) | Gaia DR3 … |
| MGAB-V202 | 8 18 08.715 | 42 34 16.91 | 14.1 | 783(11) | Gaia DR3 … |
| NSV 4202 | 8 39 18.497 | 70 32 41.64 | 16.6 | 730(24) | OGLE MC-DN-32 |
| V1147 Cen | 13 00 57.58 | 49 12 12.46 | 12.6 | 351(3) | V* V1147 Cen |
Note. — The celestial coordinates and distance estimates are from the Gaia Data Release 2 (Gaia Collaboration et al., 2016, 2018). Distances are inverses of the parallax, without further adjustment. The SIMBAD designations in the final column omit the Gaia numbers for the sake of space. SIMBAD entries for these objects can be found using coordinates.
We list all our radial velocities in Table 3, and give parameters of the best-fitting sinusoids in Table 4. The next section discusses the individual stars in greater detail.
| Object | TimeaaTime of mid-exposure in Barycentric Julian Days, minus 2,400,000, referred to UTC. | ||||
|---|---|---|---|---|---|
| d | km s-1 | km s-1 | km s-1 | km s-1 | |
| ATO J06131 | 59990.2968 | ||||
| ATO J06131 | 59990.3024 | ||||
| ATO J06131 | 59990.3096 | ||||
| ATO J06131 | 59990.3180 | ||||
| ATO J06131 | 59991.2852 | ||||
| ATO J06131 | 59991.2956 | ||||
| ATO J06131 | 59991.3061 |
Note. — Radial velocities used in this study. The time argument is referred to UTC (not TAI) and is the barycentric julian date of mid-exposure minus 2,400,000., which differs from MJD by 0.5 d. The full table is published as a machine-readable table, and the first few lines are shown here to indicate its form and content.
| Data set | ||||||
|---|---|---|---|---|---|---|
| BJD | [d] | km s-1 | km s-1 | km s-1 | ||
| ATO J061-31 abs. | 59994.2295(13) | 0.245282aaPeriod held fixed at twice Monard’s value. | 132(5) | 25 | 11 | |
| ATO J061-31 emn. | 59994.363(4) | 0.245282aaPeriod held fixed at twice Monard’s value. | 93(10) | 25 | 23 | |
| BMAM-V547 | 59986.376(9) | 0.15536bbPeriod chosen corresponds to photometric modulation in TESS data. | 19(7) | 28 | 17 | |
| MGAB-V202 wings | 59988.401(2) | 0.15612(10) | 188(19) | 76 | 57 | |
| NSV-4202 | 59989.553(4) | 0.2839(6) | 80(7) | 31 | 16 | |
| V1147 Cen abs. | 59997.3812(13) | 0.4190(5)bbPeriod chosen corresponds to photometric modulation in TESS data. | 152(3) | 24 | 8 | |
| V1148 Cen emn. | 59997.613(2) | 0.4190 | 134(5) | 24 | 12 |
3 THE INDIVIDUAL STARS
3.1 ATO J06131
The Catalina light curve (Drake et al., 2009) of this bright dwarf nova shows a relatively steady minimum near , and a single outburst to . It has been followed for some years, but there are evidently no spectra in the literature. is not definitively determined; VSX lists 0.122641(4) d ( 2.94 h) from a photometric modulation at minimum light, attributed to B. Monard222 The vsnet-alert site maintained at Kyoto University retains an archive of messages about variable stars, mainly CVs. Monthly digests of the messages can be downloaded from their website, http://ooruri.kusastro.kyoto-u.ac.jp/mailman3/postorius/lists/vsnet-alert.ooruri.kusastro.kyoto-u.ac.jp/. Monard’s period is relayed by T. Kato in vsnet-alert 23816 (from 2019 December). . The 0.1226-d period would be unusual for a dwarf nova; CVs near this period, near the long edge of the roughly 2- to 3-h ‘gap’ in the CV period distribution, tend to be NLs rather than DNae. On the other hand, DNae with twice as long( h) often have prominent secondary stars and display two ‘humps’ per orbit due to the changing aspect of the tidally-elongated secondary.
During our observing run, the target was west of the meridian at evening twilight, so we could not determine a definitive from our velocities alone. Our aim instead was to distinguish between candidate periods of 2.94 h and 5.88 h. We obtained 25 exposures totaling 5.9 h, spread over three nights, spanning somewhat over 3 h of hour angle.
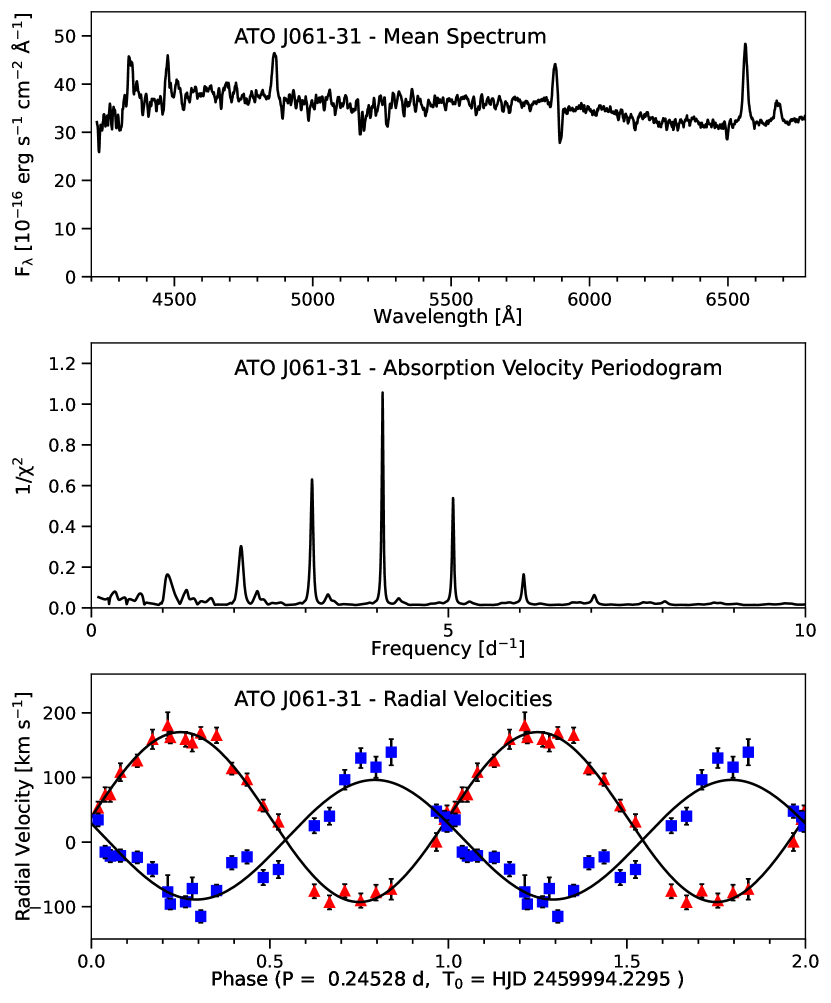
Fig. 1 shows the results. The mean spectrum (top panel) shows multiple absorption features from a late-type star in addition to the broadened Balmer and HeI emission typical of dwarf novae. The middle panel shows the periodogram of the absorption velocities, which despite the limited sampling, clearly indicates a 5.88-h period, double the VSX value. There is no significant modulation at half this period ( = 2.94 h). Allowing the period to vary we find d, consistent within the uncertainties with (double) the more precise Monard period; we therefore adopt d. The lower panel shows the folded radial velocities. As expected, the emission velocities move approximately in antiphase to the absorption.
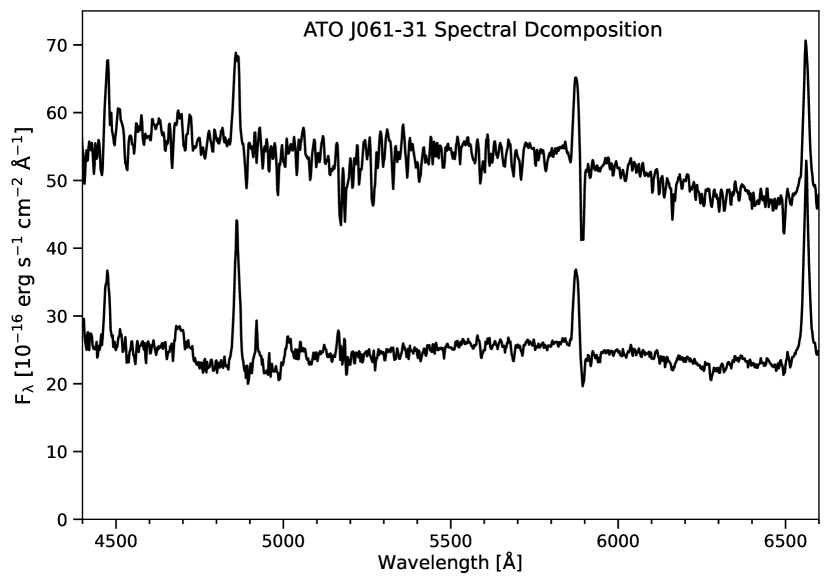
The upper trace of Fig. 2 shows the mean spectrum, and the lower shows it after subtraction of a scaled spectrum of the K0.5V-type star, HD124752. The scaling factor was chosen interactively to best cancel the late-type features in the difference spectrum. Our best estimate of the spectral type is K0-1, with a plausible range from G6 to K4. Knigge (2006) compiled numerous spectral-type estimates for CV donor stars with known period, and finds that around = 6 hr, the typical spectral type is near M0 (see his Fig. 7). The secondary in ATO 061-31 therefore appears to be significantly warmer than typical. This might indicate that some nuclear evolution has taken place in the secondary. Evolved donor stars can be much hotter than expected at a given (Thorstensen & Armstrong, 2005; Thorstensen, 2013, 2015; Wakamatsu et al., 2021).
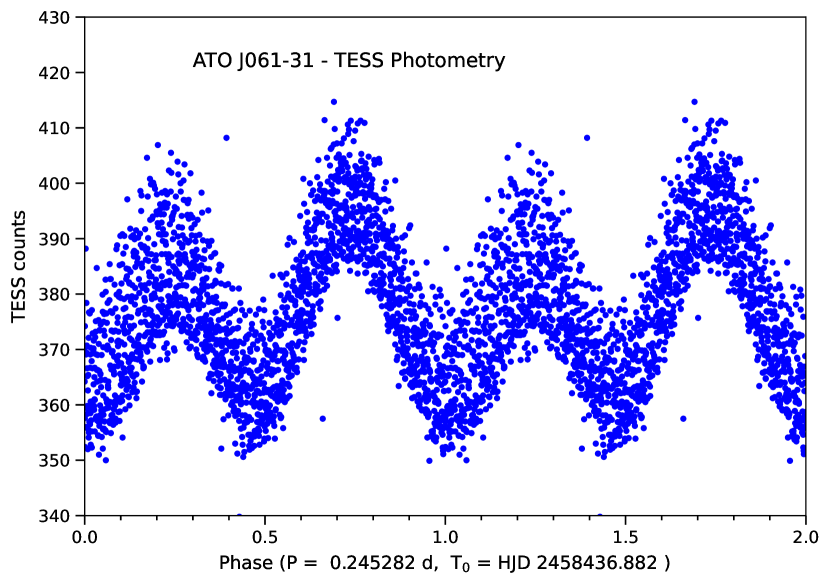
ATO J06131 was observed by the Transiting Exoplanet Survey Satellite (TESS) in Sectors 4 and 5, with 1800 sec cadence. We downloaded the TESS ‘PSDCSAP’ data using the lightkurve python module, edited out obvious artifacts, and folded the remaining data on the 0.245282-d period. The result (Fig. 3) shows double-humped modulation due to the changing aspect of the tidally-distorted secondary star. Note that one maximum appears slightly fainter than the other, corroborating once again that the period is 5.88 hours and not half that. The TESS data were taken in late 2018, about 4.5 years before our spectra, and our nominal period (based on doubling the Monard value) is not quite precise enough to specify an unambiguous cycle count across this gap.
3.2 Var Ret2005
The Gaia alerts-index lists this object as Gaia20cdc, and the Gaia light curve shows typical quiescent magnitude between 16 and 17, but with outbursts to at intervals ranging from several months to over a year. Outbursts were also noted on the vsnet-alert message board; T. Kato, in vsnet-alert 23341 (2019 July) classified some of these as superoutbursts, and concluded that the object is “almost certainly an SU UMa star.” However, we were unable to find mention of any candidate superhump period, nor any spectroscopic studies in the literature.
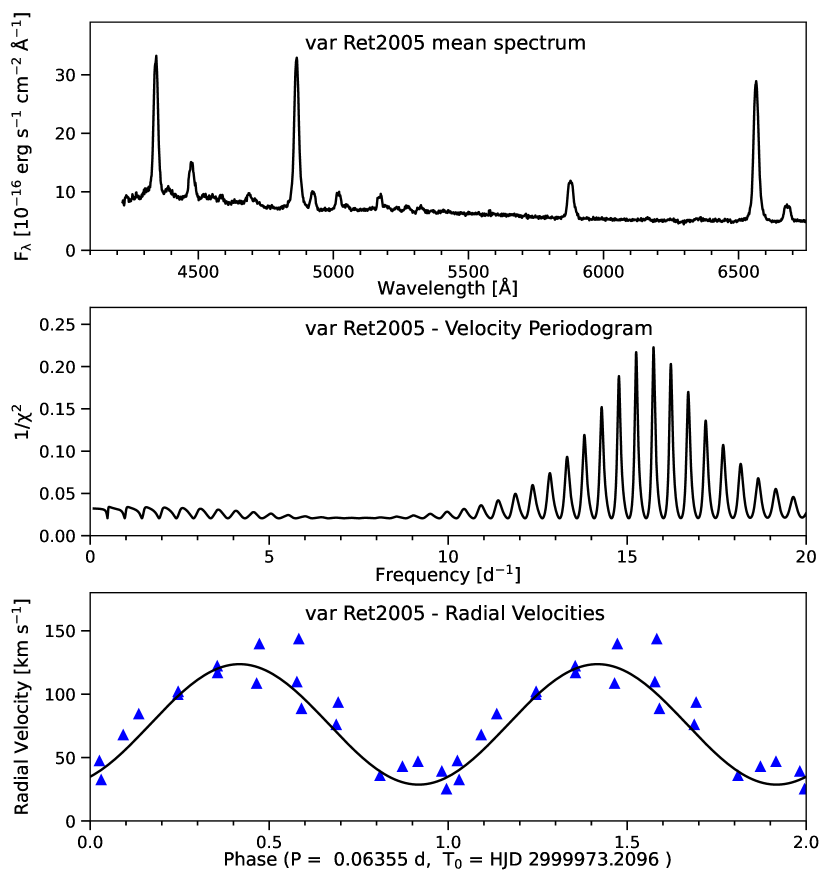
The average of our 20 spectra (Fig. 4, top) is typical of quiescent short-period dwarf novae (see, e.g., Thorstensen 2020b), with strong Balmer and HeI emission lines, and no hint of a late-type companion.
On the nights we observed we could not obtain a range of hour angles sufficient to determine an unambiguous radial velocity period, and weather constrained our two visits to be two nights apart. Consequently, the periodogram (Fig. 4, middle) shows strong aliases spaced by . Nonetheless, we constrain the period to the values shown in Table 5. The candidate periods are shorter than 2 h. This corroborates Kato’s suggested SU UMa classification, since nearly all dwarf novae in this range are SU UMa stars. Assuming the classification is correct, more complete observations of a superoutburst should reveal a superhump period, which in turn would resolve the orbital period ambiguity, since is generally a few per cent longer than the orbital period in SU UMa stars (see, e.g. Kato et al. 2020 and references therein).
| Rank | |||
|---|---|---|---|
| (d) | (d-1) | (km s-1) | |
| 1 | 0.06355 | 15.736 | 11.9 |
| 2 | 0.06557 | 15.252 | 12.1 |
| 3 | 0.06165 | 16.220 | 12.5 |
| 4 | 0.06771 | 14.769 | 13.0 |
| 5 | 0.05986 | 16.706 | 13.6 |
| 6 | 0.07000 | 14.286 | 14.4 |
| 7 | 0.05816 | 17.193 | 15.3 |
| 8 | 0.07244 | 13.804 | 16.3 |
| 9 | 0.05656 | 17.682 | 17.2 |
The uncertainties in the individual periods are of order d.
Note. — Ranked list of alias periods and corresponding frequencies from the Var Ret2005 velocities. The last column gives the scatter around the best fit at each period.
The lower panel of Fig. 4 shows our H radial velocities folded at our best period, but readers are cautioned that the period chosen is not unambiguous.
3.3 ASASSN J061541
In a 2018 July message on vsnet-chat333http://ooruri.kusastro.kyoto-u.ac.jp /mailarchive/vsnet-chat/8036, T. Kato suggested this object is a novalike CV, based on its absolute magnitude. The Catalina Real Time Survey (CRTS; Drake et al. 2009) collected 284 magnitudes from 2005 to 2013, which show irregular variation between 12.8 and 13.8, similar to many NLs. The object is listed in the SIMBAD database as a ‘star’. We observed the object because we were unable to find any published spectra.
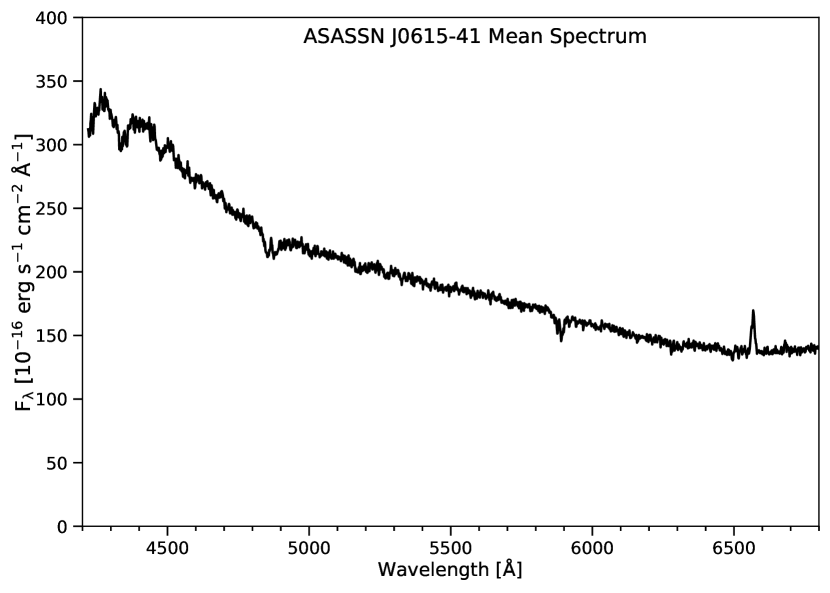
Fig. 5 shows the average of two 480-s exposures. H emission is present with an emission equivalent width of 3.3 Åand a FWHM around 14 Å. H is in absorption, with an emission core, and the higher Balmer lines are entirely in absorption. The absorption feature just shortward of appears to be NaD absorption, likely interstellar, blended somewhat with weak HeI absorption.
The spectrum is consistent with a thick-disk, or UX-UMa type, novalike variable (Warner, 1995). The variability and spectrum bolster the case that this is a bona fide novalike CV.
3.4 BMAM-V547
This object was first noted by Mariusz Bajer in archival data444This and MGAB-V202 have apparently not been discussed in the literature indexed by SIMBAD and ADS. Please refer to the VSX entries for details.. The ASAS-SN light curve shows it varying irregularly around , and more recently fading to about , still with irregular variations. It is not classified as a CV in SIMBAD.
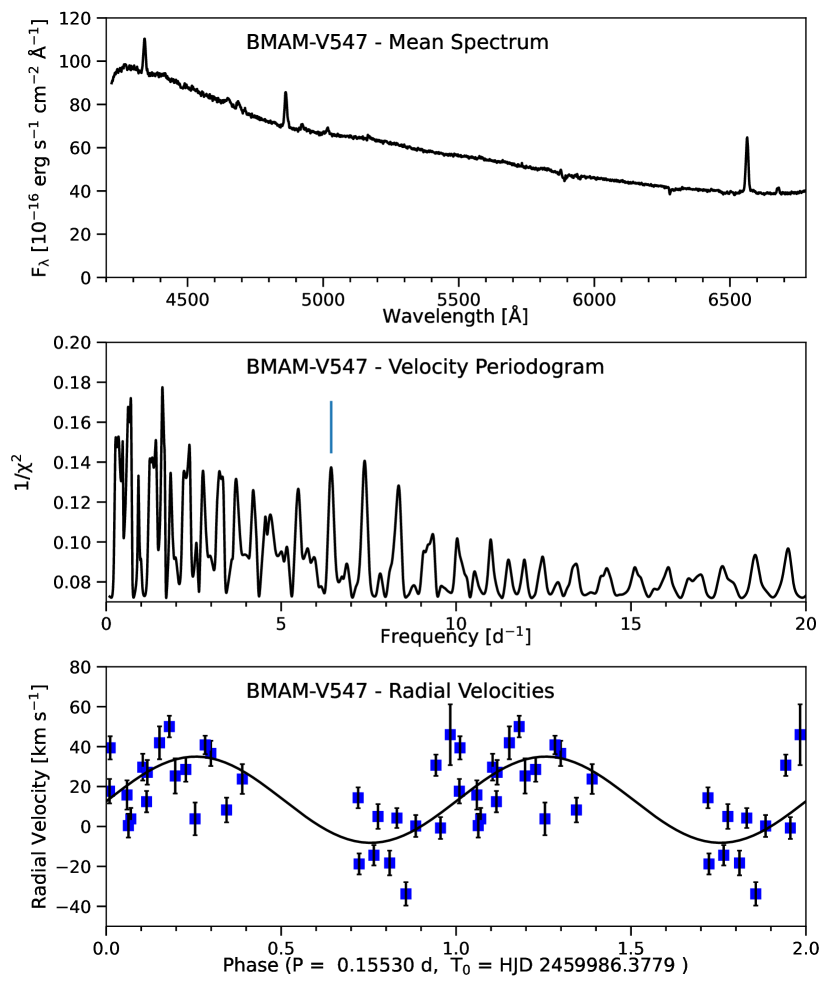
The mean spectrum (top panel of Fig. 6) shows a strong, blue continuum and weak, narrow emission lines, typical of a novalike variable. The amplitude of the emission radial velocity variations is small, and their periodogram (middle panel) does not indicate a unique period. However, one of the possible periods, marked with a vertical line in the figure, aligns with the photometric period we derive from TESS observations (see below). The lower panel shows the velocities folded on this period, which we identify as the likely .

| Sector | StartaaDates are the UT of the first and last points used, in year-month-day form. | End | Mean Flux |
|---|---|---|---|
| (electrons s-1) | |||
| 2 | 2018-08-23 | 2018-09-15 | 838 |
| 6 | 2018-12-15 | 2019-01-06 | 644 |
| 29 | 2020-08-26 | 2020-09-19 | 320 |
| 33 | 2020-12-18 | 2021-01-13 | 329 |
| 34 | 2021-01-14 | 2021-02-08 | 286 |
| 35 | 2021-02-10 | 2021-03-06 | 330 |
| 39 | 2021-05-27 | 2021-06-24 | 307 |
We also analyzed TESS observations of this star, which are summarized in Table 6. We downloaded the PSDCSAP files, edited out apparent artifacts (and some possible flares, as well, since our aim was to find periodicities), and computed periodograms using the LombScargle task from the astropy module timeseries. All the sectors separately showed very strong modulation near 6.435 cycles d-1, equivalent to d, or 3.730 h. To explore this, we combined data from four sectors in which the mean brightness was consistent and relatively low – sectors 29, 33, 35, and 39 – and searched this data set for periods (see the top panel of Fig. 7). This refined the frequency to 6.4365(9) d-1, or d (near 3.73 hr), where the uncertainty was estimated by examining light curves folded over a range of nearby periods. The modulation apparently maintains coherence over the 301-day span of the data, which amounts to 1940 cycles. The middle panel of Fig. 7 shows the low-state TESS data set folded on this period.
All the TESS data sectors except Sector 2 (during which the source was brightest) show a second, weaker modulation (also indicated in Fig. 7) near 0.254 d-1, or 3.93 d. The lower panel of Fig. 7 shows the low-state TESS data folded on this much longer period.
The period of the -hr modulation in the TESS data is typical of NL orbital periods. This, together with its coherence and the evidence for radial velocity modulation consistent with the same period, suggests that the 0.15536-d period is , rather than being caused by some other clock in the system, although given the relatively weak velocity modulation we cannot be certain of this. The spectrum, photometric modulation, and velocity modulation are all consistent with a novalike variable.
Periods comparable to the 3.93-d period, much longer than and often called superorbital periods, are seen in other novalike CVs (see, e.g., Armstrong et al. 2013 and references therein). These are generally attributed to the precession of a disk – either precession of the major axis of an elliptical disk, or precession of the line of nodes of a tilted disk. Often, systems with eccentric or tilted disks also show superhumps, periodic modulations at frequencies close to the orbital frequency . These frequencies are thought to be beats between the precession and the orbit, and appear at or , where is a disk precessional frequency. We do not find these frequencies in MGAB-V547. Our favored is flanked by sidelobes, but these appear to artifacts of the gaps between TESS sectors. In particular, we do not detect noticeable power near .
3.5 MGAB-V202
This object was apparently first identified as a CV candidate by Gabriel Murawski. The VSX listing includes a light curve from ASAS-SN showing irregular variation . Again, SIMBAD does not include a classification as a CV.
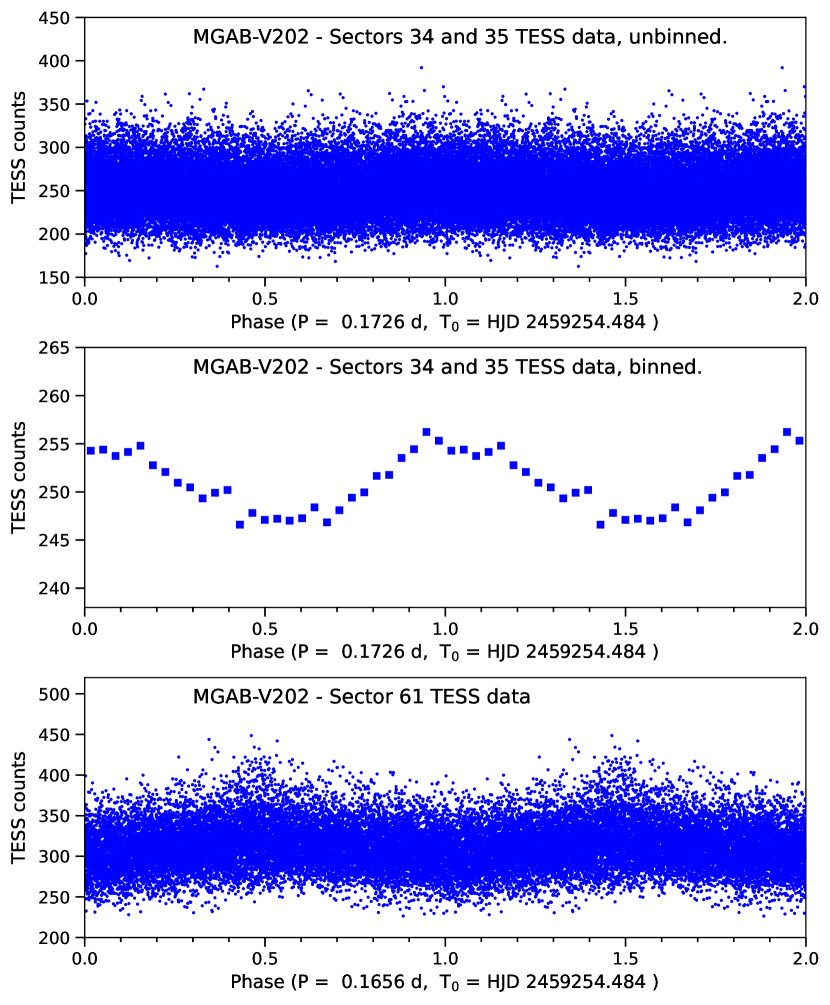
TESS observed the source in Sectors 34, 35 (2021 February and March, roughly) and 61 (starting in 2023 January). Lomb-Scargle periodograms of the data from Sectors 34 and 35 both show an apparently significant periodicity near 5.797 cycles d-1. In a simple fold of the data (Fig. 8, top), the modulation is evidently masked by irregular flickering, but averaging in phase bins does reveal a low-amplitude modulation (middle panel). The data from Sector 61, shows a stronger periodicity near a different frequency, 6.037 d-1. This modulation is discernible in the folded data (lower panel). In phase-binned averages (not shown), its maximum and minimum are respectively near 305 and 325 TESS counts s-1.
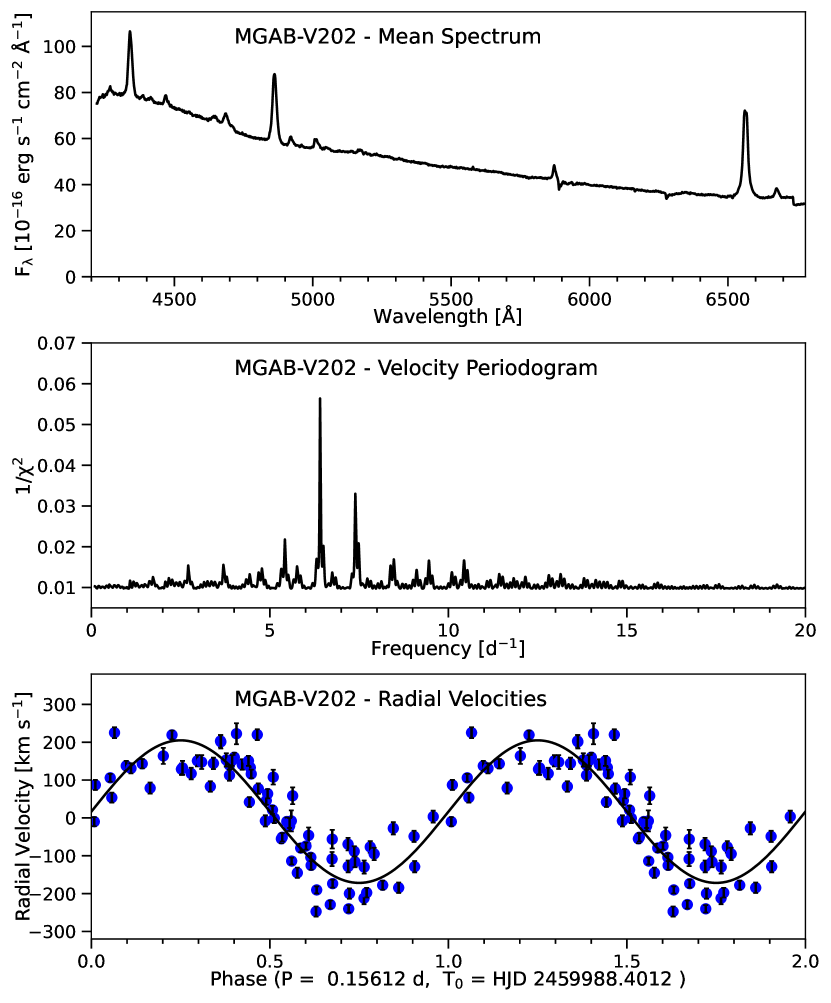
We obtained 76 spectra of MGAB-V202, a total of 13.8 h of exposure time spanning hour angles from h to h. The mean spectrum (top panel of Fig. 9) shows relatively strong Balmer and HeI emission lines on a blue continuum. For the radial velocities, we obtained the clearest result using the double-gaussian convolution with a separation of 42 Å, which isolated the motion of the rather faint wings (or base) of the H emission line. This gave the periodogram shown in the middle panel. The prominent peak is at 6.405 cycles d-1, or 0.1561 d. This is, notably, not seen in any of the TESS photometry, and it is not a daily alias of any of the TESS periods, either. Thanks to the large span of hour angle, it is determined without significant ambiguity in the cycle count; a 1000-trial Monte Carlo simulation of the measurement (Thorstensen & Freed, 1985) returned the correct period every time. The lower panel shows the folded line-wing velocities with the best-fit sinusoid superposed.
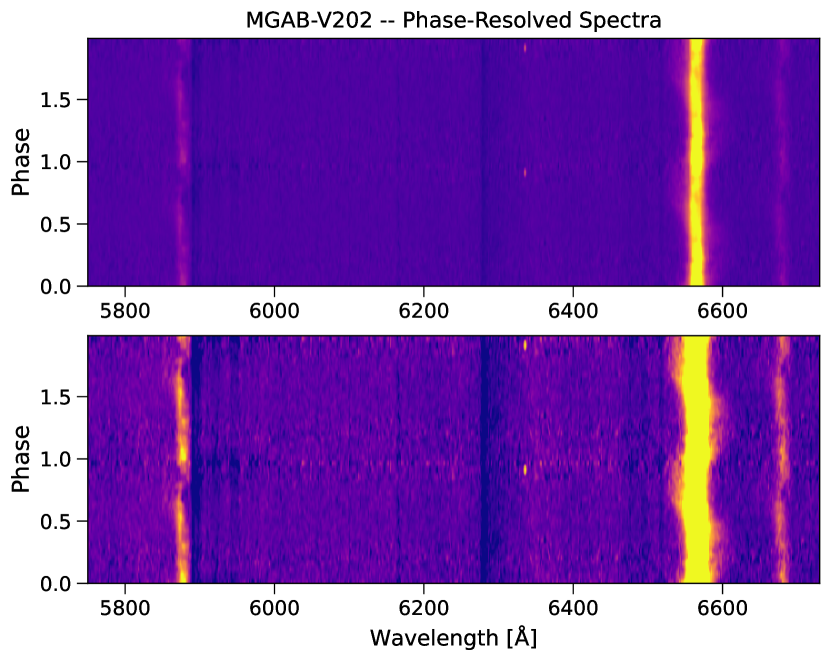
Fig. 10 displays the spectra as a function of phase in a two-dimensional image. The lower panel is ‘stretched’ to show the large-amplitude motion of the H line wings. Also, the HeI emission lines at 5876 and 6678 both show absorption over part of the phase that appears to drift blueward, which is a classic symptom of the SW Sex phenomenon (Thorstensen et al., 1991). Faint, large-amplitude Balmer line wings are seen also in the novalikes V795 Her (Casares et al., 1996) and LAMOST J204305.95+341340.6 (Thorstensen, 2020a). Based on its spectral appearance, orbital period, and detailed spectral behavior, MGAB-V202 is clearly an SW Sex star.
Both of the photometric periods seen in TESS data taken years apart are distinct from . The 0.1725-d period seen in 2021 is 10.5 per cent longer than , and the stronger 0.1656-d period in early 2023 is 6.1 per cent longer. As noted earlier, novalikes in this range of frequently show superhumps, either called positive superhumps, with somewhat longer than , thought to be caused by precession of an eccentric disk, or negative superhumps with periods shorter than , thought to be from apsidal precession of a tilted disk. Bruch (2023) recently studied long-term TESS light curves of a large sample of novalikes, and found many examples in which the the superhump modulations disappear and/or change period, as seen here. The modulations in MGAB-V202 appear to be examples of positive superhumps.
3.6 NSV 4202
This object was apparently first noticed by Knigge & Bauernfeind (1967). Sebastian Otero added it to the VSX catalog and classified it as a low-amplitude dwarf nova based on its light curve from ASAS-3. It was also detected by the OGLE-III survey (Mróz et al., 2015). The ASAS-SN light curve shows shows a rather flat quiescence near , and outbursts to at irregular intervals of order 100 days, all typical of dwarf novae. We were unable to find any candidate orbital period in the literature.
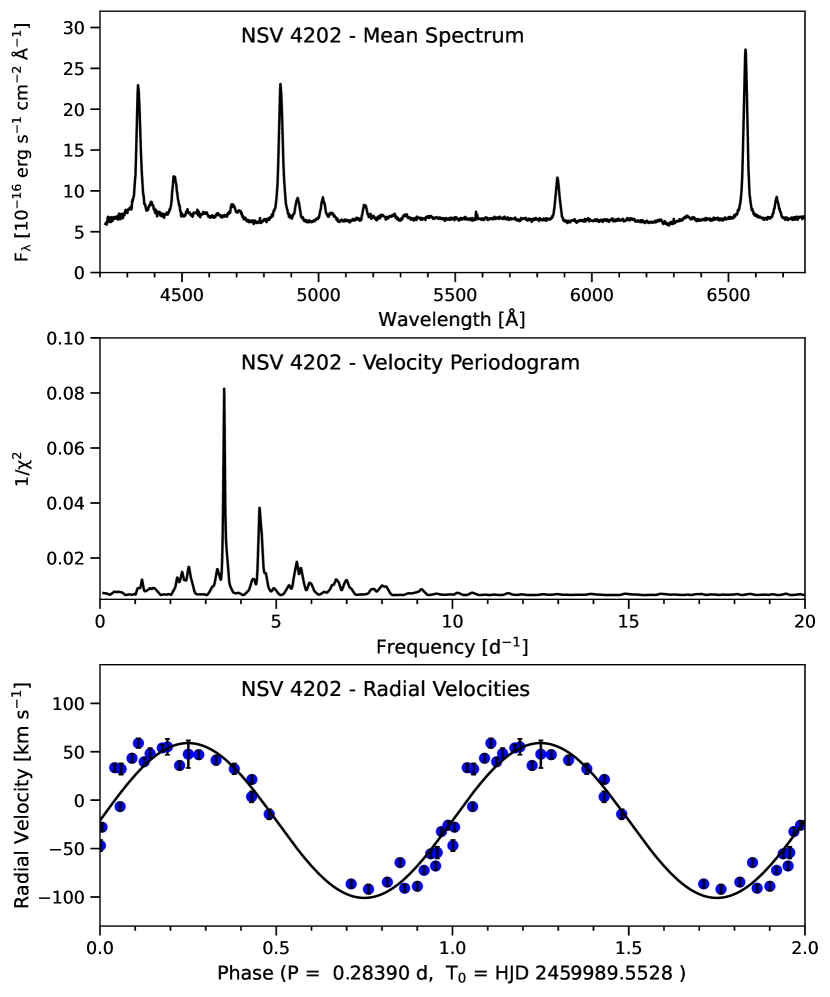
The mean spectrum (Fig. 11, top panel) shows strong Balmer and HeI emission typical of a dwarf nova at minimum light. The H radial velocities show periodicity at 0.2839(6) d, or 6.81 h. This is 3.52 cycle d-1. A daily cycle-count alias at 4.55 cycle d-1, or 5.3 h, is marginally possible but gives a much poorer fit. The data have good alias discrimination because of the 6.2-h range of hour angle covered, and because of the amplitude of the modulation relative to the noise (i.e., ); the Monte Carlo test (Thorstensen & Freed, 1985) prefers the stronger period more than 97 per cent of the time. The lower panel shows velocities folded on the 6.81-h period.
The period is fairly long for a dwarf nova, but it is somewhat surprising that the mean spectrum shows no contribution from a late-type secondary. A secondary contribution is almost always seen in high signal-to-noise spectra of quiescent dwarf novae with periods above six hours or so (see, e.g., the spectra of ATO 061-31 that were discussed earlier), so we looked for other evidence to corroborate the period. Unfortunately, none of the synoptic surveys appear to have sampled this object densely enough to corroborate our period, and although TESS has observed this deep southerly location many times, NSV 4202 is arcsec from a significantly brighter star and light curves are not available. We also prepared a phase-resolved image of the rectified spectra, similar to that of MGAB-V202 shown in Fig. 10, but that also showed no sign of a secondary star’s spectrum.
3.7 V1147 Cen
This object, first noted as a variable star by Luyten (1935), is apparently the longest-known of those studied here. It was recognized as a likely U Gem star by Pastukhova (2007), who presented an ASAS-3 light curve showing a quiescent level near 13.5 mag and frequent outbursts to 11.0 mag. Kazarovets et al. (2008) bestowed the designation V1147 Cen, and listed the type as “UGSS:”. The ASAS-SN light curve is entirely typical of an active dwarf nova, with outbursts typically days apart. No detailed study appears to have been published, and the orbital period remains unknown.
TESS light curves are available from Sectors 11 and 37. Both show a strong periodicity at 4.767 cycles d-1 ( h), with less power at half that frequency (10.07 h).
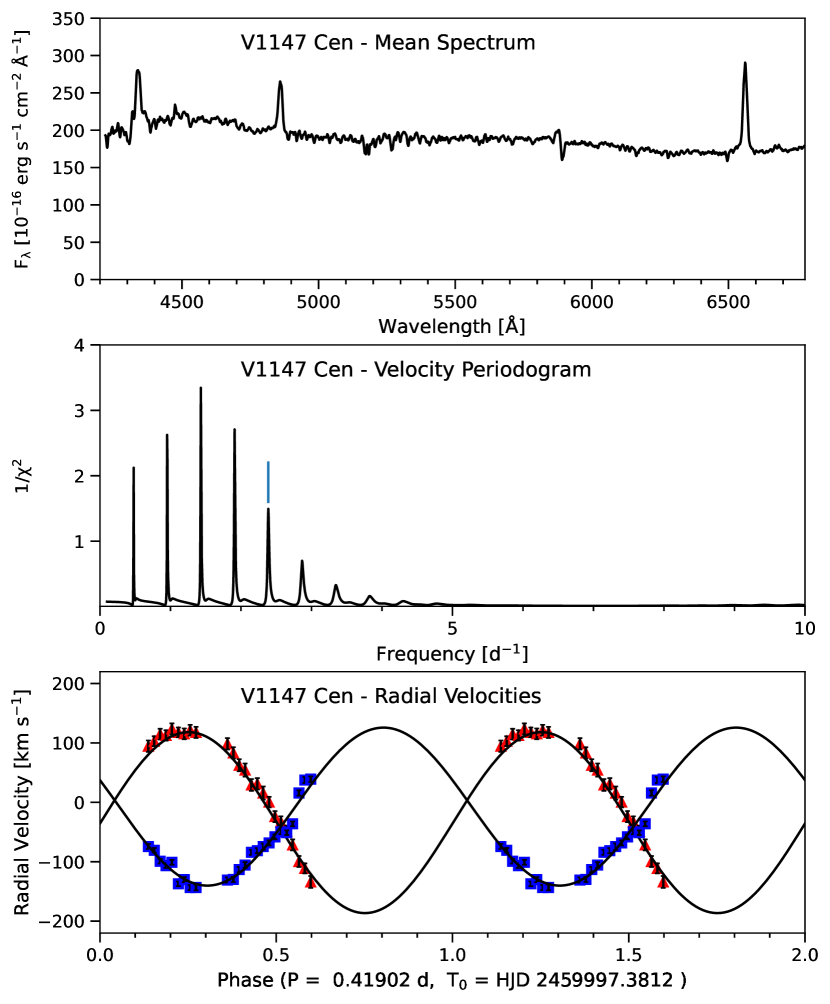
The mean spectrum (Fig. 12, top panel) shows typical dwarf nova emission lines and also a contribution from a late-type star. We have only 4.0 hours of data covering 4.8 hours of hour angle, so the velocities do not define the period uniquely, but both the emission and absorption velocities show a strong, consistent low-frequency modulation (Fig. 12, middle panel). One of the aliases of this modulation is at d, or 2.38(3) cycle d-1, consistent with half the dominant TESS frequency. The TESS modulation is clearly due to ellipsoidal variation of the secondary, with two humps per orbit. The lower panel shows both emission and absorption velocities folded on the spectroscopic orbital period, which amounts to 10.06 h.
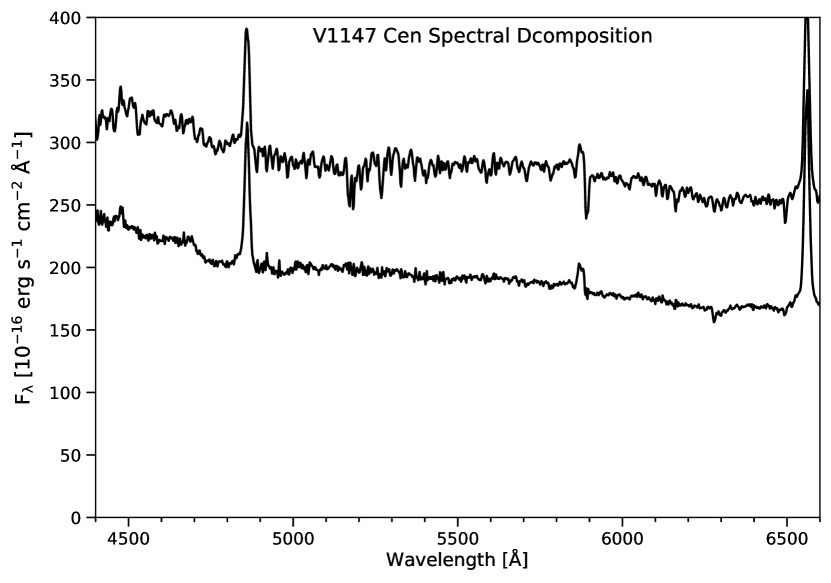
The top trace in Fig. 13 is the average flux-calibrated spectrum of V1147 Cen, resampled into the rest frame of the secondary prior to averaging. The lower trace shows the difference between this average and a scaled spectrum of the K2V star HD109111. The secondary features cancel very well; we found adequate cancellation for types K0 to K3. Comparing to other CVs with h in Fig. 7 of Knigge (2006), the secondary in V1147 is cooler than the analytic fit, but similar to several other examples plotted in his figure and listed in Knigge’s Table 2.
In summary, we confirm that V1147 Cen is a UGSS star and show that it has a relatively long . Had it been more northerly, it would likely have already been swept up by SDSS, LAMOST, and other surveys and attracted more attention.
4 SUMMARY
We obtained spectra of selected bright CVs in the southern hemisphere, with the aim of characterizing them more fully. The orbital period of a CV is its most fundamental observable, and for most of our targets we succeeded in measuring . Our targets, while selected on the basis of tractability, represent several different subclasses of CVs – three novalikes, including an apparent SW Sextantis star, and four dwarf novae, including two with visible secondary stars and one short-period SU UMa-type system.
None of the objects appears grossly atypical, but there are a few notable findings:
-
•
MGAB-V202 is evidently a new SW Sextantis star. In TESS photometry it shows two periods clearly different from , neither of which is detected consistently. These may be related to disk precession, and further monitoring may be enlightening.
-
•
The TESS photometry of BMAM-V547 shows a clear, persistent modulation at a period that agrees with one of our possible radial velocity periods. In addition, the TESS photometry shows a superorbital period near 3.93 d.
-
•
The secondary star in the dwarf nova ATO J06131 is slightly warmer than expected at its orbital period.
-
•
The dwarf nova NSV 4202 does not show a secondary-star spectrum, despite its relatively long .
5 ACKNOWLEDGMENTS
This paper uses observations made at the South African Astronomical Observatory (SAAO). We are deeply thankful to the SAAO staff for their warm hospitality and expert assistance. Student travel to and from the observatory, and accommodations at SAAO, were underwritten by a generous donation from Heather and Jay Weed. The observations reported here were taken as part of the Dartmouth College Foreign Study Program in astronomy; Professors Brian Chaboyer and Ryan Hickox were essential in arranging, supporting, and carrying out this program.
This paper includes data collected with the TESS mission, obtained from the MAST data archive at the Space Telescope Science Institute (STScI). Funding for the TESS mission is provided by the NASA Explorer Program. STScI is operated by the Association of Universities for Research in Astronomy, Inc., under NASA contract NAS 5–26555
References
- Armstrong et al. (2013) Armstrong, E., Patterson, J., Michelsen, E., et al. 2013, MNRAS, 435, 707
- Bellm et al. (2019) Bellm, E. C., Kulkarni, S. R., Graham, M. J., et al. 2019, PASP, 131, 018002
- Bruch (2023) Bruch, A. 2023, MNRAS, 519, 352
- Casares et al. (1996) Casares, J., Martinez-Pais, I. G., Marsh, T. R., Charles, P. A., & Lazaro, C. 1996, MNRAS, 278, 219
- Crause et al. (2019) Crause, L. A., Gilbank, D., Gend, C. v., et al. 2019, Journal of Astronomical Telescopes, Instruments, and Systems, 5, 024007
- Drake et al. (2009) Drake, A. J., Djorgovski, S. G., Mahabal, A., et al. 2009, ApJ, 696, 870
- Gaia Collaboration et al. (2016) Gaia Collaboration, Prusti, T., de Bruijne, J. H. J., et al. 2016, A&A, 595, A1
- Gaia Collaboration et al. (2018) Gaia Collaboration, Brown, A. G. A., Vallenari, A., et al. 2018, A&A, 616, A1
- Goliasch & Nelson (2015) Goliasch, J., & Nelson, L. 2015, ApJ, 809, 80
- Horne (1986) Horne, K. 1986, PASP, 98, 609
- Kalomeni et al. (2016) Kalomeni, B., Nelson, L., Rappaport, S., et al. 2016, ApJ, 833, 83
- Kato et al. (2020) Kato, T., Isogai, K., Wakamatsu, Y., et al. 2020, PASJ, 72, 14
- Kazarovets et al. (2008) Kazarovets, E. V., Samus, N. N., Durlevich, O. V., Kireeva, N. N., & Pastukhova, E. N. 2008, Information Bulletin on Variable Stars, 5863, 1
- Knigge (2006) Knigge, C. 2006, MNRAS, 373, 484
- Knigge et al. (2011) Knigge, C., Baraffe, I., & Patterson, J. 2011, ApJS, 194, 28
- Knigge & Bauernfeind (1967) Knigge, R., & Bauernfeind, H. 1967, Bamberg Veroeffentlichungen der Remeis-Sternwarte, 7, 51
- Luyten (1935) Luyten, W. J. 1935, Astronomische Nachrichten, 256, 325
- Mróz et al. (2015) Mróz, P., Udalski, A., Poleski, R., et al. 2015, Acta Astron., 65, 313
- Pala et al. (2020) Pala, A. F., Gänsicke, B. T., Breedt, E., et al. 2020, MNRAS, arXiv:1907.13152 [astro-ph.SR]
- Pastukhova (2007) Pastukhova, E. N. 2007, Peremennye Zvezdy Prilozhenie, 7, 8
- Peters & Thorstensen (2005) Peters, C. S., & Thorstensen, J. R. 2005, PASP, 117, 1386
- Rodríguez-Gil et al. (2007) Rodríguez-Gil, P., Gänsicke, B. T., Hagen, H. J., et al. 2007, MNRAS, 377, 1747
- Schneider & Young (1980) Schneider, D. P., & Young, P. 1980, ApJ, 238, 946
- Shafter (1983) Shafter, A. W. 1983, ApJ, 267, 222
- Shappee et al. (2014) Shappee, B. J., Prieto, J. L., Grupe, D., et al. 2014, ApJ, 788, 48
- Thorstensen (2013) Thorstensen, J. R. 2013, PASP, 125, 506
- Thorstensen (2015) —. 2015, PASP, 127, 351
- Thorstensen (2020a) —. 2020a, AJ, 160, 151
- Thorstensen (2020b) —. 2020b, arXiv e-prints, arXiv:2005.02150
- Thorstensen & Armstrong (2005) Thorstensen, J. R., & Armstrong, E. 2005, AJ, 130, 759
- Thorstensen & Freed (1985) Thorstensen, J. R., & Freed, I. W. 1985, AJ, 90, 2082
- Thorstensen et al. (1991) Thorstensen, J. R., Ringwald, F. A., Wade, R. A., Schmidt, G. D., & Norsworthy, J. E. 1991, AJ, 102, 272
- Tonry & Davis (1979) Tonry, J., & Davis, M. 1979, AJ, 84, 1511
- Tonry et al. (2018) Tonry, J. L., Denneau, L., Heinze, A. N., et al. 2018, PASP, 130, 064505
- Wakamatsu et al. (2021) Wakamatsu, Y., Thorstensen, J. R., Kojiguchi, N., et al. 2021, PASJ, 73, 1209
- Warner (1995) Warner, B. 1995, Cambridge Astrophysics Series, 28