JWST/CEERS Sheds Light on Dusty Star-Forming Galaxies: Forming Bulges, Lopsidedness and Outside-In Quenching at Cosmic Noon
Abstract
Context. We investigate the morphology and physical properties of a sample of 22 IR-selected dusty star-forming galaxies at Cosmic Noon (), using James Webb Space Telescope Near Infra-Red Camera images obtained in the Extended Groth Strip field for the Cosmic Evolution Early Release Science survey.
Aims. The exceptional resolution of the NIRCam images allows us to spatially resolve these galaxies up to m and identify their bulge/core even when very extinguished by dust.
Methods. Based on red-green-blue images using the F115W, F200W and F444W filters, we divide each galaxy in several uniformly colored regions, fit their respective Spectral Energy Distribution and measure dust attenuations, stellar masses, star formation rates and ages. After classifying each region as star-forming or quiescent, we assign galaxies to three classes, depending on whether active star-formation is located in the core, in the disk or in both.
Results. (i) % of our DSFGs have a compact highly dust attenuated star-forming core that can contain up to 80% of the star-formation of the galaxy but only 20-30% of its stellar mass, and is always surrounded by a larger, less attenuated massive disk (no blue nuggets); (ii) 64% (27%) of disks are significantly (strongly) lopsided, likely due to asymmetric cold gas accretion, major mergers and/or large scale instabilities; (iii) 23% of galaxies have a star-forming core embedded in a quiescent disk, they are undergoing outside-in quenching, often facilitated by their strong lopsidedness inducing small and large scale instabilities; (iv) some galaxies host highly heterogeneous disks in term of RGB colors: these are driven by in-homogeneous dust attenuation; and (v) we find surprising evidence for clump-like substructures being quiescent and/or residing in quiescent regions.
Conclusions. This work demonstrates the major impact JWST/NIRCam has on understanding the complexity of the evolution of distant massive galaxies.
Key Words.:
Galaxies: Bulges – Formation – Evolution – Star-formation – Structure1 Introduction
Until recently, the existence of the so-called galaxy Main-Sequence, a correlation that the majority of star-forming galaxies observe in the stellar mass () versus star formation rate (SFR) plane up to redshift 3 (MS, e.g., Daddi et al. 2007; Elbaz et al. 2007; Noeske et al. 2007; Schreiber et al. 2015) and its tight scatter has been interpreted as evidence that star formation in most galaxies is a fairly ordered process (Schreiber & Wuyts 2020). The ‘consensus’ is that galaxies on the MS are forming stars in a quasi steady state inside gas-rich stellar disks (e.g., Sancisi et al. 2008; Dekel et al. 2009) whereas galaxies above the MS undergo a starburst, driven by stochastic processes such as major mergers, whose typical signature is compact star formation (e.g., Tacconi et al. 2008).
However, recent studies at have shown that some massive () MS galaxies have a stellar distribution typical of late type galaxies but where the star formation only occurs in a compact nucleus (Elbaz et al. 2018; Puglisi et al. 2019, 2021; Tadaki et al. 2017, 2020; Franco et al. 2020; Gómez-Guijarro et al. 2022b; Jiménez-Andrade et al. 2019, 2021). The origin of these compact SF sub-mm galaxies (SMGs) observed with the Atacama Large Millimeter Array (ALMA) is yet to be fully understood. Three main scenarios to form the compact sub-mm nucleus are : (1) gas fueled to the core via violent disk instabilities (VDI) and clump migration, (2) a starburst induced by a major merger or (3) accretion and/or minor mergers (e.g. Gómez-Guijarro et al. 2022a). These compact SF nuclei could be an indication of an early quenching phase (Puglisi et al. 2019; Franco et al. 2020; Puschnig et al. 2023).
Besides the compact nucleus, high-z SF galaxies are observed to have giant SF clumps (radius kpc). The origin of these clumps has been investigated by many studies (Puschnig et al. 2023; Fensch & Bournaud 2021; Hodge et al. 2019; Rujopakarn et al. 2019; Mandelker et al. 2014; Wuyts et al. 2012; Elmegreen 1994, 1989). Mandelker et al. (2014) suggests that they can either be in-situ clumps, originating from VDI (e.g. Elmegreen 2011), in this case they are young and star-forming, or they can be ex-situ clumps, originating from minor mergers, in that case they will be older and with a low gas fraction and low specific star-formation rate (sSFR). A recent simulation showed that the formation of such long-lived giant clumps is only possible with a gas fraction of at least 50% (Fensch & Bournaud 2021). This large gas fraction is necessary to induce VDI that will produce clumps that will migrate toward the center, creating strong gas nuclear inflow and triggering an evolution of the structure of the galaxy, leading to a morphological evolution (Fensch & Bournaud 2021). This scenario is also favored by some observations (Förster-Schreiber et al. 2011; Guo et al. 2012). More recently, Puschnig et al. (2023) studied a local galaxy as proxy for high-z galaxies, confirming that the giant SF clumps mostly originate from a fragmentation of the disk, induced by VDI and not accretion or minor mergers. With its high spatial resolution, the James Webb Space Telescope’s (JWST) near-IR Camera (NIRCam) is able to better resolve such giant SF clumps and could help constraining this scenario. It is thus becoming clear that the galaxies within the MS scatter are not all largely unperturbed gas-rich disks. The compact SF cores, as well as the giant clumps, independently of their formation history, imply complex phenomenology at play, much different than local SF galaxies in the MS that are typically well behaved spirals.
Recently, emphasis has been brought onto other kind of asymmetries characterising high redshift SF galaxies. Kalita et al. (2022) discovered strong lopsidedness affecting the three massive SF galaxies in a group core. They suggested a link between the lopsidedness of a galaxy in a dense environment to gas accretion and minor mergers. The lopsidedness would then be a marker of the point of impact of the accretion stream, following Bournaud et al. (2005) who investigated the origins of lopsidedness in simulated galaxies. Their conclusion is that it is very unlikely that the lopsidedness is the result of internal mechanisms but is more likely to be linked to the assembly history and the environment of the galaxy, to asymmetric gas accretion and to minor merger and interactions with neighbouring galaxies. This is also the conclusion of studies on lopsidedness of galaxies in the local universe (Jog & Combes 2009; Zaritsky et al. 2013). Rujopakarn et al. (2023) studied a galaxy in a dense environment with SF off-center substructures. They interpreted it as either forming spiral arms following a minor merger, an interaction with a neighbouring galaxy or a lopsided structure resulting from the point of impact of the cold gas accretion stream. Colina et al. (2023) reported JWST MIRI observations of GN20, an extremely luminous sub-mm galaxy residing in a protocluster (Daddi et al. 2009). They reveal a massive extended disk surrounding the sub-mm compact nucleus, displaying strong lopsidedness. As of today, the lopsidedness has only been studied in dense environments and serendipitously. Observing lopsided disk in less crowded environment and inferring their prevalence in complete samples could shed further light on their presumed origin from interactions and accretion, and clarify whether a massive hosting dark matter halo is, or not, required.
By probing the rest-frame optical to near infrared (near-IR) at Cosmic Noon, JWST/NIRCam has a unique ability to fill the gap between the sub-mm compact nucleus observed with ALMA and the larger galactic disk observed in the optical and will help critically examining the competing scenarios. As an example, Rujopakarn et al. (2023) recently studied substructures within a dusty star forming galaxy (DSFG) at imaged with both ALMA and JWST. From NIRCam images, they showed that the ALMA substructures are also visible at m, demonstrating the direct link that one can draw between near-IR and sub-mm emissions. This suggests that the long wavelength channel of NIRCam might be a good tracer of compact obscured star formation in MS DSFGs.
The present study is part of the Cosmic Evolution and Epoch of Re-ionization Survey (CEERS111https://ceers.github.io; ERS 1345, PI: S. Finkelstein) which is one of the Early Release Science (ERS) programs of the JWST (Gardner et al. 2023) that observed a part of the Extended Groth Strip (EGS) Hubble Space Telescope (HST) field with NIRCam (Rieke et al. 2023). EGS is too far North to be observed with ALMA and there is no high resolution imaging with the Northern Extended Millimeter Array (NOEMA) yet. However, the high sensitivity and exquisite spatial resolution of NIRCam towards 5m can be used as a surrogate to identify the most obscured and massive regions within galaxies, hence those most likely vigorously star-forming.
Understanding how DSFGs are formed and evolve is crucial to get the larger picture of galaxy formation and evolution, and it could be a key element to explain the quenching of galaxies at and after Cosmic Noon. To this aim, JWST/CEERS allows a major step forward. Indeed Kartaltepe et al. (2023) already showed that JWST reveals the diversity of morphologies of galaxies at high redshift. JWST high spatial resolution and sensitivity is able to detect faint disks that were previously undetectable with HST. Moreover, a recent study by Kamieneski et al. (2023) uses JWST/NIRCam to probe the dust attenuation and sSFR of a lensed DSFG at . They demonstrate the power of JWST/NIRCam to precisely measure these properties at sub-galactic scales, allowing them to conclude that despite a more dust attenuated bulge, the color gradient of this galaxy is mainly driven by an early stage of inside-out quenching. This makes JWST/NIRCam the best instrument to investigate the morphological evolution of DSFGs around Cosmic Noon, in terms of compact star formation, giant clumps and galaxy structure.
The paper is organized as follows. In Sect. 2 we present the data used in this study and the sample selection process. In Sect. 3, we detail the methods used to analyse each galaxy individually. In Sect. 4, we outline the main results of the analysis. Finally, in Sect. 5, we discuss the possible implications of the results in terms of formation and evolution of DSFGs at Cosmic Noon.
2 Data
2.1 CEERS Imaging
For the purpose of this study, we used the NIRCam imaging of CEERS, reduced using a customized pipeline by the CEERS collaboration (Bagley et al. 2022). It includes images in 7 filters: F115W, F150W, F200W, F277W, F356W, F410M and F444W for an average depth of 28.6 AB mag (See Table 3 of Bagley et al. (2022) for more details, each filter/pointing as a slightly different depth). The Point-Spread-Function (PSF) Full-Width at Half-Maximum (FWHM) of those filters range from 0.040” to 0.145” for F115W and F444W respectively222https://jwst-docs.stsci.edu/jwst-near-infrared-camera/nircam-performance/nircam-point-spread-functions. For this study, we used the CEERS imaging from the June 2022 pointings, which represent 40% of the total area covered by NIRCam for CEERS between June and December 2022. We used the background subtracted images as we wanted to measure precise photometry. As we needed to extract galaxy properties based on spectral energy distributions (SEDs), we decided to complement shorter wavelengths by taking advantage of the existing HST imaging in the field. We used the publicly available HST data products version 1.9, available through CEERS. These mosaics were derived from HST archival data, but with improved calibration compared to the default pipeline products, and have astrometry tied to Gaia-EDR3 (Lindegren et al. 2021). As described in the accompanying data release, the mosaics were created from the combination of HST programs 10134, 12063, 12099, 12167, 12177, 12547, 13063, and 13792, and the reduction and calibration followed a similar procedure to those described in Koekemoer et al. (2011). We used two filters; F606W and F814W with a PSF FWHM of 0.115” and 0.110” respectively (Koekemoer et al. 2011). We did not use the HST/WFC3 images as these bands are redundant for bright galaxies, as they are covered by JWST/NIRCam images which are deeper and with better spatial resolution.
2.2 The “Super-deblended” FIR catalog
The goal of this paper is to study the morphology and SF activity of DSFGs. We select galaxies based on their IR detection in the state-of-the-art super-deblended far-IR (FIR) catalog of the EGS field (Le Bail et al., in preparation). FIR emission is a secure tracer of star formation (once the AGN components are removed), while optical/near-IR classification of SF galaxies is subject to larger uncertainties especially in the presence of dust. Hence, our FIR selection ensures the galaxies under scrutiny are truly highly SF.
The super-deblending is based on a well-established technique (Liu et al. 2018; Jin et al. 2018). It is a multi-wavelength fitting technique meant to optimize the number of priors fitted at each band to extract the deepest reachable information. They used images from Spitzer (m (FIDEL, Dickinson 2007)), Herschel (m and m (PEP, Lutz et al. 2011), m, m, m (HerMES, Oliver et al. 2012)), SCUBA2 (m (S2CLS, Geach et al. 2017), m and m from Zavala et al. (2017)) and AzTEC (1.1mm from Aretxaga (2015)). The key was to obtain an adaptive balance as a function of wavelength between the density of priors fitted, the quality of the fit, and the achievable deblending given the PSF sizes. They started with the deepest images and fitted band after band toward shallower images. Extensive Monte-Carlo simulations ensured that the uncertainties associated to the flux measurements were “quasi-Gaussian” (see Liu et al. 2018; Jin et al. 2018; A. Le Bail et al. in preparation).
2.3 Sample definition
We selected all sources securely detected in the FIR catalog (see Sect. 2.2) that fell in the CEERS/NIRCam regions observed in June 2022. Since short wavelength channels have a slightly different field of view than long wavelength channels, we checked that the sources are observed in all of them and that they were not too close to the edge of the images so that there were not partially cut. In detail, we require the galaxies to have SNR, where SNRFIR is the signal-to-noise ratios (SNR) added in quadrature from m to mm (Le Bail et al. in preparation) and have at least one detection (SNR) in a Herschel/SPIRE band after deblending (required to reliably measure SF components in case of AGNs). The implication of the IR selection is that we don’t have a stellar mass complete sample of SF galaxies (e.g., complete above some mass threshold), and we have instead something closer to a (redshift-dependent) SFR limit. We are aware that we are missing SF galaxies below our IR detection threshold, as we wish to focus to highly (and securely) star-forming galaxies.
We also limited the sample to galaxies within , as we are willing to focus on galaxies at “Cosmic Noon”, as recalled in the Introduction. To get accurate redshift estimates, we used the recent redshift compilation produced by Kodra et al. (2022), which includes photometric redshifts based on CANDELS (Grogin et al. 2011; Koekemoer et al. 2011) as well as grism-based redshifts from 3D-HST (Momcheva et al. 2016) and spectroscopic redshifts from the MOSDEF survey (Kriek et al. 2015).
This sample comprised a total of 26 IR-detected sources. From these, 4 had to be rejected after a clean up. After close inspection, three galaxies were in a blended region and/or close to a much brighter IR source, making the Herschel measurements less reliable. The last rejected source hosted an AGN (clear radio excess, brighter than what is expected for the radio continuum based on IR emissions, and X-ray detected: ID15327, RA = 215.82825, Dec = 52.80844, , ), hence the majority of its IR luminosity does not come from SF regions which are the main objects of this study.
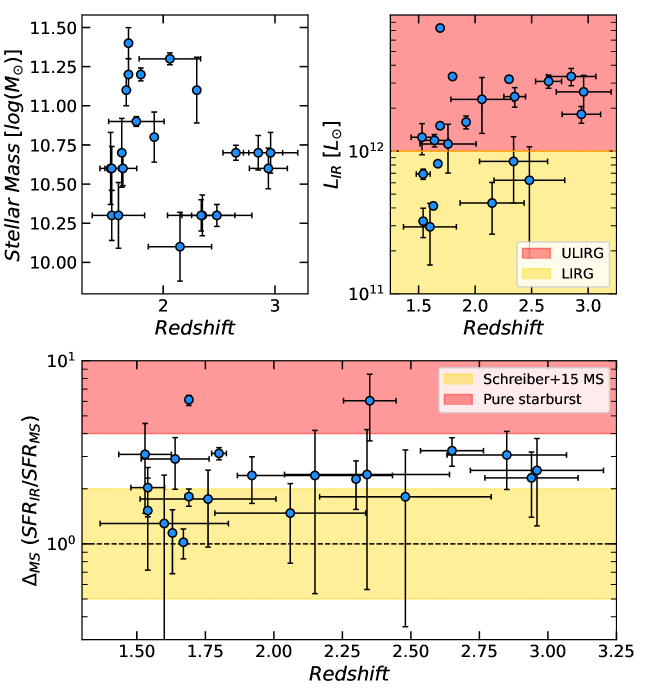
This left us with a clean sample of 22 FIR-bright DSFGs around Cosmic Noon. We illustrate in Fig. 1 the distribution of the sample in terms of stellar mass estimated in the pre-JWST era (Stefanon et al. 2017) and total IR luminosity (Le Bail et al. in preparation, calculated based on the equations in Press et al. (1992)) versus redshift (Kodra et al. 2022). We also show the distance from the MS (Schreiber et al. 2015) with a 0.6 dex total scatter (Rodighiero et al. 2011) defined as . Schreiber et al. (2015) uses a Salpeter IMF (Salpeter 1955), we converted stellar masses and SFRs from Salpeter IMF to Chabrier IMF by subtracting 0.24 dex. The red shaded region corresponds to the pure starburst region as defined in Liu et al. (2018) ( dex), we have two galaxies in our sample classified as pure starburst. The rest is mostly either within the scatter of the MS, but above its average trend, i.e. above the MS but below the starburst regime.
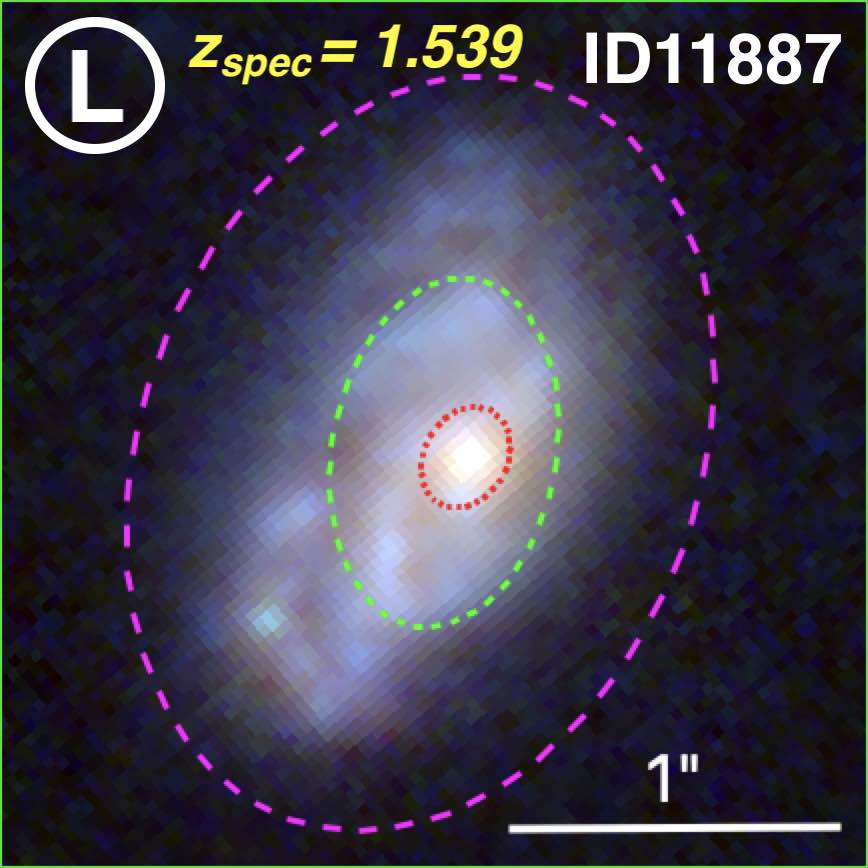
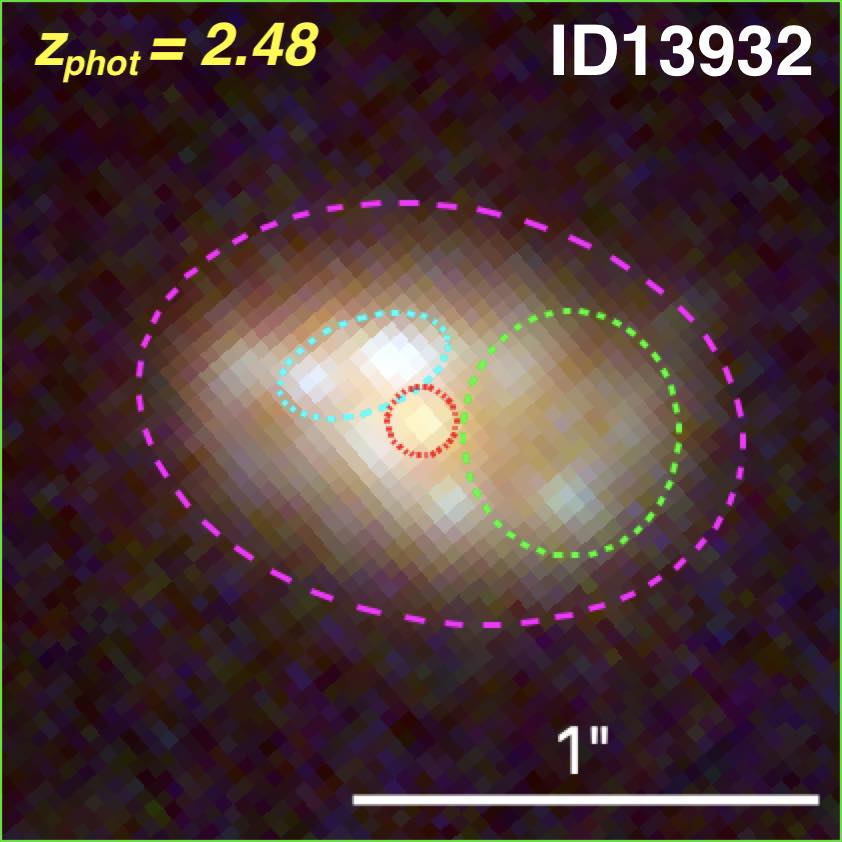
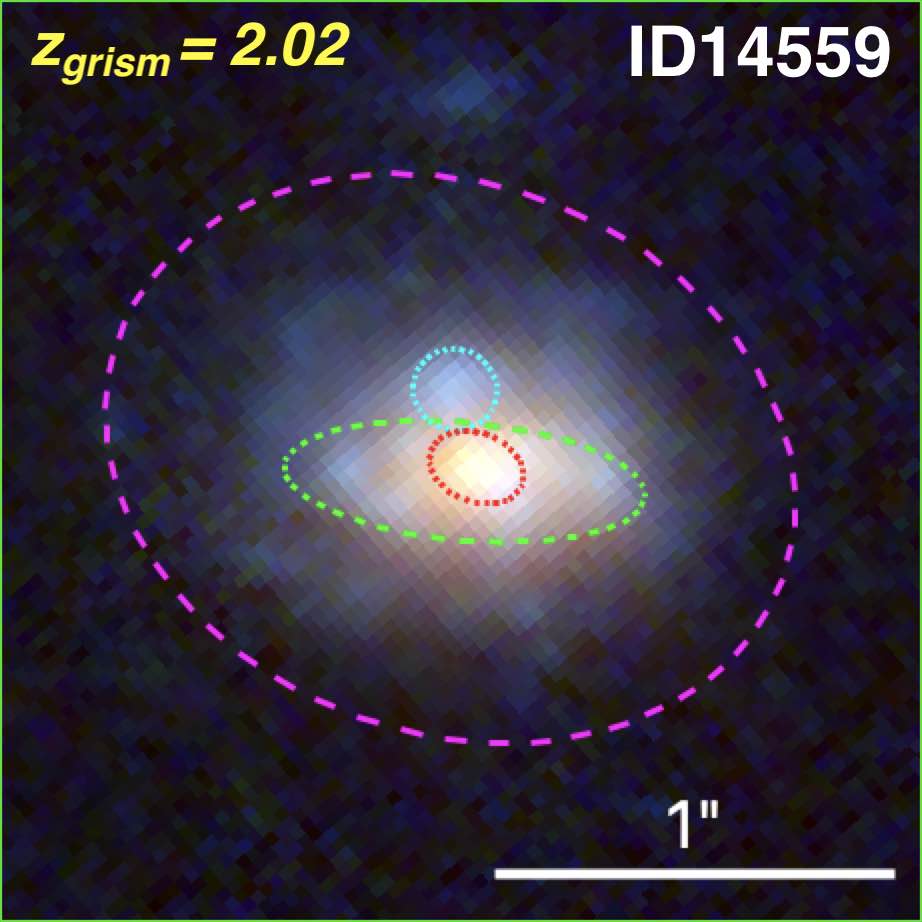
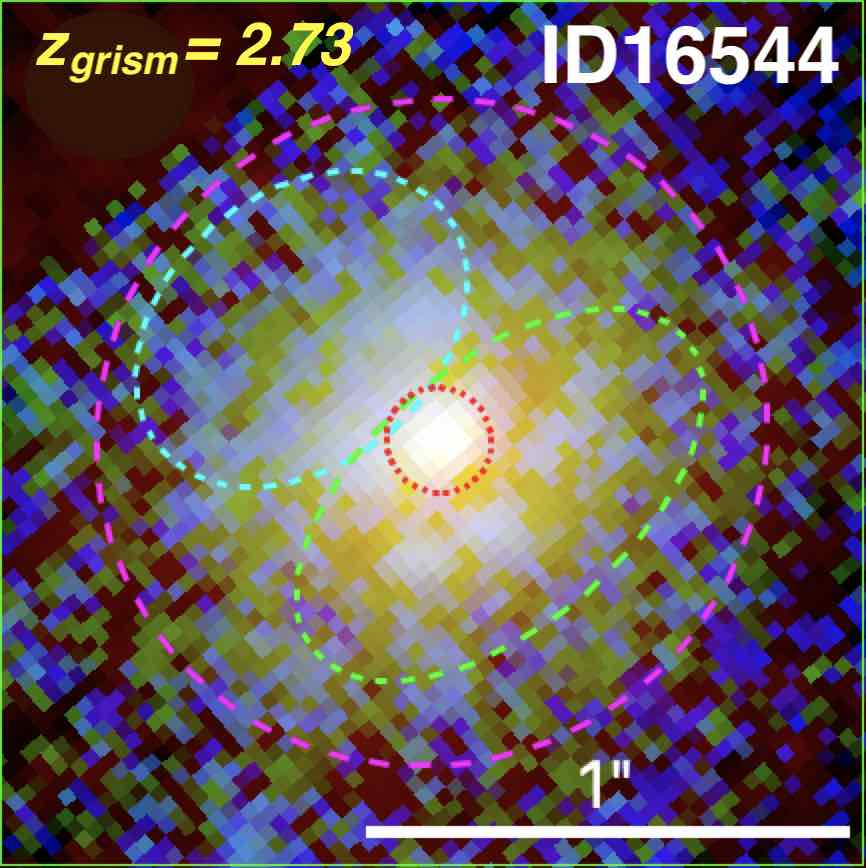
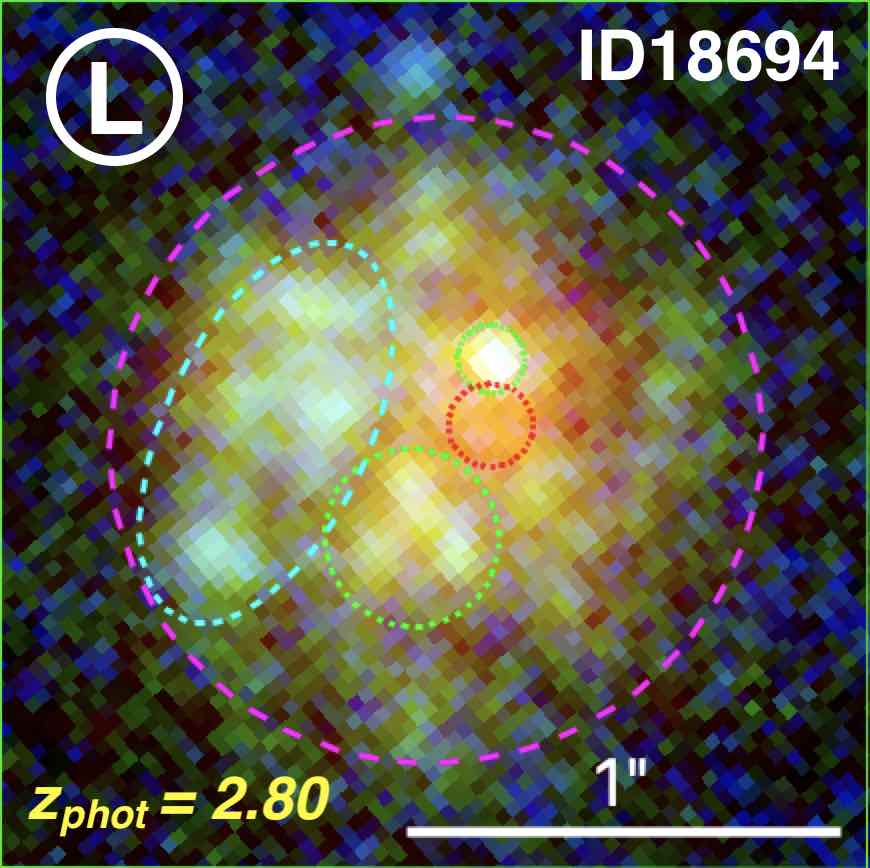
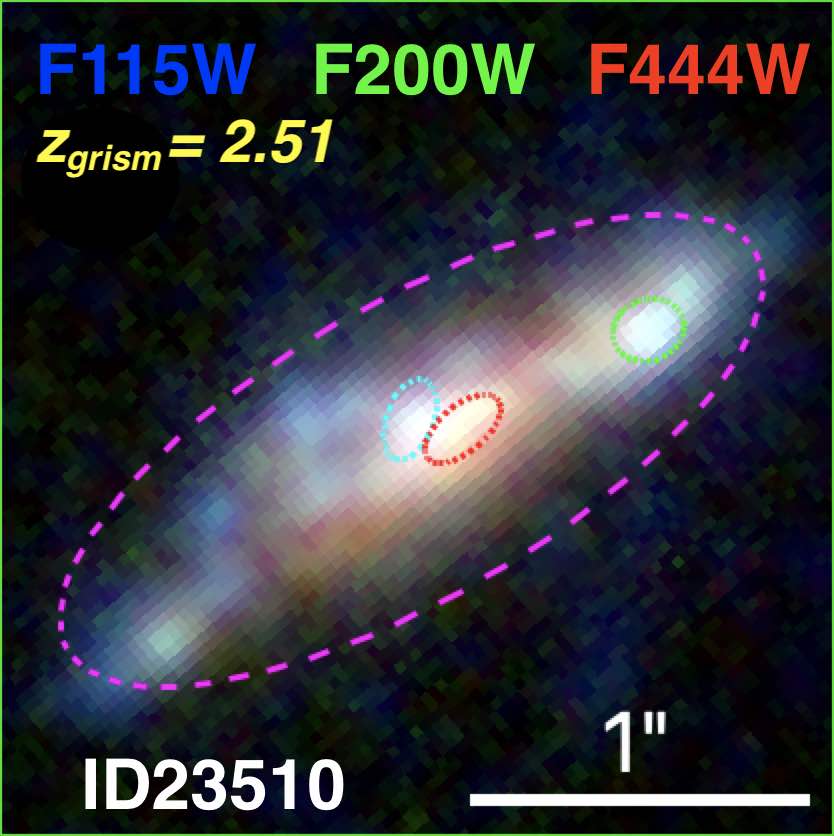
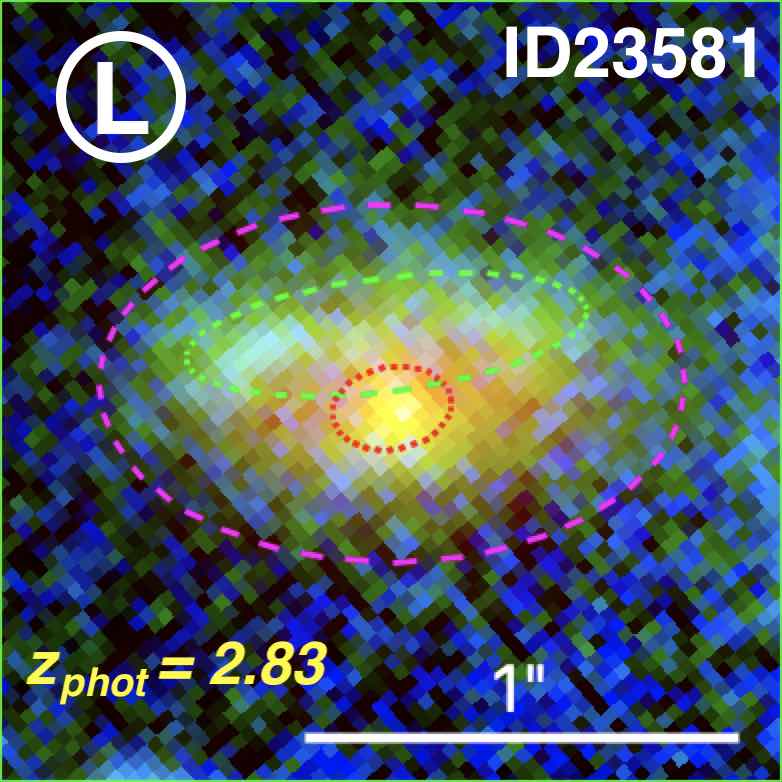
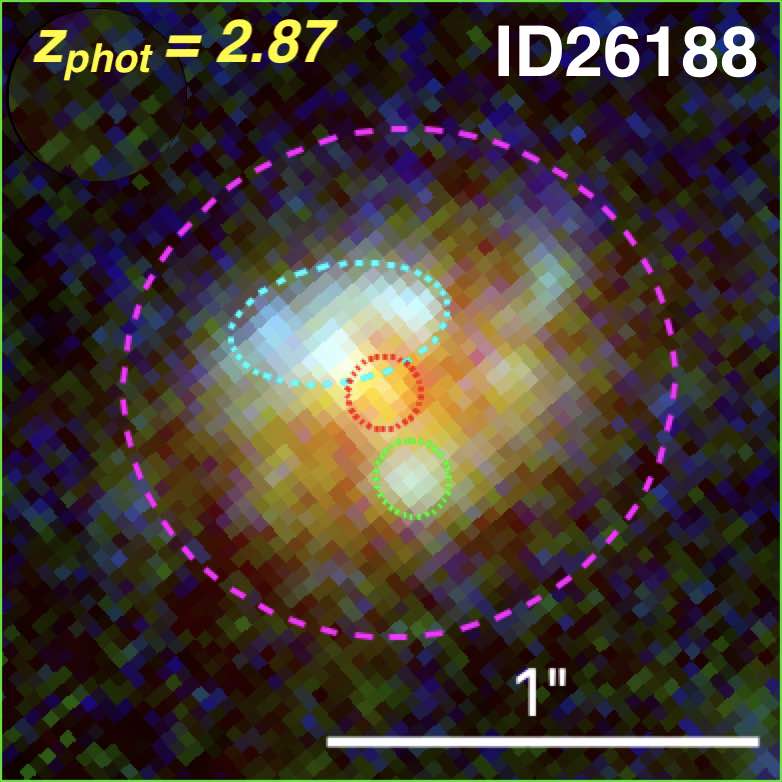
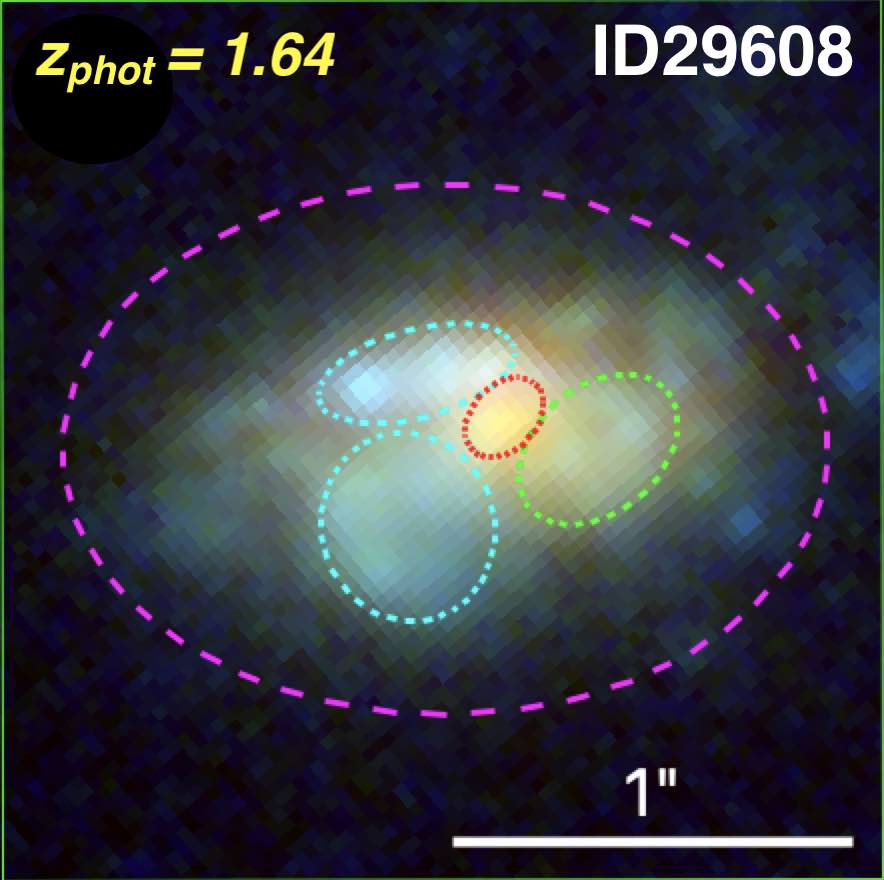
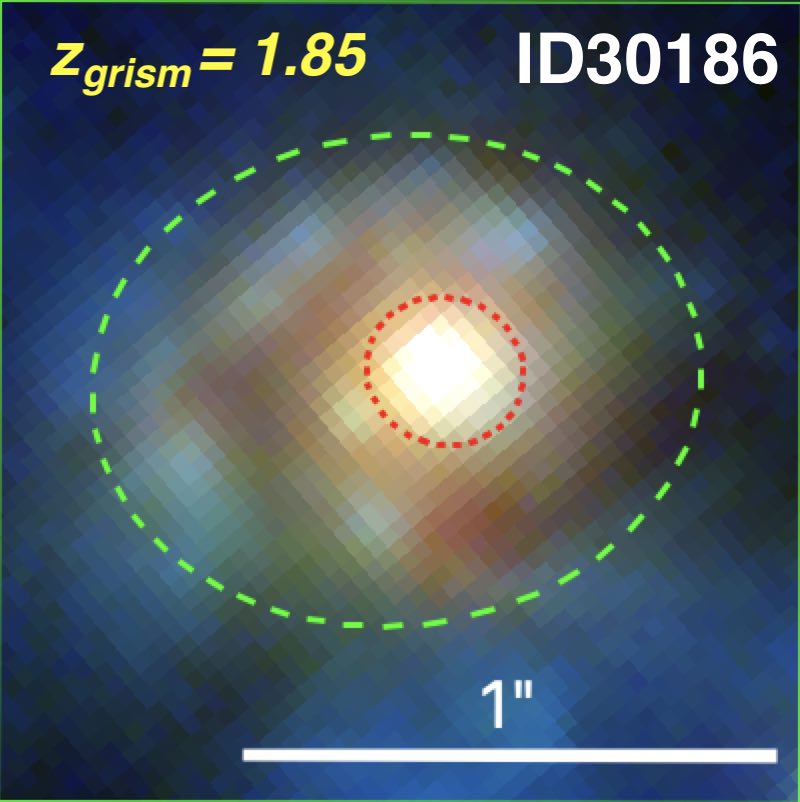
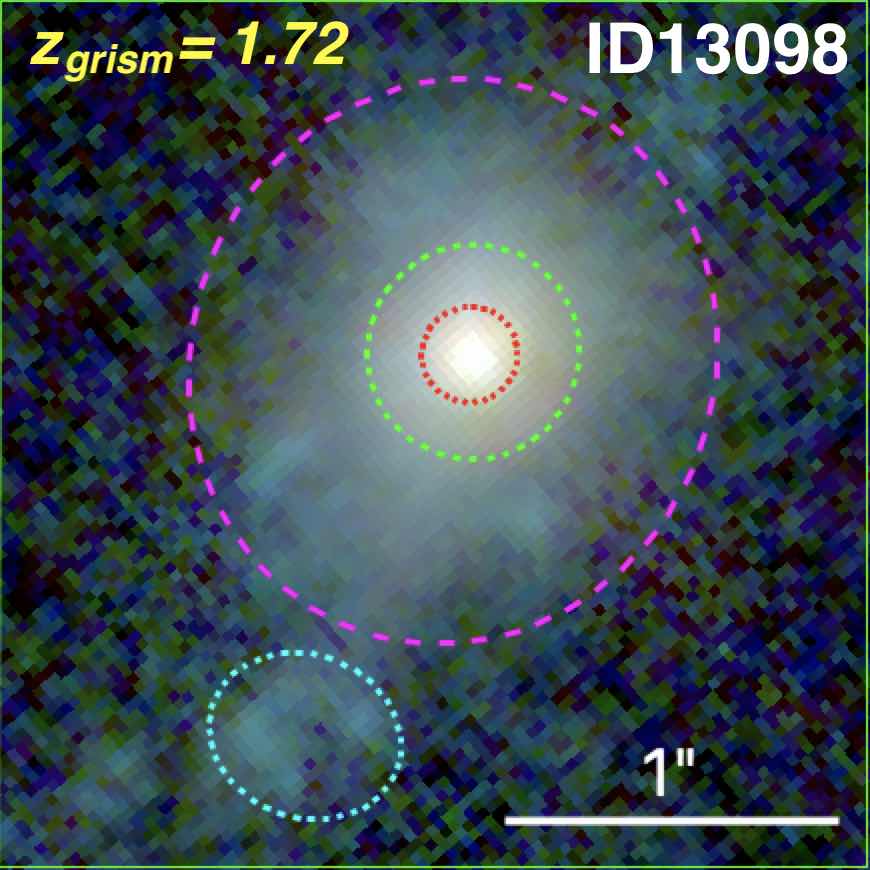
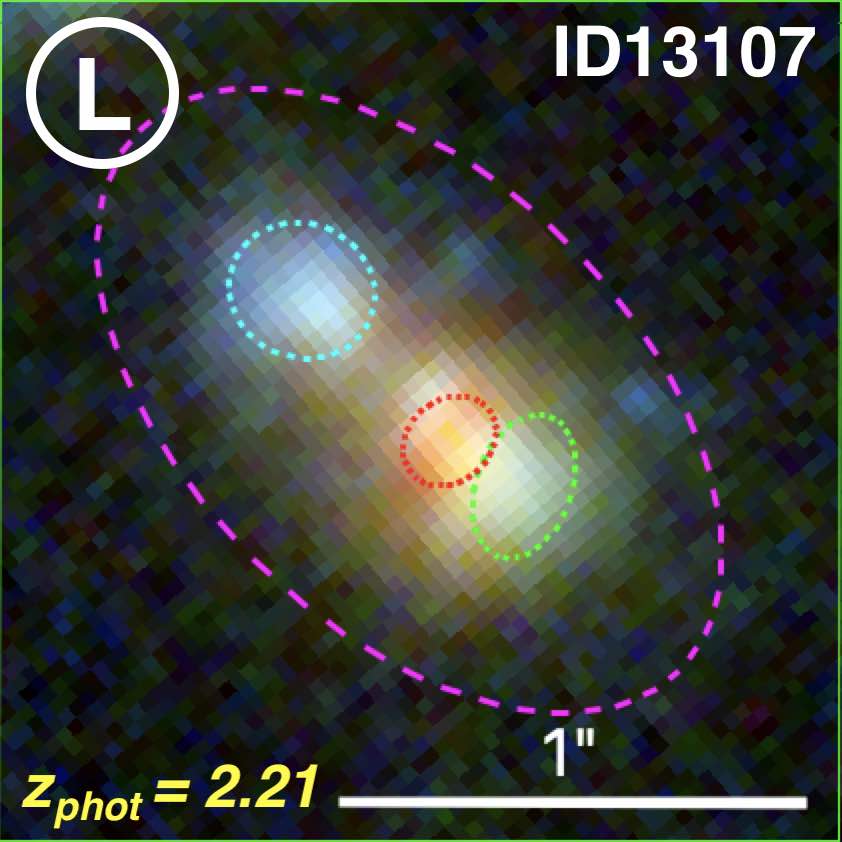
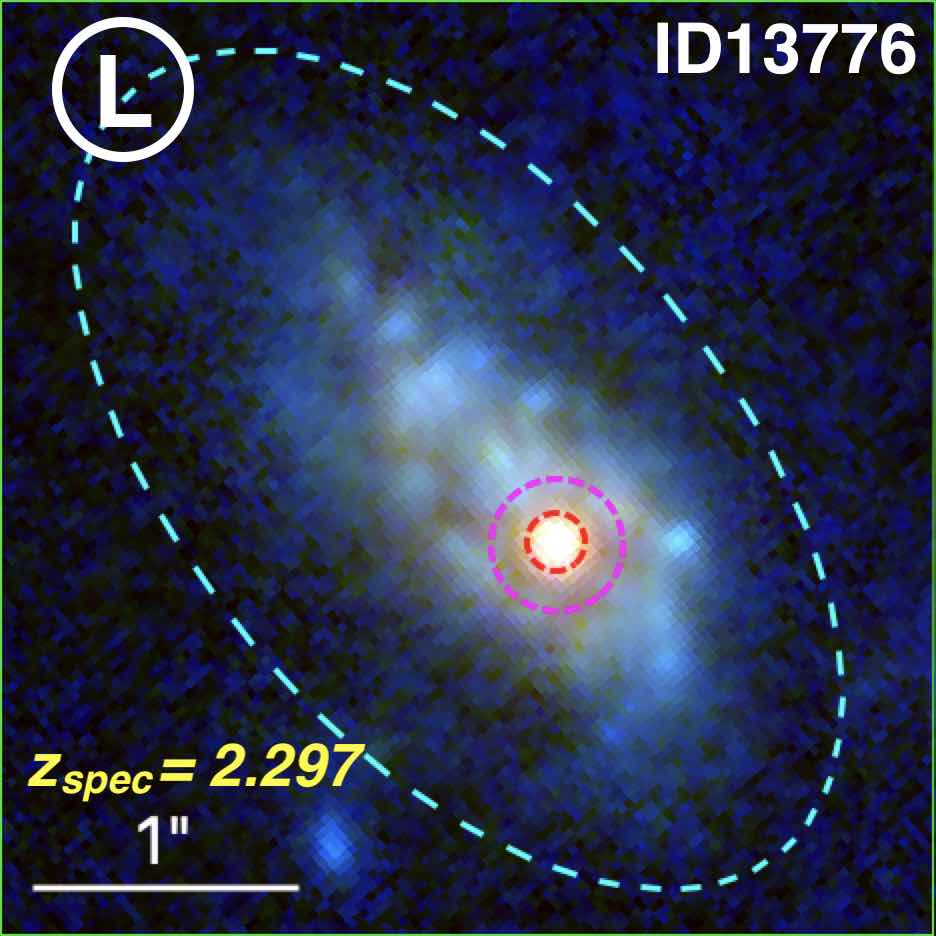
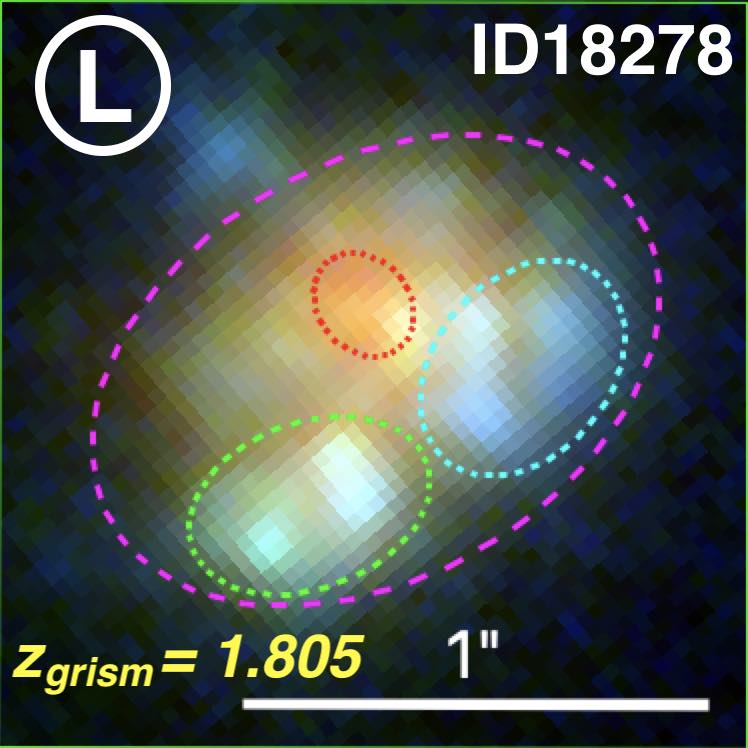
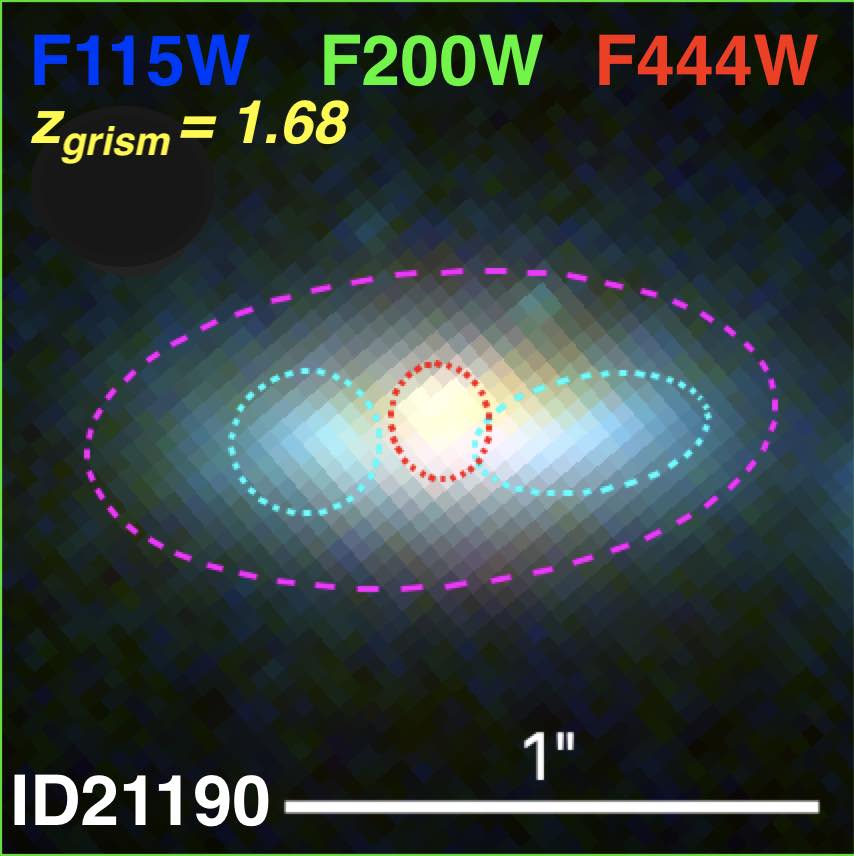
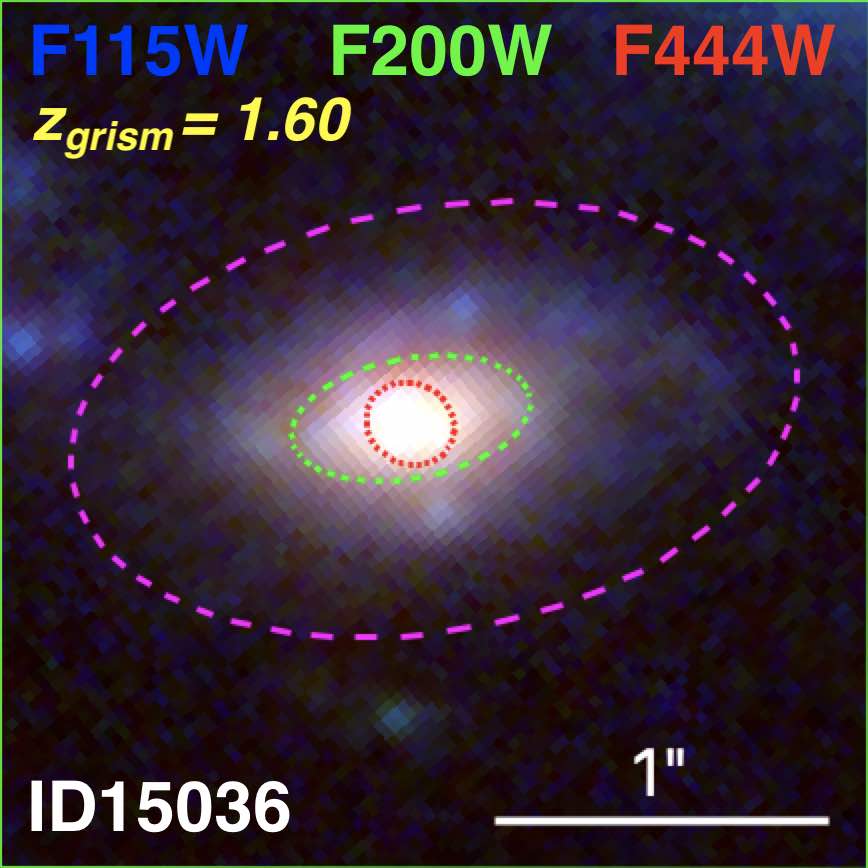
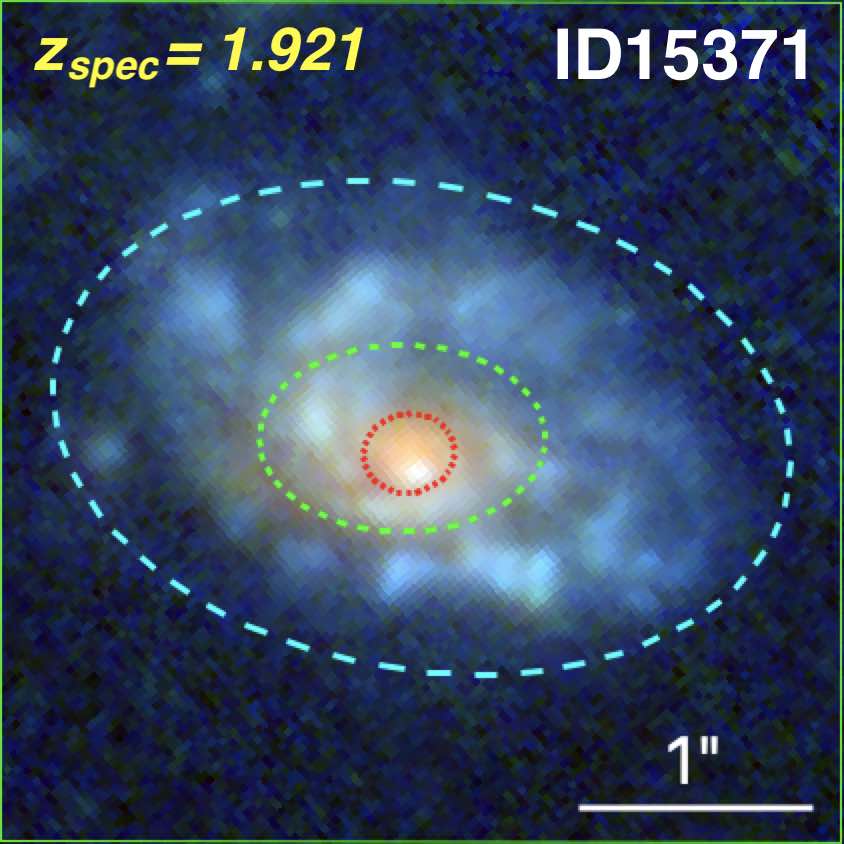
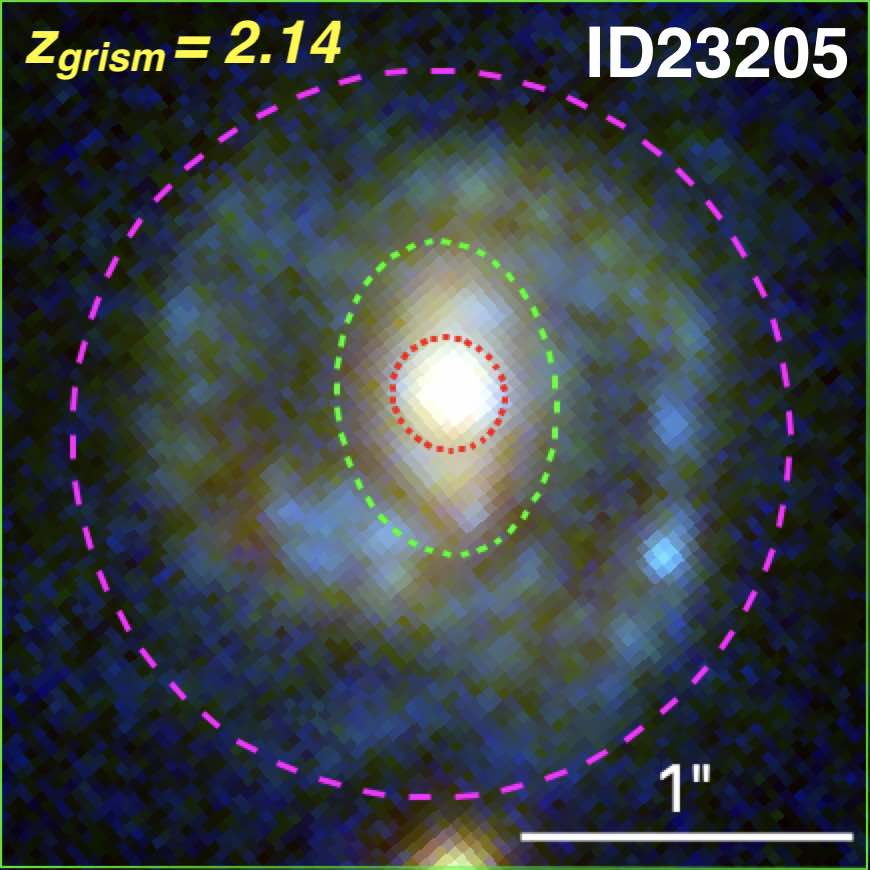
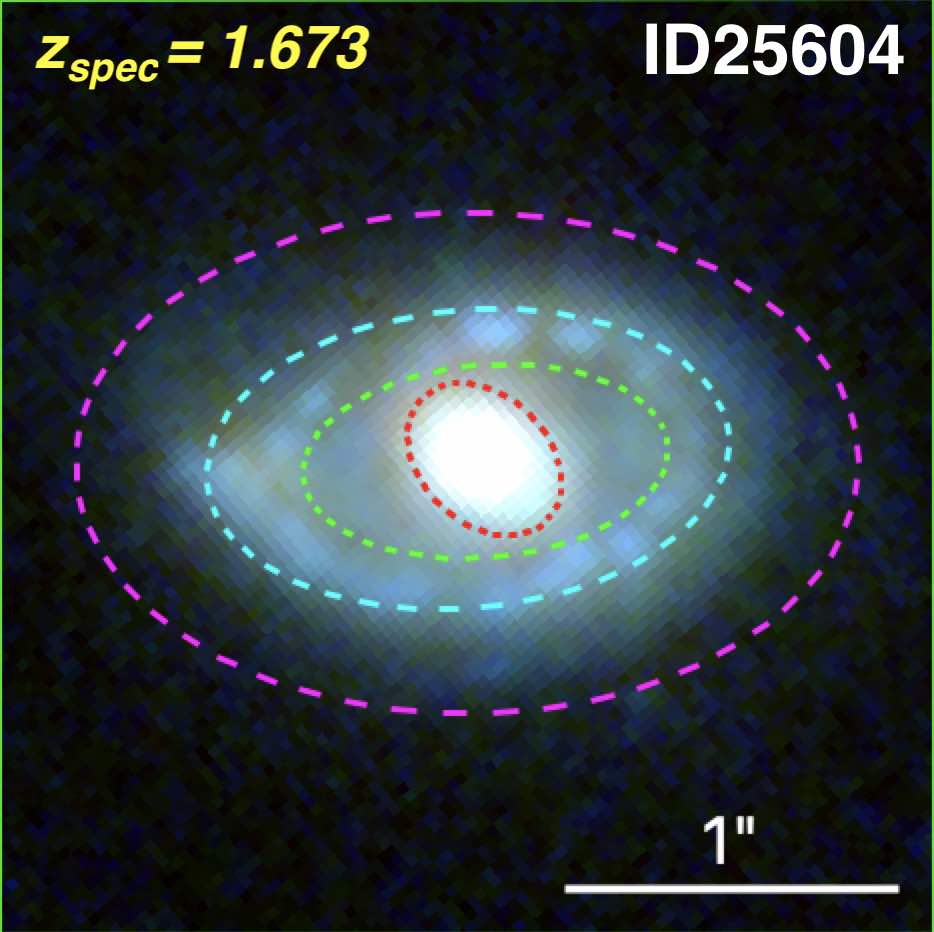
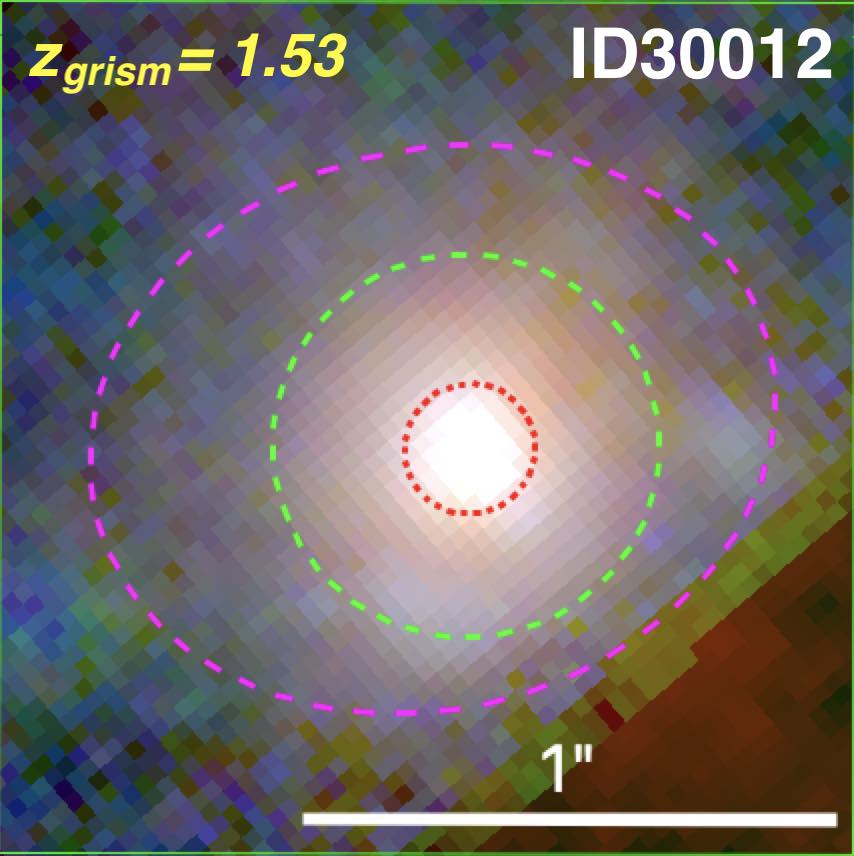
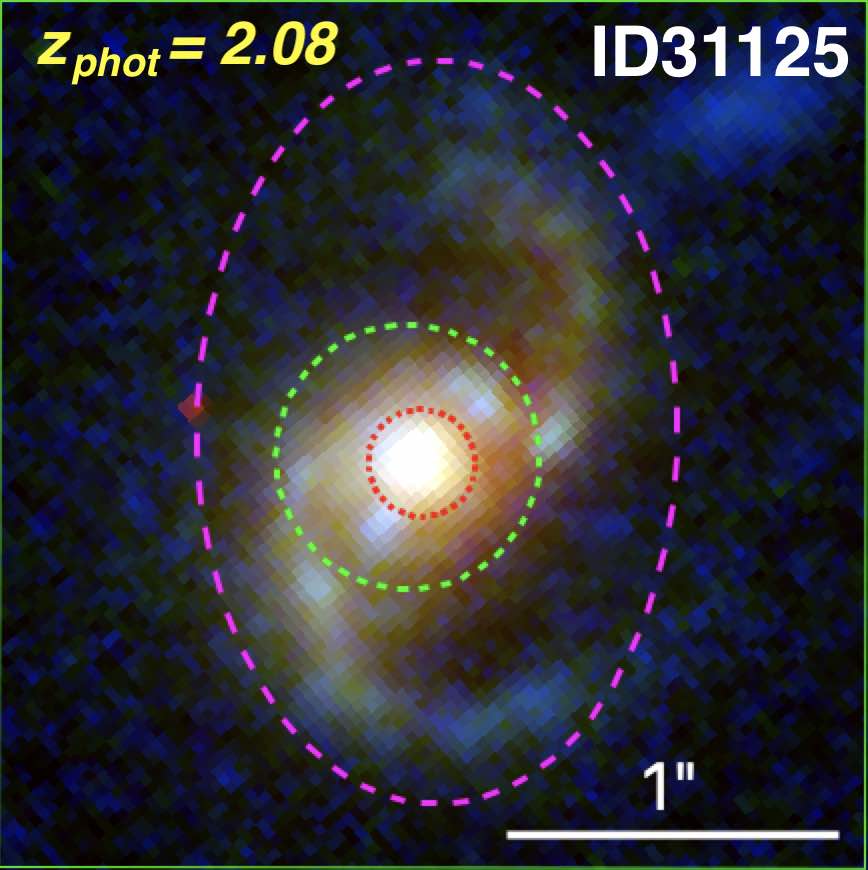
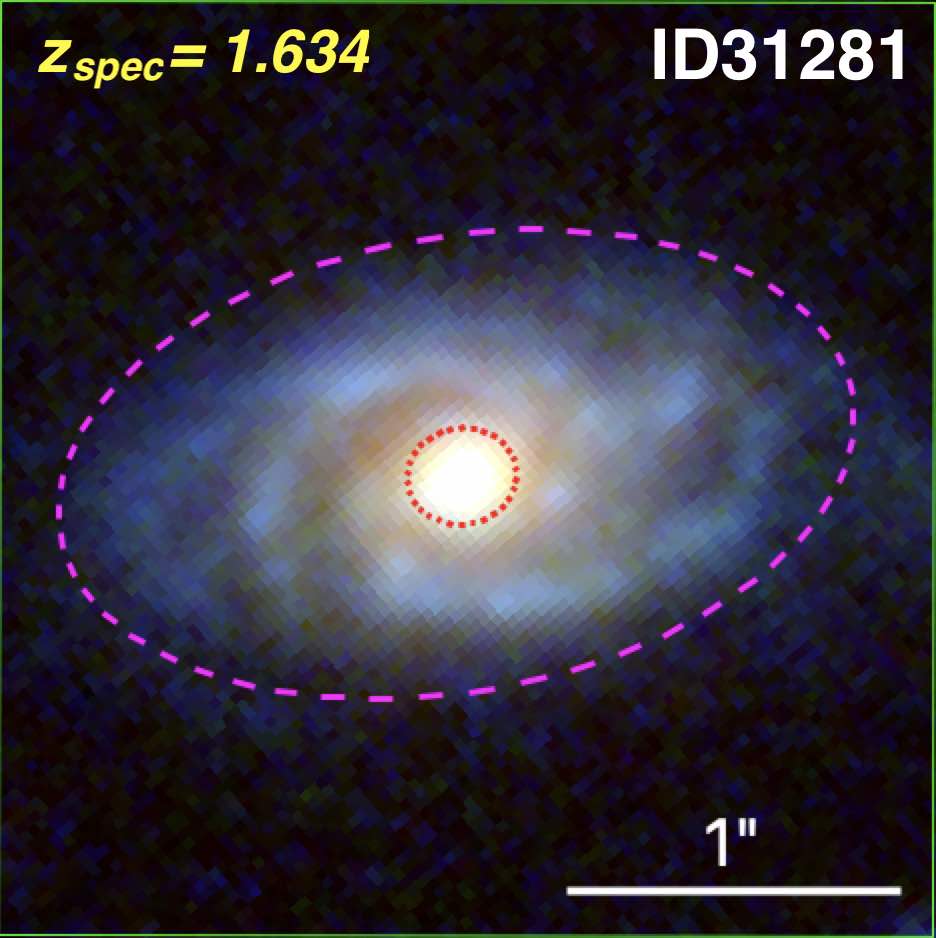
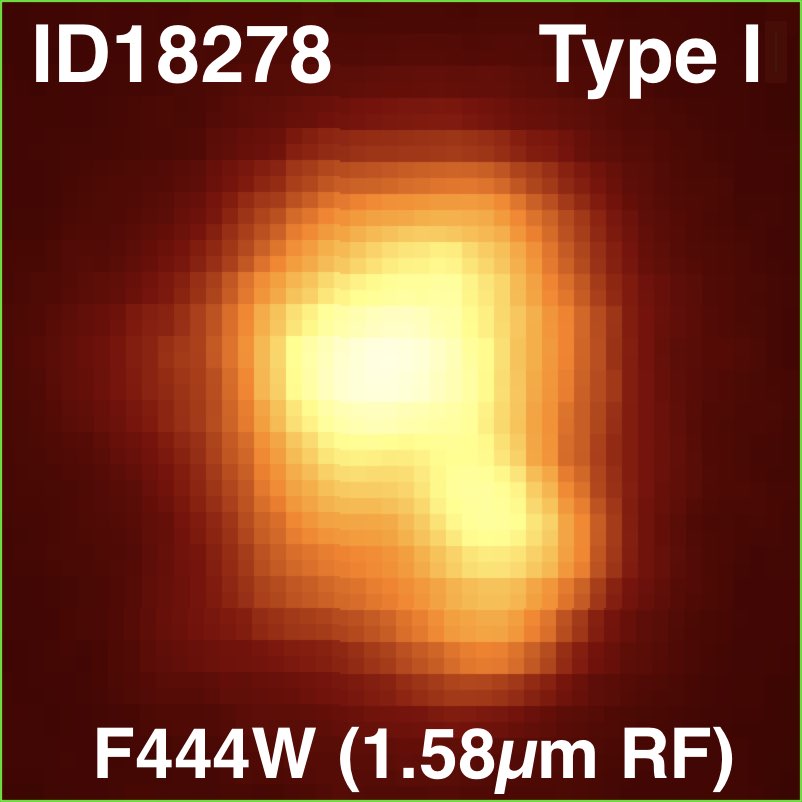
In Figs. 2.1, 2.2 and 2.3, we show RGB cutouts of our sample of galaxies using the F115W, F200W and F444W filters of NIRCam. The galaxies are separated in three classes, as discussed in detail in the next Section.
3 Methods
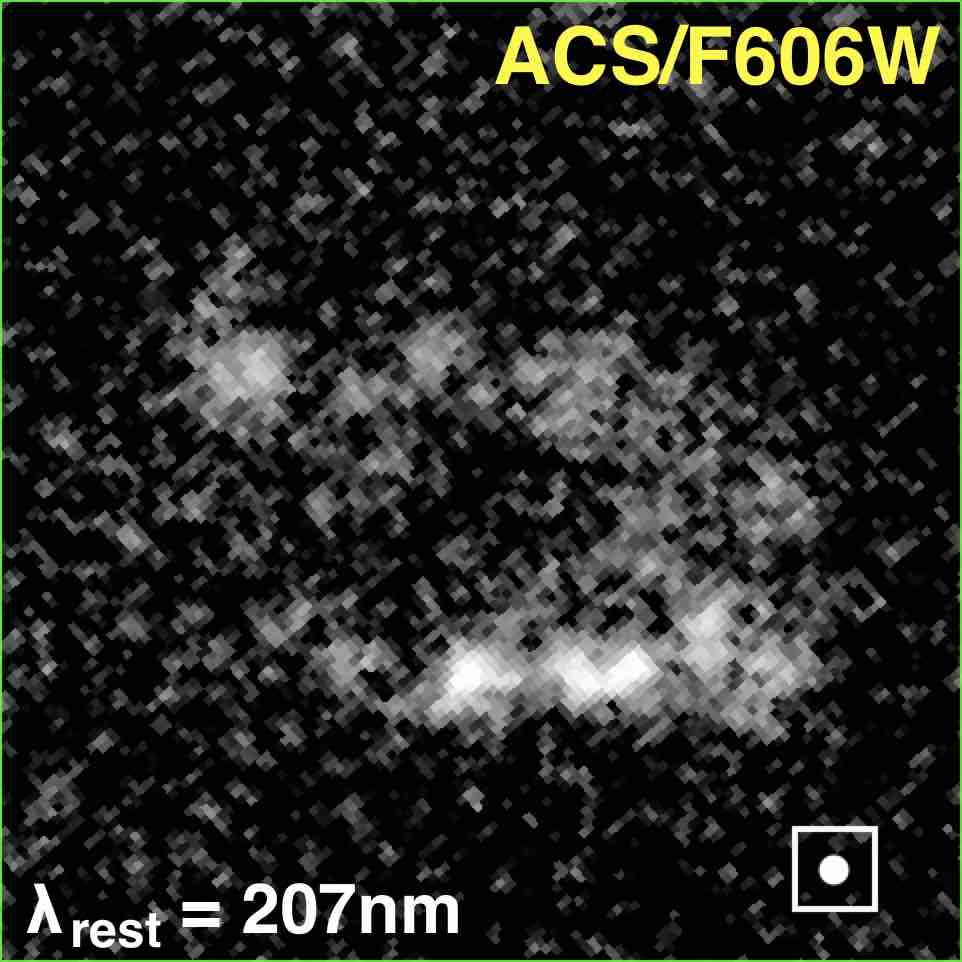
In this Section, we detail the methods used to analyze each galaxy, taking one of the objects (ID15371) as an example, to better clarify the procedure that we applied to all galaxies. For each galaxy, we started by creating cutouts in each band (HST/ACS F606W, F814W and JWST/NIRCam F115W, F150W, F200W, F277W, F356W, F410M, F444W). We show the cutouts of a DSFG in Fig. 3 where one can already see by eye a difference between the disk visible in all bands and the center of the galaxy invisible in the HST images but getting brighter at longer wavelengths, justifying the need to study each component individually rather than the galaxy as a whole. One of the first steps was to see if we could identify a bulge and a disk in each galaxies just like for ID15371, as discussed below.
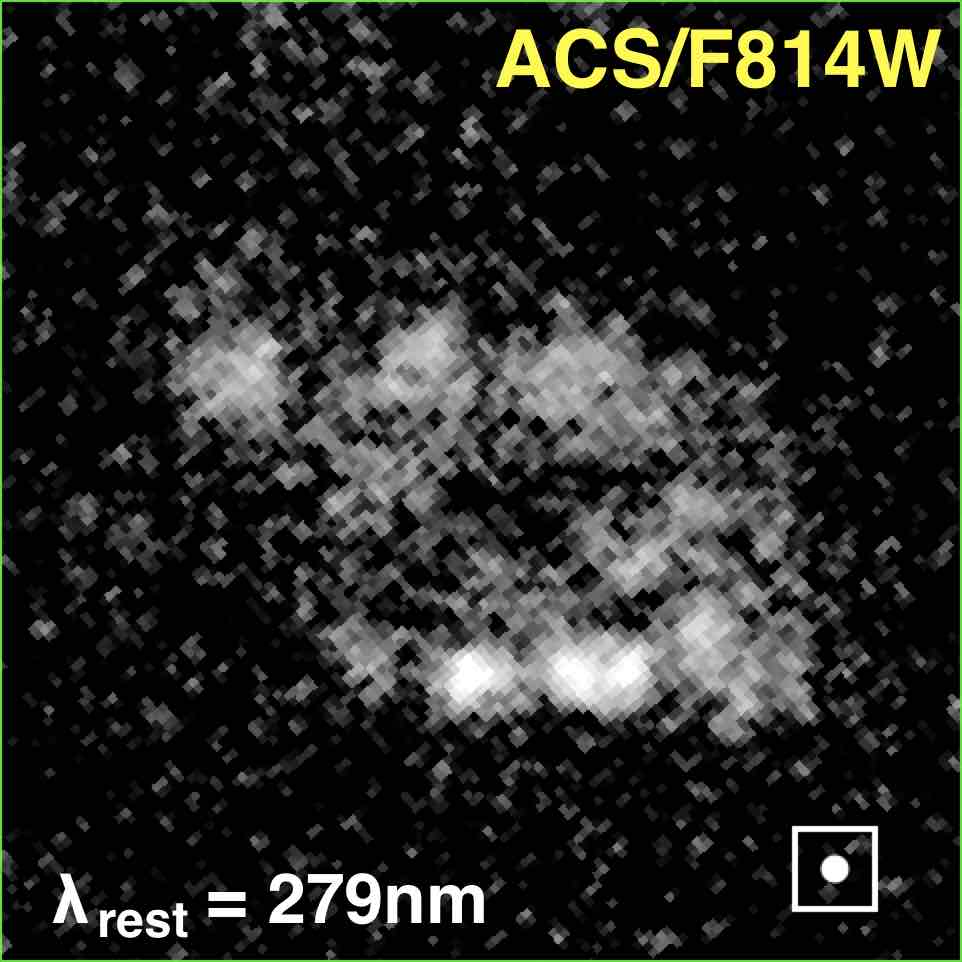
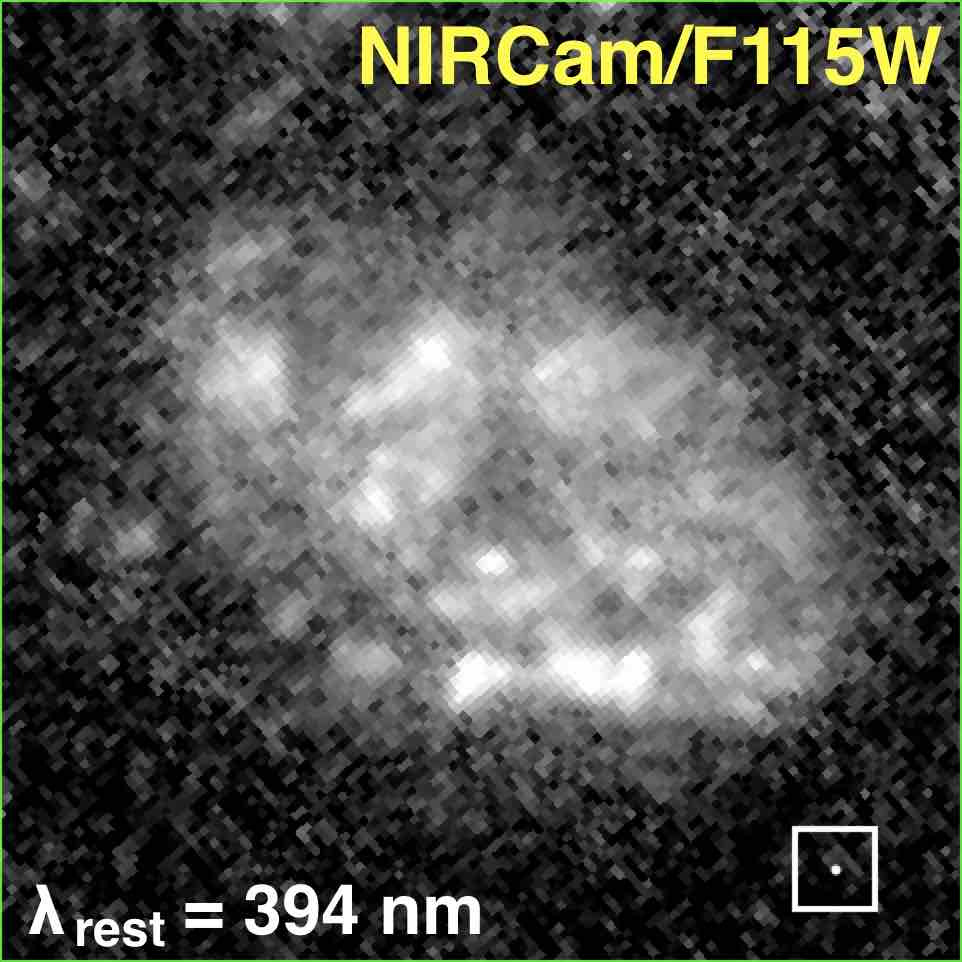
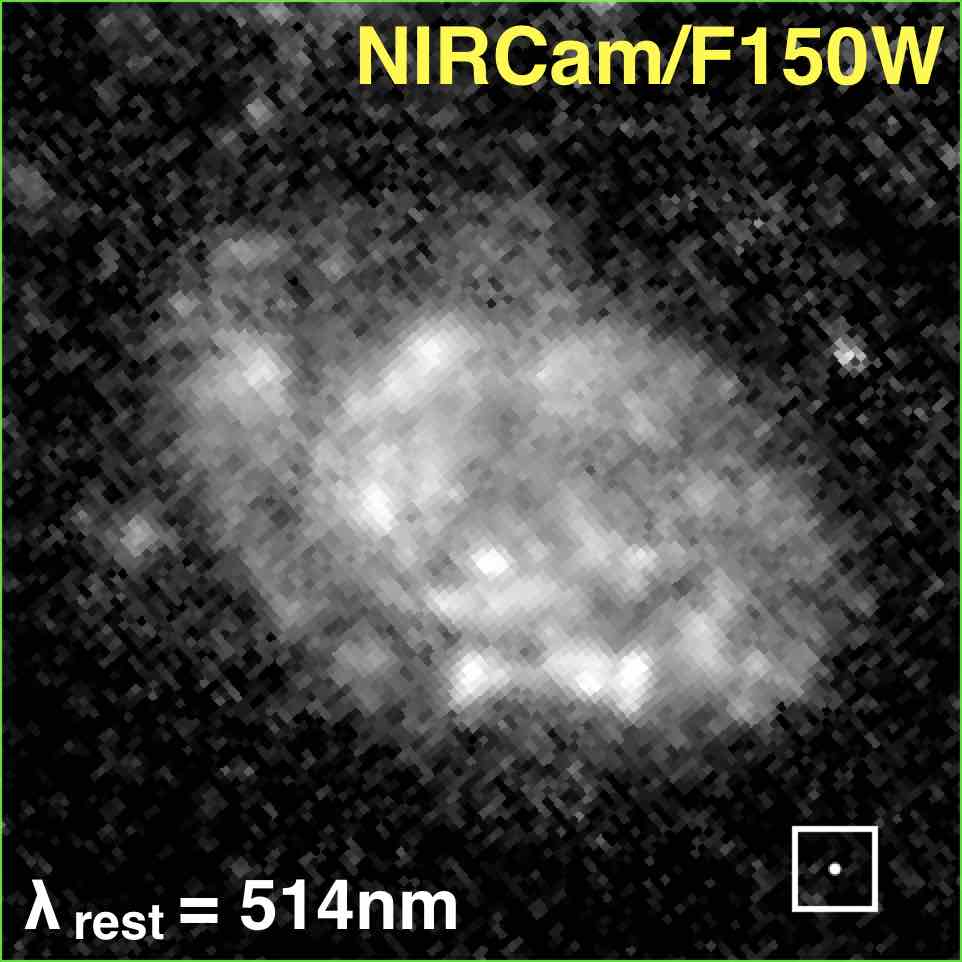
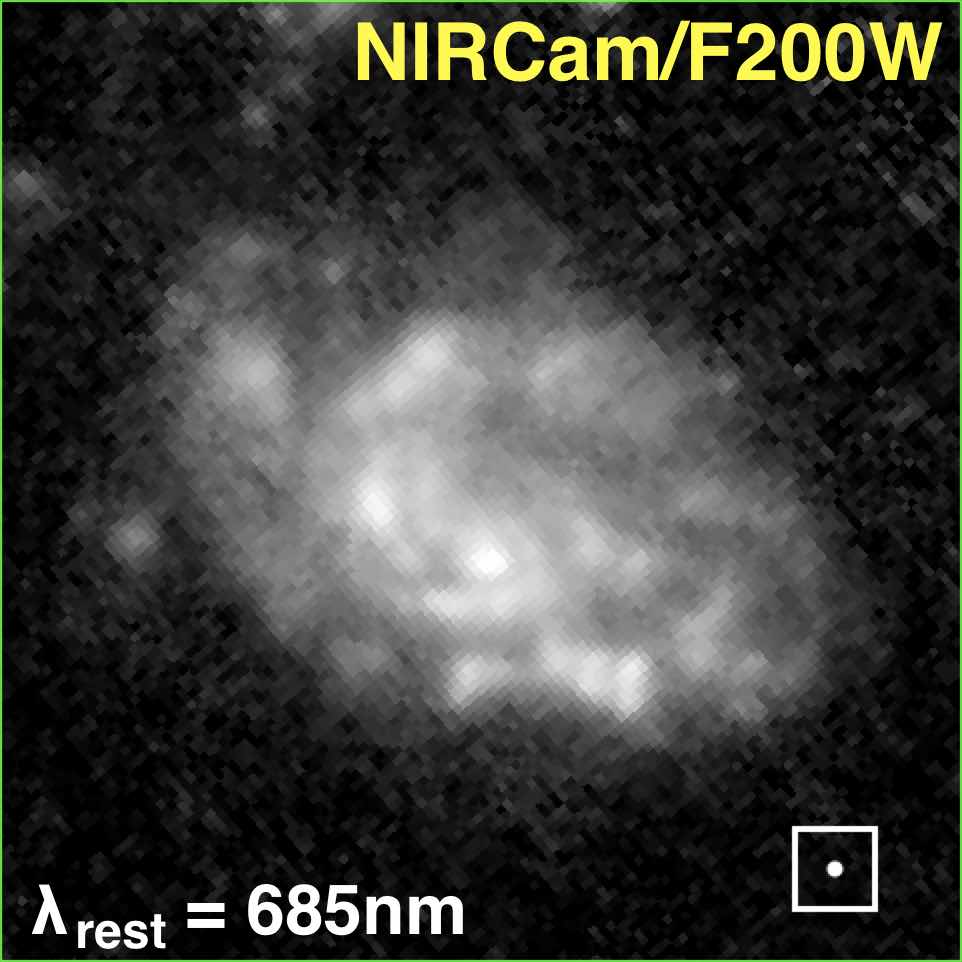
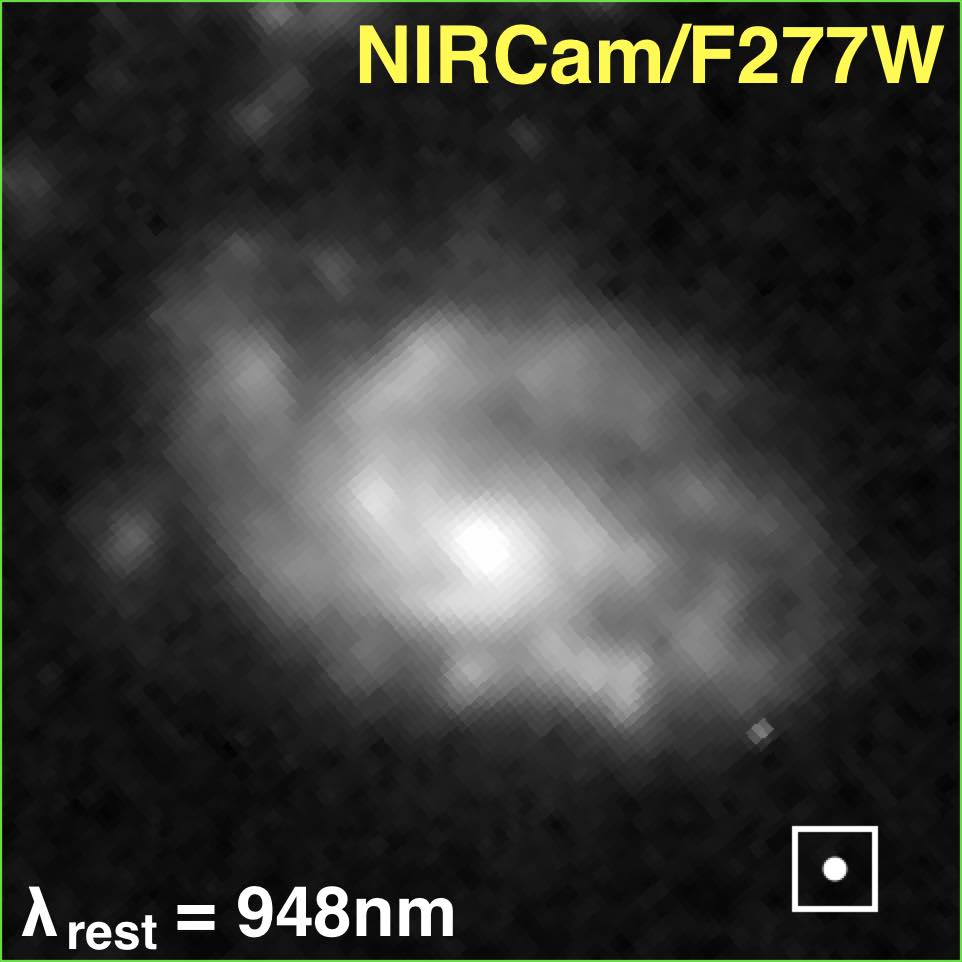
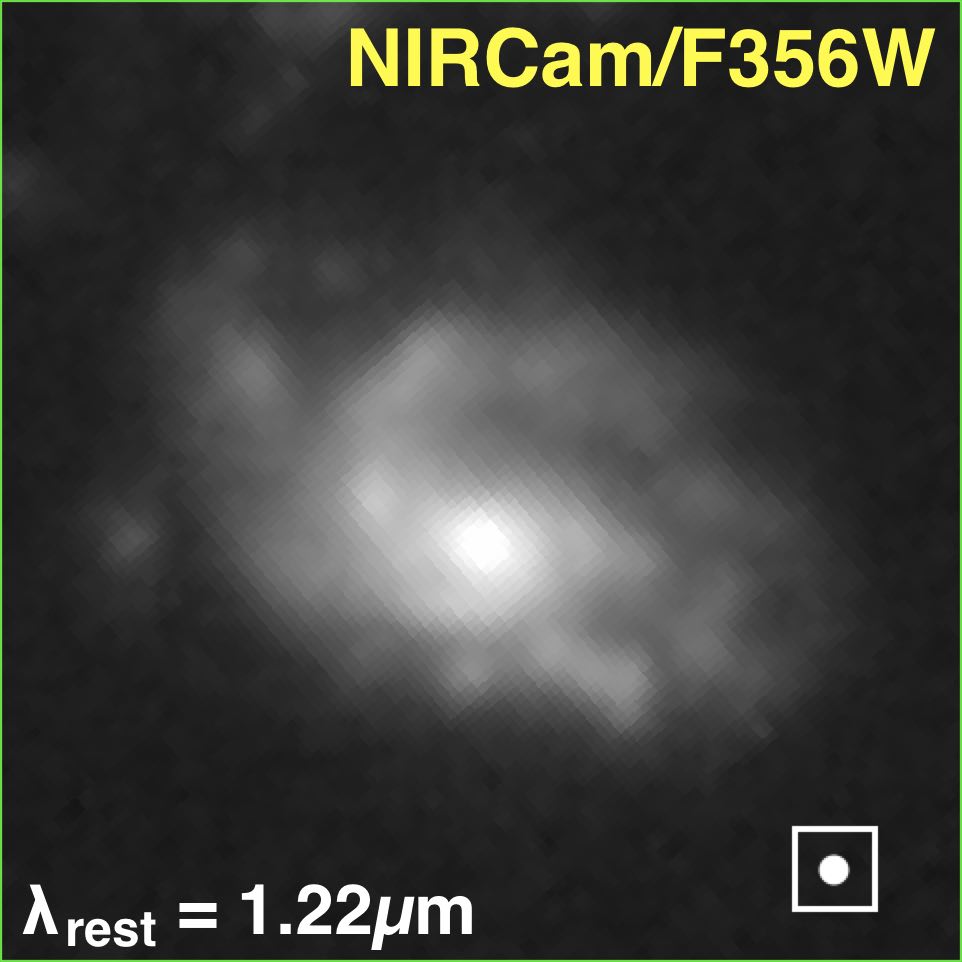
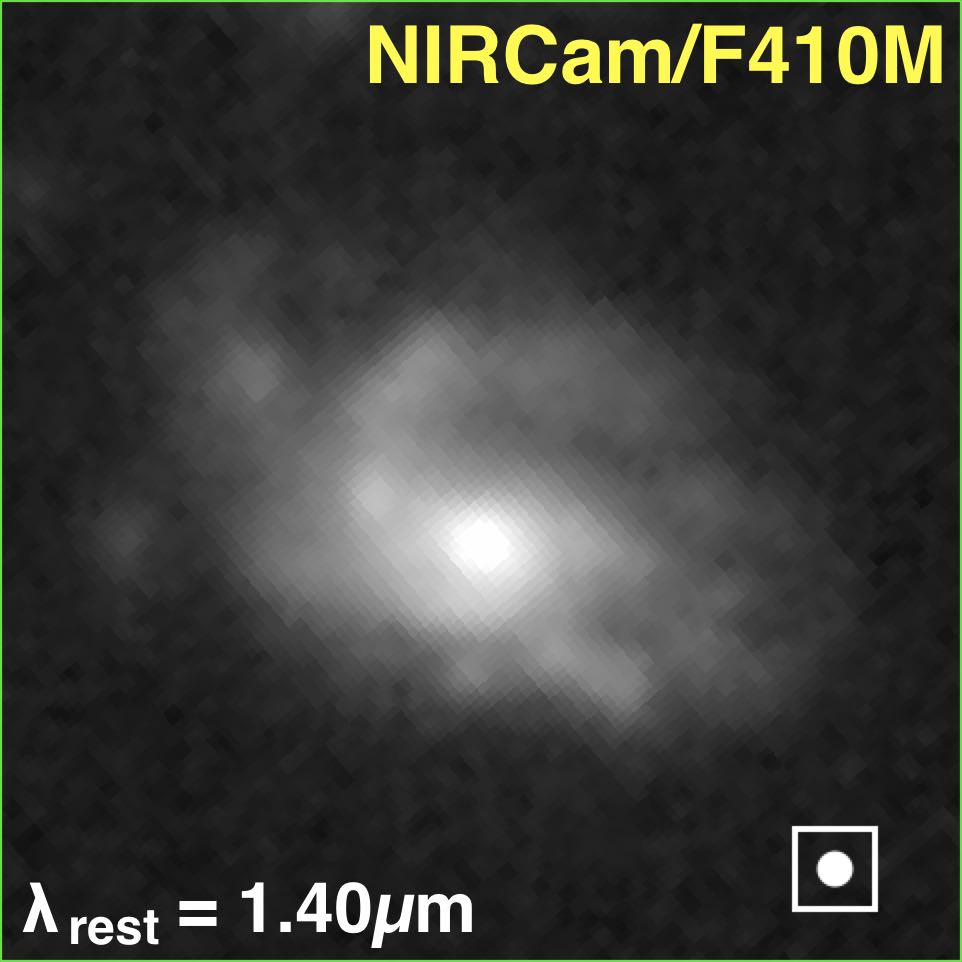
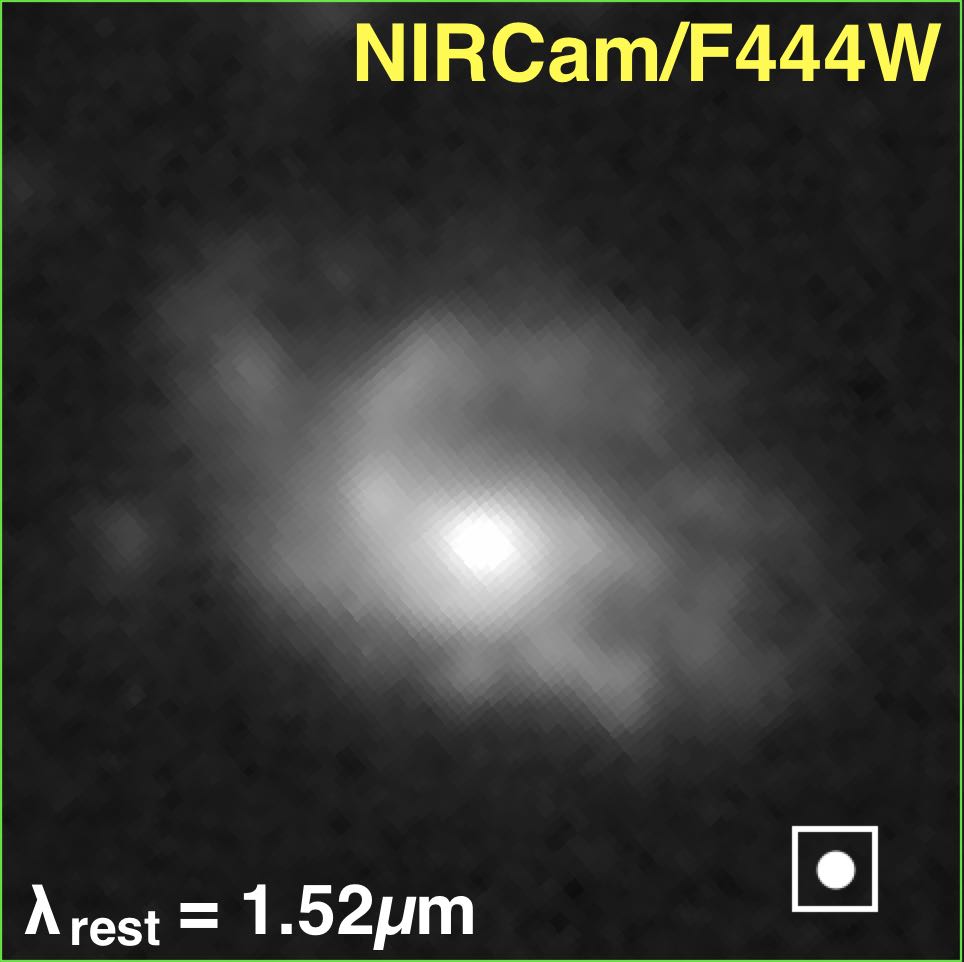
JWST/NIRCam images have a spatial resolution ranging from 0.040′′ at m up to 0.145′′ at m. The larger m PSF allows a resolution in physical size down to 1.23 (1.12) kpc for a galaxy at redshift 1.5 (3). This means that we were able to spatially resolve galaxy substructures down to a radius kpc. This made the resolution of F444W perfect for this study as we know the sizes of compact SF regions and giant clumps to be kpc (Gómez-Guijarro et al. 2022b; Rujopakarn et al. 2019; Förster-Schreiber et al. 2011).
3.1 Measuring galaxy sizes
Several studies have shown that the regions of star-formation, either traced by the dust emission at 1.1mm observed with ALMA or by the radio continuum emission detected by the Very Large Array (VLA), are more compact than the optical size of the galaxy (Puglisi et al. 2019; Gómez-Guijarro et al. 2022b; Fujimoto et al. 2017; Jiménez-Andrade et al. 2019, 2021).
JWST, with its sensitivity of the near and mid-IR, can detect both the obscured star-forming central part of each galaxy invisible with HST and the less obscured larger system, invisible with ALMA or VLA and bridge the gap.
To investigate this, we measured the total near-IR half-light radius () of each galaxy in the closest band to m rest-frame (F410M or F444W filter depending on the redshift). This rest-frame wavelength was chosen as it is a known tracer of the stellar mass of galaxies and is not affected by dust attenuation (Hainline et al. 2011; Casey et al. 2014). Moreover a recent study using NIRCam/CEERS data showed the excellent agreement between the near-IR size and the stellar mass size of galaxies around Cosmic Noon (van der Wel et al. 2023). We measured from a curve of growth method, given that in all cases the PSF has a negligible effect (much smaller than any ). The was defined as the radius of a circular aperture, centered at the center of mass (barycenter) of the galaxy, which encompassed half of the total flux density of the galaxy at the considered wavelength. To estimate the uncertainty, we used the fact that we typically have a 5% uncertainty on the measurement of the total flux of the galaxy (see Sect. 3.5 for more details on the photometry measurements). We also measured the bias introduced when using a circular aperture for edge-on galaxies (like ID23510 in Fig. 2.1) by comparing the fluxes encompassed in an elliptical aperture and a circular aperture. The difference is about 5%. Hence, by changing the total flux of the galaxy within 10% we can estimate the uncertainty on for which 50% of the total flux is encompassed.
We also measured the total optical half-light radius () of each galaxy in the closest band to 550nm rest-frame following the same procedure to compare it with .
3.2 Identification of cores/bulges
Depending on the redshift, the F444W filter of NIRCam probes the rest frame near-IR between 1.1m and 1.8m which is a good tracer of stellar mass (van der Wel et al. 2023). Hence, inspection of galaxy morphologies in this filter allowed us to search for the center of mass of each galaxy in our sample, or lack there-of, as a well defined peak in the F444W images. We were able to clearly identify a peak in the flux distribution of this filter for every galaxy. Depending on the galaxy, the peak was more or less pronounced, but always confidently there. We then defined a region in each galaxy encompassing the peak, as the core or the bulge of the galaxy. The regions are defined by eye as the peak is easily identifiable in every galaxies, the limit of the core is where the flux coming from the red F444W filter doesn’t dominate anymore the RGB (F115W, F200W, F444W) color. Generally, a bulge is often defined in the literature as a quiescent central component with a high Sersic index (e.g., ), and is a common component in local massive galaxies. In our study we did not attempt obtaining Sersic fits of separate components, and, more importantly, we anticipated that in many cases the central concentrations would not be quiescent, actually, most of them were highly SF and attenuated. We decided thus to call the central concentrations as cores when they were SF and bulges when they were quiescent. They are represented by the regions delimited by the red dotted lines in all galaxies in Fig. 2.1, 2.2 and 2.3.
We emphasize that for most of our sample, it would not have been possible to identify the center of mass only based on HST images (see e.g. ID15371 in Fig. 3 as an obvious example). This demonstrates once again the power of JWST when it comes to studying high-z DSFGs.
3.3 Lopsidedness
Having defined the core/bulge of each galaxy, we considered the rest to be the disk. Hence, we could obtain an evaluation of the lopsidedness for each galaxy. We considered it to be an important property to investigate because a lot of galaxies in our sample are obviously highly lopsided already by visual inspection (see for example ID11887, ID13776, ID18278, ID18694 in Fig. 2.1 and 2.2). To quantitatively study this phenomenon, we defined two parameters: the eccentricity, defined as:
| (1) |
where () and () are the coordinates of the central core of the galaxy and of its disk respectively, while is the radius of the disk. The center of the core was simply defined as the pixel with the maximum flux density in the F444W filter. The center of the disk was defined as the barycenter of the disk measured in the rest-frame optical band (F150W or F200W depending on redshift). We measure it in the optical and not in the near-IR because the disk is less attenuated than the core, hence brighter than the core at these wavelengths. To not be biased by the core, we applied a circular mask centered on () with a radius defined by the closest pixel to the center that has a F444W flux density less than half the core center flux density. Finally, was calculated using a circular aperture centered on () encompassing half of the disk flux density. This quantifies the eccentricity of the disk with respect to the core/bulge compared to its size and is a-dimensional.
The other quantity that we defined to probe the lopsidedness of the galaxies is the asymmetry. The asymmetry was calculated for the F444W NIRCam filter as we are trying to probe the mass distribution asymmetries and, as previously mentioned, F444W is the best tracer of the stellar mass distribution. We calculated the asymmetry by rotating each image by and subtracting it from the original image, the center of rotation was () from Eq. 1. The asymmetry is defined as:
| (2) |
where and are the flux of the - pixel and its symmetric counterpart with respect to the center of the central core/bulge as defined in Equation 1. is the total flux of the galaxy. Since we worked on background subtracted images, we considered the background asymmetry to be negligible. This quantity describes how smoothly and how symmetrically the stellar mass is distributed around the central core/bulge of the galaxy and is also a-dimensional. Usually, the lopsidedness is probed using a Fourier decomposition (e.g. Dolfi et al. 2023; Kalita et al. 2022; Jog & Combes 2009; Bournaud et al. 2005). We decided to use a different, simpler method; the asymmetry, that has already been used in gas velocity space and was found to correlate well with the Fourier analysis of stars (Bournaud et al. 2005; Matthews et al. 1998).
3.4 Clumpiness
After identifying the core or bulge of each galaxy, we investigated the surrounding disk-like structures. Some of the galaxies have a smooth disk, others have a much more perturbed/complex disk morphology showing a large number of clumps (see Fig. 2.1, 2.2 and 2.3).
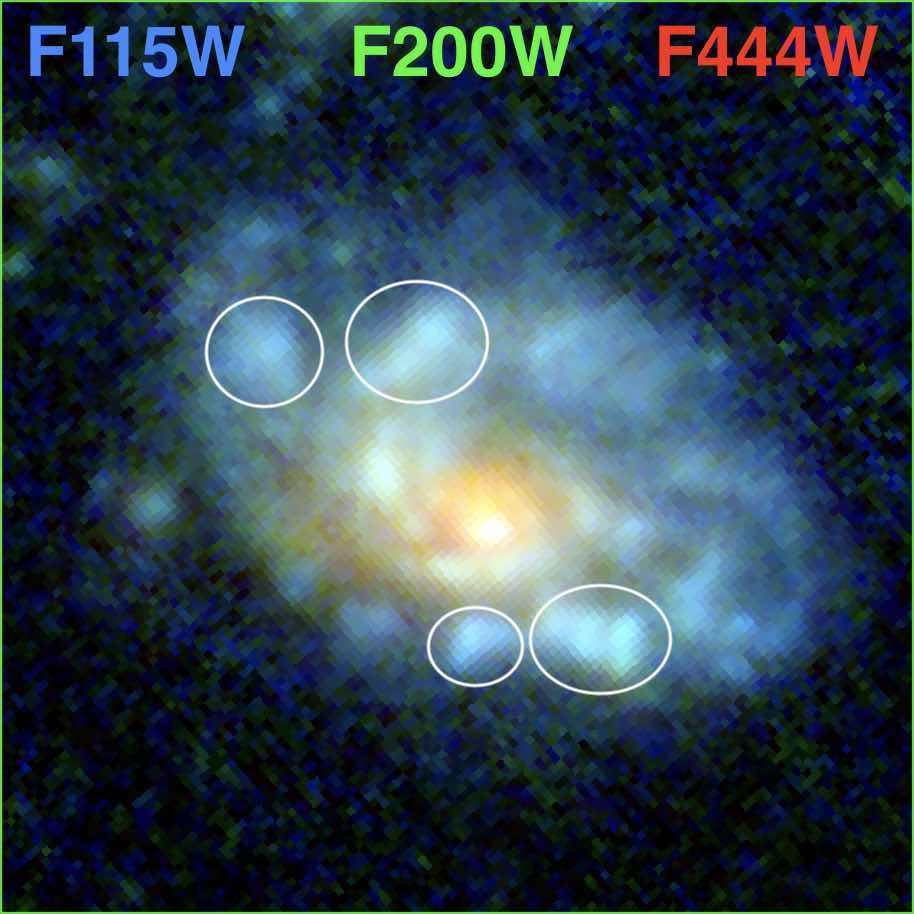
We did not embark in a physical study of the clumps in this work. Our goal for this paper is to assess the presence or not of clumps in the disks and have an idea of how fragmented the disks are. Hence, we did not try to derive any physical properties of the individual clumps. We decided to measure a clumpiness index, defined as the number of clumps in the disk of each galaxy. We counted the number of clumps visually identifiable in the RGB (F115W, F200W, F444W) image, making sure that the bulge/central concentration was not counted as a clump. This number varies from 0 up to 7 for the clumpiest galaxy. To be counted as a clump, the feature had to be compact compared to the galaxy size, and either had to have a different RGB color from the surroundings and/or appear as a local brighter spot. The clumps appear most clearly at the shortest wavelength (F115W or F200W filters), as expected (Wuyts et al. 2012). For ID15371, we identify 4 clumps, there are shown by the white ellipses in the left panel of Fig. 4.
3.5 Spatially resolved photometry
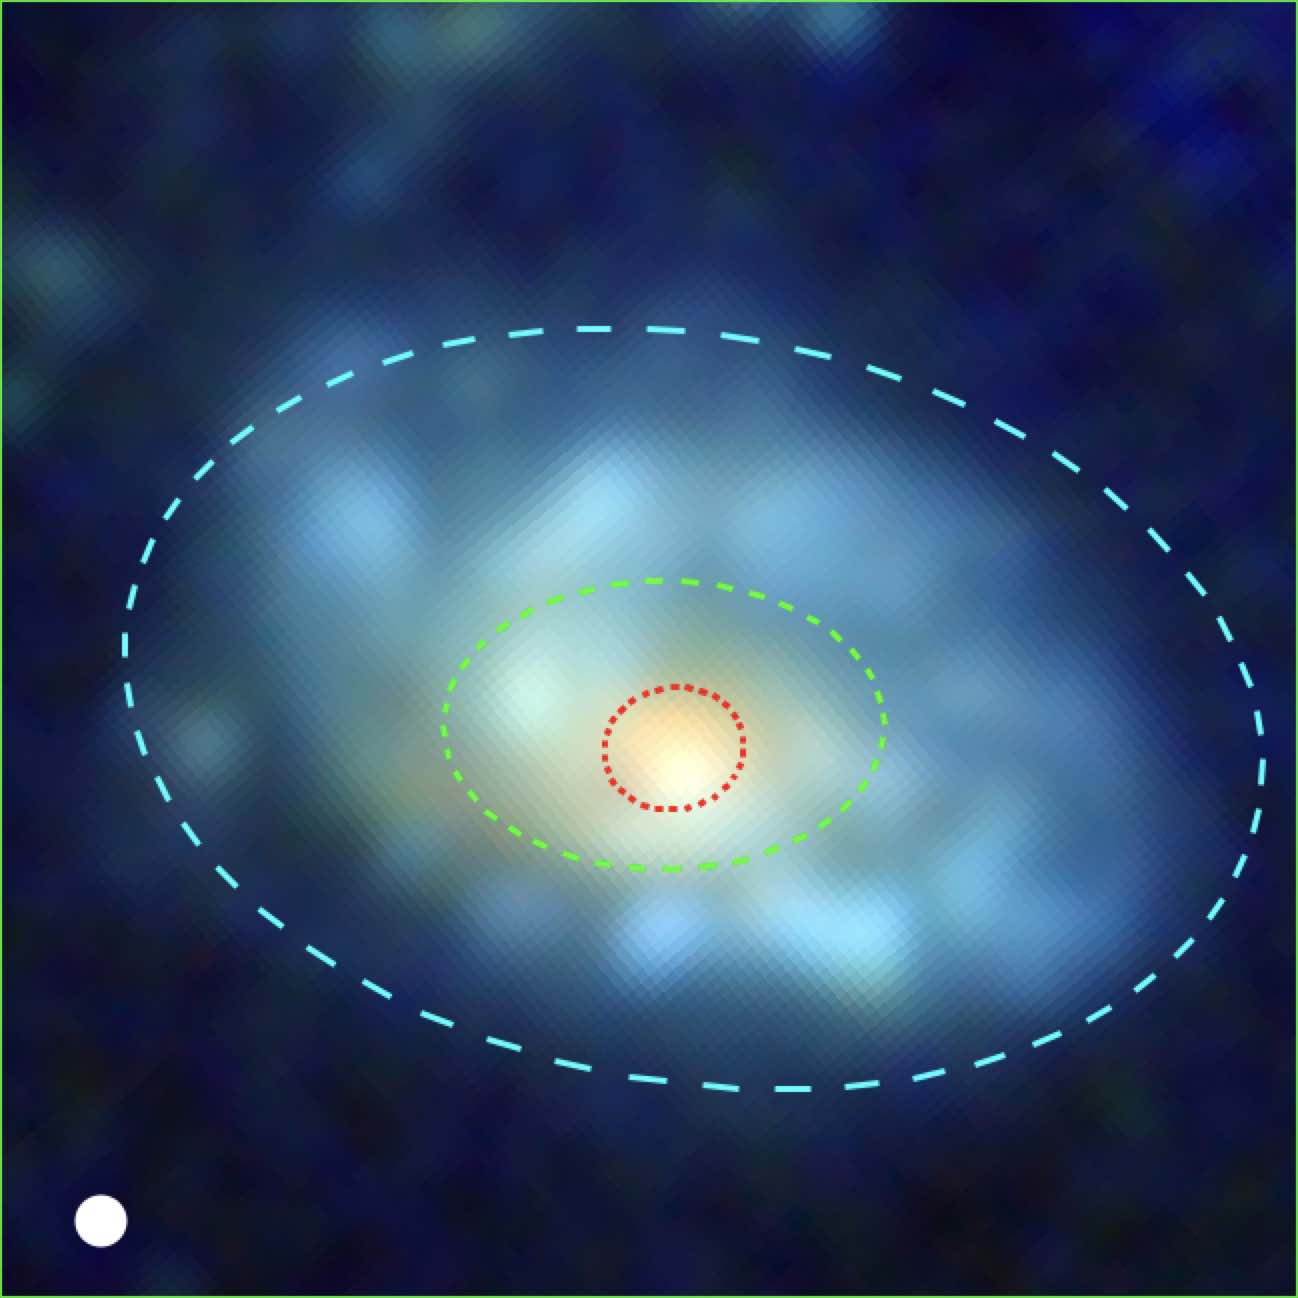
To quantitatively study our galaxies, we needed photometry measurements. We decided to divide our galaxies in several components. For the simplest cases we only had the core/bulge and the disk, and when the disk had several clump/patches with different colors in the RGB image, we broke it down to several circular or elliptical regions. Each region was designed so that it had, qualitatively, a homogeneous (F115W, F200W, F444W) color. The division of the disk is once again done by visual inspection. We emphasize that we seek to study each region that has a different color, hence, if several clumps are close and with a similar RGB color, we consider them to be part of the same disk component. Moreover, due to the spatial resolution of the PSF-matched images, we did not want to design too small regions that could lead to biased flux measurements. We tried to respect a balance between the size of the component we defined (not too close to the PSF size) and the homogeneity of the RGB color inside it. We emphasize that the components are not necessarily concentric as most of the galaxies are not radially symmetric and are not limited in number. If we observed, for example, two blue disconnected patches in a galaxy, we defined them as two different components and fitted them individually. In the case of ID15371, we divided the galaxy in three regions, the red central core/bulge, the bluer disk and an intermediate region, that is still part of the disk but close to the red core and with intermediate colors (see Fig. 4).
In terms of rest-frame colors, since our sample of galaxies is distributed across to , F115W probes the rest-frame near-UV/blue (nm), F200W probes the rest-frame green/red (nm) and F444W probes the rest-frame near-IR (nm). The scatter in rest-frame wavelength is less or equal to the band-width of each filter. This means that we globally probed consistent colors between galaxies.
By dividing each galaxy in sub-galactic regions, there was a risk that small regions get close to the PSF FWHM of some filters. Hence, leading to an underestimation of the flux at the longest wavelengths, and an artificial deformation of the SED. To avoid this, we decided to work on PSF-matched images using the broader PSF of the F444W filter. In Fig. 4, we show RGB images of the DSFG ID15371 using (F115W, F200W, F444W) before and after PSF-matching. To make sure that we didn’t underestimate stellar masses and SFR when running the SED fitting, we chose regions larger than the PSF FWHM (0.145”). In Fig. 2.1, 2.2 and 2.3, for each galaxy we overlay the delimitation of the different components we decided to study separately based on their color (those RGB images are showed before PSF-matching).
After having defined the regions to study, we measured the flux in each band for each region. To do so, we summed the value of each pixel in each region of the science image. The pixels were counted only once, meaning that the flux in the smaller regions (like the red ellipse for ID15371) was not included when calculating the flux of larger regions (like the green ellipse for ID15371, see Fig. 4).
Our goal was to fit the SED of the different components of each galaxy. For the properties that we later extracted from these SEDs to be reliable, it was crucial that we had reliable uncertainties on the fluxes. To estimate the flux uncertainties, we re-normalized the errors propagated via the Root Mean Square (RMS) images. The uncertainty was defined as:
| (3) |
where the sum was made on all pixels in the region, is the RMS of the pixel , and the total number of pixel in the region. We decided to define , a normalisation factor that takes into account extra noise, e.g. from the correlated signal between pixels that is particularly important for the long wavelength filters that were drizzled from a pixel size of 63mas to 30mas. To calculate this factor, we measured the flux dispersion in empty regions of the science image for several apertures in each band. We then compared this value to the RMS calculated from the RMS image in apertures of the same size and the normalisation factor is defined as their ratio. To be conservative, we never applied a factor leading to lower uncertainties. These factors are generally small, ( at most).
3.6 SED Fitting
To characterize our sample of galaxies, we needed to have access to their resolved and SFR. To this aim, we fitted each galaxy component SED using the Code Investigating GALaxy Emission (CIGALE, Boquien et al. 2019). We used a single declining exponential model also known as “ model” to model the star formation history of each galaxy. We adopted the Bruzual & Charlot (2003) model for computing the spectral evolution of single stellar populations with a fixed solar metallicity of Z = 0.02 which is reasonable for DSFGs following the Mass-Metallicity relation (Ma et al. 2016). After testing with and without including nebular emissions, we decided not to include them as, for our sample, they lead to higher with no noticeable effect on the extracted properties (, , and redshift).
Some galaxies showed possible signature of strong emission lines, visible as green patches/clumps in Figs. 2.1, 2.2 and 2.3. However, including them had a negligible effect on the estimation of the SFR since it usually had a 50% uncertainties. We discuss this in more detail in Sect. 5.1.
We used a modified Charlot & Fall (2000) dust attenuation law and the Draine et al. (2007) dust emission models update from 2014 to predict FIR flux densities. The idea behind the modification of Charlot & Fall (2000) model is that young stars embedded in their birth cloud suffer from additional attenuation compared to stars that have broken out and escaped into the ISM, and that the attenuation curves associated to the birth cloud and the ISM must be different. In practice, this is modelled by assuming two different power-law attenuation curves of the form : one for the birth cloud with a slope of , and one for the ISM with a slope of . Because radiation from young stars has to travel through both the birth cloud and the ISM to escape the galaxy, the spectrum of stars younger than 10Myr are attenuated by both the birth cloud and ISM curves. Stars older than 10Myr are only attenuated by the ISM curve (Boquien et al. 2019).
For the redshift, we used the Stefanon et al. (2017) catalog, as well as the latest redshift catalog published by Kodra et al. (2022). We encountered three different cases:
-
•
If we had a high-quality spectroscopic redshift, then we used it and fixed it. We have 5 galaxies with a spectroscopic redshift.
-
•
If we had a grism-based redshift from 3D-HST, we downloaded the spectrum and examined its quality, actual features detected, the redshift probability distribution and defined the redshift and its uncertainty accordingly. We have 10 galaxies for which we find a high-quality grism-based redshift.
-
•
If we only had photometric data, we allowed to vary within . We have 7 galaxies with a photometric redshift.
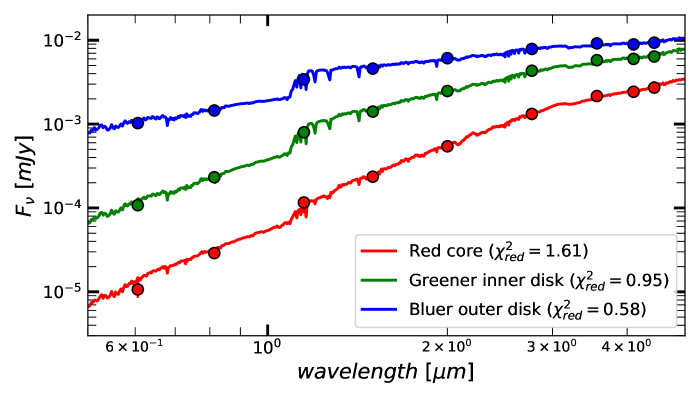
In Fig. 5, we show the best SED models corresponding to each region of our example galaxy defined in Fig. 4.
To be able to extract reliable information from the SED fit, it was crucial to check the fit quality. To be conservative and have reasonable , we decided to limit the photometric accuracy of each band to . However, if the CIGALE fit returns high values, there is a possibility that the input flux uncertainties are still underestimated. In that case, we increased the uncertainties by adding up 10% of the flux to the error in each band. To consider the fit acceptable, we want the reduced such as , which is the reduced critical value corresponding to a significance level of 10% in the test for 8 degrees of freedom.
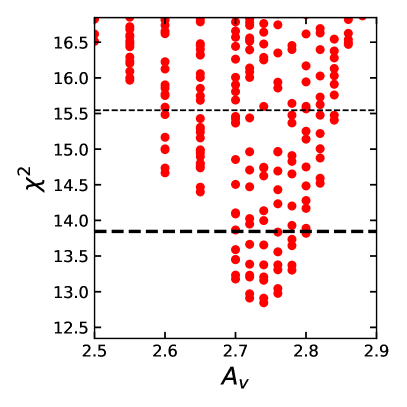
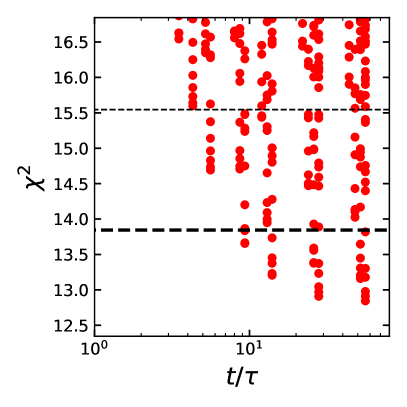
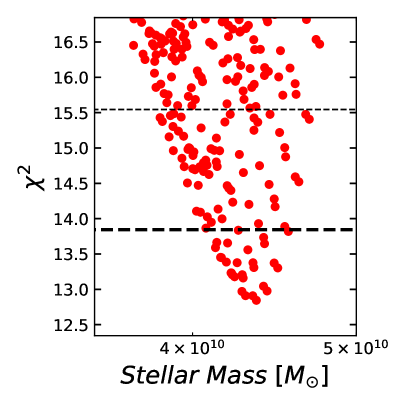
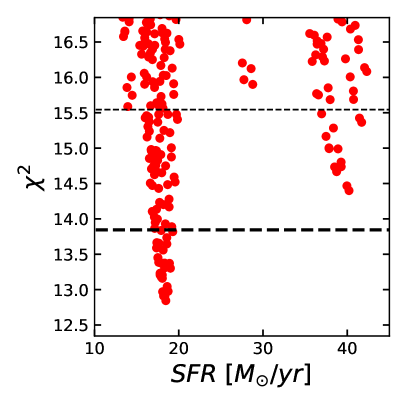
To estimate the robustness of the best model, we studied the distributions associated to the 3 main free input parameters: the dust attenuation, the age of the stellar population and the e-folding time. In Fig. 6, the upper-left panel shows the distribution associated with the different values of the dust V-band attenuation of the stellar continuum used to fit the SED of the red core of the DSFG ID15371. The upper-right panel shows the same information for with and being the age of the oldest stars and e-folding time of the stellar population used to define the star formation history of the galaxy. Taking the width of these distribution at and give us the 68% and 95% confidence interval respectively (Avni 1976), illustrated by the horizontal thick and thin dashed lines in Fig. 6. The fact that we see only a portion of the distribution for comes from the fact that the age is getting close to the age of the Universe, allowing larger would not make physical sense.
We can use the same reasoning for the properties extracted from the SED like the or the SFR averaged over the last 10Myrs. We show an example in the lower panels of Fig. 6.
Just by looking at Fig. 6, we can already conclude that the red core of the DSFG ID15371 is dusty ( 2.73) and weakly star-forming (SFR 18 - 40 and 1).
As a sanity check, we estimated the SED of the whole galaxy by summing up the SEDs of all the components. We then compared this SED with the near-IR and FIR flux densities measured in the super-deblended catalog (Stefanon et al. 2017, Le Bail et al. in preparation) to make sure that they were consistent. If the FIR flux densities are brighter than predicted by the SED fitting, it can be a hint that this galaxy is in a starburst episode and/or that there is a deeply attenuated component that is not visible even at m. It can also be due to the presence of an AGN that boosts the FIR flux, this can be confirmed by a radio excess or an X-ray detection (Le Bail et al. in preparation, Stefanon et al. 2017). We recall that we removed from the sample only one galaxy where we knew that the FIR luminosity was dominated by the AGN luminosity (see Sect. 2.3) but kept those where the AGN luminosity didn’t dominate the FIR luminosity. On the contrary, if the SED predicts a FIR flux density brighter than the one measured, it means that there is a problem in the fitting possibly linked to the grid of the input parameters. In Fig. 7, we show the comparison between the total SED of the galaxy ID15371 and the FIR flux densities. For this galaxy, the flux densities are consistent with the predicted FIR SED meaning that there is no hidden component. This is the case for all the galaxies in our sample except one (ID13107 for which we have a FIR detection brighter than the SED model, pointing toward either a deeply attenuated component or an AGN even though there is no AGN signature in X-ray or radio). However for 3 galaxies (ID13098, ID13776 and ID31281), the measured m flux is boosted compared to the SED predicted flux, possibly a signature of a hot AGN, 2 of them have an X-ray detected AGN (Nandra et al. 2015). By observing Fig. 7, one can notice that the predicted IRAC fluxes are fainter than the actual measurement. This observation is not true for every galaxy, we measure the flux in the NIRCam F356W and F444W which probe the same wavelength as IRAC channel 1 and 2 to be fainter for this galaxy. This is mostly a sign of blending in the earlier IRAC imaging.
A caveat of this SED fitting method is that we used the same SFH and parameters for all regions, some with very different properties. We chose to use the simple tau model because of the meaning of regarding the star-forming activity of the galaxy. We decided to make a two-pass SED fitting, in the first pass, the goal was to separate the star-forming from quiescent regions. In the second pass, we fitted the star-forming regions with a nearly constant SFR (by imposing ). This allowed to have a good estimate of the recent SFR. Moreover, by comparing it to the far-IR SFR from the super-deblended catalog (Le Bail et. al, in preparation.) and to the relative position of each component with respect to the Main Sequence or the quiescent quadrant of the UVJ color-color diagram (see Sect. 3.7 for more detail on these last two points), we had a confirmation of the star-forming activity of each galaxy component. For the quiescent regions, there can be a degeneracy between the age and the dust attenuation, to tackle this, we imposed . We estimated that the good quality of the photometry in the rest-frame near-IR and the two-pass SED fitting procedure allowed us to get robust estimates of both the stellar mass and the SFR of each component.
To tackle the great diversity of galaxies, we decided to divide them into several classes as defined in the next Section.
3.7 Classification
From the CIGALE SED fitting, we derived an estimation of the , the SFR and the dust attenuation () of each component of the galaxies. For the galaxy ID15371, in the upper panel of Fig. 8, one can see the three components respective and SFR plotted on the MS (Schreiber et al. 2015; Huang et al. 2023). All the components of the DSFG ID15371 have some ongoing star-formation, with the red core being on its way to quenching but still slowly star-forming.
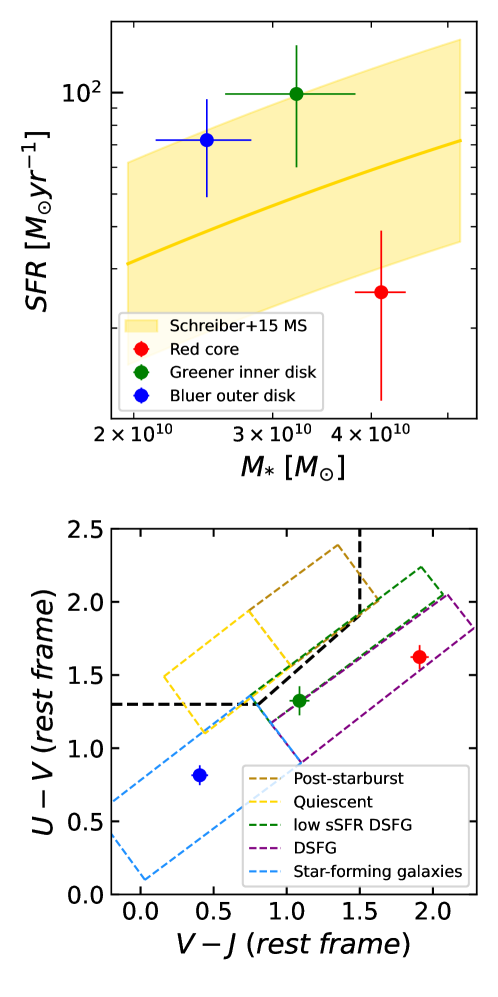
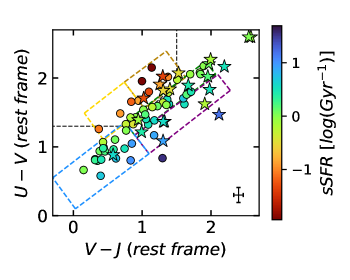
Using the best SED models provided by CIGALE, we also estimated the rest-frame U, V and J AB magnitudes. We used Apellániz (2006) U and V filters, and for the J band, we used the 2MASS J relative spectral response curve. In Fig. 9, we display all the regions of our galaxies on the , plane. We recover the sSFR effect: when moving from the lower right corner to the upper left corner, the sSFR decreases (Wang et al. 2017). This makes the UVJ color-color diagram ideal to separate SF galaxies from quiescent galaxies. We note that the galaxies with sSFR Gyr-1 are all in the quiescent region defined by Whitaker et al. (2011) and delimited by the black dashed line in the Figure. The colored dotted lines delimit the regions defined by Zick et al. (2018).
For the DSFG ID15371, we have confirmation in the UVJ diagram that all the components are star-forming (lower panel of Fig. 8). Moreover, the three components are aligned on the diagonal of the diagram which is the signature of a gradient of dust attenuation from the center towards the outer parts (Calzetti et al. 2000). Indeed, from the SED fitting, we had .
Generally, to estimate if a region was SF or quiescent, we used the UVJ color-color diagram (is the component in the quiescent quadrant or not ?), the position relative to the MS (is the component on/above the MS or well below it ?, what is its position compared to the other regions of the same galaxy ?) and, as we used a simple exponential model for the star-formation history, the value of is also an indicator of the star-formation activity. If , then the peak of star-formation is firmly in the past, and the component is on its way to quenching. On the contrary, if , the galaxy is still actively star-forming. Based on these three pieces of information, we were able to discriminate between SF and quiescent regions. Here, we defined a region as quiescent if below the Main Sequence and the other galaxy components (by dex). Hence, some regions that we classified as quiescent are not completely passively evolving and could still be slowly star forming. Most of the time, the three indicators are in agreement, however, in some cases the results were ambiguous: the regions where all three indicators where not in agreement represent less than 5% of all the studied regions. In that case, we first looked at their position relative to the MS to see if it was consistent with the values from the best models and it always was. The inconsistency of the UVJ color-color diagram can be explained in several ways: the UVJ diagram uses only a part of the information (3 rest-frame bands) contrary to the other probes that uses the full SED. More importantly, real situations exist where the UVJ diagram characterizes correctly the presence of star formation but this star formation is suppressed as exemplified by the sub-MS location (suppressed with respect to the ensemble average given the mass) and by the (suppressed with respect to the past star formation history of this galaxy). That is the case for the central region of ID15371 (see Figs. 6 and 8). In the rare cases where the value didn’t allow any conclusion (), we decided based on the MS and the UVJ color-color diagram that were consistently pointing either toward star-formation or quiescence. In all the cases, we were able to classify the regions as quiescent or star-forming.
As a result of this analysis, we had 22 vastly different galaxies with various morphologies, colors (see Figs. 2.1, 2.2 and 2.3) and star-formation activity. We found that the variety of features could be meaningfully re-conducted to three galaxy groups:
-
•
Type I: SF disks with a red SF core, characterized by the fact that all their regions are SF. Some have a complex multi-color clumpy disk morphology in the RGB (F115W, F200W, F444W) image. They all have a dust attenuated red SF core.
-
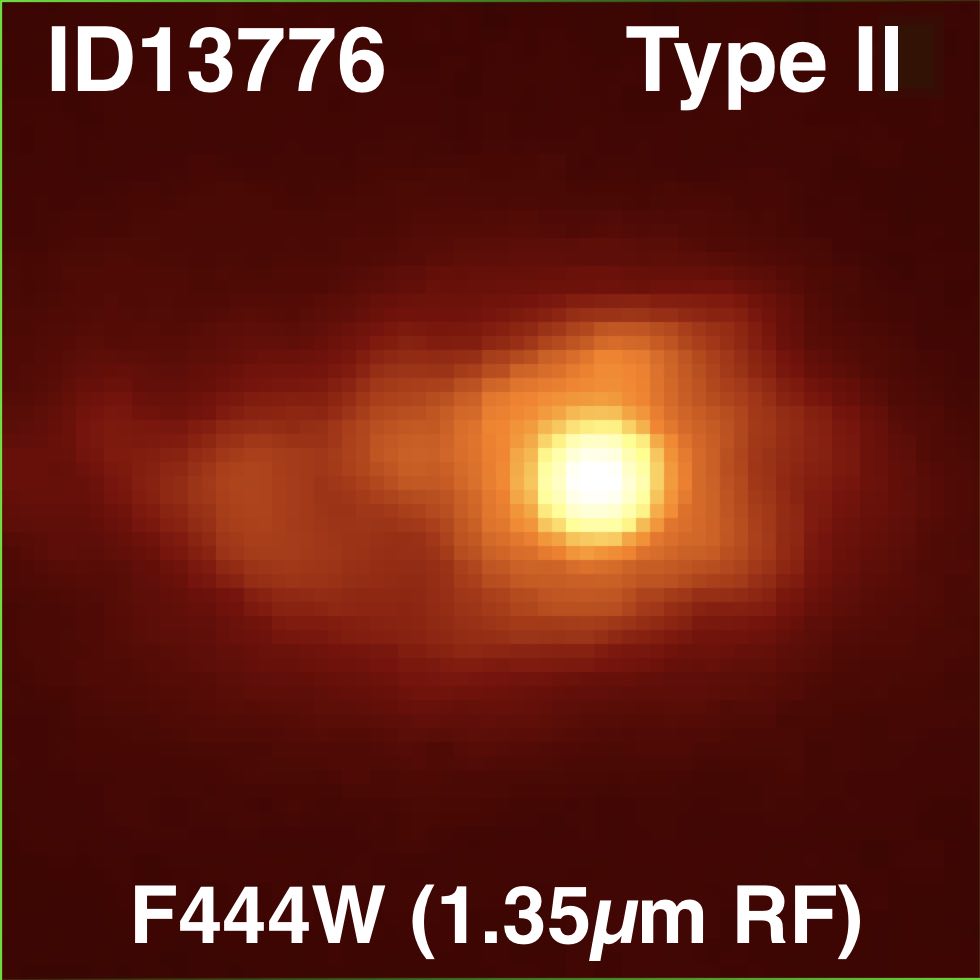
•
Type II: Quenched disks with a SF core, characterized by a dust attenuated red SF core and a quenched disk (in one case, partially quenched).
-
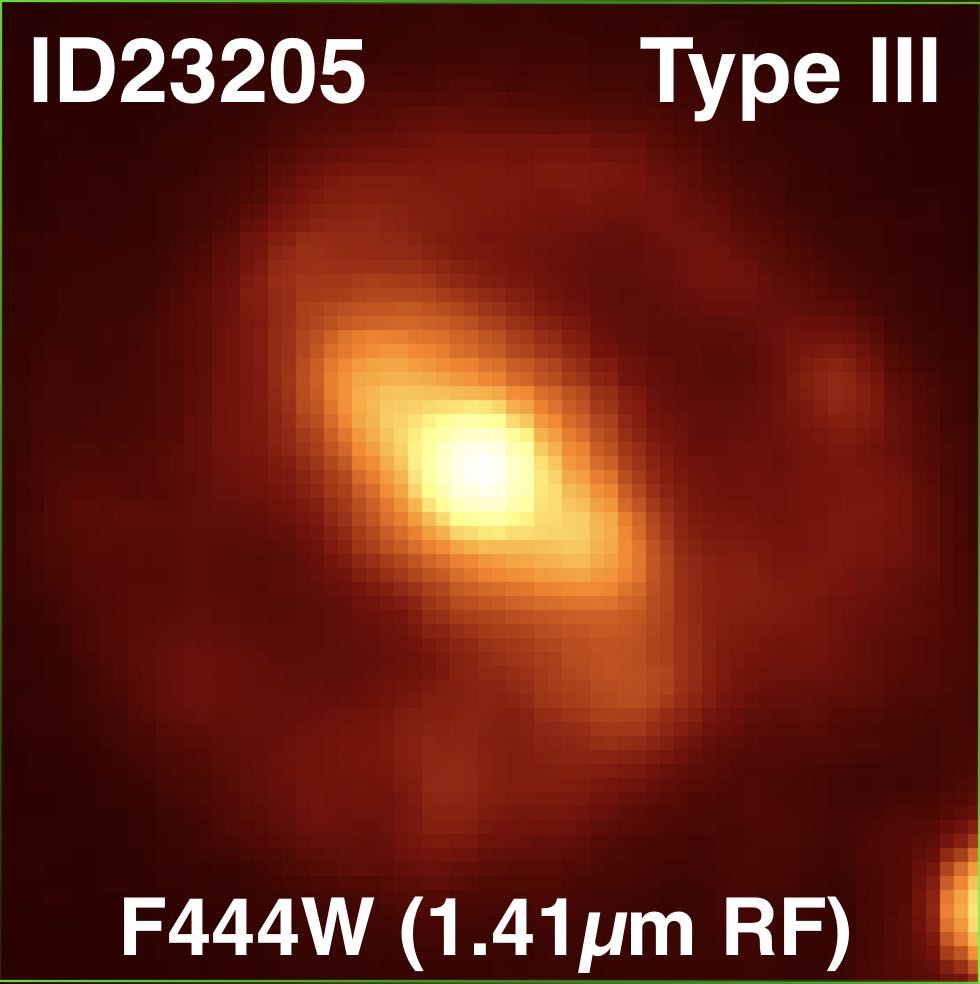
•
Type III: SF disks with a quenched bulge, characterized by a quenched central bulge while the disk is still star-forming. These are similar to local spirals.
For the disks with several components, they usually were all either SF of quiescent. There was only one galaxy (ID18278) where only a fraction of the disk was quiescent (green region in Fig. 2.2), we decided to include it to the Type II as the quiescent part encompasses 16% of the disk stellar mass and could be considered as an early stage of quenching. 4 galaxies hosts X-ray AGNs that do not dominate the FIR emissions; 1 is a Type I galaxy (ID30186), 2 are Type II galaxies (ID13098 and ID13776) and the last one is a Type III galaxy (ID23205) (Nandra et al. 2015).
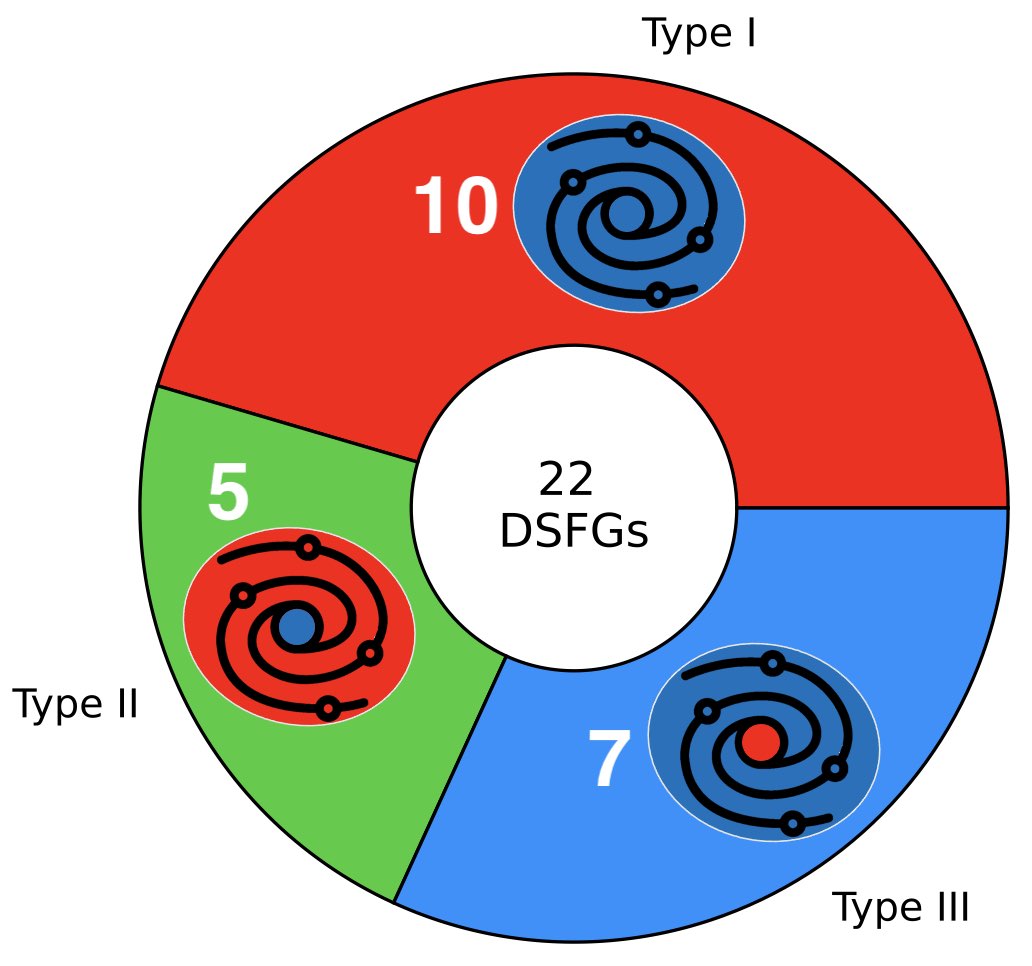
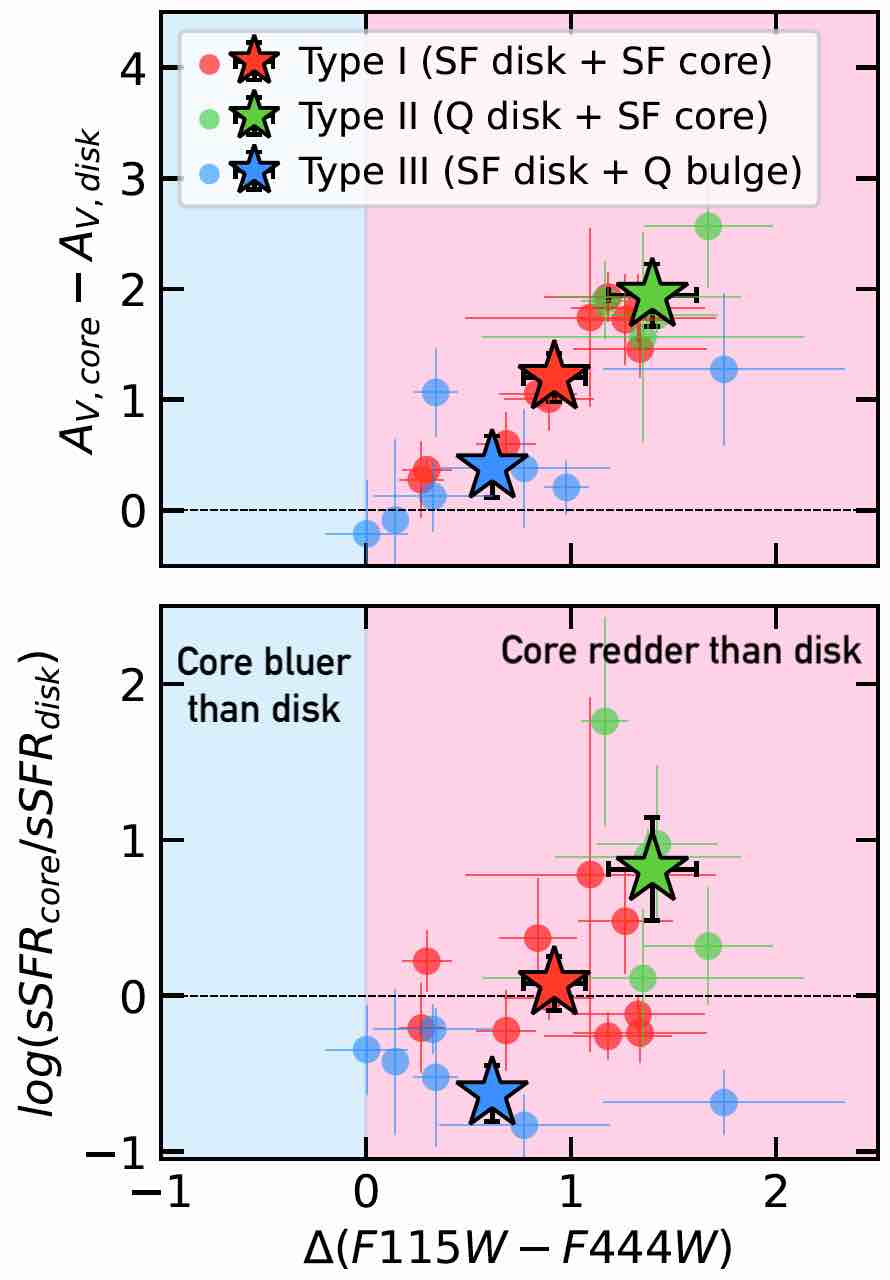
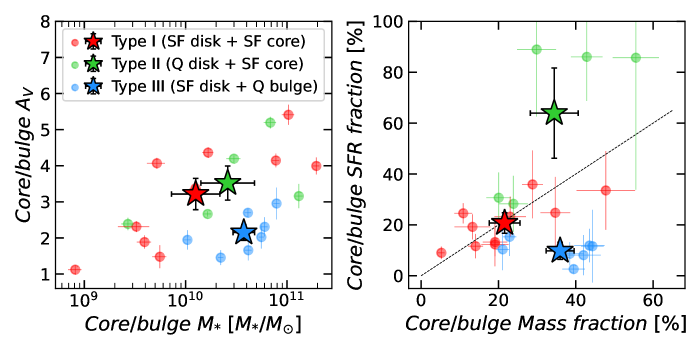
After having classified our sample of 22 galaxies, we had 10 Type I galaxies, 5 Type II and 7 Type III. The RGB cutouts of our sample are separated following the three Types, with Figs. 2.1, 2.2 and 2.3 showing the Type I, II and III galaxies respectively. This is summarized in the top panel Fig. 10 where each wedge size is proportional to the number of galaxies of the considered Type. We illustrate each Type with a pictogram, the color red representing quiescent regions and the color blue representing star-forming regions. The color of each wedge is linked to the Type, in all Figures in the rest of this paper, the red markers will represent Type I galaxies, green markers Type II and blue markers Type III. The lower panels of Fig. 10 summarize the properties of each Types by looking at the connection between sSFR and and color (in mag AB) gradients. The first observation is that cores/bulges are systematically redder than disks and there is a strong correlation between gradient and color gradient (Pearson coefficient = 0.83, p-value = 2e-6) while there is no correlation between sSFR gradient and color gradient (Pearson coefficient = 0.27, p-value = 0.23). This means that the color differences that we observe in Figs. 2.1, 2.2 and 2.3 trace dust density in-homogeneities and not older/younger stellar population. The Type I galaxies (in red) do not have a noticeable sSFR gradient (), but have a strong gradient, hence, the fact that the cores of Type I galaxies appear much redder than the disks in Fig. 2.1 is due to their high dust density; the blue regions are low regions. For the Type II galaxies, we observe the sSFR gradient we expected, the core is star-forming while the disk is quenched (), they have the strongest dust gradient because of their highly dust attenuated core and their quenched disk that has low level of dust attenuation. We note that the sSFR gradient should make the core appear bluer than the disk (because of the younger stellar population in the core), however we observe the exact opposite. The color gradients we observe in Fig. 2.2 are dominated by the dust attenuation gradient. Eventually, Type III galaxies have low attenuation both in their quenched bulge and star-forming disk, hence have a weak gradient. Their sSFR gradient is however strong, as expected of the opposite sign compared to Type II (quenched bulge and star-forming disk, ). In Fig. 2.3 the color gradients mostly trace the age difference between the stellar populations of the (redder) bulge and the (bluer) disk.
We note that, the strong gradients we observe, both in sSFR and justify the need to divide our galaxies in three Types to illustrate the three possible sSFR gradient and to divide them in several sub-galactic regions because of the huge dust gradient. Moreover, as expected by the selection criteria detailed in Sect. 2.3, we did not have any fully quiescent galaxy in our sample.
4 Results
In this section, we present the results of the analysis of the 22 galaxies in our sample, distinguishing among the three classes we just defined in the previous Section. We first looked at the properties of the whole galaxies in Sect. 4.1 and then at the resolved properties at a sub-galactic level in Sect. 4.2. In Table 1, we give the main properties of our sample of 22 galaxies.
In the following, we compared the behaviour of the different Types of galaxies. To assess the significance of the trends, we compared the difference between the mean of a property for each Type with the error on the mean. We emphasis that we also checked the median value and that it doesn’t affect the observed trends. In the Figures, each star-shaped marker is the mean and the error bar is the error of the mean (defined as with the root mean square of the distribution and the number of galaxy in each Type).
4.1 General properties
4.1.1 Main Sequence galaxies
To characterize the different Types of galaxies, we first looked at their typical redshift, and . The redshifts and were extracted from the SED fitting procedure described in Sect. 3.6 while the was computed by dividing the of each galaxy by the sum of the of each component with the taken from the super-deblended catalog (Le Bail et al., in preparation).
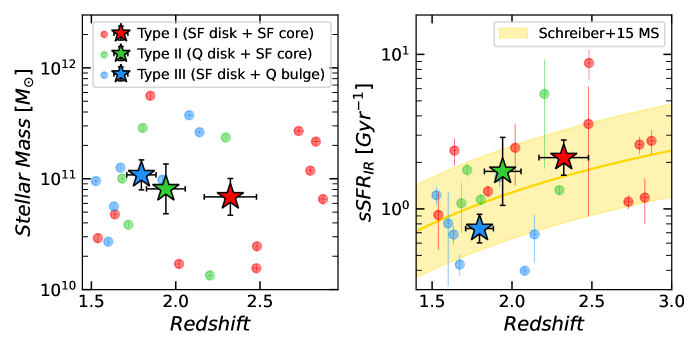
In Fig. 11, a redshift trend is appearing: the Type I galaxies with their SF core and SF disk are on average at higher redshift () than the Type II galaxies with their SF core and quiescent disk (), that are themselves at a slightly higher redshift than the Type III galaxies (), analogs to the spiral galaxies we observe in the local universe with a quiescent bulge within a SF disk. The difference in redshift is between the Types I and II and between Type I and III. This suggests that this redshift trend is real and opens the possibility of an evolutionary link between class I and II/III.
All of our galaxies have a M⊙ with an average of M⊙ (left panel of Fig. 11). There is no correlation between the Types and the , all Types have a similar average . By comparing the of our galaxies with the MS of Schreiber et al. (2015) (right panel of Fig. 11), we confirmed that typically these galaxies are MS galaxies, consistently with Fig. 1 and Sect. 2.3. The MS sSFR at a fixed redshift was calculated by taking the mean of our sample which is M⊙. Moreover, the typical is observed to decrease at lower redshift, as expected from the cosmic trend.
The Type III galaxies, which have a quenched bulge, have the weakest on average (Gyr-1 for quenched bulges versus Gyr-1 for SF cores). They also are at lower redshift than the others. This suggests that they are more evolved than other classes.
4.1.2 Galaxy near-IR sizes
The presence of highly obscured cores at the center of galaxies, like for ID15371 (see Fig. 3), can let us believe that we are studying the counterparts of the ALMA compact SF SMGs. Indeed, SMGs are known to be compact, dust obscured and with a high star formation efficiency.
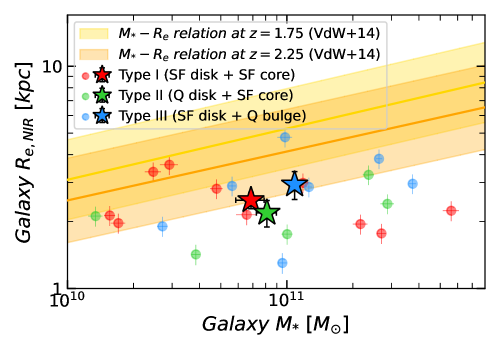
The galaxies hosting a SF region at their center (Type I and II) tend to be slightly more compact in the near-IR, with kpc, than the galaxies with a quenched bulge (Type III), with kpc (this is tentative as there only is a difference, see Fig. 12). The Type II galaxies and their quiescent disk are on average the most compact galaxies in the near-IR with a typical size of kpc.
In Fig. 12, we compare the to the relation from van der Wel et al. (2014) based on rest-frame optical measurements. Most of our 22 galaxies are more compact in the near-IR than in the optical, with being below the relation scatter. We also checked that the optical sizes of our galaxies are compatible with the relation. This demonstrates than in our galaxies, the dust, traced by the near-IR emissions, is more concentrated than the stellar light, traced by the optical emissions. This is a confirmation of an already well established fact (van der Wel et al. 2023; Gómez-Guijarro et al. 2022b; Jiménez-Andrade et al. 2021; Puglisi et al. 2019; Jiménez-Andrade et al. 2019; Fujimoto et al. 2017).
However, we note that the Type I galaxies have very comparable optical and near-IR sizes ( difference in size on average), their star-forming core is not as concentrated as for the other galaxies of the sample.
We discuss in Sect. 5.4 how the Type I and II galaxies might relate to the ALMA SMGs.
4.1.3 Widespread Lopsidedness
As one can see in Figs. 2.1, 2.2 and 2.3, some galaxies are strongly lopsided (marked with a ‘\smallL⃝’). They are asymmetric and/or their red central region is off-centered with respect to the disk. This lopsidedness appears to be quite common among Type I and II galaxies. In Figs. 2.1, 2.2 and 2.3, the marked galaxies are the 6 most lopsided galaxies, 3 are Type I (30% of the sample) and 3 are Type II (60% of the sample). The Type III galaxies look much more symmetric, these galaxies have a quenched bulge and are on average at lower redshift, they had presumably more time to evolve and stabilize their disk. To verify this, we investigate the lopsidedness of each galaxy.
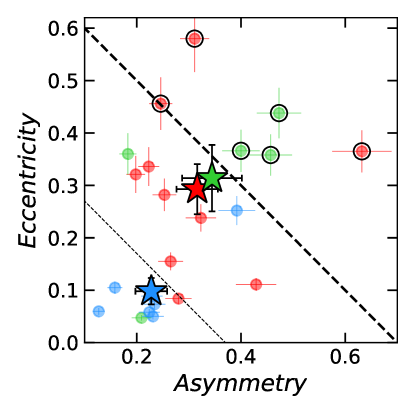
As explained in Sect. 3.3, for each galaxy we calculated its asymmetry () and eccentricity (). Type III galaxies appear to be much less lopsided, they have a low eccentricity () and asymmetry () while Type I and II galaxies, which show comparable lopsidedness, tend to be much more asymmetric () and off-centered () (see upper panel of Fig. 13). The difference has a and significance for the eccentricity and asymmetry respectively. In the upper panel of Fig. 13, we show the eccentricity vs the asymmetry. We considered the Type III galaxies as not lopsided, and used their typical eccentricity and asymmetry as a proxy for measurement errors and systematic effects. The thin black dotted line shows the threshold to define a galaxy as weakly lopsided (, this value corresponds to the average of Type III galaxies). We have 14 galaxies that are at least weakly lopsided, representing 64% of the sample. If the galaxies are above the thick black dashed line, meaning that (this value corresponds to the average of Type III galaxies), we consider them as strongly lopsided, we encircled them in Fig. 13 and they are visible in Figs. 2.1, 2.2 and 2.3 with a Ⓛ. We have 6 strongly lopsided galaxies, representing 27% of the sample. Usually, a strong asymmetry is linked to a strong eccentricity, however we have galaxies with a low level of asymmetry but with a highly off-centered disk. All the strongly lopsided galaxies (circled in black) have high eccentricity. In other words, we observe a lack of strong asymmetry with low eccentricity.
The position of the average lopsidedness of Type I and II galaxies in Fig. 13, indicates that being lopsided might be a typical property of these galaxies.
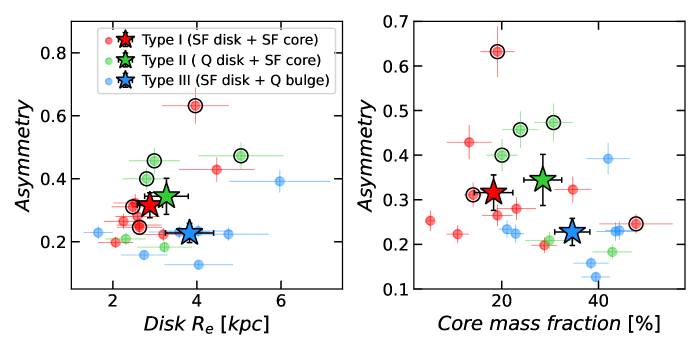
In the lower panels of Fig. 13, Type III galaxies, which are more evolved and have a quiescent bulge have low level of asymmetry. On the contrary, Type I and II galaxies have a higher level of asymmetry. We observe (1) a lack of galaxies with a compact disk and high asymmetry and vice-versa, (2) a lack of galaxies with a high core mass fraction and high asymmetry and vice-versa and (3) the galaxies with a quiescent bulge with high mass fraction have low asymmetry. This is consistent with the observation of galaxies in the local universe, indeed, present-day late-type galaxies with more extended disks and lower central stellar mass density are typically more lopsided than early-type galaxies with smaller disks and higher central stellar mass density (Dolfi et al. 2023; Varela-Lavin et al. 2023). It seems that as the core grows in mass from accretion, the disk gets smaller and loses its lopsidedness, leading to Type I spiral-like galaxies.
Thanks to the spatial resolution of JWST, we had access to sub-galactic scales, which is crucial to understand the morphology and evolution of DSFGs.
4.2 Resolved properties
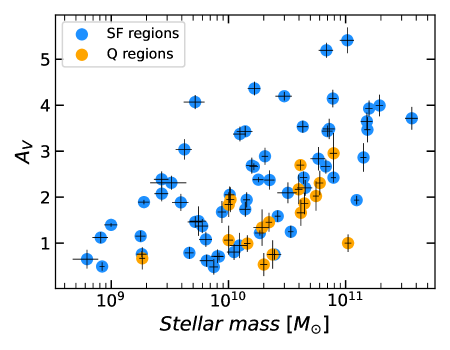
For each galaxy, each component has been classified either as star-forming or quiescent (see Sect. 3.7). In Fig. 14, we show that the quiescent regions are massive () and have a relatively low dust attenuation with an average of and maximum at while SF regions have an average of maximum at . The SF regions follow a correlation (with a Pearson coefficient of 0.62, p-value = 9e-8), the more massive components are more attenuated. This is consistent with the idea that the stellar mass is the main driver of dust attenuation in SF galaxies (Lorenz et al. 2023).
In the following Sections, we present the results regarding the core/bulge and disk of our galaxies.
4.2.1 Cores and bulges properties
We first looked at the red central region of each galaxy, as defined in Figs. 2.1, 2.2 and 2.3. In the left panel of Fig. 15, we show the dust attenuation versus the of the red star-forming cores (in red and green) and quiescent bulges (in blue). As mentioned above, the dust attenuation of SF cores (Type I and II) correlates with its : the more massive the core, the more dust attenuated (with a Pearson coefficient of 0.75, p-value = 0.001). Also, the bulges are less attenuated than SF cores, consistent with the fact that they are quiescent and host an evolved stellar population where the dust might have been consumed/destroyed.
Figure 15 also shows a trend in redshift. On average, the bulges are slightly more massive () than the SF cores () but with only a significance. The SF cores of Type II galaxies () and those of Type I galaxies () are consistent within errors.
| (4) |
| (5) |
The weak trend between the of higher-z SF cores and lower-z bulges is consistent with the idea of a bulge that grows in mass with time, fed by accretion from the disk, clump migration or minor/major mergers.
We compared the and SFR fraction of the red cores and bulges with respect to the host galaxy (right panel of Fig. 15). For Type I galaxies, the red core represents only of the of the galaxy. This fraction is smaller than for the other galaxies of the sample where the red core represent for Type II ( difference) and for Type III ( difference) of their total . This can be linked to the redshift trend, the Type I galaxies being at higher redshift, their core could still be at an early stage of growth. It also explains their lowest , as their is much less concentrated in the central region that the other two Types.
As expected from the definition of our Types of galaxies, the Type II galaxies have a red core with a SFR fraction () significantly greater than the fraction () since the disk is mostly quenched, while the Type III galaxies have a red bulge fraction () significantly more important than the SFR fraction () as the bulge is quenched.
Some of these cores/bulges appeared to be compact, we decided to investigate them further in the next Section.
4.2.2 Compact cores and bulges
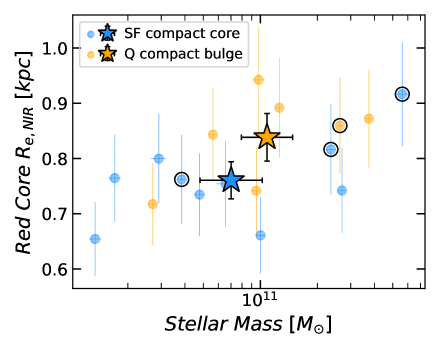
All of our galaxies have a central core/bulge appearing in the near-IR (filter F410M or F444W). For some galaxies, the core/bulge has a clear clump-like morphology, is much brighter than the surroundings and is clearly delimited (e.g. ID13776 and ID23205 in Fig. 16). We identified compact cores in 17 galaxies out of 22: 6 Type I galaxies with a compact core (60% of our sample), 4 Type II (80% of our sample) and all 7 Type III galaxies of our sample have a compact bulge. We decided to investigate further these compact cores/bulges by dividing the in two categories, the SF cores (from Type I and II) and the quiescent bulges (from Type III).
To do so, we measured the half-light radius of the compact cores and bulges defined as the radius of a circular aperture encompassing half of the flux of the core, we applied a similar technique as described in Sect. 3.1. The SF cores tend to be slightly more compact than the quiescent bulges (kpc vs kpc, with a significance, see Fig. 17). The markers with a black circle are the compact core with an X-ray detection, possibly tracing an AGN. 3 of them are found in SF cores, and 2 are in the most massive galaxies with the largest SF cores. Even if the definition of the compact core is somehow arbitrary, and that there could be some level of contamination from the disk, this goes in the same direction as Cochrane et al. (2023) simulations. They found that without AGN feedback, the SF core would undergo a compaction event while the presence of AGN winds would prevent such compaction by evacuating the gas and precipitate the quenching of the core.
We also note that the quiescent bulge tends to be larger in more massive galaxies. Ikarashi et al. (2017) found that the most compact cores of SMGs are those where there is both star formation and an AGN. This is not what we observe for two of the SF cores hosting an X-ray AGN (showed with the encircled markers in Fig. 17), it is possible that in these galaxies the AGN has strong feedback and the system is quite evolved and ready to quench. The third SF core hosting an X-ray AGN is however compact and the presence of the AGN could facilitate this compaction.
The sizes of the SF compact cores are compatible with those measured in the sub-mm (See Sect. 5.4 for more details).
After analyzing the cores of our galaxies, we decided to investigate their differences with respect to the disk, especially the reasons of the redness of the core compared to the surroundings.
4.2.3 NIRCam color variations within the disks
In Sect. 3.7, we showed that the main driver of the color gradient between the cores and disks is the dust attenuation.
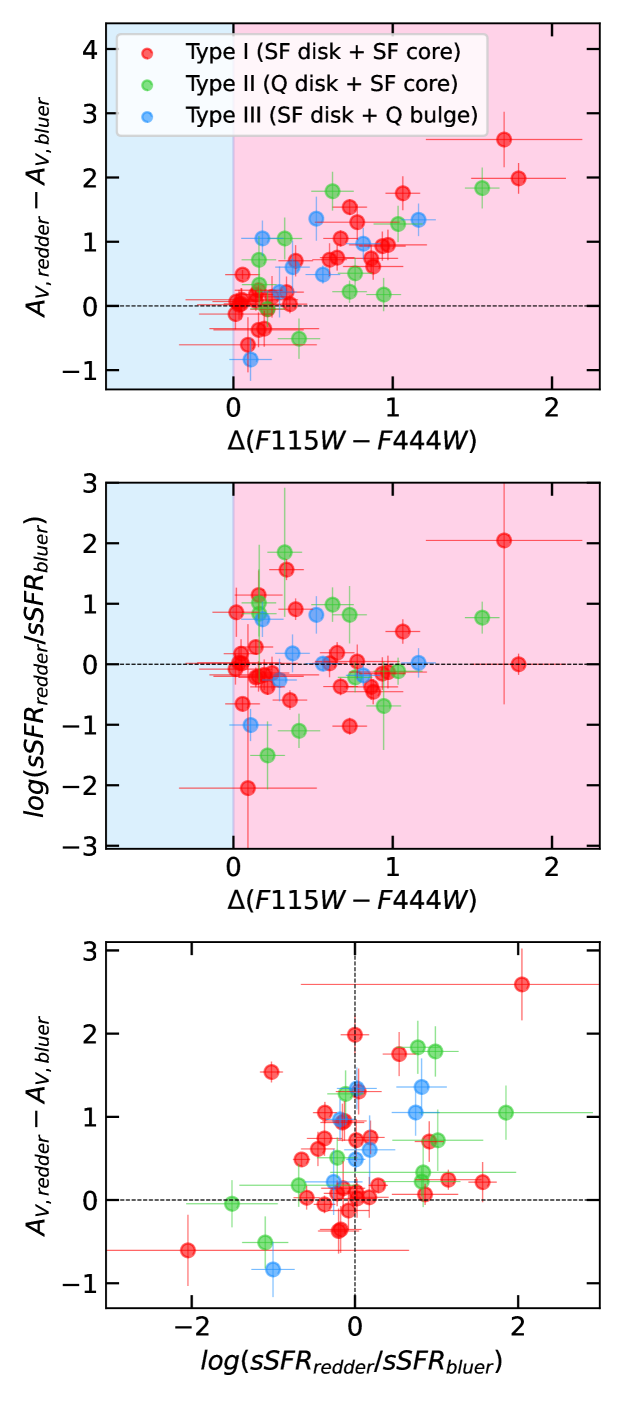
When looking at Figs. 2.1, 2.2 and 2.3 we noticed that some disks are also highly in-homogeneous in terms of color. To investigate the physical processes responsible for the color variations we observed in the disks, we compared the color variations with the dust attenuation and sSFR variations in a similar way we did in Sect. 3.7 when we investigated the gradients between the cores and the disks. When measuring the variations, we always measured the differences between a redder part of the disk and a bluer part (in other words in AB mag). We compared all the components of the disks, meaning that if a disk was divided in 3 patches, there are 3 markers in Fig. 18 comparing the first and second, second and third and first and third component respectively. In the two upper panels of Fig. 18, we first clearly identify a correlation between the color variations and the dust extinction variations (Pearson coefficient = 0.78, p-value = 6e-11) consistent with the expectation that the redder regions are those with the greatest (Calzetti et al. 2000). However, we do not identify any correlation between color variations and sSFR variations (Pearson coefficient = 0.16, p-value = 0.29), some color variations are even inconsistent as when , we are comparing a red patch hosting a younger stellar population (more star-forming) with a bluer patch hosting an older stellar population (less star-forming), hence the colors should be the other way around. This two observations demonstrate that the color variations we observe within the disks in Figs. 2.1, 2.2 and 2.3 are driven by dust. NIRCam colors at trace dust, red spots are highly extinct while blue spots are weakly dust attenuated. This is consistent with previous studies based on NIRCam images (e.g. Miller et al. (2022)) .
As the clumps could play an important role in the color variations, it is important to investigate their abundance.
4.2.4 Clumpy disks
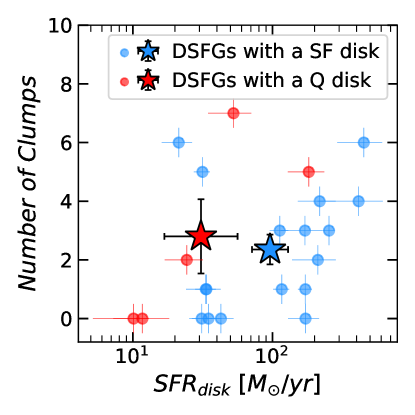
As one can see in Figs. 2.1, 2.2 and 2.3, some galaxies are very clumpy. The clumpiness does not seem to be linked to a particular Type of galaxy. Most of the clumps are observed in the shortest wavelength, consistent with Wuyts et al. (2012) who state that the number of clumps decrease when moving toward longer wavelength. In Fig. 19, we investigate the the possible link between the clumpiness and the disk and the core of the galaxy. In the left panel,we show the distribution of the number of clumps observed in each disk versus the SFR of the disk (defined as the sum of the SFR of the regions delimited in Figs. 2.1, 2.2 and 2.3) separating the SF disks from the quiescent disks. There is no apparent correlation between the star-forming activity of the disk and the number of clumps. The fact that we observe clumps in quiescent disks is quite surprising as they usually are supposed to be place of local starburst (Wuyts et al. 2012). We discuss the implication of this result in Sect. 5.3.
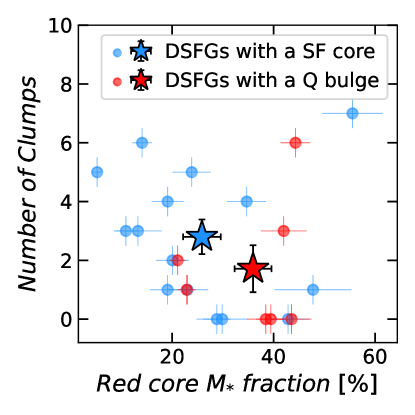
In the left panel of Fig. 19, we study the impact of the fraction of stellar mass in the core (in blue) or bulge (in red) on the number of clumps. The galaxies with a quiescent bulge, that we know to be at lower redshifts (see Sect. 4.1.1 and Fig. 11), have a higher fraction of their mass in their bulge () than the galaxies with a star-forming core have in their core () with a significance. They also tend to have a smaller number of clump: clumps on average for a galaxy with a bulge and clumps on average for a galaxy with a star-forming core ( significance). The plot also shows that by looking at galaxies with a star-forming core (in blue in Fig. 19), the ones with the smallest fraction at their core are also the clumpiest. We see here both the effects of the redshift, lower redshift galaxies have less clumps and of the central fraction, higher fraction leads to less clumps.
One could argue that the fact that galaxies with a star-forming core are at higher redshift than those with a quiescent bulge (Type III) means that we probe shorter rest-frame wavelength, hence, we have a higher probability of observing clumps in their disk (Wuyts et al. 2012). However, the range of redshift that we are probing here is quite narrow, and the clumps that we count are the brightest and visible in several filters. These galaxies actually are clumpier.
5 Discussion
In this Section, we first discuss the green patches/clump that are visible in the RGB cutouts in Figs. 2.1, 2.2 and 2.3 in Sect. 5.1. Then, we discuss the presence of blue clumps inside quiescent disks in Sect. 5.3. We investigate the possible link between the compact SMGs observed with ALMA and our DSFGs in Sect. 5.4. In Sect. 5.6, we discuss the origin and consequences of lopsidedness and its abundance. Eventually, in Sect. 5.7, we discuss two possible evolutionary paths that could lead to the formation of Type II galaxies.
5.1 Bright emission lines
When looking at Figs. 2.1, 2.2 and 2.3, one can notice that some of the disks have different colors, with a blue and a green part. The green clumps/patches are visible in all Types of galaxies. Considering their redshift, they probably are due to bright or emission lines which are known tracer of star-formation. The line will fall in the green filter (F200W) for galaxies with a redshift between 1.67 and 2.39 and the emission line will fall in the green filter for galaxies with a redshift between 2.52 and 3.47. On the 7 galaxies where we identify green patches, 2 are consistent with emission from a star-forming region (ID15371 and ID29608) and 3 are consistent with emission from a star-forming region (ID18694, ID23510 and ID23581). For the 2 remaining galaxies, it is more surprising, as the green patches/clump are observed in the quiescent disks of Type II galaxies.
For the ID13107 galaxy (), the green patch is close to the center of the galaxy, it is then possible that the line is produced by the accretion disk of an AGN sitting at the center of the galaxy that becomes bright in this region because of a much weaker dust attenuation than in the core. Even though we have no radio or X-ray signature of an AGN in this galaxy, as mentioned before, the predicted SFR from the SED fitting is not enough to explain the FIR flux density observed with Herschel for this galaxy. This convinced us that there could be an AGN at the core of this galaxy.
For the ID18278 galaxy (), the situation is different, the green patch is in the outer region and composed of clumps. These clumps could have actually been ionized by the hot evolved low-mass stars (Cid Fernandes et al. 2011; Belli et al. 2017) with an enhanced line due to shocks from the minor merger. Indeed, these clumps are old (age of oldest stars ) and have a very low sSFR, consistent with the ex-situ clumps defined in Mandelker et al. (2014).
5.2 Origin of dusty patches within disks
In Sect. 3.7, we demonstrated that the color gradient is linked to the strong gradient. The fact that the core is much more attenuated than the disk is expected because the SFR surface density is higher in the core than the disk, hence is the dust surface density and the dust column density.
However, the patchy distribution of dust within the disks is more surprising. From the lower panel of Fig. 18, we observe a correlation between dust density and sSFR for Type II and Type III galaxies (Pearson coefficient = 0.62 and 0.83 with p-value = 0.04 and 0.01 respectively). Meaning that for these galaxies, the patches could be linked to not yet quenched regions in the disks of Type II galaxies and partly quenching disk for Type III. The patches could then find their origin in internal instabilities, or interactions with the local environment. For Type I galaxies, we do not observe this correlation (Pearson coefficient = 0.35, p-value = 0.07). For these galaxies, the patches could be correlated either to metallicity, higher metallicity leading to higher dust column, or to geometry.
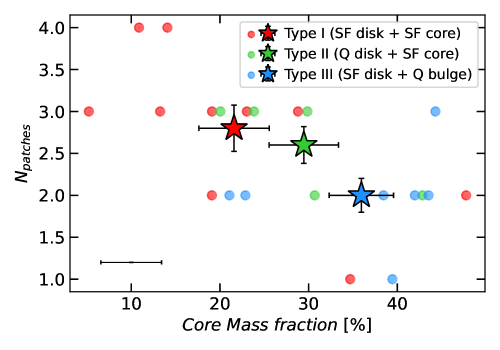
We investigated the origins of the patchy distribution by looking for correlations between the greatest difference in in each disk and the redshift, the fraction of stellar mass in the core/bulge, the fraction of SFR in the core/bulge, the lopsidedness and the environment. We found no correlation (all p-value ). We then looked for a correlation between the number of patches/components of each disk (as defined in Figs. 2.1, 2.2 and 2.3) and the same parameters. The only correlation we found, that is visible in Fig. 20, is with the mass fraction in the core (Pearson coefficient of -0.60, p-value = 0.003), the number of patches/components gets smaller when the mass is more concentrated in the core of the galaxy. This is especially true for the galaxies with a star-forming core (Type I and II, with a Pearson coefficient of -0.67 and a p-value of 0.006, while Type III have a Pearson coefficient of 0.14 with p-value of 0.76). This correlation is expected from Hopkins et al. (2023); when the central gravitational potential well is deep enough, it stabilizes and homogenizes the disk. This correlation is consistent with the one we observed for the clumps (See Sect. 4.2.4 and Fig. 19). However, if this (anti-)correlation justify why we do not see patches in Type III galaxies, it doesn’t clear up the mystery of their origin.
We would need spectroscopy to understand better what is happening in those disks, and even there the mystery would remain of why the disks are so in-homogeneous in dust attenuation, whether it is due to metallicity or geometry differences (and why these would persist over homogeneous patches within a disk, as opposed e.g. to simple radial gradients).
5.3 Clumps in DSFGs
In all the Types of galaxies, we identified the presence of clumps. We observed that galaxies at lower redshift tend to have less clumps, this suggests that the clumps either get destroyed within the disk and are not replaced by new clumps, or migrate toward the core and participate to its mass growth possibly triggering enhanced star formation. They might also be lower mass/less luminous, hence below our detection threshold. We do not see any evidence of recent major mergers in our galaxies, suggesting that most of the clumps we observe are originating from a fragmentation of a gas rich unstable SF disk, consistently with Puschnig et al. (2023) and Fensch & Bournaud (2021) that showed that large scale instabilities in gas-rich galaxies can create such star-forming giant molecular clumps.
We also noted that the most clumpy high-redshift galaxies also have the least concentrated cores, with less than 20% of their stellar mass at the center of the galaxy (see Fig. 19) and, on the contrary, the least clumpy galaxies at lower redshift have nearly 40% of their stellar mass in the quiescent bulge. We also showed in Fig. 15 that galaxies at later times have higher core mass fractions. This suggests that either, as the clumps migrate through the disk, they feed the central core, making it grow in mass or that, as the central gravitational potential well gets deeper, the disk is stabilized, the VDI are destroyed, and the galaxy can have a smoother spiral-like disk. Our observation are consistent with the simulations from Hopkins et al. (2023) that showed a well defined dynamical center is necessary to stabilize the disk and put an end to bursty star-formation. Also, we are in agreement with the new JWST results from Kalita et al. (2022), pointing to an increased galaxy fragmentation with decreasing bulge/core mass fraction.
When looking at Fig. 2.2, one can clearly identify clumps in the Type II galaxies. The blue clumps of these quiescent disks (ID13107, ID18278 and ID13776 in Fig. 2.2) are due to a low dust attenuation and not a high sSFR. Indeed, the disk has while the central SF core has . We recall that the blue colors in NIRCam color cutouts for these redshifts are typically a signature of low dust attenuation. This could indicate that clumps are not only formed in highly star-forming regions.
5.4 Are we observing compact SMGs counterparts ?
In most of our IR-luminous galaxies, a central compact clump-like highly dust attenuated SF red core is present. While it is nearly invisible in the optical rest-frame, it becomes bright in the near-IR (see Figs. 3 and 16). As we showed in Sect. 4.2.3, they are surrounded either by a SF (Type I) or a quiescent (Type II) disk with much lower dust attenuation. We identify 10 of those (see Table 1 and Sect. 4.2.2) in our sample.
When we measured the size of these red compact SF cores, we found that the average was about 0.76kpc (Fig. 17). This size is compatible with the sizes measured with ALMA for the compact SMGs : kpc in Zavala et al. (2022), kpc in Gómez-Guijarro et al. (2022a) or kpc across in Rujopakarn et al. (2019). The NIRCam sizes tend to be slightly larger than the ALMA sizes, this is not due to a spatial resolution issue, but to the heavy dust obscuration of the core.
Moreover, compact SMGs at are characterized by a SFR M⊙ yr-1 (Gómez-Guijarro et al. 2022a; Jiménez-Andrade et al. 2021, 2019; Hodge et al. 2019). 7 out of the 10 galaxies where we identified a compact star-forming core have a total SFR compatible with this criteria (see Table 1). 5 of them having SFR M⊙ yr-1 in the core alone, 1 has SFR M⊙ yr-1 in the core and the remaining galaxy has a lower SFR in their core.
To confirm the possibility of SMGs counterpart, we can use the FIR super-deblended catalog in the EGS (Le Bail et al., in preparation.). 6 out of the 10 galaxies are detected at in SCUBA2/850 among which 3 are detected. 3 out of the 4 undetected galaxies at m are in the shallower part of the FIR catalog. Moreover, if we look at the predicted flux at 1.1mm for these galaxies, the mean predicted flux is 0.80mJy, and 4 of them are predicted to be brighter than 1mJy at 1.1mm. A total of 5 galaxies have either a detection in SCUBA2/m or a prediction mJy at 1.1mm (ID13776 and ID21190 from the Type II class and ID16544, ID29608 and ID30186 from the Type I class). They correspond to the 5 galaxies measured with a SFRM⊙ yr-1 in their core.
All these elements convinced us that we have at least 5 or 6 galaxies that are good candidates of compact SMGs counterparts, they are equally distributed between Type I and II.
Contrary to what is observed with ALMA, these compact cores are not isolated, they all are surrounded by a larger disk. The fact that their is a huge dust gradient between the core and the disk, as we showed in Sect. 3.7 might explain why we do not this the latter in sub-mm surveys: the core is bright in the rest-frame near-IR while the disk is bright in the rest-frame optical. The presence of a disk confirms Hodge et al. (2019) and Puglisi et al. (2019) who both stated that the compact SMGs are obscured part of a larger system.
The fact that some galaxies in our sample have highly extinct cores could link them the so-called HST-dark galaxies. We compared our sample with the HST-dark and HST-faint galaxies in the same field from Pérez-González et al. (2023). Our galaxies are in general agreement with the SFG at in Pérez-González et al. (2023), especially with the fact that we observe highly dusty patches out to large radii. Four of the galaxies in our sample are classified as HST-faint (ID16544, ID18694, ID23581 and ID26188). All are Type I galaxies, which seems logical because quiescent regions have lower , hence are brighter in HST. One of them (ID23581) has , hence expected to be HST faint/dark, while the remaining three galaxies have , which is the average of the sample. It is more surprising that those three galaxies are HST faint/dark. However, these 4 galaxies are actually the galaxies at the highest redshift of the sample (), with photometric redshift from our SED fitting procedure consistent with the ones from Kodra et al. (2022) and the ones from the super-deblending (Le Bail et. al, in preparation). There is a chance that their HST faintness comes more from their higher redshift than their high level of dust (at least for 3 of them).
5.5 Relation to Blue Nuggets simulations
In the cosmological simulations from Lapiner et al. (2023), the typical high-redshift and low-mass galaxy is a gas-rich, star-forming, highly perturbed, and possibly rotating system, fed by intense streams from the cosmic web. When the stellar mass is in the ballpark of M⊙, the galaxy undergoes a major, last, wet compaction into a ‘Blue Nugget’, starting with a compact gaseous star-forming system that rapidly turns into a compact stellar system. The galaxies that we observe are all above this M⊙ threshold. However, non of them look like a blue nugget except possibly ID13098. We discuss the specific case of ID13098 in Sect. 5.7. The other ones that are in the range of mass where the wet compaction should happen do have a compact dusty star forming core, but they also have a much larger star-forming disk. Moreover, the more massive galaxies could be undergoing a rejuvenation event after blue nugget phase as it is suggested by Lapiner et al. (2023). However, when comparing the of the disk and core, we find no evidence that the star-forming disks are younger than the cores. The fact that we do not observe any blue nuggets (or a single one) might be due to their low-mass, or low SFR, or that the previous observations were not deep enough to detect the low-luminosity disks. It may be possible that the most massive galaxies undergo a different quenching mechanism that lower-mass galaxies.
5.6 Investigating the lopsidedness
Galaxy lopsidedness has not so far attracted much attention at high redshift, probably because of a lack of spatial resolution and/or incomplete data since the most obscured part of the galaxies are not visible with pre-JWST telescopes. However, the spatial resolution of NIRCam shows that it is a common features of DSFGs around the Cosmic Noon. Indeed, we showed in Sect. 4.1.3 that being lopsided seem to be the typical morphology of Type I and II galaxies (see Figs. 2.1, 2.2 and 13). Bournaud et al. (2005) investigated the origins of lopsidedness in field galaxies and concluded that it is very unlikely the result of internal mechanisms but rather linked to the history and environment of the galaxies. With the NIRCam images, we have access to the spatially resolved morphology of these galaxies, and can try to better understand the causes of the lopsidedness.
Among the lopsided galaxies showed in Figs. 2.1 and 2.2, some have a clear compact central core and a rather homogeneously colored disks (e.g. ID11887, ID13776), others are mostly clumpy galaxies with a less compact core (e.g. ID18694, ID18278).
For the first category, even if we don’t have the kinematics to confirm it, it seems that the galaxies have a stable disk, with no major merger features. This means that the lopsidedness of these galaxies, is probably due to accretion and minor mergers. This accretion would be happening via streams of cold gas that asymmetrically feed more generously one side of the galaxy making it grow larger than the opposite side. Moreover, the fact that these galaxies are clumpy (see Sect. 4.2.4) and that their disk is highly heterogeneous (see Sect. 4.2.3) favors the idea of accretion or minor mergers that could create clumps or patches in the disks with different SFRs or . However, the fact that Type I galaxies have a star-forming disk and Type II a quiescent disk means that the properties of gas transport in Type I and Type II galaxies are different.
In Type I galaxies, the disk acquires its gas via accretion streams or minor mergers and forms stars, but the gas also goes to the core, which is SF as well. Bournaud et al. (2005) showed via simulations that the strong lopsidedness could be the result of gas accretion if it as asymmetric enough and that the lopsidedness from accretion is relatively long-lived (Gyr), hence easily observable. This has also been confirmed by a recent study based on the TNG50 simulation (Dolfi et al. 2023) where they conclude that the lopsidedness in local galaxies originates from accretion over several Gyr while symmetric galaxies formed earlier and within a shorter timescale.
In Type II galaxies, on the other hand, while the gas keeps going to the core and keeps it SF, the disk is quenched. This would seem to suggest that the gas does not stay in the disk, but goes straight to the center. A possible explanation would be that Type II galaxies have larger inflows or very powerful outflows that blow away and/or shock the gas in the disk (confirming this would require spectroscopy). It could also be that in Type II galaxies the accreted gas has a more radial accretion, with little angular momentum and goes straight into the central regions. Or, for some reason, the gas rapidly looses its angular momentum and abandon the disk and falls into the center. This would, depending on the direction of accretion, feed the lopsidedness. This effect has already been suggested by Kalita et al. (2022) where they were able to link the lopsidedness of 3 galaxies at in a dense environment to cold gas accretion using Lyman- emissions. The strong lopsidedness of these galaxies, would then be a tracer of the point of impact of the accretion streams.
For the clumpier galaxies, the disk is star-forming and not homogeneous. Kannan et al. (2015) showed with simulations that gas-rich disks are able to survive major mergers and that the following enhanced star-formation is not entirely happening in the core of the galaxy, but a substantial fraction takes place in the disk too. This is compatible with our Type I galaxies, the fact that their SF disks are clumpy and heterogeneous in terms of dust and sSFR could be a signature of a recent major merger (Calabrò et al. 2019). Moreover, Kannan et al. (2015) mention that the presence of a gas-rich disk contributes to reducing the efficiency of bulge formation, which is compatible with the non-compact core observed in some of these galaxies. Usually major mergers features are short lived, but the clumps we observe could be preserved due to Toomre instabilities. Indeed Fensch & Bournaud (2021) showed, via simulations, that a galaxy with a gas fraction greater than 50% will have strong disk instabilities leading to the formation of long-lived giant clumps and strong nuclear inflow affecting the structure of the galaxy and possibly introducing lopsidedness. It has already been observed in a local galaxy used as proxy for high redshift galaxies (Puschnig et al. 2023). A major merger could then result in a clumpy galaxy with a perturbed structure, which is what we have in Fig. 2.1 for some Type I galaxies. The color variations between clumps/regions in the galaxies could be tracers of the original galaxy they were a part of before the merging as they trace the dust attenuation. However, a major merger is not necessarily required, indeed, Rujopakarn et al. (2023) studied a lopsided galaxy at and concluded that its lopsidedness did not originate from interaction with the environment but from internal, large scale instabilities, that could, in the end, form bars or spiral arms.
The lopsidedness of these galaxies could also be the signature of the bulge angular momentum build-up. Indeed, either via accretion, minor mergers, major mergers, internal instabilities and tidal effects, the lopsidedness will break the disk balance, consequently creating a torque on the bulge of the galaxy resulting in an angular momentum loss.
The significance of the difference of lopsidedness between Type III galaxies and the rest of the sample means that, by some mechanism, the galaxies become much more symmetric after the Cosmic Noon. Indeed, we recall that our Type III galaxies have while Types I and II have . This could be due to increasing virialization with passing of time, also due to the stabilising effect of the larger bulge mass fraction (see lower right panel of Fig. 13).
5.7 Where do Type II galaxies come from ?
The Type II galaxies (see Sect. 3.7 and Fig. 2.2) have an unusual behavior. They have a compact star-forming core embedded in a quiescent disk, and represent of the galaxies of our sample, so are relatively common. Kalita et al. (2022) studied such galaxies in a crowded environment at and linked the quiescence of the disk to its strong lopsidedness which rapidly fuels the gas to the core of the galaxy. In our sample of Type II galaxies, 3 have a strong lopsidedness, 1 is only weakly lopsided and has an off-center core while 1 is not lopsided at all. This means that even if lopsidedness can be a driver of outside-in quenching, it is not the only one.
Based on our observations, we have three possible scenarios that could explain the observed suppression of star-formation in the disk.
The first scenario is the one developed by Kalita et al. (2022) with the lopsidedness either coming from a major merger strong enough to result in this off-centered core or from asymmetric accretion of gas via streams and minor mergers, feeding the disk preferentially on one side. The strong lopsidedness resulting from this is enough to explain the quenching of the disk as it greatly facilitates the transportation of the gas toward the core (Fensch & Bournaud 2021).
The second scenario is a wet compaction event leading to an apparent outside-in quenching. ID13098 is in the correct range of stellar mass and redshift to be in a ‘blue nugget’ phase (Lapiner et al. 2023; Dekel et al. 2009; Tacchella et al. 2016) where the galaxy undergo a wet compaction caused by gas-rich mergers or smoother gas streams, leading to an episode of high central star-formation and outside-in quenching. The presence of the low-luminosity quiescent disk might indicate that the compaction is not completely done yet. If it is a blue nugget, the outside-in quenching may not be final as when the gas has been consumed at the center and the bulge has grown, a star-forming ring can form in the disk via accretion of new gas-reach material from the inter-galactic medium leading to an inside-out quenching in the post-blue nugget phase.
The last scenario is an actual outside-in quenching linked to the strong lopsidedness but not resulting from a major merger. In Fig. 11, we show that the Type I galaxies are the most star-forming and at the higher redshift on average. They also have a stellar mass consistent with the Type II galaxies. This means that there could be an evolutionary path between Type I and Type II galaxies driven by VDI and lopsidedness. The idea is that the star-forming clumps of the Type I galaxies will migrate toward the center of mass of the galaxy (Mandelker et al. 2014). By doing so, they will fuel strong gas nuclear inflow creating a compact SF core (Fensch & Bournaud 2021). On their way to the center of the galaxy, the clumps will accrete the gas of the disk and could leave a completely gas deprived disk and a compact SF core. When growing, the SF core will prevent the formation of new clumps in the disk by stabilizing it (Hopkins et al. 2023) while the lopsidedness could be conserved due to the large scale instabilities. In this scenario, Type II galaxies are observed in a process of outside-in quenching.
Chandar et al. 2023 demonstrated that the local ULIRG Arp220 is composed of a central starburst and a larger quiescent disk. The starburst has been triggered by a major merger. The galaxy is classified as shocked post-starburst galaxy which is a stage prior to post-starburst. In that case, it appears that shocks induced by the merger forced the outer disk in this galaxy to turn quiescent. This is close to first scenario we described with the outside-in quenching originating from a major merger.
In our case, in the four remaining galaxies, two have clumpy heterogeneous disks (ID13107 and ID18278, see Fig. 2.2), the different properties of the patches, either linked to dust or sSFR (see Sect. 4.2.3) favors the idea of asymmetric accretion streams and minor mergers as the source of lopsidedness for these two galaxies. The ID13776 has a clumpy but more homogeneous disk, but highly off-centered. The eccentricity of this galaxy can both originate from asymmetric accretion making the disk grow on one side or from a major merger strong enough to shift the disk. In the same way, it is hard to conclude for the last galaxy (ID21190) which is not lopsided and seem to have a smooth homogeneous disk.
5.8 The role of environment
A way to discriminate between the scenarios of outside-in quenching and the origin of the lopsidedness of galaxies is to look at their local environment. To this aim, we use the environment density measurements from Chartab et al. (2020). They measure the density contrast of galaxies with a magnitude brighter than 26 AB mag in the H-band. The density contrast is defined as the number density enhancement with respect to the average density in the vicinity of the galaxy (local density/background density). In Fig. 21, we compare the local density contrast of our sample with the general population of galaxies in the EGS field.
The star markers in Fig. 21 are the Type II galaxies. They do not sit in any particular kind of environment, they are relatively close to the median of the general population showed by the blue dotted line. This suggest that outside-in quenching can happen both in dense environment via major mergers but also in lighter environment via internal effects. The galaxy at lower density is ID13098 that we discuss in Sect. 5.7. The fact that this galaxy is relatively isolated favors the scenario of wet compaction as the origin of its outside-in quenching. For the other galaxies, the local density is insufficient to discriminate between scenarios as they do not sit in strongly over/under crowded environments but show that they all are likely.
The color of the markers trace the lopsidedness of the galaxies. There is no obvious difference between the lopsided galaxies and the general population. We do not see any signature that could link the environment to the lopsidedness. The fact that we see lopsided galaxies not only in dense environment and that most of them have a regularly looking disk favors the idea that lopsidedness originates from accretion and/or VDI. However, this is only a tentative explanation, these measurements are not strong enough to say if environment could be a driver of lopsidedness. The circular marker showing a weakly lopsided galaxy in a high density environment is ID30186. This galaxy is the brightest galaxy of a group of members at , is undergoing a major merger and is surrounded by quiescent intra-halo light (Coogan et al. 2023).
Discriminating further between the different scenarios would require spatially resolved spectroscopy to study the kinematics of each of these galaxies, and especially of the disk of each of them, to see if their disk is rotating, which would favor accretion and minor mergers, or if they are dominated by dispersion velocity favoring the scenario of major mergers and VDI.
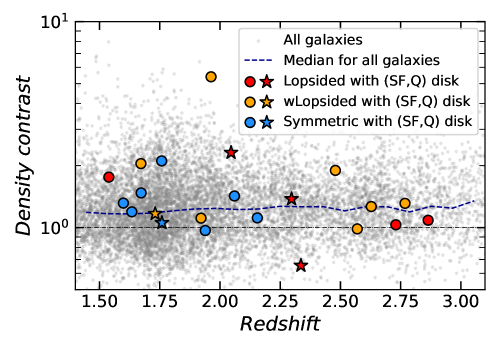
| ID | Redshift | Mass | Masscore | SFR | SFRcore | Type | Morphology |
|---|---|---|---|---|---|---|---|
| (CANDELS) | M | M | M⊙ yr-1 | M⊙ yr-1 | |||
| 11887 | b𝑏bb𝑏bSpectroscopic redshift. | Type I | cSFC+Lop | ||||
| 13098 | a𝑎aa𝑎aGrism based redshift. | Type II | cSFCc𝑐cc𝑐cSMGs analog candidate (see Sect. 5.4).+wLop | ||||
| 13107 | Type II | cSFC+Lop | |||||
| 13776 | b𝑏bb𝑏bSpectroscopic redshift. | Type II | cSFCc𝑐cc𝑐cSMGs analog candidate (see Sect. 5.4).+Lop | ||||
| 13932 | Type I | wLop | |||||
| 14559 | a𝑎aa𝑎aGrism based redshift. | Type I | cSFCc𝑐cc𝑐cSMGs analog candidate (see Sect. 5.4). | ||||
| 15036 | a𝑎aa𝑎aGrism based redshift. | Type III | … | ||||
| 15371 | b𝑏bb𝑏bSpectroscopic redshift. | Type III | wLop | ||||
| 16544 | a𝑎aa𝑎aGrism based redshift. | Type I | cSFCc𝑐cc𝑐cSMGs analog candidate (see Sect. 5.4).+wLop | ||||
| 18278 | a𝑎aa𝑎aGrism based redshift. | Type II | Lop | ||||
| 18694 | Type I | Lop | |||||
| 21190 | a𝑎aa𝑎aGrism based redshift. | Type II | cSFCc𝑐cc𝑐cSMGs analog candidate (see Sect. 5.4). | ||||
| 23205 | a𝑎aa𝑎aGrism based redshift. | Type III | … | ||||
| 23510 | a𝑎aa𝑎aGrism based redshift. | Type I | wLop | ||||
| 23581 | Type I | Lop | |||||
| 25604 | b𝑏bb𝑏bSpectroscopic redshift. | Type III | … | ||||
| 26188 | Type I | cSFC+wLop | |||||
| 29608 | Type I | cSFCc𝑐cc𝑐cSMGs analog candidate (see Sect. 5.4).+wLop | |||||
| 30012 | a𝑎aa𝑎aGrism based redshift. | Type III | … | ||||
| 30186 | a𝑎aa𝑎aGrism based redshift. | Type I | cSFCc𝑐cc𝑐cSMGs analog candidate (see Sect. 5.4).+wLop | ||||
| 31125 | Type III | … | |||||
| 31281 | b𝑏bb𝑏bSpectroscopic redshift. | Type III | … |
‘cSFC’ and ‘(w)Lop’ stand for compact star-forming core and (weakly) lopsided respectively.
6 Summary
In this paper, we used the new set of images in the near-IR from JWST/NIRCam in the EGS field from the CEERS collaboration to investigate the formation and evolution of DSFGs at Cosmic Noon. To start with, we selected a sample of DSFGs based on their FIR emissions and around Cosmic Noon (). We ended up with 22 galaxies in the CEERS field. We studied each galaxy on a sub-galactic scale by dividing them in different regions based on their NIRCam (F115W, F200W, F444W) colors, taking advantage of the spatial resolution. Using the available photometry from HST and JWST, we ran SED fitting and derived physical parameters for each galaxy component and classified them as star-forming or quiescent. We classified the galaxies in different Types based on the star-forming activity in their core and disk. The Type I have a star-forming disk with a red star-forming core, the Type II are quiescent disks with a SF core and the Type III are star-forming disks with a quenched bulge. The main results of this study are:
-
•
of the DSFGs in our sample have a red deeply dust attenuated compact star-forming core that can represent up to 80% of the total SFR of the galaxy but only 20-30% of its stellar mass. Contrary to the simulations that predict blue nuggets, these compact red cores are surrounded by large less obscured disks. Most of these cores are measured or predicted to be SMGs. However, telescopes like ALMA or NOEMA would only be sensitive to the most obscured part of the galaxy. This study demonstrates the necessity to combine near-IR imaging to sub-mm data to fully grasp the nature of DSFGs.
-
•
64% of our galaxies are at least weakly lopsided, and 27% strongly lopsided. The lopsidedness could be caused by asymmetric cold gas accretion and minor mergers feeding preferentially one side of the disk, which would, depending on the orientation of the accretion favor a star-forming or quiescent disk. Lopsidedness could also be triggered by a major merger disrupting the disk, and/or via large scale instabilities even if our study favors accretion. The fact that lopsidedness is so common among our sample means that most DSFGs have a complex SFH and do not calmly evolve without any interaction with their environment.
-
•
23% of the galaxies of our sample have a quiescent disk but a star-forming core. If one of them is compatible with a blue nugget, the others are not. Their observed outside-in quenching could then find its origins in their strong lopsidedness that favors VDI and rapid transportation of gas towards the center or from large scale instabilities and clump migration accreting the gas from the disk to feed it to the core.
-
•
Most of the galaxies have a disk with patches/clumps of different RGB color that are not radially symmetric. The color variations within the disks are mostly driven by dust attenuation. These variations are another indicator that Main Sequence DSFGs have a complex SFH.
-
•
Interestingly, among the quiescent disks, we find evidence of clump-like structures. These clumps are not (or very weakly) star-forming, they are mostly populated by old stars but seem to be to massive to be compared to the globular clusters we observe in the local universe.
This work demonstrates the power of the JWST in probing for the first time spatially resolved galaxies in the near-IR at Cosmic Noon, where the only available data was the unresolved images from Spitzer/IRAC. This allows reliable studies of quenching and dust attenuation at sub-galactic scales in DSFGs, facilitating the understanding of their morphologies and formation and evolution mechanisms that appear to be more complex than previously thought.
Acknowledgements.
CGG acknowledges support from CNES. P.G.P.-G. acknowledges support from Spanish Ministerio de Ciencia e Innovación MCIN/AEI/10.13039/501100011033 through grant PGC2018-093499-B-I00.References
- Apellániz (2006) Apellániz, J. M. 2006, The Astronomical Journal, 131, 1184, arXiv:astro-ph/0510785
- Aretxaga (2015) Aretxaga, I. 2015, provided by the SAO/NASA Astrophysics Data System
- Avni (1976) Avni, Y. 1976, The Astrophysical Journal, 210, 642
- Bagley et al. (2022) Bagley, M. B., Finkelstein, S. L., Koekemoer, A. M., et al. 2022, CEERS Epoch 1 NIRCam Imaging: Reduction Methods and Simulations Enabling Early JWST Science Results, arXiv:2211.02495 [astro-ph]
- Belli et al. (2017) Belli, S., Genzel, R., Schreiber, N. M. F., et al. 2017, The Astrophysical Journal, 841, L6, arXiv:1703.07778 [astro-ph]
- Boquien et al. (2019) Boquien, M., Burgarella, D., Roehlly, Y., et al. 2019, Astronomy & Astrophysics, 622, A103, arXiv:1811.03094 [astro-ph]
- Bournaud et al. (2005) Bournaud, F., Combes, F., Jog, C. J., & Puerari, I. 2005, Astronomy & Astrophysics, 438, 507, arXiv:astro-ph/0503314
- Bruzual & Charlot (2003) Bruzual, G. & Charlot, S. 2003, Monthly Notices of the Royal Astronomical Society, 344, 1000, arXiv:astro-ph/0309134
- Calabrò et al. (2019) Calabrò, A., Daddi, E., Fensch, J., et al. 2019, Astronomy & Astrophysics, 632, A98, arXiv:1910.01661 [astro-ph]
- Calzetti et al. (2000) Calzetti, D., Armus, L., Bohlin, R. C., et al. 2000, The Astrophysical Journal, 533, 682
- Casey et al. (2014) Casey, C. M., Narayanan, D., & Cooray, A. 2014, Physics Reports, 541, 45, arXiv:1402.1456 [astro-ph]
- Chabrier (2003) Chabrier, G. 2003, Publications of the Astronomical Society of the Pacific, 115, 763, arXiv: astro-ph/0304382
- Chandar et al. (2023) Chandar, R., Caputo, M., Linden, S., et al. 2023, The Astrophysical Journal, 943, 142
- Charlot & Fall (2000) Charlot, S. & Fall, S. M. 2000, The Astrophysical Journal, 539, 718
- Chartab et al. (2020) Chartab, N., Mobasher, B., Darvish, B., et al. 2020, The Astrophysical Journal, 890, 7
- Cid Fernandes et al. (2011) Cid Fernandes, R., Stasinska, G., Mateus, A., & Asari, N. V. 2011, Monthly Notices of the Royal Astronomical Society, 413, 1687, arXiv:1012.4426 [astro-ph]
- Cochrane et al. (2023) Cochrane, R. K., Anglés-Alcázar, D., Mercedes-Feliz, J., et al. 2023, The impact of AGN-driven winds on physical and observable galaxy sizes, arXiv:2303.12858 [astro-ph]
- Colina et al. (2023) Colina, L., Gómez, A. C., Álvarez Márquez, J., et al. 2023, Astronomy & Astrophysics, 673, L6, arXiv:2304.13529 [astro-ph]
- Coogan et al. (2023) Coogan, R. T., Daddi, E., Bail, A. L., et al. 2023, A z=1.85 galaxy group in CEERS: evolved, dustless, massive Intra-Halo Light and a Brightest Group Galaxy in the making, arXiv:2302.08960 [astro-ph]
- Daddi et al. (2009) Daddi, E., Dannerbauer, H., Krips, M., et al. 2009, The Astrophysical Journal, 695, L176, arXiv:0903.3046 [astro-ph]
- Daddi et al. (2007) Daddi, E., Dickinson, M., Morrison, G., et al. 2007, The Astrophysical Journal, 670, 156, arXiv:0705.2831 [astro-ph]
- Dekel et al. (2009) Dekel, A., Sari, R., & Ceverino, D. 2009, The Astrophysical Journal, 703, 785, arXiv:0901.2458 [astro-ph]
- Dickinson (2007) Dickinson, M. 2007, 39, 822, provided by the SAO/NASA Astrophysics Data System
- Dolfi et al. (2023) Dolfi, A., Gomez, F. A., Monachesi, A., et al. 2023, Lopsidedness as a tracer of early galactic assembly history, arXiv:2306.04639 [astro-ph]
- Draine et al. (2007) Draine, B. T., Dale, D. A., Bendo, G., et al. 2007, The Astrophysical Journal, 663, 866
- Elbaz et al. (2007) Elbaz, D., Daddi, E., Borgne, D. L., et al. 2007, Astronomy & Astrophysics, 468, 33, arXiv:astro-ph/0703653
- Elbaz et al. (2018) Elbaz, D., Leiton, R., Nagar, N., et al. 2018, Astronomy & Astrophysics, 616, A110, arXiv:1711.10047 [astro-ph]
- Elmegreen (1989) Elmegreen, B. G. 1989, The Astrophysical Journal, 344, 306
- Elmegreen (1994) Elmegreen, B. G. 1994, The Astrophysical Journal, 433, 39
- Elmegreen (2011) Elmegreen, B. G. 2011, The Astrophysical Journal, 737, 10
- Fensch & Bournaud (2021) Fensch, J. & Bournaud, F. 2021, Monthly Notices of the Royal Astronomical Society, 505, 3579, arXiv:2011.12966 [astro-ph]
- Franco et al. (2020) Franco, M., Elbaz, D., Zhou, L., et al. 2020, Astronomy & Astrophysics, 643, A30, arXiv:2005.03043 [astro-ph]
- Fujimoto et al. (2017) Fujimoto, S., Ouchi, M., Shibuya, T., & Nagai, H. 2017, The Astrophysical Journal, 850, 83, arXiv:1703.02138 [astro-ph]
- Förster-Schreiber et al. (2011) Förster-Schreiber, N. M., Shapley, A. E., Genzel, R., et al. 2011, The Astrophysical Journal, 739, 45, arXiv:1104.0248 [astro-ph]
- Gardner et al. (2023) Gardner, J. P., Mather, J. C., Abbott, R., et al. 2023, publisher: arXiv Version Number: 1
- Geach et al. (2017) Geach, J. E., Dunlop, J. S., Halpern, M., et al. 2017, Monthly Notices of the Royal Astronomical Society, 465, 1789, arXiv: 1607.03904
- Grogin et al. (2011) Grogin, N. A., Kocevski, D. D., Faber, S. M., et al. 2011, The Astrophysical Journal Supplement Series, 197, 35, arXiv:1105.3753 [astro-ph]
- Guo et al. (2012) Guo, Y., Giavalisco, M., Cassata, P., et al. 2012, The Astrophysical Journal, 749, 149, arXiv:1110.3801 [astro-ph]
- Gómez-Guijarro et al. (2022a) Gómez-Guijarro, C., Elbaz, D., Xiao, M., et al. 2022a, Astronomy & Astrophysics, 658, A43, arXiv:2106.13246 [astro-ph]
- Gómez-Guijarro et al. (2022b) Gómez-Guijarro, C., Elbaz, D., Xiao, M., et al. 2022b, Astronomy & Astrophysics, 659, A196, arXiv:2201.02633 [astro-ph]
- Hainline et al. (2011) Hainline, L. J., Blain, A. W., Smail, I., et al. 2011, The Astrophysical Journal, 740, 96
- Hodge et al. (2019) Hodge, J. A., Smail, I., Walter, F., et al. 2019, The Astrophysical Journal, 876, 130, arXiv:1810.12307 [astro-ph]
- Hopkins et al. (2023) Hopkins, P. F., Gurvich, A. B., Shen, X., et al. 2023, What Causes The Formation of Disks and End of Bursty Star Formation?, arXiv:2301.08263 [astro-ph]
- Huang et al. (2023) Huang, R., Battisti, A. J., Grasha, K., et al. 2023, Exploring the Intrinsic Scatter of the Star-Forming Galaxy Main Sequence at redshift 0.5 to 3.0, arXiv:2301.01995 [astro-ph]
- Ikarashi et al. (2017) Ikarashi, S., Caputi, K. I., Ohta, K., et al. 2017, The Astrophysical Journal, 849, L36
- Jiménez-Andrade et al. (2019) Jiménez-Andrade, E. F., Magnelli, B., Karim, A., et al. 2019, Astronomy & Astrophysics, 625, A114, arXiv:1903.12217 [astro-ph]
- Jiménez-Andrade et al. (2021) Jiménez-Andrade, E. F., Murphy, E. J., Heywood, I., et al. 2021, The Astrophysical Journal, 910, 106, arXiv:2103.07807 [astro-ph]
- Jin et al. (2018) Jin, S., Daddi, E., Liu, D., et al. 2018, The Astrophysical Journal, 864, 56
- Jog & Combes (2009) Jog, C. J. & Combes, F. 2009, Physics Reports, 471, 75
- Kalita et al. (2022) Kalita, B. S., Daddi, E., Bournaud, F., et al. 2022, Astronomy & Astrophysics, 666, A44, arXiv:2206.05217 [astro-ph]
- Kamieneski et al. (2023) Kamieneski, P. S., Frye, B. L., Pascale, M., et al. 2023, Are $JWST$/NIRCam color gradients in the lensed $z=2.3$ dusty star-forming galaxy $El~Anzuelo$ due to central dust attenuation or inside-out galaxy growth?, arXiv:2303.05054 [astro-ph]
- Kannan et al. (2015) Kannan, R., Macciò, A. V., Fontanot, F., et al. 2015, Monthly Notices of the Royal Astronomical Society, 452, 4347
- Kartaltepe et al. (2023) Kartaltepe, J. S., Rose, C., Vanderhoof, B. N., et al. 2023, The Astrophysical Journal Letters, 946, L15, arXiv:2210.14713 [astro-ph]
- Kodra et al. (2022) Kodra, D., Andrews, B. H., Newman, J. A., et al. 2022, Optimized Photometric Redshifts for the Cosmic Assembly Near-Infrared Deep Extragalactic Legacy Survey (CANDELS), arXiv:2210.01140 [astro-ph]
- Koekemoer et al. (2011) Koekemoer, A. M., Faber, S. M., Ferguson, H. C., et al. 2011, The Astrophysical Journal Supplement Series, 197, 36
- Kriek et al. (2015) Kriek, M., Shapley, A. E., Reddy, N. A., et al. 2015, The Astrophysical Journal Supplement Series, 218, 15
- Lapiner et al. (2023) Lapiner, S., Dekel, A., Freundlich, J., et al. 2023, Monthly Notices of the Royal Astronomical Society, 522, 4515
- Leslie et al. (2020) Leslie, S. K., Schinnerer, E., Liu, D., et al. 2020, The Astrophysical Journal, 899, 58
- Lindegren et al. (2021) Lindegren, L., Klioner, S. A., Hernández, J., et al. 2021, Astronomy & Astrophysics, 649, A2
- Liu et al. (2018) Liu, D., Daddi, E., Dickinson, M., et al. 2018, The Astrophysical Journal, 853, 172
- Lorenz et al. (2023) Lorenz, B., Kriek, M., Shapley, A. E., et al. 2023, An Updated Dust-to-Star Geometry: Dust Attenuation Does Not Depend on Inclination in $1.3\leq z\leq 2.6$ Star-Forming Galaxies from MOSDEF, arXiv:2304.08521 [astro-ph]
- Lutz et al. (2011) Lutz, D., Poglitsch, A., Altieri, B., et al. 2011, Astronomy & Astrophysics, 532, A90
- Ma et al. (2016) Ma, X., Hopkins, P. F., Faucher-Giguère, C.-A., et al. 2016, Monthly Notices of the Royal Astronomical Society, 456, 2140
- Mandelker et al. (2014) Mandelker, N., Dekel, A., Ceverino, D., et al. 2014, Monthly Notices of the Royal Astronomical Society, 443, 3675, arXiv:1311.0013 [astro-ph]
- Matthews et al. (1998) Matthews, L. D., van Driel, W., & Gallagher III, J. S. 1998, The Astronomical Journal, 116, 1169
- Miller et al. (2022) Miller, T. B., Whitaker, K. E., Nelson, E. J., et al. 2022, Early JWST imaging reveals strong optical and NIR color gradients in galaxies at $z\sim2$ driven mostly by dust, arXiv:2209.12954 [astro-ph]
- Momcheva et al. (2016) Momcheva, I. G., Brammer, G. B., van Dokkum, P. G., et al. 2016, The Astrophysical Journal Supplement Series, 225, 27
- Nandra et al. (2015) Nandra, K., Laird, E. S., Aird, J. A., et al. 2015, The Astrophysical Journal Supplement Series, 220, 10, arXiv:1503.09078 [astro-ph]
- Noeske et al. (2007) Noeske, K. G., Weiner, B. J., Faber, S. M., et al. 2007, The Astrophysical Journal, 660, L43, arXiv:astro-ph/0701924
- Oliver et al. (2012) Oliver, S. J., Bock, J., Altieri, B., et al. 2012, Monthly Notices of the Royal Astronomical Society, 424, 1614, arXiv: 1203.2562
- Press et al. (1992) Press, W., Teukolski, S., Vetterling, W., & Flannery, B. 1992, Numerical Recipes in C. The Art of Scientific Computing, 2nd edn. (Cambridge Univ. Press)
- Puglisi et al. (2019) Puglisi, A., Daddi, E., Liu, D., et al. 2019, The Astrophysical Journal, 877, L23, arXiv:1905.02958 [astro-ph]
- Puglisi et al. (2021) Puglisi, A., Daddi, E., Valentino, F., et al. 2021, Monthly Notices of the Royal Astronomical Society, 508, 5217, arXiv:2103.12035 [astro-ph]
- Puschnig et al. (2023) Puschnig, J., Hayes, M., Agertz, O., et al. 2023, Unveiling the gravitationally unstable disc of a massive star-forming galaxy using NOEMA and MUSE, arXiv:2303.13858 [astro-ph]
- Pérez-González et al. (2023) Pérez-González, P. G., Barro, G., Annunziatella, M., et al. 2023, The Astrophysical Journal Letters, 946, L16
- Rieke et al. (2023) Rieke, M. J., Kelly, D. M., Misselt, K., et al. 2023, Publications of the Astronomical Society of the Pacific, 135, 028001
- Rodighiero et al. (2011) Rodighiero, G., Daddi, E., Baronchelli, I., et al. 2011, The Astrophysical Journal, 739, L40, arXiv:1108.0933 [astro-ph]
- Rujopakarn et al. (2019) Rujopakarn, W., Daddi, E., Rieke, G. H., et al. 2019, The Astrophysical Journal, 882, 107, arXiv:1904.04507 [astro-ph]
- Rujopakarn et al. (2023) Rujopakarn, W., Williams, C. C., Daddi, E., et al. 2023, JWST and ALMA imaging of dust-obscured, massive substructures in a typical $z \sim 3$ star-forming disk galaxy, arXiv:2304.04683 [astro-ph]
- Salpeter (1955) Salpeter, E. E. 1955, The Astrophysical Journal, 121, 161
- Sancisi et al. (2008) Sancisi, R., Fraternali, F., Oosterloo, T., & van der Hulst, J. M. 2008, The Astronomy and Astrophysics Review, 15, 189, arXiv:0803.0109 [astro-ph]
- Schreiber et al. (2015) Schreiber, C., Pannella, M., Elbaz, D., et al. 2015, Astronomy & Astrophysics, 575, A74
- Schreiber & Wuyts (2020) Schreiber, N. M. F. & Wuyts, S. 2020, Annual Review of Astronomy and Astrophysics, 58, 661, arXiv:2010.10171 [astro-ph]
- Stefanon et al. (2017) Stefanon, M., Yan, H., Mobasher, B., et al. 2017, The Astrophysical Journal Supplement Series, 229, 32
- Tacchella et al. (2016) Tacchella, S., Dekel, A., Carollo, C. M., et al. 2016, Monthly Notices of the Royal Astronomical Society, 458, 242, arXiv:1509.00017 [astro-ph]
- Tacconi et al. (2008) Tacconi, L. J., Genzel, R., Smail, I., et al. 2008, The Astrophysical Journal, 680, 246, arXiv:0801.3650 [astro-ph]
- Tadaki et al. (2020) Tadaki, K.-i., Belli, S., Burkert, A., et al. 2020, The Astrophysical Journal, 901, 74, arXiv:2009.01976 [astro-ph]
- Tadaki et al. (2017) Tadaki, K.-i., Kodama, T., Nelson, E. J., et al. 2017, The Astrophysical Journal, 841, L25, arXiv:1703.10197 [astro-ph]
- van der Wel et al. (2014) van der Wel, A., Franx, M., van Dokkum, P. G., et al. 2014, The Astrophysical Journal, 788, 28, arXiv:1404.2844 [astro-ph]
- van der Wel et al. (2023) van der Wel, A., Martorano, M., Haussler, B., et al. 2023, Stellar Half-Mass Radii of $0.5<z<2.3$ Galaxies: Comparison with JWST/NIRCam Half-Light Radii, arXiv:2307.03264 [astro-ph]
- Varela-Lavin et al. (2023) Varela-Lavin, S., Gómez, F. A., Tissera, P. B., et al. 2023, Monthly Notices of the Royal Astronomical Society, stad1724, arXiv:2211.16577 [astro-ph]
- Wang et al. (2017) Wang, W., Faber, S. M., Liu, F. S., et al. 2017, Monthly Notices of the Royal Astronomical Society, 469, 4063
- Whitaker et al. (2011) Whitaker, K. E., Labbé, I., van Dokkum, P. G., et al. 2011, The Astrophysical Journal, 735, 86
- Wuyts et al. (2012) Wuyts, S., Schreiber, N. M. F., Genzel, R., et al. 2012, The Astrophysical Journal, 753, 114, arXiv:1203.2611 [astro-ph]
- Zaritsky et al. (2013) Zaritsky, D., Salo, H., Laurikainen, E., et al. 2013, The Astrophysical Journal, 772, 135
- Zavala et al. (2017) Zavala, J. A., Aretxaga, I., Geach, J. E., et al. 2017, Monthly Notices of the Royal Astronomical Society, 464, 3369
- Zavala et al. (2022) Zavala, J. A., Casey, C. M., Spilker, J., et al. 2022, The Astrophysical Journal, 933, 242, arXiv:2206.02835 [astro-ph]
- Zick et al. (2018) Zick, T. O., Kriek, M., Shapley, A. E., et al. 2018, The Astrophysical Journal, 867, L16, arXiv:1810.07204 [astro-ph]