XMM-Newton Observations of Two Archival X-ray Weak Type 1 Quasars: Obscuration Induced X-ray Weakness and Variability
Abstract
We report XMM-Newton observations of two examples of an unclassified type of X-ray weak quasars from the Pu et al. (2020) survey of X-ray weak quasars in the Chandra archive, SDSS J083116.62+321329.6 at and SDSS J142339.87+042041.1 at . They do not belong to the known populations of X-ray weak quasars that show broad absorption lines, weak ultraviolet (UV) broad emission lines, or red optical/UV continua. Instead, they display typical quasar UV spectra and spectral energy distributions. In the XMM-Newton observations, both quasars show nominal levels of X-ray emission with typical quasar X-ray spectral shapes (power-law photon indices of and ), displaying strong X-ray variability compared to the archival Chandra data (variability factors of and in terms of the 2 keV flux density). Simultaneous optical (rest-frame UV) spectra indicate no strong variability compared to the archival spectra. Long-term optical/UV and infrared light curves do not show any substantial variability either. We consider that the X-ray weakness observed in the Chandra data is due to X-ray obscuration from a small-scale dust-free absorber, likely related to accretion-disk winds. Such X-ray weak/absorbed states are probably rare in typical quasars, and thus both targets recovered to X-ray nominal-strength states in the XMM-Newton observations.
1 Introduction
Quasars are powered by accretion onto supermassive black holes (SMBHs) in the centers of massive galaxies. Luminous X-ray emission is a ubiquitous property of quasars, which is believed to originate largely from the “corona” located around the inner accretion disk via Comptonization of optical/ultraviolet (UV) seed photons (e.g., Done, 2010; Gilfanov & Merloni, 2014; Fabian et al., 2017; Gallo et al., 2023). A significant correlation has been observed between the coronal X-ray emission and the accretion-disk optical/UV emission, typically expressed as the relation between the X-ray-to-optical power-law slope parameter ()111 is defined as , where and are the rest-frame 2500 Å and 2 keV flux densities, respectively. and the 2500 Å monochromatic luminosity (), over 5 orders of magnitude in UV luminosity (e.g., Steffen et al., 2006; Just et al., 2007; Lusso & Risaliti, 2017; Pu et al., 2020). A quasar is considered to be X-ray weak if it deviates below the relation, showing weaker than expected X-ray emission. The amount of X-ray weakness is often quantified by the parameter, defined as the difference between the observed and expected values (); the corresponding X-ray weakness factor is .
Except for a still-uncertain potential rare population of intrinsically X-ray weak quasars (e.g., Leighly et al., 2007a, b; Luo et al., 2014; Liu et al., 2018; Wang et al., 2022), observations of X-ray weak type 1 quasars are generally ascribed to X-ray obscuration. For example, broad absorption line (BAL) quasars are generally X-ray weak due to absorption by a clumpy outflowing wind or “shielding gas” associated with the wind (e.g., Murray et al., 1995; Gallagher et al., 2006; Baskin et al., 2014; Matthews et al., 2016). Pu et al. (2020) performed a systematic investigation of X-ray emission from a large sample of Sloan Digital Sky Survey (SDSS) non-BAL type 1 quasars using Chandra archival observations, and they found a population of non-BAL X-ray weak quasars. The fraction of quasars that are X-ray weak by factors of 6 is 5.8% 0.7%. They further classified these X-ray weak quasars into three categories based on their optical spectral features: weak emission-line quasars (WLQs), red quasars, and unclassified objects. Previous studies have revealed that the X-ray weakness of the former two types of quasars is likely due to X-ray obscuration (e.g., Wilkes et al., 2005; Hall et al., 2006; Wu et al., 2011, 2012; Luo et al., 2015; Ni et al., 2018, 2022).
The nature of the unclassified type of X-ray weak quasars in Pu et al. (2020) is uncertain (see discussion in Section 5.2.3 of Pu et al. 2020). They have UV continuum and emission-line spectra very similar to the SDSS quasar composite spectrum; i.e., there are no BALs or mini-BALs, weak emission lines, or redder than typical continua. They even have typical quasar spectral energy distributions (SEDs) from the infrared (IR) to UV. These quasars were serendipitously detected by Chandra, and they have at most a few tens of photons in the 0.5–7 keV band. The derived effective power-law photon indices are generally small () but with substantial uncertainties, suggestive of X-ray absorption. Moreover, the SDSS spectra and Chandra data were not obtained simultaneously, and they are separated by 1–4 years in the rest frame. It is thus probable that the observed X-ray weakness and typical UV spectra are due to variability effects. For example, there is a rare population of extremely X-ray variable quasars that have displayed strong X-ray variability (variability factors 6) with no corresponding variability in the optical/UV spectra (e.g., PG 1211+143: Bachev et al. 2009; PG 0844+349: Gallo et al. 2011; Gibson & Brandt 2012; SDSS J135058.12 +261855.2: Liu et al. 2022). They become significantly X-ray weak in their low states, and the X-ray weakness is often explained with absorption. Another example is the strong long-term X-ray variability that has been observed in several “changing-look” (showing type transitions) quasars (e.g., LaMassa et al., 2015). If the low-state X-ray fluxes and high-state optical/UV fluxes are mixed, the derived values would appear smaller than those expected from the relation. It is also possible that during the Chandra observations these quasars developed BALs which were not present in the earlier SDSS observations; a small population of quasars has been found to show emerging or disappearing BALs (e.g., Filiz Ak et al., 2012; McGraw et al., 2017; De Cicco et al., 2018; Rogerson et al., 2018; Sameer et al., 2019; Yi & Timlin, 2021). Nevertheless, additional X-ray and optical spectroscopic observations are needed to clarify the nature of these exceptional objects.
In this study, we present additional deeper XMM-Newton observations of two examples of the unclassified type of X-ray weak quasars in Pu et al. (2020), SDSS J083116.62+321329.6 and SDSS J142339.87+042041.1 (hereafter SDSS J0831+3213 and SDSS J1423+0420). At a redshift of 1.797, SDSS J0831+3213 was detected serendipitously by a Chandra observation on 2007 December 22. It has counts in the 0.5–7 keV band with an effective power-law photon index () of (Pu et al., 2020). SDSS J1423+0420 is at . It was detected by a Chandra observation on 2012 December 15, with counts in the 0.5–7 keV band and (Pu et al., 2020). Using the relation in Steffen et al. (2006), these quasars have values of and , corresponding to values of and , respectively. In the deeper XMM-Newton observations, both quasars recovered to nominal levels of X-ray emission, and thus they displayed strong X-ray variability compared to the archival Chandra data. Optical spectra simultaneous to the XMM-Newton observations are also available. The results support the notion that these rare X-ray weak quasars were not peculiar objects having weak/suppressed coronal X-ray emission; instead, they were simply caught in unusual X-ray absorbed states.
The paper is organized as follows. We describe the X-ray and simultaneous optical spectroscopic observations in Section 2. The X-ray and multiwavelength properties of the two quasars are presented in Section 3. We discuss and summarize our results in Section 4. Throughout this paper, we use a cosmology with , , and (Planck Collaboration et al., 2020). Measurement uncertainties are quoted at a 1 confidence level, while upper limits are quoted at a 90% confidence level.
2 X-ray and optical Observations
| Object | Observation | Obs. Date | Exposure Time | |||||
|---|---|---|---|---|---|---|---|---|
| Name | () | ( cm-2) | ID | (ks) | ||||
| (1) | (2) | (3) | (4) | (5) | (6) | (7) | (8) | (9) |
| SDSS J0831+3213 | 1.797 | 18.7 | 3.87 | 0861260101 | 2021 Apr 07 | 22.1 | ||
| SDSS J1423+0420 | 1.702 | 18.8 | 2.07 | 0861260301 | 2021 Jan 25 | 36.4 |
Note. — Cols. (1) and (2): object name and redshift. Col. (3): –band magnitude. Cols. (4) and (5): single-epoch virial SMBH mass and Eddington ratio estimates from Wu & Shen (2022). Col. (6): Galactic neutral hydrogen column density. Col. (7): XMM-Newton observation ID. Col. (8): observation start date. Col. (9): cleaned EPIC pn exposure time.
2.1 XMM-Newton observations
We obtained an XMM-Newton observation of SDSS J0831+3213 on 2021 April 07 with a total exposure time of 34.9 ks. SDSS J1423+0420 was observed on 2021 January 25 with a total exposure time of 57.5 ks. The X-ray data were processed using the XMM-Newton Science Analysis System (SAS v.20.0.0; Gabriel et al., 2004) and the latest calibration files. All the EPIC pn, MOS1, and MOS2 data were used in our study. We reduced the pn and MOS data following the standard procedure described in the SAS Data Analysis Threads.222https://www.cosmos.esa.int/web/XMM-Newton/sas-threads. Background flares were filtered to generate cleaned event files. The cleaned pn, MOS1, and MOS2 exposure times are 22.1, 32.6, and 32.3 ks for SDSS J0831+3213, and they are 36.4, 53.0, and 52.4 ks for SDSS J1423+0420. Both targets are significantly detected in the pn and MOS images. For each source, we extracted a source spectrum using a circular region with a radius of 30 centred on the optical source position. The total 0.3–10 keV spectral counts combining the pn and MOS spectra are 571 and 1163 for SDSS J0831+3213 and SDSS J1423+0420, respectively. For each source, a background spectrum was extracted from a few nearby circular source-free regions on the same CCD chip with a total area of about four times the area of the source region. Spectral response files were generated using the tasks rmfgen and arfgen. We then group the source spectra with at least 25 counts per bin for spectral fitting.
The basic information for the two observations is listed in Table 1. We also present in the table some basic object properties, including the Mg II-based single-epoch virial SMBH masses and Eddington ratios from Wu & Shen (2022). We note that these mass and Eddington ratio estimates have substantial uncertainties ( dex; e.g., Shen & Liu, 2012). The Galactic neutral hydrogen column densities from HI4PI Collaboration et al. (2016) were used in the X-ray spectral analysis below.
The XMM-Newton Optical Monitor (OM) observations used three UV filters, including UVM2, UVW1, and U, with effective wavelengths of 2310 Å, 2910 Å, and 3440 Å, respectively. The OM observation of SDSS J1423+0420 was heavily contaminated by scattered light from a nearby bright field star,333See an example in Section 2.10 of the OM calibration status document: https://xmmweb.esac.esa.int/docs/documents/CAL-TN-0019.pdf. and we were not able to extract any useful photometry. For SDSS J0831+3213, the OM data were reduced using the task omchain, and the photometric measurements of every exposure were recorded in the generated SWSRLI files. We extracted the magnitude measurements for each filter from these files and computed the mean magnitudes in the three OM bands.
| Object Name | /dof | ||||
|---|---|---|---|---|---|
| (1) | (2) | (3) | (4) | (5) | (6) |
| SDSS J0831 + 3213 | 0.63 | ||||
| SDSS J1423 + 0420 | 0.79 |
Note. — Col. (1): object name. Col. (2): power-law photon index. Col. (3): power-law normalization in units of photons . Col. (4): value divided by the degrees of freedom. Col. (5): null hypothesis probability of the model. Col. (6): rest-frame 2–10 keV luminosity in units of .
2.2 Optical spectra
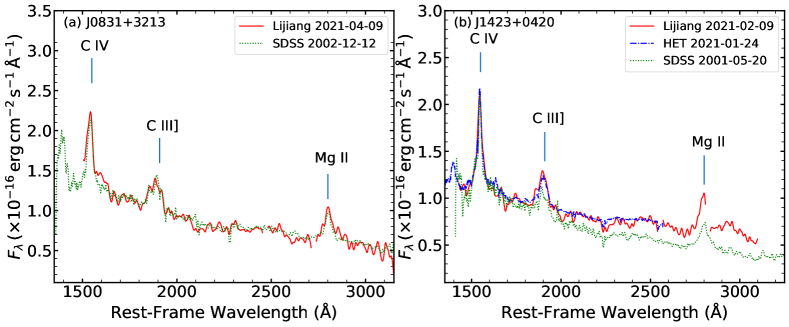
An optical spectrum of SDSS J0831+3213 was taken by the Lijiang 2.4 m telescope at the Yunnan Observatories of the Chinese Academy of Sciences on 2021 April 9 with an exposure time of 60 minutes. Optical spectra of SDSS J1423+0420 were obtained by the Hobby-Eberly Telescope (HET) at the McDonald Observatory on 2021 January 24 and by the Lijiang 2.4 m telescope on 2021 February 9; the exposure times are both 50 minutes. Grism No. 3 was used in the Lijiang observations with a resolving power of , and the data were reduced the same way as in Du et al. (2015). Flux calibration of the Lijiang spectra was carried out using the spectra of standard stars. For the HET observation of SDSS J1423+0420, we used the blue arm of the Low-Resolution Spectrograph 2 (LRS2-B) with a resolving power of . The data were processed following the standard procedures using the HET pipeline tool panacea.444https://github.com/grzeimann/Panacea. For absolute flux calibration, we normalized the HET spectrum to the Lijiang spectrum at rest-frame 2500 Å as the two observations are near simultaneous.
The Lijiang and HET (for SDSS J1423+0420) spectra of the two quasars are displayed in Figure 1. The spectra have been corrected for Galactic extinction using the Fitzpatrick et al. (2019) Milky Way extinction model with = 3.1. The Galactic values of SDSS J0831+3213 and SDSS J1423+0420 are 0.0409 and 0.0237, respectively, obtained from Schlafly & Finkbeiner (2011). Since both quasars have SDSS-I spectra, which have good flux calibration in general (e.g., Margala et al., 2016), we show in Figure 1 the corresponding SDSS spectra for comparison. The Lijiang and SDSS spectra of SDSS J0831+3213 agree well with each other. For SDSS J1423+0420, the near-simultaneous Lijiang and HET spectra appear redder than the SDSS spectrum, and they are 25% brighter than the SDSS spectrum redward of . Such a long-term variability amplitude is not uncommon among quasars, but the spectral shape change is not consistent with the typical “bluer when brighter” quasar variability (e.g. Cutri et al., 1985; Vanden Berk et al., 2004; Schmidt et al., 2012). One explanation is that there is also a slight increase of the optical/UV extinction that makes the spectra redder. Nevertheless, the rest-frame UV spectra of the two quasars do not suggest any strong variability that could lead to the observed X-ray variability described in Section 3.2 below. Both quasars show mild C IV blueshifts; for SDSS J0831+3213, the blueshift is , and for SDSS J1423+0420, it is (Wu & Shen, 2022).
3 X-ray and multiwavelength properties
3.1 X-ray spectral analysis
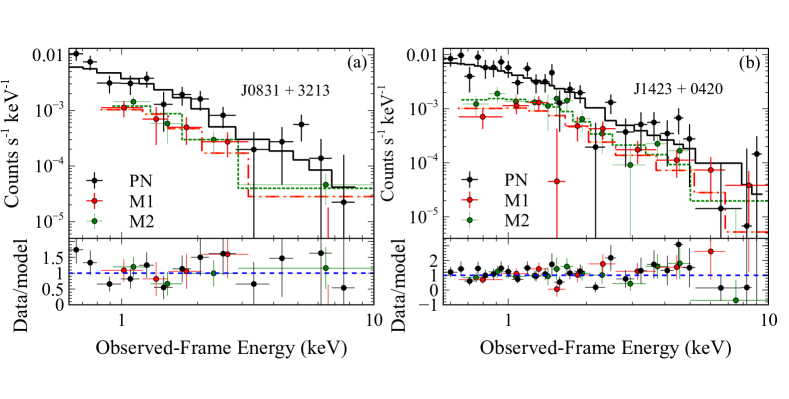
The XMM-Newton spectra of SDSS J0831+3213 and SDSS J1423+0420 were fitted using XSPEC (v12.12.1, Arnaud 1996). We adopted a simple power-law model modified by Galactic absorption (zpowerlw*phabs) to describe the 0.3–10 keV spectra. For each quasar, we jointly fitted the EPIC pn, MOS1, and MOS2 spectra, but we added normalization constants (best-fit values between 0.85 and 1.20) to the MOS spectra to allow for small cross-calibration uncertainties. The best-fit results are displayed in Table 2 and Figure 2.
The simple power-law model describes the spectra well, with small reduced values and large null hypothesis probabilities (Table 2). The resulting power-law photon indices are and , typical of type 1 quasars (e.g., Reeves et al., 1997; Just et al., 2007; Scott et al., 2011). Adding an intrinsic absorption component (zphabs) does not improve the fits, and we set upper limits on the intrinsic of and for SDSS J0831+3213 and SDSS J1423+0420, respectively. From the best-fit models, we also computed rest-frame 2–10 keV luminosities of the two quasars (Table 2), both approaching .
3.2 X-ray variability
Compared to the archival Chandra observations, the two quasars both turned out to be much brighter in the XMM-Newton observations. From the best-fit models, we calculated the rest-frame 2 keV flux densities () and listed these in Table 3. We adopted the Chandra measurements of from Pu et al. (2020). The variability amplitudes in terms of the 2 keV flux densities are thus and for SDSS J0831 + 3213 and SDSS J1423 + 0420, respectively. Such large long-term variability amplitudes are rare among quasars (e.g., Mushotzky et al., 1993; Gibson & Brandt, 2012; Middei et al., 2017; Timlin et al., 2020), which cannot be explained by typical quasar X-ray variability related to instability/fluctuations of the accretion disk and corona. Besides flux variability, the X-ray spectral shapes also appear different. In the recent XMM-Newton observations, both quasars had typical quasar spectral shapes ( values of and ) with no signatures of X-ray absorption. For SDSS J0831+3213, the effective photon index from the Chandra observation is , which is smaller than the XMM-Newton value. For SDSS J1423+0420, the 90% confidence-level upper limit on the effective photon index from the Chandra observation is , still much smaller than the XMM-Newton value.
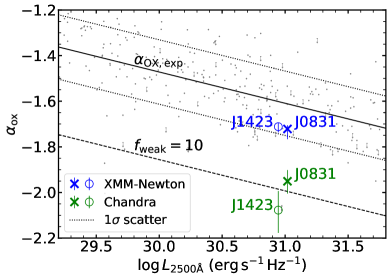
We also computed the values for the two quasars to assess the X-ray emission strength relative to the optical/UV emission strength. For the XMM-Newton observations, we derived and values from the simultaneous Lijiang spectra, which are listed in Table 3. For SDSS J0831 + 3213, the XMM-Newton OM photometric measurements also allow an estimate of via extrapolation of an adopted power-law continuum with (e.g., Vanden Berk et al., 2001). The resulting value is consistent with that derived from the Lijiang spectrum. For the Chandra observations, since there were no simultaneous optical/UV measurements and both quasars do not show strong optical/UV variability (see Section 3.3 below), we still adopted the same and values from the Lijiang spectra. We note that a 50% difference in only changes the resulting value by a small amount of about 0.06.
The values, along with the corresponding and values derived using the Steffen et al. (2006) relation, are listed in Tables 3. We also show the two quasars in the versus plane in Figure 3. Both quasars were significantly X-ray weak in the Chandra observations. Given the scatter (; Table 5 of S06) of the Steffen et al. (2006) relation, these values correspond to 2.4 and 3.4 deviations from the relation, respectively. However, both quasars recovered to nominal levels of X-ray emission in the XMM-Newton observations with values of , within the scatter of the Steffen et al. (2006) relation. Considering also the flatter spectral shapes in the Chandra observations, the X-ray weak states were likely not intrinsic, but they were simply caused by X-ray obscuration. In the recent XMM-Newton observations, there is no X-ray obscuration, and thus both the spectral shapes and flux levels return to those of typical quasars.
3.3 Spectral energy distributions and optical–IR light curves
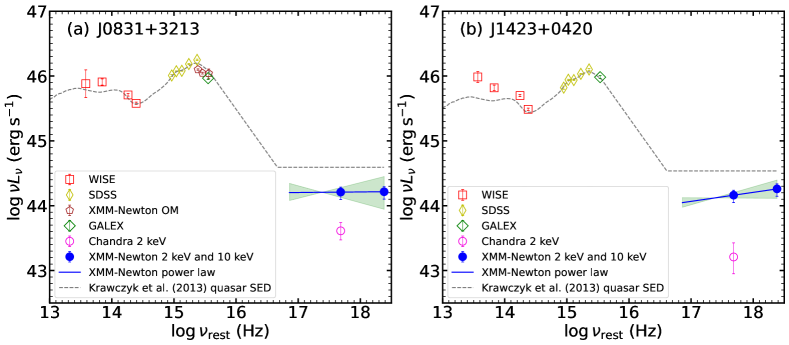
We constructed IR-to-X-ray SEDs for the two quasars, shown in Figure 4. The IR–UV photometric data were collected from the Wide-field Infrared Survey Explorer (WISE; Wright et al., 2010; WISE Team, 2020a), SDSS (York et al., 2000), and Galaxy Evolution Explorer (GALEX; Martin et al., 2005) catalogs. The GALEX data presented in this paper were obtained from the Mikulski Archive for Space Telescopes (MAST) at the Space Telescope Science Institute. The specific observations analyzed can be accessed via https://doi.org/10.17909/T9H59D (catalog doi:10.17909/T9H59D). For these two quasars, only near-UV (NUV) measurements are available in the GALEX catalog; the non-detections in the far-UV (FUV) band are probably caused by the Lyman break in these quasars. All the SED data have been corrected for the Galactic extinction. For SDSS J0831 + 3213, the XMM-Newton OM measurements were added to the SED plot. For both quasars, we added the XMM-Newton 2 keV and 10 keV luminosities determined from the best-fit results in Section 3.1. We also show the X-ray spectral slopes and their uncertainties. For the Chandra observations, we added the 2 keV luminosities from Pu et al. (2020). For comparison, we include the mean SED of high-luminosity quasars in Krawczyk et al. (2013), scaled to the 2500 Å luminosities of our objects. An X-ray component was added to the mean SED to indicate the Steffen et al. (2006) relation. We note that the IR–UV SED data are not simultaneous, and they may be affected by mild variability (see light curves below). However, the IR–UV SEDs of both quasars are still broadly consistent with those of typical quasars. SDSS J1423 + 0420 shows somewhat stronger mid-IR emission, which is not unusual considering the complex quasar IR emission mechanisms (e.g., Lyu et al., 2017; Zhuang et al., 2018).
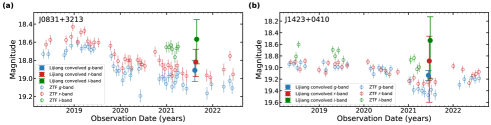
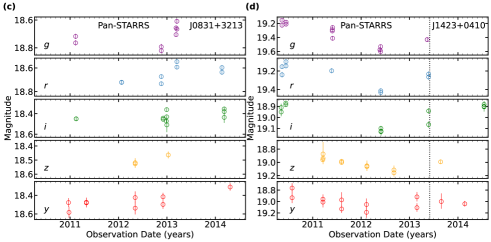
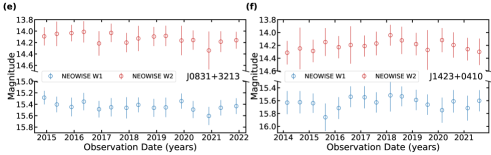
To investigate the IR–UV photometric variability of the two quasars, we collected their multi-epoch data from the Zwicky Transient Facility (ZTF; Masci et al., 2019), Panoramic Survey Telescope and Rapid Response System (Pan-STARRS; Flewelling et al., 2020), and Near-Earth Object Wide-field Infrared Survey Explorer Reactivation Mission (NEOWISE; Mainzer et al., 2011; WISE Team, 2020b) catalogs. The Pan-STARRS data presented in this paper were obtained from the MAST at the Space Telescope Science Institute. The specific observations analyzed can be accessed via https://doi.org/10.17909/s0zg-jx37 (catalog doi:10.17909/s0zg-jx37). The ZTF, Pan-STARRS, and NEOWISE light curves are presented in Figure 5. The ZTF light curves overlap the dates of the Lijiang observations, and thus we derived corresponding photometric measurements from the Lijiang spectra and added these to the ZTF light curves. For SDSS J0831 + 3213, the Lijiang measurements are slightly brighter than the adjacent ZTF data, but they are separated by a few months. For SDSS J1423 + 0410, the Lijiang measurements are consistent with the ZTF data within the uncertainties. The flux calibration of the Lijiang spectra thus appears reasonable.
These optical/UV and IR light curves indicate that the two quasars do not show any substantial long-term variability in these bands. The maximum variability amplitude reaches mag (a factor of 1.6) in these light curves, still much smaller than the X-ray variability factors (Section 3.2). Therefore, the X-ray weakness and X-ray variability of these two quasars are not likely connected to any changing-look behavior where the optical/UV and X-ray continua vary coordinately.
4 Discussion and Summary
The XMM-Newton observations of the two quasars reveal that they have recovered to nominal levels of X-ray emission with typical X-ray spectral shapes (Sections 3.1 and 3.2). The X-ray weak states in the Chandra observations that motivated this study are thus likely caused by X-ray obscuration considering the flat spectral shapes ( = and ). Given the variability factors ( 4.0 and 9.0), we estimate that the column densities of the absorbers are and by adding an intrinsic absorption component to the best-fit models in Section 3.1. The X-ray variability between the Chandra and XMM-Newton observations is then explained with changes of X-ray obscuration.
Of the 426 sample B C quasars in Pu et al. (2020), 14 ( 3.3%) quasars were identified as the unclassified type of X-ray weak quasars which have typical quasar UV continua and emission-line spectra. Out of these 14 objects, we selected two targets and obtained just one additional XMM-Newton observation for each. Yet they both turned out to be typical quasars considering their X-ray properties, UV spectra, and SEDs. These results suggest that the X-ray weak states caught in the archival Chandra observations are rare, and these quasars should show nominal levels of X-ray emission most of the time. This is also consistent with the small fraction of such objects found in the Pu et al. (2020) survey study. In this case, if we reobserve the other 12 unclassified type of X-ray weak quasars in Pu et al. (2020), we should find nominal levels of X-ray emission in most of them. It is even probable that typical quasars might also become X-ray obscured occasionally (e.g., of the time) if long-term X-ray monitoring observations are available.
Since the long-term optical/UV and IR light curves do not show substantial variability (Section 3.3), and the multi-epoch UV spectra do not vary much (Section 2.2), the X-ray absorber likely does not affect the optical/UV continuum emission. A good candidate for such an absorber is the small-scale clumpy accreting-disk wind that is dust free. We cannot exclude the possibility that unusual UV spectral features accompanied the Chandra X-ray weak states. For example, they might have exhibited BAL features during the Chandra observations (Section 1), and they showed non-BAL-to-BAL-to-non-BAL transitions among the SDSS (non-BAL), Chandra (assumed BAL), and HET/Lijiang (non-BAL) observations, which are separated by 1.9–4.1 years in the rest frame. However, the probability of having such multiple BAL transitions appears insufficient to explain the 3.3% fraction of the unclassified type of X-ray weak quasars in Pu et al. (2020). For example, Rogerson et al. (2018) found a non-BAL-to-BAL quasar emergence rate of based on a parent sample of SDSS quasars; among these BAL transition cases, only about 1/6 of the objects exhibited both emergence and disappearance. Nevertheless, absorption from the clumpy disk wind is still a probable cause of the X-ray weakness in BAL quasars (e.g., Matthews et al., 2016).
Obscuration from the disk wind (and from a possible geometrically thick accretion disk) has been suggested to explain the X-ray weakness observed in some WLQs and super-Eddington accreting quasars (e.g., Miniutti et al., 2012; Luo et al., 2015; Ni et al., 2020, 2022; Liu et al., 2021, 2022; Huang et al., 2023). Powerful disk winds launched via radiation pressure are expected in these quasars (e.g., Jiang et al., 2014, 2019; Sadowski et al., 2014), and they could potentially provide significant X-ray obscuration. SDSS J0831 + 3213 and SDSS J1423 + 0410 do not show weak UV emission lines like WLQs, and their estimated Eddington ratios are not high (Table 1). Therefore, they might simply be typical type 1 quasars that occasionally develop powerful winds and enter the rare X-ray weak/absorbed states. Besides the wind density and covering factor, the probability of observing such extreme X-ray variability among typical quasars should also have an orientation dependence, as a large inclination angle is preferred for observing X-ray obscuration from the equatorial disk wind. Identification of more such objects is required to clarify their nature.
In summary, we present the XMM-Newton observations of two examples of an unclassified type of X-ray weak quasars from the Pu et al. (2020) Chandra survey, SDSS J0831 + 3213 and SDSS J1423 + 0410. Their UV continua and emission-line spectra are similar to typical quasars and lack BALs, and they have typical quasar IR–UV SEDs. In the XMM-Newton observations, both quasars show nominal levels of X-ray emission with typical quasar X-ray spectral shapes, displaying strong X-ray variability compared to the archival Chandra data. Simultaneous optical (rest-frame UV) spectra indicate no strong variability compared to the SDSS spectra. Long-term optical/UV and IR light curves do not show any substantial variability either. We consider that the X-ray weakness observed in the Chandra observations is due to X-ray obscuration from a small-scale dust-free absorber, likely related to accretion-disk winds. Such X-ray weak/absorbed states are probably rare in typical quasars like SDSS J0831 + 3213 and SDSS J1423 + 0410, and thus they both recovered to X-ray nominal-strength states in the XMM-Newton observations. Future observations of similar objects (e.g., the other 12 unclassified type of X-ray weak quasars in Pu et al. 2020) should be able to provide constraints on the duty cycles of the X-ray weak states in these quasars and thus clarify their nature. We note that even in the high states, the expected 0.5–2 keV fluxes of these Pu et al. (2020) quasars derived from the relation are still 5–10 times lower than the sensitivity limit of the eROSITA survey (e.g., Merloni et al., 2012; Predehl et al., 2021), and thus targeted observations by XMM-Newton/Chandra are needed.
| Object Name | Observatory | Date | ||||||
|---|---|---|---|---|---|---|---|---|
| (1) | (2) | (3) | (4) | (5) | (6) | (7) | (8) | (9) |
| SDSS J0831 + 3213 | Chandra | 2007–12–22 | ||||||
| XMM-Newton | 2021–04–07 | |||||||
| SDSS J1423 + 0420 | Chandra | 2012–12–15 | ||||||
| XMM-Newton | 2021–01–25 |
Note. — Col. (1): object name. Col. (2): observatory. Col. (3): observation date. Col. (4): rest-frame 2 keV flux density in units of ; the errors of the Chandra measurement were propagated from the count errors. Col. (5): rest-frame 2500 Å flux density in units of , derived from the Lijiang spectrum. Col. (6): 2500 Å monochromatic luminosity in units of . Col. (7): X-ray-to-optical power-law slope parameter with the uncertainties propagated from the uncertainties. Col. (8): difference between the observed value and the expected value derived from the - relation of Steffen et al. (2006). Col. (9): X-ray weakness factor: .
References
- Arnaud (1996) Arnaud, K. 1996, in ASP Conf., Vol. 17
- Bachev et al. (2009) Bachev, R., Grupe, D., Boeva, S., et al. 2009, MNRAS, 399, 750, doi: 10.1111/j.1365-2966.2009.15301.x
- Baskin et al. (2014) Baskin, A., Laor, A., & Stern, J. 2014, MNRAS, 438, 604, doi: 10.1093/mnras/stt2230
- Cutri et al. (1985) Cutri, R. M., Wisniewski, W. Z., Rieke, G. H., & Lebofsky, M. J. 1985, ApJ, 296, 423, doi: 10.1086/163461
- De Cicco et al. (2018) De Cicco, D., Brandt, W. N., Grier, C. J., et al. 2018, A&A, 616, A114, doi: 10.1051/0004-6361/201732497
- Done (2010) Done, C. 2010, arXiv e-prints, arXiv:1008.2287, doi: 10.48550/arXiv.1008.2287
- Du et al. (2015) Du, P., Hu, C., Lu, K.-X., et al. 2015, ApJ, 806, 22, doi: 10.1088/0004-637X/806/1/22
- Fabian et al. (2017) Fabian, A. C., Alston, W. N., Cackett, E. M., et al. 2017, Astronomische Nachrichten, 338, 269, doi: 10.1002/asna.201713341
- Filiz Ak et al. (2012) Filiz Ak, N., Brandt, W. N., Hall, P. B., et al. 2012, ApJ, 757, 114, doi: 10.1088/0004-637X/757/2/114
- Fitzpatrick et al. (2019) Fitzpatrick, E. L., Massa, D., Gordon, K. D., Bohlin, R., & Clayton, G. C. 2019, ApJ, 886, 108, doi: 10.3847/1538-4357/ab4c3a
- Flewelling et al. (2020) Flewelling, H. A., Magnier, E. A., Chambers, K. C., et al. 2020, ApJS, 251, 7, doi: 10.3847/1538-4365/abb82d
- Gabriel et al. (2004) Gabriel, C., Denby, M., Fyfe, D. J., et al. 2004, in Astronomical Society of the Pacific Conference Series, Vol. 314, Astronomical Data Analysis Software and Systems (ADASS) XIII, ed. F. Ochsenbein, M. G. Allen, & D. Egret, 759
- Gallagher et al. (2006) Gallagher, S. C., Brandt, W. N., Chartas, G., et al. 2006, ApJ, 644, 709, doi: 10.1086/503762
- Gallo et al. (2011) Gallo, L. C., Grupe, D., Schartel, N., et al. 2011, MNRAS, 412, 161, doi: 10.1111/j.1365-2966.2010.17894.x
- Gallo et al. (2023) Gallo, L. C., Miller, J. M., & Costantini, E. 2023, arXiv e-prints, arXiv:2302.10930, doi: 10.48550/arXiv.2302.10930
- Gibson & Brandt (2012) Gibson, R. R., & Brandt, W. N. 2012, ApJ, 746, 54, doi: 10.1088/0004-637X/746/1/54
- Gilfanov & Merloni (2014) Gilfanov, M., & Merloni, A. 2014, Space Sci. Rev., 183, 121, doi: 10.1007/s11214-014-0071-5
- Hall et al. (2006) Hall, P. B., Gallagher, S. C., Richards, G. T., et al. 2006, AJ, 132, 1977, doi: 10.1086/507842
- HI4PI Collaboration et al. (2016) HI4PI Collaboration, Ben Bekhti, N., Flöer, L., et al. 2016, A&A, 594, A116, doi: 10.1051/0004-6361/201629178
- Huang et al. (2023) Huang, J., Luo, B., Brandt, W. N., et al. 2023, ApJ, 950, 18, doi: 10.3847/1538-4357/accd64
- Jiang et al. (2014) Jiang, Y.-F., Stone, J. M., & Davis, S. W. 2014, ApJ, 796, 106, doi: 10.1088/0004-637X/796/2/106
- Jiang et al. (2019) —. 2019, ApJ, 880, 67, doi: 10.3847/1538-4357/ab29ff
- Just et al. (2007) Just, D. W., Brandt, W. N., Shemmer, O., et al. 2007, ApJ, 665, 1004, doi: 10.1086/519990
- Krawczyk et al. (2013) Krawczyk, C. M., Richards, G. T., Mehta, S. S., et al. 2013, ApJS, 206, 4, doi: 10.1088/0067-0049/206/1/4
- LaMassa et al. (2015) LaMassa, S. M., Cales, S., Moran, E. C., et al. 2015, ApJ, 800, 144, doi: 10.1088/0004-637X/800/2/144
- Leighly et al. (2007a) Leighly, K. M., Halpern, J. P., Jenkins, E. B., & Casebeer, D. 2007a, ApJS, 173, 1, doi: 10.1086/519768
- Leighly et al. (2007b) Leighly, K. M., Halpern, J. P., Jenkins, E. B., et al. 2007b, ApJ, 663, 103, doi: 10.1086/518017
- Liu et al. (2021) Liu, H., Luo, B., Brandt, W. N., et al. 2021, ApJ, 910, 103, doi: 10.3847/1538-4357/abe37f
- Liu et al. (2018) Liu, H., Luo, B., Brandt, W. N., Gallagher, S. C., & Garmire, G. P. 2018, ApJ, 859, 113, doi: 10.3847/1538-4357/aabe8d
- Liu et al. (2022) Liu, H., Luo, B., Brandt, W. N., et al. 2022, ApJ, 930, 53, doi: 10.3847/1538-4357/ac6265
- Luo et al. (2014) Luo, B., Brandt, W. N., Alexander, D. M., et al. 2014, ApJ, 794, 70, doi: 10.1088/0004-637X/794/1/70
- Luo et al. (2015) Luo, B., Brandt, W. N., Hall, P. B., et al. 2015, ApJ, 805, 122, doi: 10.1088/0004-637X/805/2/122
- Lusso & Risaliti (2017) Lusso, E., & Risaliti, G. 2017, A&A, 602, A79, doi: 10.1051/0004-6361/201630079
- Lyu et al. (2017) Lyu, J., Rieke, G. H., & Shi, Y. 2017, ApJ, 835, 257, doi: 10.3847/1538-4357/835/2/257
- Mainzer et al. (2011) Mainzer, A., Bauer, J., Grav, T., et al. 2011, ApJ, 731, 53, doi: 10.1088/0004-637X/731/1/53
- Margala et al. (2016) Margala, D., Kirkby, D., Dawson, K., et al. 2016, ApJ, 831, 157, doi: 10.3847/0004-637X/831/2/157
- Martin et al. (2005) Martin, D. C., Fanson, J., Schiminovich, D., et al. 2005, ApJ, 619, L1, doi: 10.1086/426387
- Masci et al. (2019) Masci, F. J., Laher, R. R., Rusholme, B., et al. 2019, PASP, 131, 018003, doi: 10.1088/1538-3873/aae8ac
- Matthews et al. (2016) Matthews, J. H., Knigge, C., Long, K. S., et al. 2016, MNRAS, 458, 293, doi: 10.1093/mnras/stw323
- McGraw et al. (2017) McGraw, S. M., Brandt, W. N., Grier, C. J., et al. 2017, MNRAS, 469, 3163, doi: 10.1093/mnras/stx1063
- Merloni et al. (2012) Merloni, A., Predehl, P., Becker, W., et al. 2012, arXiv e-prints, arXiv:1209.3114, doi: 10.48550/arXiv.1209.3114
- Middei et al. (2017) Middei, R., Vagnetti, F., Bianchi, S., et al. 2017, A&A, 599, A82, doi: 10.1051/0004-6361/201629940
- Miniutti et al. (2012) Miniutti, G., Brandt, W. N., Schneider, D. P., et al. 2012, MNRAS, 425, 1718, doi: 10.1111/j.1365-2966.2012.21648.x
- Murray et al. (1995) Murray, N., Chiang, J., Grossman, S. A., & Voit, G. M. 1995, ApJ, 451, 498, doi: 10.1086/176238
- Mushotzky et al. (1993) Mushotzky, R. F., Done, C., & Pounds, K. A. 1993, ARA&A, 31, 717, doi: 10.1146/annurev.aa.31.090193.003441
- Ni et al. (2018) Ni, Q., Brandt, W. N., Luo, B., et al. 2018, MNRAS, 480, 5184, doi: 10.1093/mnras/sty1989
- Ni et al. (2020) Ni, Q., Brandt, W. N., Yi, W., et al. 2020, ApJ, 889, L37, doi: 10.3847/2041-8213/ab6d78
- Ni et al. (2022) Ni, Q., Brandt, W. N., Luo, B., et al. 2022, MNRAS, 511, 5251, doi: 10.1093/mnras/stac394
- Planck Collaboration et al. (2020) Planck Collaboration, Aghanim, N., Akrami, Y., et al. 2020, A&A, 641, A6, doi: 10.1051/0004-6361/201833910
- Predehl et al. (2021) Predehl, P., Andritschke, R., Arefiev, V., et al. 2021, A&A, 647, A1, doi: 10.1051/0004-6361/202039313
- Pu et al. (2020) Pu, X., Luo, B., Brandt, W. N., et al. 2020, ApJ, 900, 141, doi: 10.3847/1538-4357/abacc5
- Reeves et al. (1997) Reeves, J. N., Turner, M. J. L., Ohashi, T., & Kii, T. 1997, MNRAS, 292, 468, doi: 10.1093/mnras/292.3.468
- Rogerson et al. (2018) Rogerson, J. A., Hall, P. B., Ahmed, N. S., et al. 2018, ApJ, 862, 22, doi: 10.3847/1538-4357/aabfe5
- Sameer et al. (2019) Sameer, Brandt, W. N., Anderson, S., et al. 2019, MNRAS, 482, 1121, doi: 10.1093/mnras/sty2718
- Schlafly & Finkbeiner (2011) Schlafly, E. F., & Finkbeiner, D. P. 2011, ApJ, 737, 103, doi: 10.1088/0004-637X/737/2/103
- Schmidt et al. (2012) Schmidt, K. B., Rix, H.-W., Shields, J. C., et al. 2012, ApJ, 744, 147, doi: 10.1088/0004-637X/744/2/147
- Scott et al. (2011) Scott, A. E., Stewart, G. C., Mateos, S., et al. 2011, MNRAS, 417, 992, doi: 10.1111/j.1365-2966.2011.19325.x
- Shen & Liu (2012) Shen, Y., & Liu, X. 2012, ApJ, 753, 125, doi: 10.1088/0004-637X/753/2/125
- Sadowski et al. (2014) Sadowski, A., Narayan, R., McKinney, J. C., & Tchekhovskoy, A. 2014, MNRAS, 439, 503, doi: 10.1093/mnras/stt2479
- Steffen et al. (2006) Steffen, A. T., Strateva, I., Brandt, W. N., et al. 2006, AJ, 131, 2826, doi: 10.1086/503627
- Timlin et al. (2020) Timlin, John D., I., Brandt, W. N., Zhu, S., et al. 2020, MNRAS, 498, 4033, doi: 10.1093/mnras/staa2661
- Vanden Berk et al. (2001) Vanden Berk, D. E., Richards, G. T., Bauer, A., et al. 2001, AJ, 122, 549, doi: 10.1086/321167
- Vanden Berk et al. (2004) Vanden Berk, D. E., Wilhite, B. C., Kron, R. G., et al. 2004, ApJ, 601, 692, doi: 10.1086/380563
- Wang et al. (2022) Wang, C., Luo, B., Brandt, W. N., et al. 2022, ApJ, 936, 95, doi: 10.3847/1538-4357/ac886e
- Wilkes et al. (2005) Wilkes, B. J., Pounds, K. A., Schmidt, G. D., et al. 2005, ApJ, 634, 183, doi: 10.1086/444555
- WISE Team (2020a) WISE Team. 2020a, WISE All-Sky Source Catalog, IPAC, doi: 10.26131/IRSA142
- WISE Team (2020b) —. 2020b, NEOWISE 2-Band Post-Cryo Single Exposure (L1b) Source Table, IPAC, doi: 10.26131/IRSA124
- Wright et al. (2010) Wright, E. L., Eisenhardt, P. R. M., Mainzer, A. K., et al. 2010, AJ, 140, 1868, doi: 10.1088/0004-6256/140/6/1868
- Wu et al. (2012) Wu, J., Brandt, W. N., Anderson, S. F., et al. 2012, ApJ, 747, 10, doi: 10.1088/0004-637X/747/1/10
- Wu et al. (2011) Wu, J., Brandt, W. N., Hall, P. B., et al. 2011, ApJ, 736, 28, doi: 10.1088/0004-637X/736/1/28
- Wu & Shen (2022) Wu, Q., & Shen, Y. 2022, ApJS, 263, 42, doi: 10.3847/1538-4365/ac9ead
- Yi & Timlin (2021) Yi, W., & Timlin, J. 2021, ApJS, 255, 12, doi: 10.3847/1538-4365/ac00b8
- York et al. (2000) York, D. G., Adelman, J., Anderson, John E., J., et al. 2000, AJ, 120, 1579, doi: 10.1086/301513
- Zhuang et al. (2018) Zhuang, M.-Y., Ho, L. C., & Shangguan, J. 2018, ApJ, 862, 118, doi: 10.3847/1538-4357/aacc2d