Named entity recognition using GPT for identifying comparable companies
Abstract
For both public and private firms, comparable companies’ analysis is widely used as a method for company valuation. In particular, the method is of great value for valuation of private equity companies. The several approaches to the comparable companies’ method usually rely on a qualitative approach to identifying similar peer companies, which tend to use established industry classification schemes and/or analyst intuition and knowledge. However, more quantitative methods have started being used in the literature and in the private equity industry, in particular, machine learning clustering, and natural language processing (NLP). For NLP methods, the process consists of extracting product entities from e.g., the company’s website or company descriptions from some financial database system and then to perform similarity analysis. Here, using companies’ descriptions/summaries from publicly available companies’ Wikipedia websites, we show that using large language models (LLMs), such as GPT from OpenAI, has a much higher precision and success rate than using the standard named entity recognition (NER) methods which use manual annotation. We demonstrate quantitatively a higher precision rate, and show that, qualitatively, it can be used to create appropriate comparable companies peer groups which could then be used for equity valuation.
Keywords — equity valuation, NER, GPT, entity extraction, similarity, few-shot learning
1 Introduction
Company valuation is the process of attributing a value to a public or private company111Public companies’ stocks are listed on an exchange, allowing for more transparency and scrutiny, while private companies’ stocks are private held and a common realizable price for the shares is not easily or readily obtainable. in a certain currency and valuation date. For public companies, one could use e.g., the exchange share price multiplied by the total number of shares as a valuation222Given that share prices fluctuate short term in a stochastic fashion, one may want to take some averaging across time, as it is standard in the financial industry (see e.g., Huddart et al., 2009)., but often there is a speculative influence on the share price, making the stock price, at short time scales, more of a stochastic rather than a deterministic variable (see e.g., Black, 1986; Fama, 1995). For private companies, one does not even have a publicly available share price, so several methods have been proposed for valuation (see e.g., Damodaran, 2012, and references therein). Nonetheless, all these quantitative methods can be used for any firm, regardless of being public or private. Three of the most used methods (see e.g., Table 3 in Manigart et al., 2000, for a survey of most commonly used methods) are respectively: the comparable companies or financial multiples / relative valuation method; the comparable transactions method; and the discounted cash-flow (DCF) method. These methods are used to value a company, rather than its stock, as these are mostly used for long term investment, or mergers and acquisitions (M&A), rather than short-term trading or arbitrage.
The first method, comparable companies, or relative valuation (see e.g., Liu et al., 2002), is based on the ratios of one or some of the financial variables of the selected company to value against the ones from a peer group of public companies. These ratios are therefore dimensionless. As we can obtain the share value of the public companies from the stock market value, we have, therefore, the enterprise value of those companies, and through some kind of averaging (including possibly some statistical removal of outliers), we can obtain a peer or similar companies group ratio. Once the peer group ratios are obtained, one can use the financial statements of the selected company to do an inversion and obtain an enterprise value estimate for the company. The second method, comparable transactions (see e.g., Berkman et al., 2000, and references therein), analyses similar companies that have transacted recently, either an acquisition, or a merger (M&A), or an initial public offer (IPO), or a seasoned equity offerings (SEO) or similar. Then, the same approach as the relative valuation is used, using available ratios based on the valuation related to the transaction. The third method, the discounted cash-flow method or DCF for short (see e.g., Inselbag and Kaufold, 1997, and references therein), uses the future projected cash-flows of the company, discounted to today, i.e., multiplied by a factor or factors to consider the future value of money. There are many other methods and quite a lot of variations on the above ones, but these are, according to some surveys (Liu, 2020), some of the most used approaches. Most of the equity valuation research (both public and private) is, however, done quite manually, whereby the equity researcher or financial analyst uses some data source of financial data (e.g., Bloomberg, Factset, Reuters - now called Refinitiv, S&P, UK Companies House, U.S. Securities and Exchange Commission) and a spreadsheet model333Sometimes the spreadsheet, usually in Excel, are augmented with some Visual Basic – VBA code. to value the selected company. This can lead to errors, biases, lack of traceability and reproducibility, etc. This is quite costly, and recently, there has been some advances in the automation of this process, done by several fintech software houses, e.g., Valutico or Equity-X, in order to solve the problem of consistency and process industrialization.
For the first two valuation methods described above, the comparable companies and comparable transactions approaches, it is essential to define what we mean by similar or peer group companies. There are many other reasons to want to be able to identify comparable companies, e.g., for M&A (Eaton et al., 2022); for the owners to establishing the competitive landscape; for economic research into business networks; among others. There are also many ways to identify the company’s peer group, some approaches being qualitative, some being quantitative. A particularly used method is to choose companies within the same sector by using a standard industry classification such as the Standard Industrial Classification (SIC) system, the North American Industry Classification System (NAICS) and the Global Industry Classifications Standard (GICS) system (Phillips and Ormsby, 2016). However as far back as King (1966) it has been noted that the industry grouping only contribute a small percentage of stock returns variance. Other studies (see e.g., Bhojraj et al., 2003; Hoberg and Phillips, 2016) have tried to show that most of these industry classifications (with maybe the exception of the GICS system), do not explain most of the cross-sectional share movement within a industry or sub-industry code. De Franco et al. (2015) found that research analysts or equity valuation experts tend to choose peer companies based on the size, asset turnover, the industry classification, and trading volume, among other less relevant variables. Some quantitative approaches for peer selection, based on “big data” have also been proposed (Lee et al., 2015, 2016), whereby companies’ peer groups are build based on top co-searches by financial analysts, using databases such as USA Electronic Data Gathering, Analysis and Retrieval system (EDGAR), part of the Security Exchange Commission (SEC), used by, e.g., sell-side stock analysts. The results seem to show that the so-called “wisdom of the crowd” approaches for peer construction can perform well. The results by Kaustia and Rantala (2021) seem to support this, that co-searches by analysts help to define more homogeneous peer groups than industry classifications. Some (Sprenger and Welpe, 2011) even used natural language processing (NLP) to extract data from social media (Twitter) to define a company network, i.e., peer groups that more readily explain stock movement than industry classification groups. Knudsen et al. (2017) and Nel (2015) attempted to show that using the similarity of fundamentals to defined peer groups can increase the precision of the valuation and therefore provide more meaningful company groupings. Fan et al. (2019); Eaton et al. (2022) found that while industry classification codes, such as SIC codes, where not of much use by investment bankers when choosing peers, and that the products or services sold by the companies were of much more interest when devising peer groups. Recently, some (Breitung and Müller, 2023) have even used advanced large language models (LLMs), a form of NLP, to reveal a company similarity network across most of the world’s public companies, and seem to have shown that using such a company similarity network can be used to create peer groups that, when traded, would lead to a significant higher return that using analysts’ co-searches, or fundamentals clustering, or industry classification.
2 Results
Following on the above approaches to finding similar companies based on products (Fan et al., 2019; Eaton et al., 2022) and company descriptions (Breitung and Müller, 2023), and recognizing that we need a method, e.g., named entity recognition (NER), that can create peer groups in a consistent way with good performance, we decided to study in this paper the efficiency of the so-called Chat Generative Pre-Trained Transformer, commonly known as GPT, in this case the GPT 3.5 (model gpt-3.5-turbo) LLM model (Radford et al., 2018; Brown et al., 2020) from OpenAI against a NER base model using spaCy (Honnibal and Montani, 2017). We researched the ability of both models in extracting the products and services companies provide based on the publicly available description of those firms in their respective Wikipedia websites. While LLM models create a statistical probability distribution function of words showing up consecutively, and is based on unsupervised learning444Unsupervised learning are statistical methods that create a model from data that is not labelled by humans. This is in contrast with supervised learning, where data is labelled, e.g., a set of images together with the label, the description, or to give an example within the subject this paper, one could have the data as the fundamentals of the company, and as the label as the value of the company, e.g., the dividend yield or the future growth rate (see e.g., Berry et al., 2019, and reference therein)., standard NER models create a neural network, mapping unstructured text to a set of entities based on supervised learning. Standard neural network systems such as spaCy has been, for a while, one of the industry default approaches for NER, however, recently the LLM models have started showing quite a considerable improvement and have become the subject of a social media and news hype.
To do this work, we first identify 13 publicly listed companies that have a Wikipedia page, and extract the summary part of the Wikipedia page as pure text. The data set is described below in table 1.
| Company Name | Wikipedia Page ID111The Wikipedia Page ID can be obtained by navigating to the Wikipedia page for the company, then clicking on Tools Page Information. It can also be done automatically using a computer language script such as python and the Wikipedia API, e.g., one can map a company name to a Wikipedia Page ID, or a Wikipedia Page ID to the actual full URL of the Wikipedia page, among many other mappings. | Summary length (words) |
|---|---|---|
| Apple Inc. | 856 | 437 |
| International Business Machines Corporation | 40379651 | 452 |
| Iridium Communications Inc. | 53008 | 102 |
| Honda Motor Co., Ltd. | 13729 | 248 |
| Nestlé S.A. | 160227 | 298 |
| TOTAL SE | 804161 | 127 |
| HSBC Holdings plc | 322572 | 283 |
| BioNTech SE | 64671486 | 215 |
| Garmin Ltd. | 1118198 | 86 |
| ASUSTeK Computer Inc. | 43591321 | 167 |
| Sociedad Química y Minera de Chile S.A. | 7290045 | 48 |
| Colliers International Group Inc. | 23080364 | 102 |
| Reliance Power Limited | 15232287 | 179 |
We have kept the above Wikipedia data set download frozen as of 7 June 2023, for consistency and to be able to reproduce results. For compatibility with the use of the GPT 3.5 template we also remove any page breaks or newlines, and normalize all non-English accentuation, so e.g., “…Nescafé…” becomes “…Nescafe…”. We also simply removed any non-ASCII codes555ASCII stands for American Standard Code for Information Interchange. We used just the basic 95 printable characters.. A typical example of the company summary is copied below for “Apple Inc.”, including the products and services which were annotated666The process of annotation, within the context of NLP, is to assign a type or entity class to a word or small sequence of words, e.g., to assign the entity of place, date, currency to words within a text. Note that we use the same entity – PRODUCT – for both product and services, for simplicity. by hand by us, and we have marked those by bold font for clarity777For an example of another annotated corpus that can be used for product extraction see e.g., Schön et al. (2020)..
Apple Inc. is an American multinational technology company headquartered in Cupertino, California. Apple is the world’s largest technology company by revenue, with US$394.3 billion in 2022 revenue. As of March 2023, Apple is the world’s biggest company by market capitalization. As of June 2022, Apple is the fourth-largest personal computer vendor by unit sales and the second-largest mobile phone manufacturer in the world. It is one of the Big Five American information technology companies, alongside Alphabet, Amazon, Meta Platforms, and Microsoft. Apple was founded as Apple Computer Company on April 1, 1976, by Steve Wozniak, Steve Jobs and Ronald Wayne to develop and sell Wozniak’s Apple I personal computer. It was incorporated by Jobs and Wozniak as Apple Computer, Inc. in 1977. The company’s second computer, the Apple II, became a best seller and one of the first mass-produced microcomputers. Apple went public in 1980 to instant financial success. The company developed computers featuring innovative graphical user interfaces, including the 1984 original Macintosh, announced that year in a critically acclaimed advertisement called 1984. By 1985, the high cost of its products, and power struggles between executives, caused problems. Wozniak stepped back from Apple and pursued other ventures, while Jobs resigned and founded NeXT, taking some Apple employees with him. As the market for personal computers expanded and evolved throughout the 1990s, Apple lost considerable market share to the lower-priced duopoly of the Microsoft Windows operating system on Intel-powered PC clones (also known as Wintel). In 1997, weeks away from bankruptcy, the company bought NeXT to resolve Apple’s unsuccessful operating system strategy and entice Jobs back to the company. Over the next decade, Jobs guided Apple back to profitability through a number of tactics including introducing the iMac, iPod, iPhone and iPhone to critical acclaim, launching the Think different campaign and other memorable advertising campaigns, opening the Apple Store retail chain, and acquiring numerous companies to broaden the company’s product portfolio. When Jobs resigned in 2011 for health reasons, and died two months later, he was succeeded as CEO by Tim Cook. Apple became the first publicly traded U.S. company to be valued at over $1 trillion in August 2018, then at $2 trillion in August 2020, and at $3 trillion in January 2022. As of April 2023, it was valued at around $2.6 trillion. The company receives criticism regarding the labor practices of its contractors, its environmental practices, and its business ethics, including anti-competitive practices and materials sourcing. Nevertheless, the company has a large following and enjoys a high level of brand loyalty. It has also been consistently ranked as one of the world’s most valuable brands.888From Apple Wikipedia page, extracted and cached on 7 June 2023. Any spelling or grammar errors were not corrected, neither any attempt was made to make the English (American versus British spelling) consistent, i.e., the texts were used as sourced from Wikipedia.
The annotation process is, obviously, quite subjective, it depends on what one considers to be products or services999There are some publicly available databases of product/services such as the Nice Agreement lists (Roberts, 2012) and the United Nations Standard Products and Services Code (UNSPSC) (Fairchild and de Vuyst, 2002), but given the small amount of examples to annotate, we decided to just do it by hand.. However, we tried to be as consistent as possibly within the data set, e.g., assigning both singular and plural versions of words, such as the above “computer” and “computers” entities.
For the base standard NER cases, we have annotated the company summaries from Wikipedia and used spaCy models101010We used python spaCy version 3.5.3, the latest as of 7 June 2023, and we have noted and verified that although different version of spaCy and its trained models would give slightly different results, the qualitative conclusions would remain the same. We have used as a template for our spaCy python code some of the approaches in Landstein (2020b, a). with 100 learning steps111111And mini batch size = 1., no drop-out121212Drop-out is used in machine learning to avoid the neural network over-fitting the training data, and is implemented by randomly omitting certain neurons at each learning step. and the neural network optimizer algorithm being the Adam Optimizer (Kingma and Ba, 2014) as it is the default setting in spaCy. We have used the empty English model ’en’, and the built-in spaCy ’sm’ (small), ’md’ (medium) and ’lg’ (large) models. These three latter models we have implemented with transfer learning (Yosinski et al., 2014), that is, we have taken already trained standard models and fine-tuned with extra examples, which is called transfer learning (for an application of transfer learning in another setting, see e.g., Covas, 2020). For the GPT model, we used OpenAI’s GPT 3.5 (gpt-3.5-turbo model as of 7 June 2023), which has been trained on web data with a cut-off of September 2021.
Named entity recognition with GPT does not work the same way as in spaCy, since the former is a large language model (LLM), that is, a very large neural network model trained on extremely large set of unstructured texts, in non-supervised way, and in simplified terms, able to predict the next word(s) in a conversation from a prompt or template, while the latter uses supervised learning with a training set that has been labelled or annotated, that is, NER in spaCy is tuned using texts where one tells the neural network what are the types or entities and what words or small sequences of words have those types or entities. Therefore, to further “train” GPT 3.5 for our NER product extraction task one must introduce a text format template, so that GPT could recognize that there was a specific format to the input training cases and a specific output format too131313We adapted our GPT text input/output template from the template in the online article published in Chowdhury (2023).. The format of the template can be anything one wants, if it is very clear where the examples are – so there has to be a clear separation, and a clear fixed format for the product/services list. Below we show an example of this GPT template, using “Apple Inc.” as the sole training example:
Entity Definition: 1. PRODUCT: Short name or full name of product or services sold.
Output Format: {{’PRODUCT’: [list of entities present]}} If no entities are presented in any categories keep it None
Examples:
1. Sentence: Apple Inc. is an American multinational technology company headquartered in Cupertino, California. Apple is the world’s largest technology company by revenue, with US$394.3 billion in 2022 revenue. As of March…
Output: {{’PRODUCT’: [’mobile phone’, ’personal computer’, ’computer’, ’microcomputers’, ’Macintosh’, ’iMac’, ’iPod’, ’iPhone’, ’iPad’]}}
For each example added to the template, we increased the enumeration, from 1 onwards. For inference or prediction rather than training, we just use an empty ‘‘Output: {{’PRODUCT’: []}}’’ product set. We note that the GPT model available in OpenAI always has some randomness in it, and one cannot therefore obtain the same exact output with two identical inputs141414See e.g., the description of this non-determinism behaviour in https://platform.openai.com/docs/guides/gpt/faq.. Nonetheless, we have verified that the conclusions derived from the GPT models were robust to this kind of built-in randomness151515As described in OpenAI’s chat completion API in https://platform.openai.com/docs/api-reference/completions.. In order to be able to assess the performance of GPT versus the base NER models, we used a confusion or error matrix and the F-score (see e.g., Olson and Delen, 2008; Powers, 2011), as it is standard in the industry. We first calculated the relevant elements of the confusion matrix, the number of true positives (TP), i.e., the number of predicted product/services that we had in advance classified by hand as real product/services, the number of false positives (FP), i.e., the number of predicted product/services that we had in advance classified as not product/services and the number of false negatives (FN), i.e., the number of in advance classified as product/services that the predicted set did not contain. The precision and recall, and the traditional (or balanced) F-score (which is defined as the harmonic mean of the precision and the recall) can then be formulated (see p. 138 in Olson and Delen, 2008) as:
| (1) |
| (2) |
| (3) |
where the precision measures the portion of relevant product/services within the predicted set, and recall the portion of relevant product/services within the benchmark annotated set that were predicted. The F-score then measures the overall performance of the predictors. We notice that we do not consider, for the counting of TP, FP and FN, any case where the entity for the word is “O”, that is, in NER speak, a non-entity. This is because, as it is rare to have a product/service word in the text, if we counted a prediction of non-entity, that has been annotated as a non-entity, as a true positive, then the performance would be artificially high – one would need just to predict that everything is a non-entity, and that there was no product/services in the text, to get a high score, which is not what we are aiming for, obviously.
The data set, as standard in machine learning models, is divided into a training and test sets, randomly, across all combinations. The training set within the spaCy models consists of annotated by hand texts while for the GPT model consists of the template with the text plus a clearly demarcated set of product/services.
We have focused on a very small set of companies161616There is, worldwide, an estimated 328+ million companies (as of 2021) according to Statista (2023). Of those, an estimated re public companies (as of Q1 2022) according to The World Federation of Exchanges (2022). From those listed companies, not all have an explicit company’s page in Wikipedia. By using the company name and the Wikipedia page ID, we have identified at least ublic companies with a Wikipedia page, for which we extracted the summary, to be used in the out-of-sample testing and in the building of example peer groups for our (annotated set) of 13 companies. mainly for 3 reasons. First, and foremost, GPT from OpenAI is not a free product, it is a commercial product, with a very limited free trial171717Limited in time, number of runs and number of words/tokens.. Second, we wanted to try to perform few-shot learning for named entity recognition (see e.g., Huang et al., 2021), as annotation is expensive and time consuming. Third, GPT from OpenAI, in its current configuration only allows a maximum of 4096 (gpt-3.5) and gpt-3.5-turbo-16k) tokens181818The operation of tokenization transforms a sentence or text into a set or list of tokens, demarcations of groups of characters, usually words. or words for each run, and this seriously impairs the ability to run a larger number of training examples. Fourth, and finally, the results, as we shall see later, were already quite good with a few training examples. So, we have first trained/tested on 13 fully annotated examples, and then used a much larger list of around ublicly listed companies for which we could find a Wikipedia Page ID and therefore a Wikipedia page with a summary text191919We note that many of these companies Wikipedia pages have extra structured information, such as the industry classification, the main exchange ticker, even the product/services themselves. However, not all have them, and the format can vary a lot, making it very difficult to extract these data elements uniformly. The summary, by contract, is present in almost all companies’ Wikipedia websites..
The first result we have noticed is that even with no examples (zero examples in the template, so a case of the so-called zero-shot learning (see e.g., Wei et al., 2021)), GPT was able, straight out of the “box”, to predict quite a few product/services. As an example, for the company “Sociedad Química y Minera de Chile S.A”, we can see below that it predicts quite well (below, the “set product benchmark” is our own annotation, while “predicted set product from GPT” are the results from GPT 3.5).
Sociedad Quimica y Minera de Chile (SQM) is a Chilean chemical company and a supplier of plant nutrients, iodine, lithium and industrial chemicals. It is the world’s biggest lithium producer.SQM’s natural resources and its main production facilities are located in the Atacama Desert in Tarapaca and Antofagasta regions.
set product benchmark [’iodine’, ’plant nutrients’, ’chemical’, ’industrial chemicals’, ’lithium’]
predicted set product from GPT {{’PRODUCT’: [’plant nutrients’, ’iodine’, ’lithium’, ’industrial chemicals’]}}
f_score=0.88
The second result was that GPT does not seem to confuse the product / services that the company has with the market for what the product / services is meant for. For example, for the company “Garmin Ltd”, on a GPT run with 3 training examples, it extracted the following words as product/services:
…Schaffhausen, Switzerland.The company specializes in GPS technology for automotive, aviation, marine, outdoor, and sport activities. Due to their development …
It marked the “GPS technology” as the correct annotated product/service, and ignored correctly the words “automotive”, “aviation”, “marine”, “outdoor”, and “sport”. We suspect that it understands (via its statistical probability model) that the word “for” means the “market of”, rather than the product/service itself. This was quite impressive compared to the base spaCy model, which can return e.g., “aviation”, “activity tracker”, “marine”, “GPS technology”, “automotive”, ’smartwatch consumer”, getting confused between product/services and their respective markets.
A further result we were surprised to see was that GPT was able to disambiguate some text such as “…property and asset management …” (for company “Colliers”) into two product/services: “property management”, and “asset management”. This would be quite impressive for a human to do it, but for GPT to be able to do this, although not in every single run/example, was quite surprising.
Our main result is the direct comparison of the performance of the base spaCy models, representing a standard form of doing NER, with the GPT LLM models. We have run the empty English model ’en’, and the built-in spaCy ’sm’ (small), ’md’ (medium) and ’lg’ (large) models, against OpenAI’s GPT (gpt-3.5-turbo) for the number of training examples from 0 to 9. The results of the F-score, our standard measure of performance, are depicted below in Figure 1.
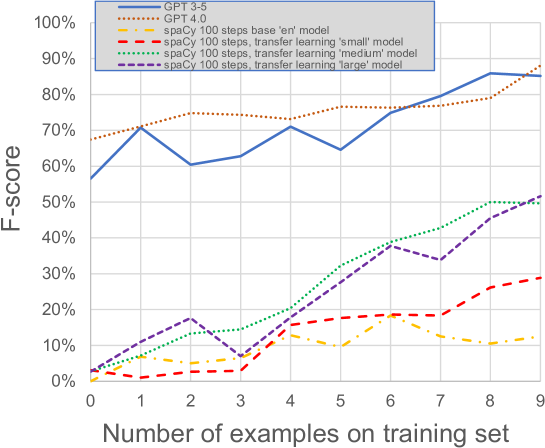
The results show that the GPT model clearly outperforms the standard spaCy models, by quite a large margin, consistently, across all the parameter space depicted, i.e., the number of examples within the training set. The best averaged result was around for the GPT model, which indicates that the GPT model can probably already be used for real world cases, that is, to obtain comparable companies peer groups in equity valuation. We have stress tested both the GPT and the spaCy models extensively, and concluded that both models’ results were quite robust, with the value of the F-score barely changing for different parameter model changes202020For the GPT model we have stress tested using lower case for all text and product/services, changing the random seed, changing the “temperature” parameter which controls the randomness of GPT output, fine tuning the parameters “max_tokens”, “top_p”, “presence_penalty” and “frequency_penalty” (for the GPT OpenAI parameter API reference see OpenAI, 2023). We also tested adding empty texts with empty product/services sets to avoid the so-called LLM hallucination problem (Lee, 2023) but saw no clear improvement. For the spaCy models we have stressed tested also several parameters, such as using lower case for all text and product/services, the number of iterations of the learning algorithm, the “dropout” rate, which allows for some randomness and generalization, the optimization algorithm itself, the parameters of the Adam algorithm such as “learn_rate”, “beta1”, “beta2”, “eps”, “L2”, “L2_is_weight_decay”, “grad_clip” (see spaCy API reference in spaCy, 2023)..
In order to be able to use the results for constructing company’s comparable or peer groups, one more step was needed, that is, to use a much larger set of out-of-sample data212121Out-of-sample data is a set of data the machine learning models have not seen, and are not annotated, so on that data we can only do a prediction using the trained model on what the product/services should be. and find which companies are closest, in the sense of having the highest number of same product / services. This data set is described below in table 2.
| Out-of-sample companies data set statistics | |
|---|---|
| Number of public companies with Wikipedia page | 3890 |
| Number of above companies that had a summary page | 3887 |
| Number of above companies that GPT could extract at least one product/service | 3800 |
| Average number of words or tokens on each summary page | 108 |
In order to obtain comparable companies for the companies in our annotated set, first we trained GPT with all 13 companies in the training template222222We note that for gpt-3.5-turbo the maximum number of tokens is exceeded when using all 13 companies in the annotated set. Therefore, we had no choice but to use gpt-3.5-turbo-16k which is even more expensive that gpt-3.5-turbo but has the same LLM model and allows four times the number of tokens.. We have decided, given the cost of GPT and the results we had already obtained, i.e., that most extra parameters do not seem to improve the performance, to just use GPT (gpt-3.5-turbo-16k) with its default settings. Below we show a couple of examples of what the results can be.
| Comparable company | Page ID | Product/services match | Count |
|---|---|---|---|
| Chevron Corporation | 284749 | [’gas’, ’energy’, ’power generation’, ’refining’, ’oil’] | 5 |
| China Petroleum & …… | 1325529 | [’gas’, ’natural gas’, ’refining’, ’oil’, ’crude oil’] | 5 |
| Sinopec Oilfield … | 1325529 | [’natural gas’, ’gas’, ’crude oil’, ’oil’] | 4 |
| Pilipinas Shell … | 23409980 | [’gas’, ’power generation’, ’chemicals’, ’oil’] | 4 |
| BP p.l.c. | 18998720 | [’refining’, ’gas’, ’oil’, ’power generation’] | 4 |
| NextEra Energy, Inc. | 28014927 | [’natural gas’, ’oil’, ’energy’] | 3 |
| Indian Oil … | 47428211 | [’natural gas’, ’refining’, ’oil’] | 3 |
| Hess Corporation | 2086678 | [’natural gas’, ’energy’, ’crude oil’] | 3 |
| BP Prudhoe Bay … | 15366815 | [’natural gas’, ’oil’, ’crude oil’] | 3 |
| Santos Limited | 1140903 | [’natural gas’, ’gas’, ’oil’] | 3 |
On table 3 we can see that the results seem, qualitatively, quite good. All companies identified as within the peer group are energy companies, with similar product/services.
| Comparable company | Wikipedia Page ID | Product/services match | Count |
|---|---|---|---|
| UrtheCast Corp. | 32320197 | [’satellites’] | 1 |
| Mitsubishi Electric Corporation | 1075261 | [’satellites’] | 1 |
| China Satellite Communications Co. | 54647879 | [’satellites’] | 1 |
| Raytheon Technologies Corporation | 63554945 | [’satellites’] | 1 |
| The Boeing Company | 18933266 | [’satellites’] | 1 |
| Hexcel Corporation | 8207797 | [’satellites’] | 1 |
| China Unicom (Hong Kong) Limited | 451805 | [’data communication’] | 1 |
| SES S.A. | 2415553 | [’satellites’] | 1 |
| NTT DOCOMO, INC. | 374039 | [’satellite’] | 1 |
| Semtech Corporation | 8484883 | [’satellites’] | 1 |
On table 4 we can see what happens when a company with a more niche market, such as Iridium, which trades on satellite communications is used as a target company for which to find a peer group. The number of word matches is much lower (mostly related to the word/token “satellite”) and therefore the quality decreases. Nonetheless, it is still qualitatively a reasonable peer group232323We note that our method of selecting the number or count of product/services that two companies share can be used to create a company network, as described in Fan et al. (2019). In their paper, they build a company network based on the similarity of products using filing (texts) of USA listed firms in SEC. They claim that the probability distribution function of the edge (links) strength between companies follows an exponential law. However, we found that in our case a power law , where is the strength or count of common product/services, was a better fit.. Therefore, the results seem to show that this method could be used for creating companies’ comparable peer groups, and that the results seem reasonably good.
We have used Wikipedia data as we wanted to use exclusively publicly available web-based data. However, if one would could use the data sets from commercial data providers such as S&P, Bloomberg, FactSet, Reuters or others (see e.g., Jha, 2019, and reference therein), it would allow to build a company’s peer group automatically for all public (and private companies). Therefore, this would then industrialize one of the last elements of a company valuation pipeline to be automated. We have used ompanies, which was what we could find manually on Wikipedia, but we note that commercial data providers have clean, curated and structured data for all publicly listed companies and a large number of the private companies as well. We also emphasise that doing the data analysis on all public companies and implementing a full peer group selection using GPT would imply quite a monetary cost, likely to only be able to be sponsored by a commercial fintech or investment banking house, as the usage would exceed easily what can be done with research based GPT free trials and research budgets.
Finally, we note that in the future we plan to use a company valuation model from e.g., a software house specializing in valuation, to be able to prove that the product/services obtained from GPT text-based NER can be used to create a better company peer groups with more accurate valuations (e.g., as compared with the average stock market price derived valuation). However, given the number of companies worldwide, any kind of large-scale usage of our approach would require some investment, as GPT from OpenAI is currently not free and is therefore expensive for any larger than small research projects utilization.
3 Conclusion
Using companies’ description/summaries from publicly available Wikipedia data, we have shown quantitatively that using large language models (LLMs) such as GPT, results in a much higher performance and success rate than standard named entity recognition (NER) which uses manual annotation and systems such as spaCy. We have shown this in the specific case of product/services entity extraction. Furthermore, we shown, qualitatively, that this entity extraction by GPT models can be used to create companies’ peer groups that look reasonable and consistent. This is suggestive that these LLM models could, in the future, be used for helping the automation of companies’ peer group construction, and therefore the full automation of the company valuation pipeline.
Declarations
-
•
Funding: The author and this research was fully self-funded by the author.
-
•
Conflict of interest/Competing interests: None
-
•
Availability of data and materials: All data sets used were from publicly available websites on the Internet (including Wikipedia) and their sources are referenced/cited in the text.
References
- Berkman et al. (2000) Henk Berkman, Michael E Bradbury, and Jason Ferguson. The accuracy of price-earnings and discounted cash flow methods of IPO equity valuation. Journal of International Financial Management & Accounting, 11(2):71–83, 2000.
- Berry et al. (2019) Michael W Berry, Azlinah Mohamed, and Bee Wah Yap. Supervised and unsupervised learning for data science. Springer, 2019.
- Bhojraj et al. (2003) Sanjeev Bhojraj, Charles MC Lee, and Derek K Oler. What’s my line? A comparison of industry classification schemes for capital market research. Journal of accounting research, 41(5):745–774, 2003.
- Black (1986) Fischer Black. Noise. The journal of finance, 41(3):528–543, 1986.
- Breitung and Müller (2023) Christian Breitung and Sebastian Müller. Global business similarity networks. Available at SSRN, 2023.
- Brown et al. (2020) Tom Brown, Benjamin Mann, Nick Ryder, Melanie Subbiah, Jared D Kaplan, Prafulla Dhariwal, Arvind Neelakantan, Pranav Shyam, Girish Sastry, Amanda Askell, et al. Language models are few-shot learners. Advances in neural information processing systems, 33:1877–1901, 2020.
- Chowdhury (2023) Sourajit Roy Chowdhury. Zero-shot named entity recognition using openai chatgpt api, Mar 2023. URL https://sourajit16-02-93.medium.com/zero-shot-named-entity-recognition-using-openai-chatgpt-api-46738191f375.
- Covas (2020) Eurico Covas. Transfer learning in spatial–temporal forecasting of the solar magnetic field. Astronomische Nachrichten, 341(4):384–394, 2020.
- Damodaran (2012) Aswath Damodaran. Investment valuation: Tools and techniques for determining the value of any asset. John Wiley & Sons, 2012.
- De Franco et al. (2015) Gus De Franco, Ole-Kristian Hope, and Stephannie Larocque. Analysts’ choice of peer companies. Review of Accounting Studies, 20:82–109, 2015.
- Eaton et al. (2022) Gregory W Eaton, Feng Guo, Tingting Liu, and Micah S Officer. Peer selection and valuation in mergers and acquisitions. Journal of Financial Economics, 146(1):230–255, 2022.
- Fairchild and de Vuyst (2002) Alea M Fairchild and Bruno de Vuyst. Coding standards benefiting product and service information in e-commerce. In Proceedings of the 35th Annual Hawaii International Conference on System Sciences, pages 3201–3208. IEEE, 2002.
- Fama (1995) Eugene F Fama. Random walks in stock market prices. Financial analysts journal, 51(1):75–80, 1995.
- Fan et al. (2019) Jingfang Fan, Keren Cohen, Louis M Shekhtman, Sibo Liu, Jun Meng, Yoram Louzoun, and Shlomo Havlin. Topology of products similarity network for market forecasting. Applied Network Science, 4(1):1–15, 2019.
- Hoberg and Phillips (2016) Gerard Hoberg and Gordon Phillips. Text-based network industries and endogenous product differentiation. Journal of Political Economy, 124(5):1423–1465, 2016.
- Honnibal and Montani (2017) Matthew Honnibal and Ines Montani. spaCy 2: Natural language understanding with Bloom embeddings, convolutional neural networks and incremental parsing. To appear, 2017.
- Huang et al. (2021) Jiaxin Huang, Chunyuan Li, Krishan Subudhi, Damien Jose, Shobana Balakrishnan, Weizhu Chen, Baolin Peng, Jianfeng Gao, and Jiawei Han. Few-shot named entity recognition: an empirical baseline study. In Proceedings of the 2021 conference on empirical methods in natural language processing, pages 10408–10423, 2021.
- Huddart et al. (2009) Steven Huddart, Mark Lang, and Michelle H Yetman. Volume and price patterns around a stock’s 52-week highs and lows: Theory and evidence. Management Science, 55(1):16–31, 2009.
- Inselbag and Kaufold (1997) Isik Inselbag and Howard Kaufold. Two DCF approaches for valuing companies under alternative financing strategies (and how to choose between them). Journal of applied corporate finance, 10(1):114–122, 1997.
- Jha (2019) Vinesh Jha. Implementing alternative data in an investment process. Big data and machine learning in quantitative investment, page 51, 2019.
- Kaustia and Rantala (2021) Markku Kaustia and Ville Rantala. Common analysts: method for defining peer firms. Journal of financial and quantitative analysis, 56(5):1505–1536, 2021.
- King (1966) Benjamin F King. Market and industry factors in stock price behavior. the Journal of Business, 39(1):139–190, 1966.
- Kingma and Ba (2014) Diederik P. Kingma and Jimmy Ba. Adam: A Method for Stochastic Optimization. arXiv e-prints, art. arXiv:1412.6980, December 2014.
- Knudsen et al. (2017) Jens Overgaard Knudsen, Simon Kold, and Thomas Plenborg. Stick to the fundamentals and discover your peers. Financial Analysts Journal, 73(3):85–105, 2017.
- Landstein (2020a) Eric Landstein. Product-named-entity-recognition, 2020a. URL https://github.com/Landstein/Product-Named-Entity-Recognition/blob/master/.ipynb_checkpoints/Model%202%20-checkpoint.ipynb.
- Landstein (2020b) Eric Landstein. Build a custom named entity recognition model using spaCy, Mar 2020b. URL https://medium.com/swlh/build-a-custom-named-entity-recognition-model-ussing-spacy-950bd4c6449f.
- Lee et al. (2016) Charles Lee, Paul Ma, and Charles CY Wang. The search for peer firms: When do crowds provide wisdom? Harvard Business School Accounting & Management Unit Working Paper, 15-032:14–46, 2016.
- Lee et al. (2015) Charles MC Lee, Paul Ma, and Charles CY Wang. Search-based peer firms: Aggregating investor perceptions through internet co-searches. Journal of Financial Economics, 116(2):410–431, 2015.
- Lee (2023) Minhyeok Lee. A mathematical investigation of hallucination and creativity in GPT models. Mathematics, 11(10):2320, 2023.
- Liu et al. (2002) Jing Liu, Doron Nissim, and Jacob Thomas. Equity valuation using multiples. Journal of Accounting Research, 40(1):135–172, 2002.
- Liu (2020) Tingting Liu. The information provision in the corporate acquisition process: Why target firms obtain multiple fairness opinions. The Accounting Review, 95(1):287–310, 2020.
- Manigart et al. (2000) Sophie Manigart, Koen De Waele, Mike Wright, Ken Robbie, Philippe Desbrières, Harry Sapienza, and Amy Beekman. Venture capitalists, investment appraisal and accounting information: a comparative study of the USA, UK, France, Belgium and Holland. European Financial Management, 6(3):389–403, 2000. doi: https://doi.org/10.1111/1468-036X.00130.
- Nel (2015) WS Nel. An optimal peer group selection strategy for multiples-based modelling in the south african equity market. Journal of Economics and Behavioral Studies, 7(3 (J)):30–46, 2015.
- Olson and Delen (2008) David L Olson and Dursun Delen. Advanced data mining techniques. Springer Science & Business Media, 2008.
- OpenAI (2023) OpenAI. Openai api, 2023. URL https://platform.openai.com/docs/api-reference/chat.
- Phillips and Ormsby (2016) Ryan L Phillips and Rita Ormsby. Industry classification schemes: An analysis and review. Journal of Business & Finance Librarianship, 21(1):1–25, 2016.
- Powers (2011) David Powers. Evaluation: From Precision, Recall and F-Measure to ROC, Informedness, Markedness & Correlation. Journal of Machine Learning Technologies, 2(1):37–63, 2011.
- Radford et al. (2018) Alec Radford, Karthik Narasimhan, Tim Salimans, Ilya Sutskever, et al. Improving language understanding by generative pre-training. to be submitted, 2018.
- Roberts (2012) Jessie N Roberts. International trademark classification: a guide to the Nice Agreement. Oxford University Press, 2012.
- Schön et al. (2020) Saskia Schön, Veselina Mironova, Aleksandra Gabryszak, and Leonhard Hennig. A corpus study and annotation schema for named entity recognition and relation extraction of business products. arXiv preprint arXiv:2004.03287, 2020.
- spaCy (2023) spaCy. Library architecture - spaCy api documentation, 2023. URL https://spacy.io/api.
- Sprenger and Welpe (2011) Timm O Sprenger and Isabell M Welpe. Tweets and peers: defining industry groups and strategic peers based on investor perceptions of stocks on twitter. Algorithmic Finance, 1(1):57–76, 2011.
- Statista (2023) Statista. Global companies 2021, Jun 2023. URL https://www.statista.com/statistics/1260686/global-companies/.
- The World Federation of Exchanges (2022) The World Federation of Exchanges. Number of listed companies, 2022. URL https://focus.world-exchanges.org/articles/number-listed-companies.
- Wei et al. (2021) Jason Wei, Maarten Bosma, Vincent Y Zhao, Kelvin Guu, Adams Wei Yu, Brian Lester, Nan Du, Andrew M Dai, and Quoc V Le. Finetuned language models are zero-shot learners. arXiv preprint arXiv:2109.01652, 2021.
- Yosinski et al. (2014) Jason Yosinski, Jeff Clune, Yoshua Bengio, and Hod Lipson. How transferable are features in deep neural networks? In Proceedings of the 27th International Conference on Neural Information Processing Systems - Volume 2, NIPS’14, pages 3320–3328, Cambridge, MA, USA, 2014. MIT Press. URL http://dl.acm.org/citation.cfm?id=2969033.2969197.