A massive hot Jupiter orbiting a metal-rich early-M star discovered in the TESS full frame images
Abstract
Observations and statistical studies have shown that giant planets are rare around M dwarfs compared with Sun-like stars. The formation mechanism of these extreme systems remains under debate for decades. With the help of the TESS mission and ground based follow-up observations, we report the discovery of TOI-4201b, the most massive and densest hot Jupiter around an M dwarf known so far with a radius of and a mass of , about 5 times heavier than most other giant planets around M dwarfs. It also has the highest planet-to-star mass ratio () among such systems. The host star is an early-M dwarf with a mass of and a radius of . It has significant super-solar iron abundance ([Fe/H]= dex). However, interior structure modeling suggests that its planet TOI-4201b is metal-poor, which challenges the classical core-accretion correlation of stellar-planet metallicity, unless the planet is inflated by additional energy sources. Building on the detection of this planet, we compare the stellar metallicity distribution of four planetary groups: hot/warm Jupiters around G/M dwarfs. We find that hot/warm Jupiters show a similar metallicity dependence around G-type stars. For M dwarf host stars, the occurrence of hot Jupiters shows a much stronger correlation with iron abundance, while warm Jupiters display a weaker preference, indicating possible different formation histories.
1 Introduction
As the most abundant stellar population in our Milky Way (Henry et al., 2006), M dwarfs are popular targets for exoplanet research. The Kepler mission (Borucki et al., 2010) has revealed that early-M stars host close-in small planets about 3 times more frequent than Sun-like stars (Petigura et al., 2013; Dressing & Charbonneau, 2013, 2015; Gaidos et al., 2016). At the same time, however, recent work from Gan et al. (2023) found that hot Jupiters (defined as orbital period days, radius ) are depleted around early-M dwarfs with an occurrence rate of (see also Bryant et al., 2023), in contrast to the frequency around FGK stars (e.g., Fressin et al., 2013; Petigura et al., 2018; Zhou et al., 2019; Beleznay & Kunimoto, 2022). This difference is even more significant if comparing with the result % around FGK stars from radial velocity (RV) surveys (e.g., Mayor et al., 2011; Cumming et al., 2008; Wright et al., 2012; Wittenmyer et al., 2020).
The rarity of giant planets around M dwarfs is probably a natural outcome of the core accretion planet formation mechanism (Pollack et al., 1996). Under this hypothesis, the low mass of the protoplanetary disk around a low-mass star makes it difficult to form a massive enough solid core to start runaway gas accretion before disk dissipation (Laughlin et al., 2004; Ida & Lin, 2005; Kennedy & Kenyon, 2008). Indeed, several simulation works based on this paradigm reported a similar increasing trend of hot Jupiter occurrence rate as the stellar mass going up from 0.5 towards 1 (e.g., Liu et al., 2019; Burn et al., 2021). In addition, some initial studies found that most confirmed hot Jupiters are orbiting metal-rich M dwarfs with a median metallicity around 0.3 dex, which is higher than that of Sun-like stars harboring gas giants (Gan et al., 2022a; Kanodia et al., 2022; Kagetani et al., 2023). This is also supposed to be evidence in line with the core accretion scenario as the stellar metallicity is generally correlated with the mass of solids in the protoplanetary disk that are available for forming planets (Santos et al., 2004; Fischer & Valenti, 2005; Sousa et al., 2011; Wang et al., 2018). In turn, the core accretion framework probably simultaneously explains the fact that small planets are common around M dwarfs because a forming outer giant planet around an FGK star may suppress the formation of close-in super-Earths due to the cut-off of the inward flow of solids (Mulders et al., 2021).
On the other hand, there are still two relevant types of planetary systems that remain challenging for core accretion. The first population is gas giants around mid-to-late M dwarfs which theoretical works do not expect to form directly (e.g., Liu et al., 2019; Burn et al., 2021), unless a massive core was first formed through, for example, planet-planet collisions (Frelikh et al., 2019). Nevertheless, a few such systems were recently discovered (Morales et al., 2019; Hobson et al., 2023; Kanodia et al., 2023; Kagetani et al., 2023). Additionally, Bryant et al. (2023) also reported an occurrence rate of about 0.1% for hot Jupiters orbiting stars with , indicating that they are not vanishingly rare. Another group is cold Jupiters around M dwarfs. In particular, gas giants beyond the ice line are frequently discovered through the microlensing method (Mao & Paczynski, 1991; Suzuki et al., 2016). By comparing the observations and predictions from planet population synthesis models, Schlecker et al. (2022) suggested that core accretion theories cannot reproduce the RV-detected giant planets around M dwarfs. Moreover, cold gas giants around M dwarfs detected by RV surveys show a much weaker metallicity dependence compared with hot Jupiters (Gan et al., 2022a), which hints that they follow a different formation path. In these cases, gravitational instability probably plays a role (Boss, 2000).
The TESS (Transiting Exoplanet Survey Satellite; Ricker et al., 2015) mission, which performs a full-sky photometric survey, has been rapidly increasing the number of gas giants around M dwarfs. Plenty of hot Jupiters have been detected over the last three years (e.g., HATS-71b, Bakos et al. 2020; HATS-74Ab and HATS-75b, Jordán et al. 2022; TOI-3629b and TOI-3714b, Cañas et al. 2022). They have enlarged the sample size of short-period giant planets around M stars by a factor of three. A few warm Jupiters were also reported (e.g., Cañas et al., 2020). All of these findings gradually enable glimpses of their formation and evolution history.
In this manuscript, we report the discovery and confirmation of TOI-4201b, a massive and dense hot Jupiter around an early-M star, which was previously classified as a verified planet candidate by Gan et al. (2023). The rest of the paper is organized as follows. In Section 2, we detail all observations we use to confirm the planetary nature of TOI-4201b. We summarize the stellar properties in Section 3. Section 4 describes the joint-fit analysis to derive the planet parameters. In Section 5, we discuss the interior structure of TOI-4201b, tidal evolution analysis, the prospects for future characterizations as well as the comparison of stellar metallicity distribution of hot/warm Jupiters around G/M stars. We conclude with our findings in Section 6.
2 Observations
2.1 TESS
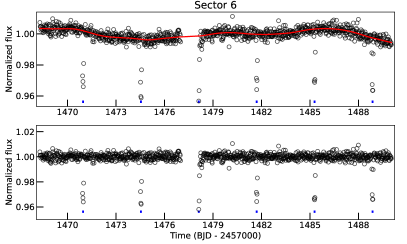
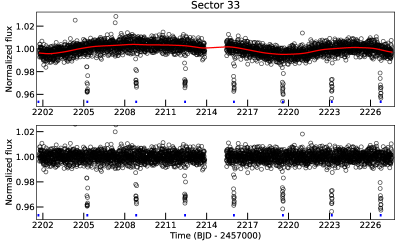
TOI-4201 (TIC 95057860) was first monitored by TESS in Sector 6 between 2018 December 15 and 2019 January 6 with the 30-minute cadence mode, and it was revisited every 10 minutes in Sector 33 from 2020 December 18 to 2021 January 13 during the first extended mission. The full frame images (FFIs) of TOI-4201 from Sector 6 were processed by the Quick Look Pipeline (QLP; Huang et al., 2020a, b; Fausnaugh et al., 2020). Due to the faintness of TOI-4201 (), the light curve was not examined initially because the TESS vetting team only inspects targets with . Its transiting signal was alerted by the QLP faint-star search program (Kunimoto et al., 2022), which searches for planet candidates around dimmer stars with that have QLP light curves.
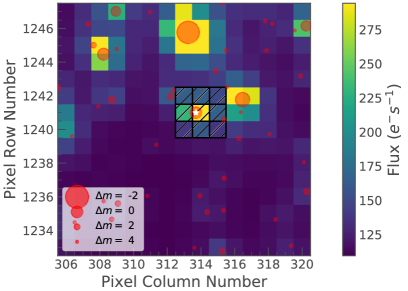
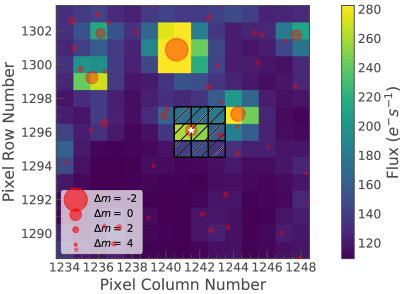
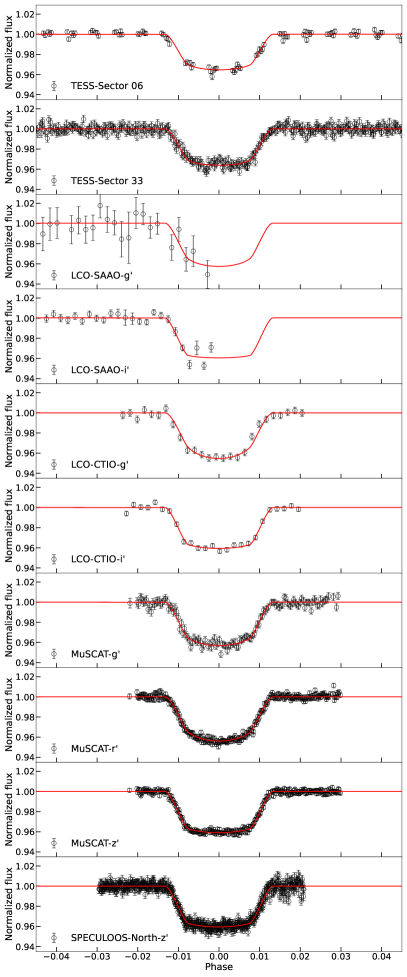
However, we note that the light curve of TOI-4201 from Sector 33 was not produced by QLP. Therefore, we carried out an independent and uniform aperture photometry for both Sectors using the lightkurve package (Lightkurve Collaboration et al., 2018; Barentsen et al., 2019). We first downloaded the pixels FFI cutouts of TOI-4201 from each Sector (see the top panels of Figure 1), and extracted a raw target light curve using a pixel custom aperture, centering at the location of TOI-4201. Next, we excluded a pixel region around the target and constructed a aperture mask to estimate the background flux. In this way, we picked up all pixels with flux smaller than 0.001 times the standard deviation of flux within the overall -pixel region. Finally, we corrected the sky background variation by subtracting the background flux from the raw target flux. We show the light curves we obtained in Figure 1.
Combining all TESS data, we performed a transit search using the Transit Least Squares (TLS; Hippke & Heller 2019) algorithm after smoothing the light curve using a median filter with a window size of 0.3 days. We did not find additional significant periodic signals other than the 3.58-day one from TOI-4201b. After masking out all in-transit data, we fit a Gaussian Process (GP) model with a Matérn-3/2 kernel using celerite (Foreman-Mackey et al., 2017) for the light curve from each Sector. We divided the light curve by the best-fit GP model for detrending and normalization.
2.2 Ground-based photometry
In order to rule out false positive scenarios such as nearby and blended eclipsing binary, and refine the transit ephemeris as well as transit depth measurement, we collected a total of eight ground-based follow-up light curves for TOI-4201, as part of the TESS Follow-up Observing Program (TFOP). We scheduled all observations based on the transit information from the TESS Transit Finder (TTF), which is a customized version of the Tapir software package (Jensen, 2013). We summarize the details of all observations in Table 1, and describe each of them below.
2.2.1 LCOGT
We acquired two SDSS and band alternating time-series observations using 1-meter telescopes from the Las Cumbres Observatory Global Telescope network (LCOGT; Brown et al., 2013). The first partial transit (ingress-only) observation was done at South African Astronomical Observatory (SAAO) on 2021 September 26, while the second one was obtained at Cerro Tololo Interamerican Observatory (CTIO) on 2021 October 4 covering the full event. Both observations were carried out with the Sinistro cameras, which have a field of view of and a plate scale of /pixel. The exposure times of and band observations are 300s and 180s, respectively. After the raw images were calibrated by the automatic BANZAI pipeline (McCully et al., 2018), we conducted a photometric analysis using the AstroImageJ software (Collins et al., 2017) with a 22-pixel () and 16-pixel () aperture for two observations. We confirmed the transit signal on target at the ephemeris provided by TESS.
2.2.2 MuSCAT
We observed a full transit of TOI-4201b on 2022 Jan 30 with MuSCAT using exposure times of 120, 50, 50 s for , , and bands, respectively. MuSCAT is a multi-band simultaneous camera installed on the 188-cm telescope of the National Astronomical Observatory of Japan (NAOJ) in Okayama, Japan (Narita et al., 2015). It has three 1k CCDs each with FOV, enabling simultaneous photometry in the (400–550 nm), (550–700 nm), and (820–920 nm) bands. The data reduction and differential photometry were performed using the pipeline described in Fukui et al. (2011). We optimized both the aperture radii and the set of comparison stars by minimizing the dispersion of the resulting relative light curves. Five comparison stars and aperture radii of 12 pixels (4.2) yield the optimum light curves for all bands.
2.2.3 SPECULOOS-North
We obtained a full transit of TOI-4201 b by the SPECULOOS-North telescope on 2023 February 4 in the Sloan- filter with an exposure time of 20s. SPECULOOS-North is a 1.0-m Ritchey-Chretien telescope equipped with a thermoelectrically cooled 2K2K Andor iKon-L BEX2-DD CCD camera with a pixel scale of and a field-of-view of (Burdanov et al., 2022). It is a twin of the SPECULOOS-South located in ESO-Paranal in Chile (Jehin et al., 2018; Delrez et al., 2018; Sebastian et al., 2021) and SAINT-EX located at the Sierra de San Pedro Mártir in Baja California, México (Demory et al., 2020). Data reduction and photometric measurements were performed using the PROSE111https://github.com/lgrcia/prose pipeline (Garcia et al., 2021). The resulting light curve is presented in Figure 2.
| Obs Date | Telescope | Filter | Pixel Scale (arcsec) | FWHM (arcsec) | # of observations | Coverage |
|---|---|---|---|---|---|---|
| 2021-09-26 | LCO-SAAO | & | 0.39 | 5.1 | 23 & 24 | Ingress |
| 2021-10-04 | LCO-CTIO | & | 0.39 | 3.4 | 26 & 25 | Full |
| 2022-01-30 | MuSCAT | & & | 0.36 | 3.0 | 124 & 301 & 299 | Full |
| 2023-02-04 | SPECULOOS-North | 0.35 | 1.0 | 519 | Full |
2.3 Spectroscopic follow-up
2.3.1 MagE
We obtained medium-resolution optical spectra of TOI-4201 on 2022 October 06 (UT) with the Magellan Echellette (MagE) spectrograph (Marshall et al., 2008) on the 6.5-m Magellan Baade Telescope. Conditions were clear with seeing of , and we observed the target during nautical twilight. We used the 0710 slit to obtain resolution 6000 over 3200–10 000 Å. We collected two, 290-s exposures at an airmass of 1.04. We also observed the spectrophotometric calibrator Feige 110 during the night for flux calibration (Hamuy et al., 1992, 1994), and obtained bias exposures as well as ThAr arc lamp and Xe flash and incandescent flatfield lamp exposures at the start of the night for wavelength and flux calibration, respectively. We did not observe a telluric absorption calibrator for these observations, hence telluric features remain in the spectra. Data were reduced using PypeIt (Prochaska et al., 2020, 2020) using standard settings. The final calibrated spectrum has a median signal-to-noise 100 in the 8000 Å region.
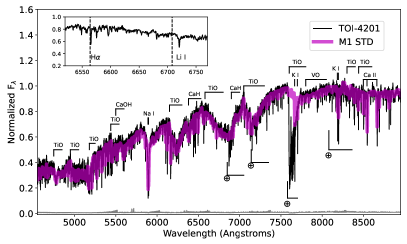
Figure 3 compares the MagE spectrum of TOI-4201 to the best-match spectral template constructed from Sloan Digital Sky Survey data (Bochanski et al., 2007). Note that the template has a lower mean resolution ( 2000), but is nonetheless an excellent match, indicating a dwarf classification. This template match is confirmed by index-based classifications from Reid et al. (1995); Gizis (1997); and Lépine et al. (2003), which span M0.5–M1.5. We therefore adopt a spectral classification of M1.00.5 for this source. Inspection of the data show H in absorption with an equivalent width of 0.4260.017 Å, and no detection of Li I, ruling out a young (10 Myr) source. Using the calibration of Lépine et al. (2013), we measure a metallicity index of 1.1660.008, indicating a slightly supersolar metallicity. The metallicity relation of Mann et al. (2013) yields [Fe/H] = 0.220.20 for this value, where the uncertainty is dominated by systematics among the calibration sample. We conduct a more detailed abundance analysis using the SPIRou data in the following.
2.3.2 SPIRou
We obtained a total of 28 spectroscopic observations for TOI-4201 using SPIRou (SpectroPolarimètre InfraROUge; Donati et al., 2020) between 2022 November 6 and 2023 January 1. SPIRou is a near-infrared high resolution () fiber-fed echelle spectrograph installed on the 3.6m Canada-France-Hawaii Telescope (CFHT), covering a wavelength range from 0.98 to 2.5 m. Since TOI-4201 is a faint target (), instead of taking simultaneous drift calibration with the thermalized Farby-Pérot (FP) etalon, we opted to use the Dark mode to avoid contaminating science spectra. We conducted all of our observations under an environment of airmass around 1.3 and seeing about . Every night, we took two continuous sequences of TOI-4201 at a random phase, with a 1200s exposure time for each one. For our 28 spectra, the median signal-to-noise ratio (SNR) per pixel in the middle of band is about 40.
The SPIRou data were reduced using APERO version 0.7.275 (Cook et al., 2022). The main steps of data reduction are described in the following but readers are referred to Cook et al. (2022) for a complete description of the APERO pipeline and modules. Raw frames (science and calibration) are first pre-processed to remove known structures on the 40964096 detector. Nightly calibration images are taken to locate the echelle orders and to perform a series of corrections (e.g., flat, thermal background, blaze, etc.). The flux is extracted from science and calibration frames to produce per-order spectra. A nightly pixel-to-wavelength solution is derived following the method of Hobson et al. (2021). Finally, a three steps telluric correction is applied to the science data. A first cleaning is done with a TAPAS (Bertaux et al., 2014) atmospheric transmission model. The remaining residuals (percent-level in deep H2O bands) are then fitted in this second step using a grid of telluric models generated from observations of hot stars (fast rotators) with SPIRou covering ranges of airmass and water column. The last step mitigates finite resolution effects, i.e., the fact that deconvolution between stellar+telluric spectrum with instrumental profile is always imperfect (Wang et al., 2022). This telluric correction method yields final residuals at the level of the PCA-based approach of Artigau et al. (2014) and will be described in more details in Artigau et al. in prep.
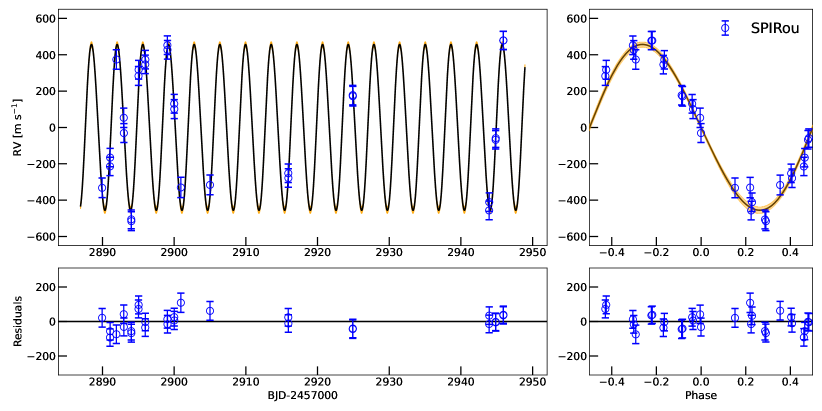
The radial velocity (RV) measurements were obtained from the telluric corrected spectra using the line-by-line (LBL) method of Artigau et al. (2022). In this framework, Doppler shifts are measured on small chunks of the spectrum called ‘lines’ (16,000 lines for an M dwarfs observed with SPIRou) using the Bouchy et al. (2001) formalism. With thousands of independent velocity measurements over the full domain, outlying spectral features are readily identified and removed. This is particularly important in the near-infrared where spurious features introduced by complex detector architecture and imperfect telluric correction can significantly bias RV observations (Artigau et al., 2022). The final RV is obtained from the error-weighted average of all valid per-line velocities. The LBL method enabled the mass detection of several TESS planets with SPIRou in recent years (e.g., TOI-1759 b, Martioli et al. 2022; TOI-2136 b, Gan et al. 2022b; TOI-1452 b, Cadieux et al. 2022; TOI-1695 b, Kiefer et al. 2023). After subtracting the systemic velocity of about 42.1 km s-1, we list the LBL RVs of TOI-4201 in Table 2, which have a median uncertainty of 24 m s-1. As seen in Figure 5, the Doppler signal of the transiting companion is clearly detected.
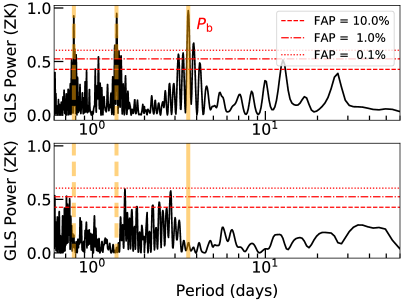
We then performed a generalized Lomb-Scargle (GLS) periodogram (Zechmeister & Kürster, 2009) analysis on the SPIRou RVs (see Figure 4). A significant peak around 3.58 days is detected at the orbital period of the transiting planet TOI-4201b. In addition, another two signals at 0.78 and 1.38 days can be clearly seen in the periodogram. These two signals come from the alias of the orbital period with the window function, which correspond to the frequency of day-1 and day-1. After subtracting the best Keplerian model from the joint-fit (see Section 4), we find that they disappears and no other significant peaks, which may point to the existence of a secondary planet, show up with FAP below 0.1%.
| BJD | RV (m s-1) | (m s-1) |
|---|---|---|
| 2459889.94627 | -343.4 | 29.7 |
| 2459891.05138 | -225.4 | 22.6 |
| 2459891.06557 | -177.0 | 22.8 |
| 2459891.93548 | 362.6 | 28.9 |
| 2459892.96892 | 42.1 | 28.2 |
| 2459892.98312 | -42.1 | 25.4 |
| 2459894.00997 | -516.7 | 24.5 |
| 2459894.02416 | -526.7 | 25.4 |
| 2459895.02960 | 272.1 | 25.2 |
| 2459895.04379 | 306.3 | 25.1 |
| 2459895.96208 | 335.8 | 23.3 |
| 2459895.97627 | 362.0 | 23.1 |
| 2459899.05405 | 441.1 | 24.0 |
| 2459899.06824 | 415.7 | 24.1 |
| 2459900.00510 | 119.1 | 24.5 |
| 2459900.01929 | 89.8 | 26.3 |
| 2459900.93532 | -341.4 | 32.9 |
| 2459904.99832 | -327.4 | 30.0 |
| 2459915.92131 | -263.0 | 23.6 |
| 2459915.93550 | -289.3 | 23.2 |
| 2459924.91005 | 166.7 | 29.1 |
| 2459924.92423 | 160.6 | 29.3 |
| 2459943.93428 | -467.7 | 24.0 |
| 2459943.94847 | -422.0 | 23.6 |
| 2459944.84612 | -79.2 | 23.0 |
| 2459944.86031 | -69.8 | 22.9 |
| 2459945.91587 | 467.0 | 21.8 |
| 2459945.93007 | 467.7 | 22.0 |
2.4 High Angular Resolution Imaging
Close stellar companions (bound or line of sight) can confound exoplanet discoveries in a number of ways. The detected transit signal might be a false positive due to a background eclipsing binary and even real planet discoveries will yield incorrect stellar and exoplanet parameters if a close companion exists and is unaccounted for (Ciardi et al., 2015; Furlan & Howell, 2017, 2020). Additionally, the presence of a close companion star leads to the non-detection of small planets residing with the same exoplanetary system (Lester et al., 2021). Given that nearly one-half of solar-like stars are in binary or multiple star systems, (Matson et al., 2018) high-resolution imaging provides crucial information toward our understanding of exoplanet formation, dynamics and evolution (Howell et al., 2021).
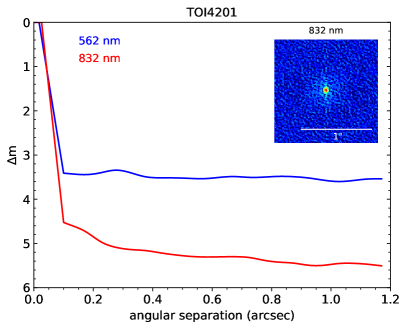
TOI-4201 was observed on 2023 April 25 UT using the Zorro speckle instrument on the Gemini South 8-m telescope (Scott et al., 2021; Howell & Furlan, 2022). Zorro provides simultaneous speckle imaging in two bands (562nm and 832 nm) with output data products including a reconstructed image with robust contrast limits on companion detections. Nine sets of 1000 0.06 second images were obtained and processed in our standard speckle imaging reduction pipeline (see Howell et al., 2011). Figure 6 shows our final 5 contrast curves and the 832 nm reconstructed speckle image. The observations of TOI-4201 revealed it to have no close companions within the angular and contrast levels achieved. We find no companion brighter than 4-5 magnitudes below that of the star itself from the 8-m telescope diffraction limit (20 mas) out to 1.2′′. At the distance of TOI-4201 (d=189 pc), these angular limits correspond to spatial limits of 3.8 to 227 AU.
3 Stellar Characterization
3.1 Stellar parameters
We apply three different methods to determine the stellar properties of TOI-4201 including SED fitting, spectroscopic analysis and empirical relations. We take the weighted stellar radius, mass, effective temperature, and list them in Table 3.
3.1.1 SED fitting
We carry out a spectral energy distribution (SED) analysis of the star together with the Gaia DR3 parallax (with no systematic offset applied; see, e.g., Stassun & Torres, 2021), in order to determine an empirical measurement of the stellar radius, following the procedures described in Stassun & Torres (2016); Stassun et al. (2017); Stassun & Torres (2018). We pulled the magnitudes from 2MASS (Cutri et al., 2003), the W1–W3 magnitudes from WISE (Wright et al., 2010), the magnitudes from Pan-STARRS (Chambers et al., 2016), and the , magnitudes from Gaia DR3 (Gaia Collaboration et al., 2023). Together, the available photometry spans the full stellar SED over the wavelength range 0.4–10 m (see Figure 7).
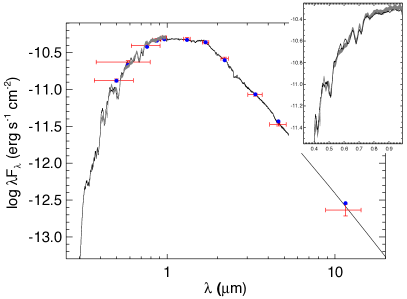
We perform a fit using PHOENIX stellar atmosphere models (Husser et al., 2013), with the free parameters being the effective temperature () and metallicity ([Fe/H]), as well as the extinction , which we limited to maximum line-of-sight value from the Galactic dust maps of Schlegel et al. (1998). The resulting fit (Figure 7) has a best-fit , K, [Fe/H] = , with a reduced of 1.4. The metallicity in particular is further constrained by the Gaia spectrum (see grey swathe in Figure 7 and inset). Integrating the (unreddened) model SED gives the bolometric flux at Earth, erg s-1 cm-2. Taking the and together with the Gaia parallax, gives the stellar radius, R⊙.
We also independently derive the stellar effective temperature () and radius following the method outlined in (Mann et al., 2016). To briefly summarize, we fit the SED by comparing the available photometry to a grid of late-K and early-M dwarf templates from (Gaidos et al., 2014). To fill in gaps in the templates, we use PHOENIX BT-SETTL models (Allard et al., 2013). The free parameters are the template choice, the scale factor, reddening, model selection ( and [M/H]), and three parameters meant to account for systematics if the flux calibration of the templates. We locked the reddening to based on 3D extinction maps (Green et al., 2019), although this did not change the final fit. We estimate the luminosity from the integral of the absolutely-calibrated spectrum and Gaia DR3 parallax, then estimate from the Stefan-Boltzmann relation as well as the infrared-flux method (Blackwell & Shallis, 1977). The final resulting fit is K and , consistent with other estimates.
The planet host sits high on the color-magnitude diagram for a main-sequence M dwarf (Mann et al., 2015), suggesting it is metal-rich ([Fe/H] dex). However, deriving a metallicity from this method assumes a single star with no reddening. Instead, we estimate [Fe/H] using the photometry as outlined in Newton et al. (2014). This yielded [Fe/H], although it may be an underestimate as the host star sits above most of the calibration stars (see Figure 21 in Newton et al. 2014).
3.1.2 Spectroscopic analysis
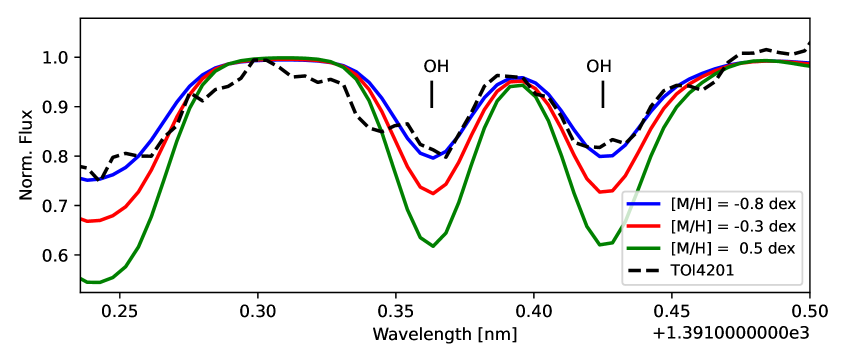
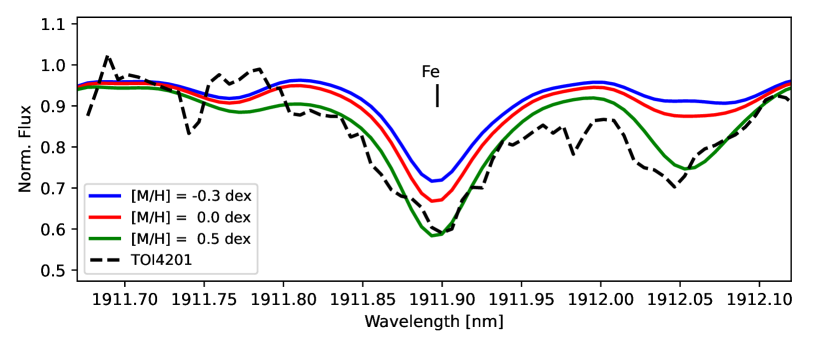
The SPIRou high-resolution combined spectrum of TOI-4201 offers an independent determination of its chemical composition. Such characterization on SPIRou data was also performed on the M4 dwarf TOI-1452 in Cadieux et al. (2022) and additional details on the methodology presented below are given in Jahandar et al. in prep. Briefly, the combined spectrum of TOI-4201 is compared to a 2D grid ( and [M/H]) of ACES stellar models (Allard et al. 2012a; Husser et al. 2013) deconvolved to match SPIRou resolution. We select strong absorption lines matching the models to avoid continuum mismatch and with a known origin, i.e., atomic or molecular and found in the PHOENIX/BT-Settl (Allard et al. 2012b; 2013) and NIST (Kramida et al., 2022) line lists. Fixing the to the value derived above, we performed fits on individual spectral lines to determine the abundances of several chemical species by varying the overall metallicity [M/H]. Since the combined spectrum of TOI-4201 has a relatively low SNR of 200 in band, we also ran Monte Carlo simulations (varying flux values) to assess the robustness of the fits. We find a high stellar iron abundance of dex for TOI-4201 with 12 Fe I absorption lines, which is consistent with the estimations above from the photometry within . The final [Fe/H] from the spectroscopic analysis is based on the average of best-fit overall metallicity [M/H] of each Fe line. The uncertainty of [Fe/H] provided in the work is the standard variation of these [M/H] divided by , where N is the total number of lines (12). We note that the error bar might be underestimated since this methodology has an intrinsic RMS of about 0.2 dex (see Figure 11 in Cristofari et al., 2022, which used the same synthetic model and observed data, although different choice of lines.). We use the [Fe/H] from SPIRou spectrum analysis for further investigation in the rest of this work and list all metallicity measurements from different sources in Table 3. Meanwhile, we see very shallow OH lines, which indicates a low oxygen abundance (see Figure 8). High-resolution spectroscopic observations in optical bands are required to confirm these abundance measurements.
3.1.3 Empirical relation
Based on the from 2MASS and parallax from Gaia DR3, we obtain the absolute magnitude of TOI-4201 to be mag. We then estimate the stellar radius by employing the empirical relation between and derived by Mann et al. (2015), and we find an of . This is consistent with the value within measured using the relation between stellar angular diameter and color described in Boyajian et al. (2014).
Next, we estimate the stellar effective temperature using two methods. First, we calculate the bolometric correction using its relation with from Mann et al. (2015), and we find mag. Therefore, we measure a bolometric magnitude of mag, which results in a bolometric luminosity of . The effective temperature K is then derived using the Stefan-Boltzmann law. Furthermore, we also obtain an empirical estimation of K using a polynomial relation with stellar colors and (Mann et al., 2015).
Finally, we obtain the stellar mass using Equation 2 in Mann et al. (2019) according to the - relation 222https://github.com/awmann/M_-M_K-. We find , which agrees with based on the result from Benedict et al. (2016). We in turn use the mass-radius relation from Boyajian et al. (2012) (see their Eq. 10), and we find a stellar radius of , consistent with other results above.
| Parameter | Value | Ref. |
| Main identifiers | ||
| TIC | ||
| Gaia ID | Gaia DR3[2] | |
| Equatorial Coordinates | ||
| 06:01:53.93 | ||
| -13:27:40.93 | ||
| Photometric properties | ||
| (mag) | ||
| (mag) | APASS[3] | |
| (mag) | APASS | |
| (mag) | Gaia DR3 | |
| (mag) | Gaia DR3 | |
| (mag) | Gaia DR3 | |
| (mag) | 2MASS[4] | |
| (mag) | 2MASS | |
| (mag) | 2MASS | |
| 1 (mag) | WISE[5] | |
| 2 (mag) | WISE | |
| 3 (mag) | WISE | |
| Astrometric properties | ||
| (mas) | Gaia DR3 | |
| Gaia DR3 | ||
| Gaia DR3 | ||
| Stellar parameters | ||
| Spectral Type | This work | |
| RV (km s-1) | This work | |
| Distance (pc) | This work | |
| (km s-1) | This work | |
| (km s-1) | This work | |
| (km s-1) | This work | |
| This work | ||
| This work | ||
| This work | ||
| This work | ||
| This work | ||
| This work | ||
| This work[6] | ||
| This work[7] | ||
| This work[8] | ||
| (days) | This work | |
| (Gyr) | This work |
3.2 Stellar rotation and age estimation
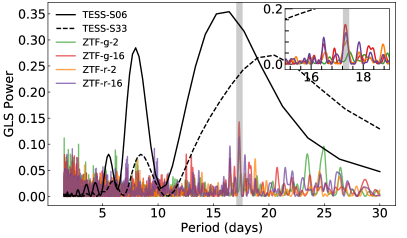
The TESS light curves of TOI-4201 that we extracted using a custom aperture from both Sectors 6 and 33 have an obvious baseline variation, which implies a high stellar rotation speed. A similar modulation is also shown in the QLP light curve of Sector 6. We conduct a frequency analysis using the generalized Lomb-Scargle (GLS) periodogram (Zechmeister & Kürster, 2009) after removing all in-transit data to measure the stellar rotation period. The result is presented in Figure 9. The light curve from Sector 6 shows a signal around 16.4 days as well as a significant aliasing signal peaking at 8.2 days. While the one from Sector 33 has a broad signal around 20.4 days, similar aliasing signals could also be seen around 8 days. Both the 16.4-day and 20.4-day signals have a false alarm probability (FAP) below 0.1%.
Due to the limited length of the TESS observation baseline, the constraint on the rotation period is poor using TESS-only data. Therefore, we further investigate the long-term ground photometry from Zwicky Transient Facility (ZTF; Bellm et al., 2019; Masci et al., 2019), and search for periodic modulations. ZTF is mounted on the 48-inch aperture Schmidt-type Telescope at the Palomar Observatory. Using a wide-field camera consisting of 16 CCDs, which results in a field of view of 47 squared deg, ZTF scans the entire Northern sky every two days, providing a large amount of data for time-domain science. TOI-4201 is observed by ZTF using two different CCDs (id = 2 and 16) in both and bands. All of these observations were done with an exposure time of 30s and data are publicly available under DR16. After removing all flux measurements flagged as bad quality, we find that ZTF has (i) 170 measurements from CCD-2 in band between 2018 Marth 27 and 2022 December 27; (ii) 184 measurements from CCD-16 in band between 2018 Marth 27 and 2022 December 27; (iii) 206 measurements from CCD-2 in band between 2018 September 4 and 2022 December 27; and (iv) 183 measurements from CCD-16 in band between 2018 September 6 and 2022 December 27. We compute the GLS periodogram for each of these datasets, and we show the results in Figure 9. Except for the first one that shows no significant signals with FAP below 10%, all the other three light curves have a peak around 17.34 days with a FAP of 0.1%, 10% and 1%, which is consistent with the aforementioned findings from TESS data. A forest of other peaks can also be seen between 15 and 20 days, probably due to the poor sampling.
Based on Kepler observations, McQuillan et al. (2014) analyzed the rotation periods of a series of main sequence stars with effective temperatures below 6500 K. They suggested that a typical M star like TOI-4201 with around 3800 K has a rotation period between 10 and 40 days. In addition, Newton et al. (2016, 2018) made use of ground long-term photometric monitoring from the MEarth survey (Irwin et al., 2009), which leads to a conclusion that the rotation periods of early-M stars are generally within 40 days, although their sample has a limited number of early-M stars. Therefore, we attribute this 17.34-day signal to the stellar rotation.
Building on the stellar rotation period, we next evaluate the stellar age. We first adopt the empirical relation from Engle & Guinan (2018), which yields Gyr, in agreement with the estimation Myr from (Mamajek & Hillenbrand, 2008). Additionally, we use the gyrochronology relation reported by Barnes (2007). Without taking reddening into consideration, we also find an age below 2 Gyr given the stellar color from APASS (Henden et al., 2016). We thus provide a conservative age estimation of TOI-4201 between 0.7 and 2.0 Gyr.
3.3 Stellar kinematic properties
Following the method described in Johnson & Soderblom (1987), we calculate the 3-dimensional velocity of TOI-4201 with respect to the local standard of rest (LSR). We utilize the stellar proper motion ( and ) and parallax () from Gaia DR3 as well as the systemic velocity RV from SPIRou measurement. Taking the solar velocity components relative to the LSR (, , )=(9.58, 10.52, 7.01) km s-1 from the Large Sky Area Multi-Object Fiber Spectroscopic Telescope (LAMOST; Tian et al., 2015) into consideration, we obtain a Galactic space motion of (, , )=(, , ) km s-1. We further make use of the BANYAN algorithm (Gagné et al., 2018) to determine the membership probability of TOI-4201 within young associations. Using the stellar kinematic parameters above, we find that TOI-4201 is likely a field star and it shows no evidence of cluster membership. We finally follow the procedure in Bensby et al. (2003, 2014), and estimate a low probability ratio about =1.3% for TOI-4201 belonging to the Galactic thick and thin disk, indicating that TOI-4201 has a thin-disk origin.
4 Joint-fit
We carry out a joint-fit of all photometry and SPIRou radial velocities to derive the planetary physical parameters using the juliet package (Espinoza et al., 2019). Basically, we fit light curves using batman (Kreidberg, 2015) while the RV model is generated with radvel (Fulton et al., 2018). We obtain the posteriors of all parameters through a dynamic nested sampling with dynesty (Speagle, 2020).
We set Gaussian normal priors on both the orbital period and mid-transit epoch, centering at the values we found in our transit search, with a value of 0.1 days. Following the parametrization for the planet-to-star radius ratio and impact parameter in Espinoza (2018), we efficiently sample their physical parameter spaces by fitting and instead and allow them uniformly vary between 0 and 1. Since we use a relatively large box aperture to extract the TESS photometry, light contamination from other stars especially the nearby star Gaia 2997312063605005952 located within the aperture with mag ( mag) should be considered (see Figure 1). Therefore, we fit a dilution factor333The dilution factor is defined as 1/(1+), where is the light contamination ratio. We use the estimate from TICV8 and set a Gaussian prior. for the TESS photometry while we fix it at 1 for ground-based observations as nearby stars around TOI-4201 in ground images are deblended. We opt to adopt a quadratic limb darkening law for the TESS photometry and a linear law for ground data (Kipping, 2013). Finally, we include a jitter term for every photometric dataset to account for additional white noise.
In terms of the RV modeling, we fit a standard Keplerian orbit, leaving and as free parameters. We place wide informative uniform priors on the RV semi-amplitude , the systematic velocity as well as the RV jitter . Due to the short time span, we do not consider linear and quadratic RV trends here, both of which are fixed at 0. The joint fit reveals that the planet has a radius of with a mass of on a nearly circular orbit. We list the prior settings and the posteriors of all parameters in Table LABEL:allpriors. We show the phase-folded data along with the best-fit transit and RV models in Figures 2 and 5.
| Parameter | Prior | Value | Description |
| Orbit parameters | |||
| (days) | ( , ) | Orbital period. | |
| (BJD-2457000) | ( , ) | Mid-Transit time. | |
| ( , ) | Parametrization for p and b. | ||
| ( , ) | Parametrization for p and b. | ||
| ( , ) | Parametrization for and . | ||
| ( , ) | Parametrization for and . | ||
| (m s-1) | ( , ) | RV semi-amplitude. | |
| (m s-1) | ( , ) | Systemic velocity. | |
| (m s-1) | ( , ) | RV jitter. | |
| Stellar parameter | |||
| (kg m-3) | ( , ) | Stellar Density. | |
| Dilution factors | |||
| ( , , 0 , 1) | |||
| ( , , 0 , 1) | |||
| 1 (Fixed) | |||
| Limb-darkening coefficients | |||
| ( , ) | |||
| ( , ) | |||
| ( , ) | |||
| ( , ) | |||
| ( , ) | |||
| ( , ) | |||
| ( , ) | |||
| ( , ) | |||
| ( , ) | |||
| ( , ) | |||
| ( , ) | |||
| ( , ) | |||
| Photometric jitter | |||
| (ppm) | ( , ) | ||
| (ppm) | ( , ) | ||
| (ppm) | ( , ) | ||
| (ppm) | ( , ) | ||
| (ppm) | ( , ) | ||
| (ppm) | ( , ) | ||
| (ppm) | ( , ) | ||
| (ppm) | ( , ) | ||
| (ppm) | ( , ) | ||
| (ppm) | ( , ) | ||
| Derived parameters | |||
| Scaled planet radius. | |||
| Scaled semi-major axis. | |||
| (AU) | Semi-major axis. | ||
| Impact parameter. | |||
| (degrees) | Orbital inclination. | ||
| Orbital eccentricity. | |||
| (degrees) | Argument of periapsis. | ||
| Planetary physical parameters | |||
| () | Planet radius. | ||
| () | Planet Mass. | ||
| (g cm-3) | Planet density. | ||
| (K) | Equilibrium temperature. | ||
| () | Planetary Insolation. |
-
1
[1] We do not consider heat distribution between the dayside and nightside here and assume albedo .
5 Discussions
5.1 TOI-4201b: A massive and dense giant planet
With a mass of around , TOI-4201b is the most massive hot Jupiter around an M dwarf known so far (see the top panel of Figure 10). It stands out from other similar systems (M dwarf + hot Jupiter) with a much lower companion mass around . Since most host stars of those systems are also early-M dwarfs, the reason why TOI-4201b is more massive than others is unclear. In addition, TOI-4201b also has the highest planet-to-star mass ratio of about among M dwarf hot Jupiter systems (see the bottom panel of Figure 10). Compared with warm and cold Jupiters detected by RV and microlensing surveys, it turns out that such massive close-in Jupiters are lacking around M dwarfs. Together with HATS-74Ab (Jordán et al., 2022) and TOI-5205b (Kanodia et al., 2023), TOI-4201b is the third planet situated in the mass ratio paucity region ( and AU), an unpopulated area proposed by Gan et al. (2022a), making it an interesting object for theories of planet formation.
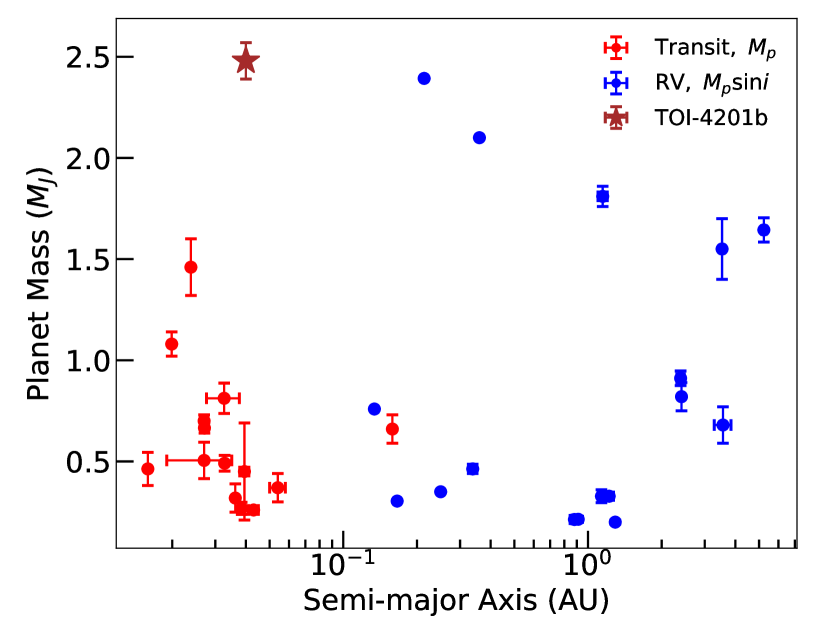
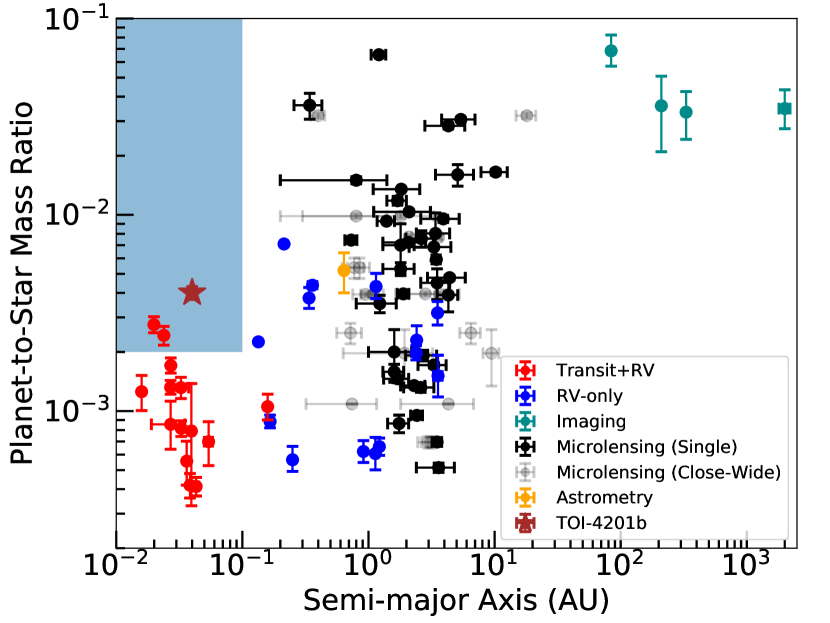
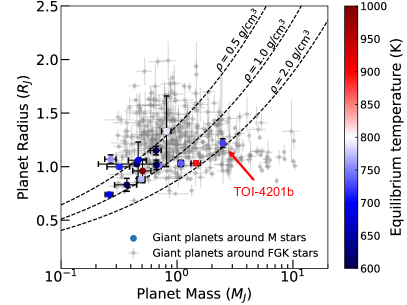
Figure 11 shows the Mass-Radius diagram of all confirmed transiting gas giants around FGKM dwarfs. Unlike those giant planets around FGK stars that have both diverse radius and mass, gas giants around M dwarfs have masses spanning orders of magnitude but with relatively concentrated radius, which is mainly due to the low incident flux they received. Because these giant planets around M dwarfs are not strongly irradiated by the host star, they are good targets to study interior structures.
5.2 Interior structure of TOI-4201b
The mean density of TOI-4201b is about g cm-3, significantly higher than other observed gas giants around M-dwarfs, as is shown in Figure 11. The high density of the planet can be entirely attributed to hydrogen compression in the massive planet, and not of high metal content, as in the case of lower mass planets, since high would make the planet radius too small. Interior-evolution modeling suggests metal content between 0-25 in the interior of TOI-4201b, depending on the metal distribution in the interior, its history, and its energy state.
According to the standard core accretion models (e.g., Fortney et al., 2007; Baraffe et al., 2008), the mean density of TOI-4201b is consistent with pure H, He composition and lighter than that, i.e. inflated radius. We perform dedicated structure-evolution models of TOI-4201b under various conditions, based on Vazan et al. (2013, 2015) in order to fit its radius-mass-age parameters. Since atmospheric properties of TOI-4201b are not available, we consider albedo values of 0-0.3, and atmospheric opacity metallicity between solar and ten times solar (Freedman et al., 2014). Evolution models covered a wide range of parameters of cold and hot start conditions (e.g., Marley et al., 2007), and various metal distributions in the interior. The models suggest a core mass of 0-5 Earth masses and a metal-poor envelope. Alternative scenarios that involve post-formation giant impact allow larger metal content. In such cases TOI-4201b can contain up to 25 Earth masses of metals, gradually distributed in the deep interior, surrounded by a metal-poor envelope.
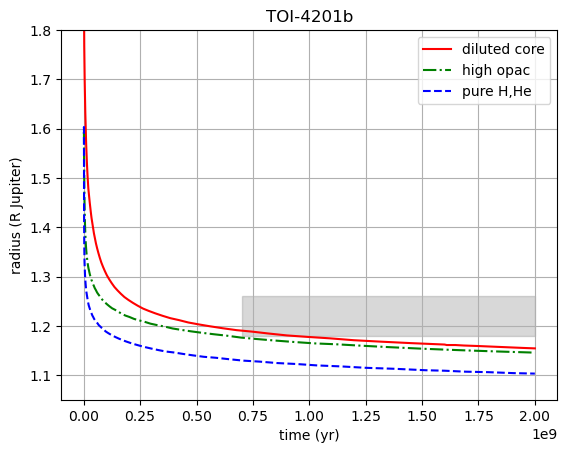
In Figure 12, we show the radius evolution of three TOI-4201b mass planets. Under standard evolution conditions TOI-4201b is an inflated hot Jupiter, since its observed radius-age (grey box) is larger than any model with efficient (adiabatic) cooling, even if the model is of a metal-free planet (dashed blue). The hot diluted core model (red) simulates post energetic giant impact scenario that eroded parts of the core, injecting energy and slowing the cooling of the planet. Yet, the maximum metal mass in this scenario cannot exceed 25, and the model meets the observed values only at a limited range. A classical core-envelope model with 5 core and high atmospheric opacity of ten times solar (green) barely fits the observed properties. These models indicate a difficulty to fit observations with high accuracy without additional energy sources.
Based on the power-law relation from Thorngren et al. (2016), we compute the total heavy element mass required for TOI-4201b, and we obtain a high value around under the assumption that the planet is not affected by inflation mechanisms. Apart from a typical core occupied in Thorngren et al. (2016), the rest of the metals with a mass of about are supposed to go directly into the gas envelope. However, the resulting low metal content (up to 3%) of TOI-4201b from our interior structure modeling makes this planet challenging in terms of planet formation theory. In this system, despite the high metallicity of TOI-4201, the giant planet appears to be a metal-poor planet and its bulk metallicity is at most identical to its star metallicity. This finding challenges the classical core-accretion trend of the stellar-planet metallicity (Thorngren et al., 2016). The formation path of TOI-4201b - a massive metal-poor planet around a metal-rich low-mass star - remains unclear. Given the low metallicity of the planet, planet formation by gravitational instability cannot be ruled out (Boss, 2011).
5.3 Potential heating mechanisms
The discrepancy between the host star iron abundance and planet metallicity ( and ) could be slightly mitigated if additional heating processes have an effect. Such processes may inject energy and slow down the cooling, leading to an inflated planet radius. Although the low equilibrium temperature ( K) makes Ohmic dissipation less probable (Batygin & Stevenson, 2010), we propose three possible pathways of planet heating.
5.3.1 Tidal heating
The short distance from the star suggests that tidal heating may introduce non-negligible energy into the planet’s interior, as it went through the circularization of its orbit (Leconte et al., 2010). The low orbital eccentricity of also suggests that the tidal effect has an influence on the planet. We calculate the tidal circularization timescale of TOI-4201b using the equation from Goldreich & Soter (1966), which yields a Gyr, assuming a typical planet quality factor of hot Jupiters. This is very close to the lower bound age estimation Gyr for the host star. If this is the case, it favors the younger age limit for the system and the tidal heating probably took place until recently.
5.3.2 Gas giant merger
Another possible scenario is a head-on collision of two less massive gas giants (Li et al., 2010; Liu et al., 2015), which will result in a coalescence of solid cores and gaseous envelopes without substantial material loss. Due to the high energy generated during the impact, the final merger remnant might be puffed up. This scenario also accounts for the high mass of the planet.
Planet collision should be more likely around metal-rich stars. With high solid density protoplanetary disks, they are likely to have multiple giant planets at the beginning. Such a configuration has also been found around M dwarfs, for example GJ 317, a metal-rich ([Fe/H]= dex) M star hosting two cold Jupiters (Anglada-Escudé et al., 2012; Feng et al., 2020). Violent planet–planet interactions will probably then occur through gravitational perturbations (Rasio & Ford, 1996). Under certain conditions, one of these formed giant planets will be scattered inward to large eccentricities (Dawson & Murray-Clay, 2013). While in some extreme cases, the instability may cause close encounters if planets have sufficiently small spacings, which will result in a direct collision (Li et al., 2021).
As a violent process, one would naturally expect to see a misalignment between the spin axis of the host star and the orbital angular momentum axis of the planet, induced by planet-planet scattering (Liu & Ji, 2020). Observations have shown that several hot Jupiters have high obliquities (projected spin-orbit angle), which may be left during the interactions between planets (Winn & Fabrycky, 2015). If TOI-4201b did undergo a dynamically hot formation history, we may be able to find clues through studying the stellar obliquity (Stefànsson et al., 2022).
5.3.3 Embryo capture by a gas giant
An alternative route to inject energy is through embryo capture. At first, there probably exists a proto gas giant outside the snow line accompanied with several rocky embryos such as super Earths in the inner disk. During the inward migration of the cold giant planet (Lin et al., 1996), these interior embryos would be trapped by the mean motion resonance (MMR) of the gas giant, leading to an orbital decay along the path. The planetary resonant perturbation probably then excites the orbits of these unstable embryos (Zhou & Lin, 2007; Wang et al., 2021). If their eccentricity damping rate is fast, we will see a short-period giant accompanied by close-in super Earths. However, the orbits of rocky embryos may crisscross that of the migrating gas giant if the damping timescale is long. They will pass through the envelope of the proto gas giant and collides into its center core. Similar to the aforementioned pathway, the energy produced by the impact may inflate the gas giant.
A planetary system with both outer gas giants and inner small planets is not unusual. Huang et al. (2016) found that nearly half of warm Jupiters co-exist with low-mass planets. In addition, recent work from Wu et al. (2023) also reported that at least % hot Jupiters as well as % warm Jupiters have nearby planetary companions by investigating the transit timing variation signals, which probably support this hypothesis. Although the number is still limited, such a planetary configuration has also been found around M dwarfs through RV surveys (e.g., GJ 876; Rivera et al., 2010). Since the disk migration and embryo capture are quiescent, unlike the previously mentioned process, here we expect a well-aligned system with a low stellar obliquity. Such gentle gas disk migrations are also unlikely to produce large eccentricities of giant planets (Dunhill et al., 2013), like what is expected for TOI-4201b.
5.4 Tidally induced evolution
As TOI-4201b is a new addition to the growing number of giant planets orbiting M dwarfs (see Alvarado-Montes 2022), studying its tidal evolution could allow us to shed some light on the energy dissipation of M-dwarf hosts and put some constraints on stellar and planetary interiors. We study the tidal evolution of TOI-4201b under the formalism used by Alvarado-Montes (2022) to understand the orbital decay of giant planets orbiting M dwarfs due to the dissipation of inertial waves (IWs) in convective envelopes and internal gravity waves (IGWs) in stellar radiative regions. For this particular system, IWs were not excited in the convective envelope due to the short orbital period of the planet and the slow rotation of the host star (i.e. ; see Barker 2020).
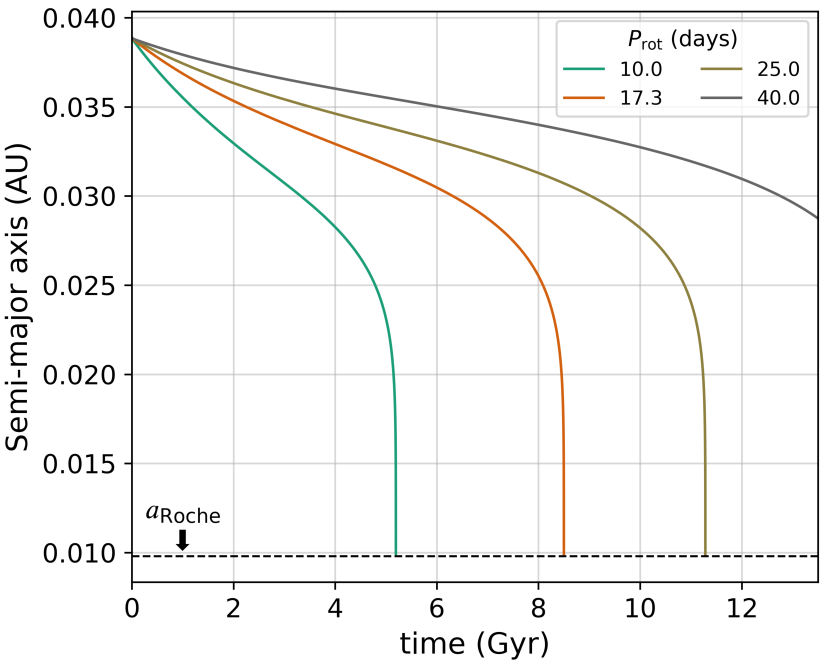
IGWs in the stellar radiative regions are not expected to be damped due to wave breaking, as a planetary mass threshold (i.e. critical mass) would be necessary for such a mechanism to occur for the given stellar age and stellar mass (see values in Figure 9 in Barker 2020). However, if IGWs are somehow excited (e.g., via radiative diffusion), we predict a stellar quality factor . This could also be the case in later stages of stellar evolution as becomes smaller, thus producing fully damped IGWs due to wave breaking. For this tidal quality factor, we found that TOI-4201b would undergo orbital decay from its initial position to the Roche limit in a timescale of 8 Gyr for a 17.3-day stellar rotation period. The orbital decay for other stellar rotation periods is also shown in Figure 13 (top panel), and the migration timescales resemble those of other short-period giant planets undergoing orbital decay for days (see e.g., Brown et al. 2011; Alvarado-Montes & García-Carmona 2019).
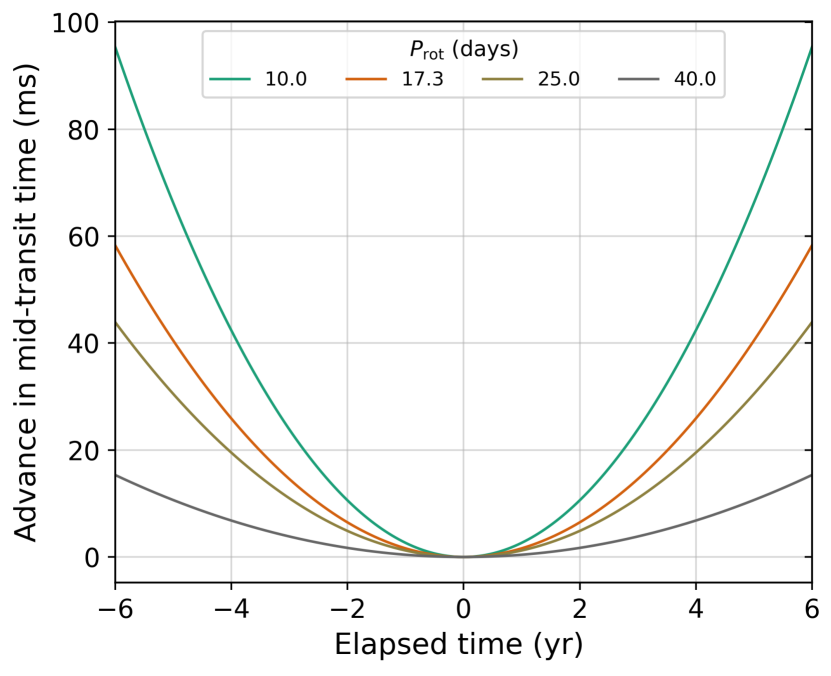
Using the results from the tidal simulations performed for TOI-4201b (top panel in Figure 13), we computed the rate of change of the orbital period of TOI-4201b as ms yr-1. Using these results, we calculated the advance in the mid-transit time of TOI-4201b (bottom panel in Figure 13) where it can be seen that an advance of 60 ms is expected for the next six years of observations, being three orders of magnitude smaller than those calculated for ultra-short-period Jupiters (see e.g., McCormac et al. 2019; Alvarado-Montes et al. 2021). It is worth noting that we studied the tidal effects for TOI-4201b assuming a co-planar system, so future observations (see next subsection) can help us refine our calculations by using a formalism where the evolution of the projected obliquity would also be included.
5.5 Prospects for future observations
Based on the mass correlation from Thorngren et al. (2016), TOI-4201b is supposed to contain a large amount of metal in the envelope but we would expect to see a smaller planet radius in that case. Our interior structure model, instead, suggests the envelope is metal-poor. It motivates future atmospheric characterization using space telescopes like JWST to study the chemical composition in the planet atmosphere. Therefore, we compute the Transmission Spectroscopy Metric (TSM; Kempton et al., 2018), which is a quality factor of an object suitable for atmospheric composition studies. We find a , much smaller than the threshold of 90 for high-quality Jovian-like planets recommended by Kempton et al. (2018), indicating that TOI-4201b is a challenging case but still possible with multi-visit observations.
In addition, studying stellar obliquity may help us trace back the planet dynamic history. The host star shows a clear rotation signal around 17.3 days, corresponding to a stellar rotation speed of km s-1. To probe the opportunity of detecting the Rossiter–McLaughlin (RM) effect (Rossiter, 1924; McLaughlin, 1924) and measure the projected spin orbit angle, we estimate the RM signal amplitude to a first order using
| (1) |
where is the impact parameter. The moderate impact parameter also eliminates the usual covariance between and the projected obliquity . Coupled with results from the joint fit, we find an about 44 m/s. Although the host star is faint and the transit duration is short, the RM observation is still possible with ground spectroscopic facilities on large telescopes like MAROON-X and ESPRESSO.
5.6 Metallicity preference of hot and warm Jupiters around M dwarfs
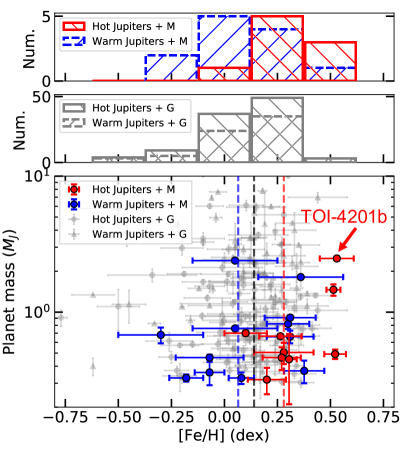
In order to compare the planet-metallicity dependence to probe the similarity of the planet formation history, we next investigate the metallicity distribution of four planet groups: HJG, WJG, HJM and WJM, corresponding to hot and warm Jupiters around G () and M dwarfs based on the discoveries retrieved from the NASA Exoplanet Archive (Akeson et al., 2013). To take the planet insolation into consideration, here we define the hot and warm Jupiter groups with a scaled semi-major axis () and planet mass boundary cut. We designate hot Jupiters as planets having mass above 0.3 and while cold Jupiters as those with . Under this definition, our sample contains 103 HJG, 70 WJG, 9 HJM and 12 WJM. First, both hot and warm Jupiters are likely to form around metal-rich G-type stars. These two samples have a similar preference for stellar metallicity, both of which have a median [Fe/H] around 0.14 dex as shown in Figure 14. Interestingly, most hot Jupiters are orbiting M dwarfs with even higher super-solar metallicity (0.28 dex). Such a strong dependence between giant planets and stellar metallicity favors the core accretion formation mechanism (Santos et al., 2004; Fischer & Valenti, 2005; Sousa et al., 2011; Wang et al., 2018). Meanwhile, the iron abundances of M dwarfs that host warm Jupiters have a much wider distribution, from to 0.3 dex with a median of 0.06 dex. Therefore, the formation of warm Jupiters around M dwarfs is probably less sensitive to stellar metallicity, indicating a different formation pathway that is less dependent on metallicity. But it is still possible that this feature is biased due to the limited M dwarf sample size or different facilities and methods used to measure the iron abundance. Future observations and homogeneous spectroscopic analysis may help draw a firm conclusion.
6 Conclusions
In this paper, we report the discovery and characterization of TOI-4201b, a massive and dense hot Jupiter transiting an early-M dwarf. TOI-4201b was first alerted as a planet candidate based on the TESS data, and the planetary nature was then confirmed through ground-based photometric, spectroscopic and imaging observations. TOI-4201b has a radius of with a mass of . It orbits the host M star every 3.58 days on a nearly circular orbit (). The bulk density g cm-3 of TOI-4201b makes it one of the most massive and densest hot Jupiters around M dwarfs. Although the host star has super-solar metallicity, interior structure modeling suggests that the TOI-4201b is metal-poor, which differs from the classical picture of positive stellar-planet metallicity correlation. Planet formation scenarios more typical for the core accretion model can be envisioned if additional energy sources, like tidal heating or giant impacts, operate to inflate the planet radius. Future studies on the planet atmosphere and stellar obliquity may shed light on its formation and evolution.
We also compare the stellar metallicity distributions of four planet groups: hot and warm Jupiters around G and M stars. We find that the M dwarfs hosting hot Jupiters have a higher mean metallicity than G dwarfs, favoring the core accretion scenario. Warm Jupiters around M dwarfs, instead, show a weak dependence on stellar iron abundance, which perhaps indicates a different formation story.
7 Acknowledgments
We thank Beibei Liu and Haochang Jiang for the useful discussions on planet formation and scattering. We are grateful to Coel Hellier for the insights regarding the WASP data.
This work is partly supported by the National Science Foundation of China (Grant No. 12133005). This research uses data obtained through the Telescope Access Program (TAP), which has been funded by the TAP member institutes. The authors acknowledge the Tsinghua Astrophysics High-Performance Computing platform at Tsinghua University for providing computational and data storage resources that have contributed to the research results reported within this paper.
Based on observations obtained at the Canada-France-Hawaii Telescope (CFHT) which is operated from the summit of Maunakea by the National Research Council of Canada, the Institut National des Sciences de l’Univers of the Centre National de la Recherche Scientifique of France, and the University of Hawaii. The observations at the Canada-France-Hawaii Telescope were performed with care and respect from the summit of Maunakea which is a significant cultural and historic site. Based on observations obtained with SPIRou, an international project led by Institut de Recherche en Astrophysique et Planétologie, Toulouse, France.
This work is partly supported by the Natural Science and Engineering Research Council of Canada and the Institute for Research on Exoplanets through the Trottier Family Foundation. This work makes use of observations from the Las Cumbres Observatory global telescope network and it is partly supported by JSPS KAKENHI Grant Numbers JP17H04574, JP18H05439, and JST CREST Grant Number JPMJCR1761.
Some of the observations in this paper made use of the High-Resolution Imaging instrument Zorro and were obtained under Gemini LLP Proposal Number: GN/S-2021A-LP-105. Zorro was funded by the NASA Exoplanet Exploration Program and built at the NASA Ames Research Center by Steve B. Howell, Nic Scott, Elliott P. Horch, and Emmett Quigley. Zorro was mounted on the Gemini South telescope of the international Gemini Observatory, a program of NSF’s OIR Lab, which is managed by the Association of Universities for Research in Astronomy (AURA) under a cooperative agreement with the National Science Foundation. on behalf of the Gemini partnership: the National Science Foundation (United States), National Research Council (Canada), Agencia Nacional de Investigación y Desarrollo (Chile), Ministerio de Ciencia, Tecnología e Innovación (Argentina), Ministério da Ciência, Tecnologia, Inovações e Comunicações (Brazil), and Korea Astronomy and Space Science Institute (Republic of Korea).
Based on observations obtained with the Samuel Oschin 48-inch Telescope at the Palomar Observatory as part of the Zwicky Transient Facility project. ZTF is supported by the National Science Foundation under Grant No. AST-1440341 and a collaboration including Caltech, IPAC, the Weizmann Institute for Science, the Oskar Klein Center at Stockholm University, the University of Maryland, the University of Washington, Deutsches Elektronen-Synchrotron and Humboldt University, Los Alamos National Laboratories, the TANGO Consortium of Taiwan, the University of Wisconsin at Milwaukee, and Lawrence Berkeley National Laboratories. Operations are conducted by COO, IPAC, and UW.
This work makes use of observations from the LCOGT network. Part of the LCOGT telescope time was granted by NOIRLab through the Mid-Scale Innovations Program (MSIP). MSIP is funded by NSF.
This paper includes data gathered with the 6.5 meter Magellan Telescopes located at Las Campanas Observatory, Chile.
The ULiege’s contribution to SPECULOOS has received funding from the European Research Council under the European Union’s Seventh Framework Programme (FP/2007-2013) (grant Agreement n∘ 336480/SPECULOOS), from the Balzan Prize and Francqui Foundations, from the Belgian Scientific Research Foundation (F.R.S.-FNRS; grant n∘ T.0109.20), from the University of Liege, and from the ARC grant for Concerted Research Actions financed by the Wallonia-Brussels Federation. SPECULOOS-North has received financial support from the Heising-Simons Foundation and from Dr. and Mrs. Colin Masson and Dr. Peter A. Gilman.
The postdoctoral fellowship of KB is funded by F.R.S.-FNRS grant T.0109.20 and by the Francqui Foundation. This publication benefits from the support of the French Community of Belgium in the context of the FRIA Doctoral Grant awarded to MT. J.d.W. and MIT gratefully acknowledge financial support from the Heising-Simons Foundation, Dr. and Mrs. Colin Masson and Dr. Peter A. Gilman for Artemis, the first telescope of the SPECULOOS network situated in Tenerife, Spain. BVR thanks the Heising-Simons Foundation for support. MG is FNRS-F.R.S Research Director. KAC and SQ acknowledges support from the TESS mission via subaward s3449 from MIT. SQ acknowledges support from the TESS GI Program under award 80NSSC21K1056.
Funding for the TESS mission is provided by NASA’s Science Mission Directorate. This research has made use of the Exoplanet Follow-up Observation Program website, which is operated by the California Institute of Technology, under contract with the National Aeronautics and Space Administration under the Exoplanet Exploration Program. This paper includes data collected by the TESS mission, which are publicly available from the Mikulski Archive for Space Telescopes (MAST). This work has made use of data from the European Space Agency (ESA) mission Gaia (https://www.cosmos.esa.int/gaia), processed by the Gaia Data Processing and Analysis Consortium (DPAC, https://www.cosmos.esa.int/web/gaia/dpac/consortium). Funding for the DPAC has been provided by national institutions, in particular the institutions participating in the Gaia Multilateral Agreement. This work made use of tpfplotter by J. Lillo-Box (publicly available in www.github.com/jlillo/tpfplotter), which also made use of the python packages astropy, lightkurve, matplotlib and numpy.
References
- Akeson et al. (2013) Akeson, R. L., Chen, X., Ciardi, D., et al. 2013, PASP, 125, 989, doi: 10.1086/672273
- Allard et al. (2012a) Allard, F., Homeier, D., & Freytag, B. 2012a, Philosophical Transactions of the Royal Society of London Series A, 370, 2765, doi: 10.1098/rsta.2011.0269
- Allard et al. (2013) Allard, F., Homeier, D., Freytag, B., Schaffenberger, W., & Rajpurohit, A. S. 2013, Memorie della Societa Astronomica Italiana Supplementi, 24, 128, doi: 10.48550/arXiv.1302.6559
- Allard et al. (2012b) Allard, F., Homeier, D., Freytag, B., & Sharp, C. M. 2012b, in EAS Publications Series, Vol. 57, EAS Publications Series, ed. C. Reylé, C. Charbonnel, & M. Schultheis, 3–43, doi: 10.1051/eas/1257001
- Aller et al. (2020) Aller, A., Lillo-Box, J., Jones, D., Miranda, L. F., & Barceló Forteza, S. 2020, A&A, 635, A128, doi: 10.1051/0004-6361/201937118
- Alvarado-Montes (2022) Alvarado-Montes, J. A. 2022, MNRAS, 517, 2831, doi: 10.1093/mnras/stac2741
- Alvarado-Montes & García-Carmona (2019) Alvarado-Montes, J. A., & García-Carmona, C. 2019, MNRAS, 486, 3963, doi: 10.1093/mnras/stz1081
- Alvarado-Montes et al. (2021) Alvarado-Montes, J. A., Sucerquia, M., García-Carmona, C., et al. 2021, MNRAS, 506, 2247, doi: 10.1093/mnras/stab1081
- Anglada-Escudé et al. (2012) Anglada-Escudé, G., Boss, A. P., Weinberger, A. J., et al. 2012, ApJ, 746, 37, doi: 10.1088/0004-637X/746/1/37
- Artigau et al. (2014) Artigau, É., Kouach, D., Donati, J.-F., et al. 2014, in Society of Photo-Optical Instrumentation Engineers (SPIE) Conference Series, Vol. 9147, Ground-based and Airborne Instrumentation for Astronomy V, ed. S. K. Ramsay, I. S. McLean, & H. Takami, 914715, doi: 10.1117/12.2055663
- Artigau et al. (2022) Artigau, É., Cadieux, C., Cook, N. J., et al. 2022, AJ, 164, 84, doi: 10.3847/1538-3881/ac7ce6
- Astropy Collaboration et al. (2013) Astropy Collaboration, Robitaille, T. P., Tollerud, E. J., et al. 2013, A&A, 558, A33, doi: 10.1051/0004-6361/201322068
- Astropy Collaboration et al. (2018) Astropy Collaboration, Price-Whelan, A. M., Sipőcz, B. M., et al. 2018, AJ, 156, 123, doi: 10.3847/1538-3881/aabc4f
- Bakos et al. (2020) Bakos, G. Á., Bayliss, D., Bento, J., et al. 2020, AJ, 159, 267, doi: 10.3847/1538-3881/ab8ad1
- Baraffe et al. (2008) Baraffe, I., Chabrier, G., & Barman, T. 2008, A&A, 482, 315, doi: 10.1051/0004-6361:20079321
- Barentsen et al. (2019) Barentsen, G., Hedges, C., Vinícius, Z., et al. 2019, KeplerGO/lightkurve: Lightkurve v1.0b29, doi: 10.5281/zenodo.2565212
- Barker (2020) Barker, A. J. 2020, MNRAS, 498, 2270, doi: 10.1093/mnras/staa2405
- Barnes (2007) Barnes, S. A. 2007, ApJ, 669, 1167, doi: 10.1086/519295
- Batygin & Stevenson (2010) Batygin, K., & Stevenson, D. J. 2010, ApJ, 714, L238, doi: 10.1088/2041-8205/714/2/L238
- Beleznay & Kunimoto (2022) Beleznay, M., & Kunimoto, M. 2022, MNRAS, 516, 75, doi: 10.1093/mnras/stac2179
- Bellm et al. (2019) Bellm, E. C., Kulkarni, S. R., Graham, M. J., et al. 2019, PASP, 131, 018002, doi: 10.1088/1538-3873/aaecbe
- Benedict et al. (2016) Benedict, G. F., Henry, T. J., Franz, O. G., et al. 2016, AJ, 152, 141, doi: 10.3847/0004-6256/152/5/141
- Bensby et al. (2003) Bensby, T., Feltzing, S., & Lundström, I. 2003, A&A, 410, 527, doi: 10.1051/0004-6361:20031213
- Bensby et al. (2014) Bensby, T., Feltzing, S., & Oey, M. S. 2014, A&A, 562, A71, doi: 10.1051/0004-6361/201322631
- Bertaux et al. (2014) Bertaux, J. L., Lallement, R., Ferron, S., Boonne, C., & Bodichon, R. 2014, A&A, 564, A46, doi: 10.1051/0004-6361/201322383
- Blackwell & Shallis (1977) Blackwell, D. E., & Shallis, M. J. 1977, MNRAS, 180, 177
- Bochanski et al. (2007) Bochanski, J. J., West, A. A., Hawley, S. L., & Covey, K. R. 2007, AJ, 133, 531, doi: 10.1086/510240
- Borucki et al. (2010) Borucki, W. J., Koch, D., Basri, G., et al. 2010, Science, 327, 977, doi: 10.1126/science.1185402
- Boss (2000) Boss, A. P. 2000, ApJ, 536, L101, doi: 10.1086/312737
- Boss (2011) —. 2011, ApJ, 731, 74, doi: 10.1088/0004-637X/731/1/74
- Bouchy et al. (2001) Bouchy, F., Pepe, F., & Queloz, D. 2001, A&A, 374, 733, doi: 10.1051/0004-6361:20010730
- Boyajian et al. (2014) Boyajian, T. S., van Belle, G., & von Braun, K. 2014, AJ, 147, 47, doi: 10.1088/0004-6256/147/3/47
- Boyajian et al. (2012) Boyajian, T. S., McAlister, H. A., van Belle, G., et al. 2012, ApJ, 746, 101, doi: 10.1088/0004-637X/746/1/101
- Brown et al. (2011) Brown, D. J. A., Collier Cameron, A., Hall, C., Hebb, L., & Smalley, B. 2011, MNRAS, 415, 605, doi: 10.1111/j.1365-2966.2011.18729.x
- Brown et al. (2013) Brown, T. M., Baliber, N., Bianco, F. B., et al. 2013, PASP, 125, 1031, doi: 10.1086/673168
- Bryant et al. (2023) Bryant, E. M., Bayliss, D., & Van Eylen, V. 2023, MNRAS, doi: 10.1093/mnras/stad626
- Burdanov et al. (2022) Burdanov, A. Y., de Wit, J., Gillon, M., et al. 2022, PASP, 134, 105001, doi: 10.1088/1538-3873/ac92a6
- Burn et al. (2021) Burn, R., Schlecker, M., Mordasini, C., et al. 2021, A&A, 656, A72, doi: 10.1051/0004-6361/202140390
- Cañas et al. (2020) Cañas, C. I., Stefansson, G., Kanodia, S., et al. 2020, AJ, 160, 147, doi: 10.3847/1538-3881/abac67
- Cañas et al. (2022) Cañas, C. I., Kanodia, S., Bender, C. F., et al. 2022, AJ, 164, 50, doi: 10.3847/1538-3881/ac7804
- Cadieux et al. (2022) Cadieux, C., Doyon, R., Plotnykov, M., et al. 2022, AJ, 164, 96, doi: 10.3847/1538-3881/ac7cea
- Chambers et al. (2016) Chambers, K. C., Magnier, E. A., Metcalfe, N., et al. 2016, arXiv e-prints, arXiv:1612.05560, doi: 10.48550/arXiv.1612.05560
- Ciardi et al. (2015) Ciardi, D. R., Beichman, C. A., Horch, E. P., & Howell, S. B. 2015, ApJ, 805, 16, doi: 10.1088/0004-637X/805/1/16
- Collins et al. (2017) Collins, K. A., Kielkopf, J. F., Stassun, K. G., & Hessman, F. V. 2017, AJ, 153, 77, doi: 10.3847/1538-3881/153/2/77
- Cook et al. (2022) Cook, N. J., Artigau, É., Doyon, R., et al. 2022, PASP, 134, 114509, doi: 10.1088/1538-3873/ac9e74
- Cristofari et al. (2022) Cristofari, P. I., Donati, J. F., Masseron, T., et al. 2022, MNRAS, 511, 1893, doi: 10.1093/mnras/stab3679
- Cumming et al. (2008) Cumming, A., Butler, R. P., Marcy, G. W., et al. 2008, PASP, 120, 531, doi: 10.1086/588487
- Cutri et al. (2003) Cutri, R. M., Skrutskie, M. F., van Dyk, S., et al. 2003, 2MASS All Sky Catalog of point sources.
- Dawson & Murray-Clay (2013) Dawson, R. I., & Murray-Clay, R. A. 2013, ApJ, 767, L24, doi: 10.1088/2041-8205/767/2/L24
- Delrez et al. (2018) Delrez, L., Gillon, M., Queloz, D., et al. 2018, ArXiv e-prints. https://arxiv.org/abs/1806.11205
- Demory et al. (2020) Demory, B. O., Pozuelos, F. J., Gómez Maqueo Chew, Y., et al. 2020, A&A, 642, A49, doi: 10.1051/0004-6361/202038616
- Donati et al. (2020) Donati, J. F., Kouach, D., Moutou, C., et al. 2020, MNRAS, 498, 5684, doi: 10.1093/mnras/staa2569
- Dressing & Charbonneau (2013) Dressing, C. D., & Charbonneau, D. 2013, ApJ, 767, 95, doi: 10.1088/0004-637X/767/1/95
- Dressing & Charbonneau (2015) —. 2015, ApJ, 807, 45, doi: 10.1088/0004-637X/807/1/45
- Dunhill et al. (2013) Dunhill, A. C., Alexander, R. D., & Armitage, P. J. 2013, MNRAS, 428, 3072, doi: 10.1093/mnras/sts254
- Engle & Guinan (2018) Engle, S. G., & Guinan, E. F. 2018, Research Notes of the American Astronomical Society, 2, 34, doi: 10.3847/2515-5172/aab1f8
- Espinoza (2018) Espinoza, N. 2018, Research Notes of the American Astronomical Society, 2, 209, doi: 10.3847/2515-5172/aaef38
- Espinoza et al. (2019) Espinoza, N., Kossakowski, D., & Brahm, R. 2019, MNRAS, 490, 2262, doi: 10.1093/mnras/stz2688
- Fausnaugh et al. (2020) Fausnaugh, M. M., Burke, C. J., Ricker, G. R., & Vanderspek, R. 2020, Research Notes of the American Astronomical Society, 4, 251, doi: 10.3847/2515-5172/abd63a
- Feng et al. (2020) Feng, F., Shectman, S. A., Clement, M. S., et al. 2020, ApJS, 250, 29, doi: 10.3847/1538-4365/abb139
- Fischer & Valenti (2005) Fischer, D. A., & Valenti, J. 2005, ApJ, 622, 1102, doi: 10.1086/428383
- Foreman-Mackey et al. (2017) Foreman-Mackey, D., Agol, E., Ambikasaran, S., & Angus, R. 2017, AJ, 154, 220, doi: 10.3847/1538-3881/aa9332
- Fortney et al. (2007) Fortney, J. J., Marley, M. S., & Barnes, J. W. 2007, ApJ, 659, 1661, doi: 10.1086/512120
- Freedman et al. (2014) Freedman, R. S., Lustig-Yaeger, J., Fortney, J. J., et al. 2014, ApJS, 214, 25, doi: 10.1088/0067-0049/214/2/25
- Frelikh et al. (2019) Frelikh, R., Jang, H., Murray-Clay, R. A., & Petrovich, C. 2019, ApJ, 884, L47, doi: 10.3847/2041-8213/ab4a7b
- Fressin et al. (2013) Fressin, F., Torres, G., Charbonneau, D., et al. 2013, ApJ, 766, 81, doi: 10.1088/0004-637X/766/2/81
- Fukui et al. (2011) Fukui, A., Narita, N., Tristram, P. J., et al. 2011, PASJ, 63, 287, doi: 10.1093/pasj/63.1.287
- Fulton et al. (2018) Fulton, B. J., Petigura, E. A., Blunt, S., & Sinukoff, E. 2018, PASP, 130, 044504, doi: 10.1088/1538-3873/aaaaa8
- Furlan & Howell (2017) Furlan, E., & Howell, S. B. 2017, AJ, 154, 66, doi: 10.3847/1538-3881/aa7b70
- Furlan & Howell (2020) —. 2020, ApJ, 898, 47, doi: 10.3847/1538-4357/ab9c9c
- Gagné et al. (2018) Gagné, J., Mamajek, E. E., Malo, L., et al. 2018, ApJ, 856, 23, doi: 10.3847/1538-4357/aaae09
- Gaia Collaboration et al. (2023) Gaia Collaboration, Vallenari, A., Brown, A. G. A., et al. 2023, A&A, 674, A1, doi: 10.1051/0004-6361/202243940
- Gaidos et al. (2016) Gaidos, E., Mann, A. W., Kraus, A. L., & Ireland, M. 2016, MNRAS, 457, 2877, doi: 10.1093/mnras/stw097
- Gaidos et al. (2014) Gaidos, E., Mann, A. W., Lépine, S., et al. 2014, MNRAS, 443, 2561, doi: 10.1093/mnras/stu1313
- Gan et al. (2022a) Gan, T., Lin, Z., Wang, S. X., et al. 2022a, MNRAS, 511, 83, doi: 10.1093/mnras/stab3708
- Gan et al. (2022b) Gan, T., Soubkiou, A., Wang, S. X., et al. 2022b, MNRAS, 514, 4120, doi: 10.1093/mnras/stac1448
- Gan et al. (2023) Gan, T., Wang, S. X., Wang, S., et al. 2023, AJ, 165, 17, doi: 10.3847/1538-3881/ac9b12
- Garcia et al. (2021) Garcia, L. J., Timmermans, M., Pozuelos, F. J., et al. 2021, MNRAS, doi: 10.1093/mnras/stab3113
- Gizis (1997) Gizis, J. E. 1997, AJ, 113, 806, doi: 10.1086/118302
- Goldreich & Soter (1966) Goldreich, P., & Soter, S. 1966, Icarus, 5, 375, doi: 10.1016/0019-1035(66)90051-0
- Green et al. (2019) Green, G. M., Schlafly, E., Zucker, C., Speagle, J. S., & Finkbeiner, D. 2019, ApJ, 887, 93, doi: 10.3847/1538-4357/ab5362
- Hamuy et al. (1994) Hamuy, M., Suntzeff, N. B., Heathcote, S. R., et al. 1994, PASP, 106, 566, doi: 10.1086/133417
- Hamuy et al. (1992) Hamuy, M., Walker, A. R., Suntzeff, N. B., et al. 1992, PASP, 104, 533, doi: 10.1086/133028
- Henden et al. (2016) Henden, A. A., Templeton, M., Terrell, D., et al. 2016, VizieR Online Data Catalog, II/336
- Henry et al. (2006) Henry, T. J., Jao, W.-C., Subasavage, J. P., et al. 2006, AJ, 132, 2360, doi: 10.1086/508233
- Hippke & Heller (2019) Hippke, M., & Heller, R. 2019, A&A, 623, A39, doi: 10.1051/0004-6361/201834672
- Hobson et al. (2021) Hobson, M. J., Bouchy, F., Cook, N. J., et al. 2021, A&A, 648, A48, doi: 10.1051/0004-6361/202038413
- Hobson et al. (2023) Hobson, M. J., Jordán, A., Bryant, E. M., et al. 2023, ApJ, 946, L4, doi: 10.3847/2041-8213/acbd9a
- Howell et al. (2011) Howell, S. B., Everett, M. E., Sherry, W., Horch, E., & Ciardi, D. R. 2011, AJ, 142, 19, doi: 10.1088/0004-6256/142/1/19
- Howell & Furlan (2022) Howell, S. B., & Furlan, E. 2022, Frontiers in Astronomy and Space Sciences, 9, 871163, doi: 10.3389/fspas.2022.871163
- Howell et al. (2021) Howell, S. B., Matson, R. A., Ciardi, D. R., et al. 2021, AJ, 161, 164, doi: 10.3847/1538-3881/abdec6
- Huang et al. (2016) Huang, C., Wu, Y., & Triaud, A. H. M. J. 2016, ApJ, 825, 98, doi: 10.3847/0004-637X/825/2/98
- Huang et al. (2020a) Huang, C. X., Vanderburg, A., Pál, A., et al. 2020a, Research Notes of the American Astronomical Society, 4, 204, doi: 10.3847/2515-5172/abca2e
- Huang et al. (2020b) —. 2020b, Research Notes of the American Astronomical Society, 4, 206, doi: 10.3847/2515-5172/abca2d
- Husser et al. (2013) Husser, T.-O., Wende-von Berg, S., Dreizler, S., et al. 2013, A&A, 553, A6, doi: 10.1051/0004-6361/201219058
- Ida & Lin (2005) Ida, S., & Lin, D. N. C. 2005, ApJ, 626, 1045, doi: 10.1086/429953
- Irwin et al. (2009) Irwin, J., Charbonneau, D., Nutzman, P., & Falco, E. 2009, in Transiting Planets, Vol. 253, 37–43, doi: 10.1017/S1743921308026215
- Jehin et al. (2018) Jehin, E., Gillon, M., Queloz, D., et al. 2018, The Messenger, 174, 2, doi: 10.18727/0722-6691/5105
- Jensen (2013) Jensen, E. 2013, Tapir: A web interface for transit/eclipse observability. http://ascl.net/1306.007
- Johnson & Soderblom (1987) Johnson, D. R. H., & Soderblom, D. R. 1987, AJ, 93, 864, doi: 10.1086/114370
- Jordán et al. (2022) Jordán, A., Hartman, J. D., Bayliss, D., et al. 2022, AJ, 163, 125, doi: 10.3847/1538-3881/ac4a77
- Kagetani et al. (2023) Kagetani, T., Narita, N., Kimura, T., et al. 2023, PASJ, doi: 10.1093/pasj/psad031
- Kanodia et al. (2022) Kanodia, S., Libby-Roberts, J., Cañas, C. I., et al. 2022, AJ, 164, 81, doi: 10.3847/1538-3881/ac7c20
- Kanodia et al. (2023) Kanodia, S., Mahadevan, S., Libby-Roberts, J., et al. 2023, AJ, 165, 120, doi: 10.3847/1538-3881/acabce
- Kempton et al. (2018) Kempton, E. M. R., Bean, J. L., Louie, D. R., et al. 2018, PASP, 130, 114401, doi: 10.1088/1538-3873/aadf6f
- Kennedy & Kenyon (2008) Kennedy, G. M., & Kenyon, S. J. 2008, ApJ, 673, 502, doi: 10.1086/524130
- Kiefer et al. (2023) Kiefer, F., Hébrard, G., Martioli, E., et al. 2023, A&A, 670, A136, doi: 10.1051/0004-6361/202245129
- Kipping (2013) Kipping, D. M. 2013, MNRAS, 435, 2152, doi: 10.1093/mnras/stt1435
- Kramida et al. (2022) Kramida, A., Ralchenko, Y., Reader, J., & NIST ASD Team. 2022, NIST Atomic Spectra Database (version 5.10), doi: 10.18434/T4W30F
- Kreidberg (2015) Kreidberg, L. 2015, PASP, 127, 1161, doi: 10.1086/683602
- Kunimoto et al. (2022) Kunimoto, M., Daylan, T., Guerrero, N., et al. 2022, ApJS, 259, 33, doi: 10.3847/1538-4365/ac5688
- Laughlin et al. (2004) Laughlin, G., Bodenheimer, P., & Adams, F. C. 2004, ApJ, 612, L73, doi: 10.1086/424384
- Leconte et al. (2010) Leconte, J., Chabrier, G., Baraffe, I., & Levrard, B. 2010, A&A, 516, A64, doi: 10.1051/0004-6361/201014337
- Lépine et al. (2013) Lépine, S., Hilton, E. J., Mann, A. W., et al. 2013, AJ, 145, 102, doi: 10.1088/0004-6256/145/4/102
- Lépine et al. (2003) Lépine, S., Rich, R. M., & Shara, M. M. 2003, AJ, 125, 1598, doi: 10.1086/345972
- Lester et al. (2021) Lester, K. V., Matson, R. A., Howell, S. B., et al. 2021, AJ, 162, 75, doi: 10.3847/1538-3881/ac0d06
- Li et al. (2021) Li, J., Lai, D., Anderson, K. R., & Pu, B. 2021, MNRAS, 501, 1621, doi: 10.1093/mnras/staa3779
- Li et al. (2010) Li, S. L., Agnor, C. B., & Lin, D. N. C. 2010, ApJ, 720, 1161, doi: 10.1088/0004-637X/720/2/1161
- Lightkurve Collaboration et al. (2018) Lightkurve Collaboration, Cardoso, J. V. d. M. a., Hedges, C., et al. 2018, Lightkurve: Kepler and TESS time series analysis in Python. http://ascl.net/1812.013
- Lin et al. (1996) Lin, D. N. C., Bodenheimer, P., & Richardson, D. C. 1996, Nature, 380, 606, doi: 10.1038/380606a0
- Liu & Ji (2020) Liu, B., & Ji, J. 2020, Research in Astronomy and Astrophysics, 20, 164, doi: 10.1088/1674-4527/20/10/164
- Liu et al. (2019) Liu, B., Lambrechts, M., Johansen, A., & Liu, F. 2019, A&A, 632, A7, doi: 10.1051/0004-6361/201936309
- Liu et al. (2015) Liu, S.-F., Agnor, C. B., Lin, D. N. C., & Li, S.-L. 2015, MNRAS, 446, 1685, doi: 10.1093/mnras/stu2205
- Mamajek & Hillenbrand (2008) Mamajek, E. E., & Hillenbrand, L. A. 2008, ApJ, 687, 1264, doi: 10.1086/591785
- Mann et al. (2013) Mann, A. W., Brewer, J. M., Gaidos, E., Lépine, S., & Hilton, E. J. 2013, AJ, 145, 52, doi: 10.1088/0004-6256/145/2/52
- Mann et al. (2015) Mann, A. W., Feiden, G. A., Gaidos, E., Boyajian, T., & von Braun, K. 2015, ApJ, 804, 64, doi: 10.1088/0004-637X/804/1/64
- Mann et al. (2016) Mann, A. W., Newton, E. R., Rizzuto, A. C., et al. 2016, AJ, 152, 61, doi: 10.3847/0004-6256/152/3/61
- Mann et al. (2019) Mann, A. W., Dupuy, T., Kraus, A. L., et al. 2019, ApJ, 871, 63, doi: 10.3847/1538-4357/aaf3bc
- Mao & Paczynski (1991) Mao, S., & Paczynski, B. 1991, ApJ, 374, L37, doi: 10.1086/186066
- Marley et al. (2007) Marley, M. S., Fortney, J. J., Hubickyj, O., Bodenheimer, P., & Lissauer, J. J. 2007, ApJ, 655, 541, doi: 10.1086/509759
- Marshall et al. (2008) Marshall, J. L., Burles, S., Thompson, I. B., et al. 2008, in Society of Photo-Optical Instrumentation Engineers (SPIE) Conference Series, Vol. 7014, Society of Photo-Optical Instrumentation Engineers (SPIE) Conference Series, doi: 10.1117/12.789972
- Martioli et al. (2022) Martioli, E., Hébrard, G., Fouqué, P., et al. 2022, A&A, 660, A86, doi: 10.1051/0004-6361/202142540
- Masci et al. (2019) Masci, F. J., Laher, R. R., Rusholme, B., et al. 2019, PASP, 131, 018003, doi: 10.1088/1538-3873/aae8ac
- Matson et al. (2018) Matson, R. A., Howell, S. B., Horch, E. P., & Everett, M. E. 2018, AJ, 156, 31, doi: 10.3847/1538-3881/aac778
- Mayor et al. (2011) Mayor, M., Marmier, M., Lovis, C., et al. 2011, arXiv e-prints, arXiv:1109.2497. https://arxiv.org/abs/1109.2497
- McCormac et al. (2019) McCormac, J., Gillen, E., Jackman, J. A. G., et al. 2019, arXiv e-prints, arXiv:1909.12424. https://arxiv.org/abs/1909.12424
- McCully et al. (2018) McCully, C., Volgenau, N. H., Harbeck, D.-R., et al. 2018, in Society of Photo-Optical Instrumentation Engineers (SPIE) Conference Series, Vol. 10707, Software and Cyberinfrastructure for Astronomy V, 107070K, doi: 10.1117/12.2314340
- McLaughlin (1924) McLaughlin, D. B. 1924, ApJ, 60, 22, doi: 10.1086/142826
- McQuillan et al. (2014) McQuillan, A., Mazeh, T., & Aigrain, S. 2014, ApJS, 211, 24, doi: 10.1088/0067-0049/211/2/24
- Morales et al. (2019) Morales, J. C., Mustill, A. J., Ribas, I., et al. 2019, Science, 365, 1441, doi: 10.1126/science.aax3198
- Mulders et al. (2021) Mulders, G. D., Drażkowska, J., van der Marel, N., Ciesla, F. J., & Pascucci, I. 2021, ApJ, 920, L1, doi: 10.3847/2041-8213/ac2947
- Narita et al. (2015) Narita, N., Fukui, A., Kusakabe, N., et al. 2015, Journal of Astronomical Telescopes, Instruments, and Systems, 1, 045001, doi: 10.1117/1.JATIS.1.4.045001
- Newton et al. (2014) Newton, E. R., Charbonneau, D., Irwin, J., et al. 2014, AJ, 147, 20, doi: 10.1088/0004-6256/147/1/20
- Newton et al. (2016) Newton, E. R., Irwin, J., Charbonneau, D., et al. 2016, ApJ, 821, 93, doi: 10.3847/0004-637X/821/2/93
- Newton et al. (2018) Newton, E. R., Mondrik, N., Irwin, J., Winters, J. G., & Charbonneau, D. 2018, AJ, 156, 217, doi: 10.3847/1538-3881/aad73b
- Petigura et al. (2013) Petigura, E. A., Howard, A. W., & Marcy, G. W. 2013, Proceedings of the National Academy of Science, 110, 19273, doi: 10.1073/pnas.1319909110
- Petigura et al. (2018) Petigura, E. A., Marcy, G. W., Winn, J. N., et al. 2018, AJ, 155, 89, doi: 10.3847/1538-3881/aaa54c
- Pollack et al. (1996) Pollack, J. B., Hubickyj, O., Bodenheimer, P., et al. 1996, Icarus, 124, 62, doi: 10.1006/icar.1996.0190
- Prochaska et al. (2020) Prochaska, J. X., Hennawi, J. F., Westfall, K. B., et al. 2020, Journal of Open Source Software, 5, 2308, doi: 10.21105/joss.02308
- Prochaska et al. (2020) Prochaska, J. X., Hennawi, J., Cooke, R., et al. 2020, pypeit/PypeIt: Release 1.0.0, v1.0.0, Zenodo, doi: 10.5281/zenodo.3743493
- Rasio & Ford (1996) Rasio, F. A., & Ford, E. B. 1996, Science, 274, 954, doi: 10.1126/science.274.5289.954
- Reid et al. (1995) Reid, I. N., Hawley, S. L., & Gizis, J. E. 1995, AJ, 110, 1838, doi: 10.1086/117655
- Ricker et al. (2015) Ricker, G. R., Winn, J. N., Vanderspek, R., et al. 2015, Journal of Astronomical Telescopes, Instruments, and Systems, 1, 014003, doi: 10.1117/1.JATIS.1.1.014003
- Rivera et al. (2010) Rivera, E. J., Laughlin, G., Butler, R. P., et al. 2010, ApJ, 719, 890, doi: 10.1088/0004-637X/719/1/890
- Rossiter (1924) Rossiter, R. A. 1924, ApJ, 60, 15, doi: 10.1086/142825
- Santos et al. (2004) Santos, N. C., Israelian, G., & Mayor, M. 2004, A&A, 415, 1153, doi: 10.1051/0004-6361:20034469
- Schlecker et al. (2022) Schlecker, M., Burn, R., Sabotta, S., et al. 2022, A&A, 664, A180, doi: 10.1051/0004-6361/202142543
- Schlegel et al. (1998) Schlegel, D. J., Finkbeiner, D. P., & Davis, M. 1998, ApJ, 500, 525, doi: 10.1086/305772
- Scott et al. (2021) Scott, N. J., Howell, S. B., Gnilka, C. L., et al. 2021, Frontiers in Astronomy and Space Sciences, 8, 138, doi: 10.3389/fspas.2021.716560
- Sebastian et al. (2021) Sebastian, D., Gillon, M., Ducrot, E., et al. 2021, A&A, 645, A100, doi: 10.1051/0004-6361/202038827
- Sousa et al. (2011) Sousa, S. G., Santos, N. C., Israelian, G., Mayor, M., & Udry, S. 2011, A&A, 533, A141, doi: 10.1051/0004-6361/201117699
- Speagle (2020) Speagle, J. S. 2020, MNRAS, 493, 3132, doi: 10.1093/mnras/staa278
- Stassun et al. (2017) Stassun, K. G., Collins, K. A., & Gaudi, B. S. 2017, AJ, 153, 136, doi: 10.3847/1538-3881/aa5df3
- Stassun & Torres (2016) Stassun, K. G., & Torres, G. 2016, AJ, 152, 180, doi: 10.3847/0004-6256/152/6/180
- Stassun & Torres (2018) —. 2018, ApJ, 862, 61, doi: 10.3847/1538-4357/aacafc
- Stassun & Torres (2021) —. 2021, ApJ, 907, L33, doi: 10.3847/2041-8213/abdaad
- Stassun et al. (2019) Stassun, K. G., Oelkers, R. J., Paegert, M., et al. 2019, AJ, 158, 138, doi: 10.3847/1538-3881/ab3467
- Stefànsson et al. (2022) Stefànsson, G., Mahadevan, S., Petrovich, C., et al. 2022, ApJ, 931, L15, doi: 10.3847/2041-8213/ac6e3c
- Suzuki et al. (2016) Suzuki, D., Bennett, D. P., Sumi, T., et al. 2016, ApJ, 833, 145, doi: 10.3847/1538-4357/833/2/145
- Thorngren et al. (2016) Thorngren, D. P., Fortney, J. J., Murray-Clay, R. A., & Lopez, E. D. 2016, ApJ, 831, 64, doi: 10.3847/0004-637X/831/1/64
- Tian et al. (2015) Tian, H.-J., Liu, C., Carlin, J. L., et al. 2015, ApJ, 809, 145, doi: 10.1088/0004-637X/809/2/145
- Vazan et al. (2015) Vazan, A., Helled, R., Kovetz, A., & Podolak, M. 2015, ApJ, 803, 32, doi: 10.1088/0004-637X/803/1/32
- Vazan et al. (2013) Vazan, A., Kovetz, A., Podolak, M., & Helled, R. 2013, MNRAS, 434, 3283, doi: 10.1093/mnras/stt1248
- Wang et al. (2021) Wang, S., Lin, D. N. C., Zheng, X., & Ji, J. 2021, AJ, 161, 77, doi: 10.3847/1538-3881/abcfb9
- Wang et al. (2022) Wang, S. X., Latouf, N., Plavchan, P., et al. 2022, AJ, 164, 211, doi: 10.3847/1538-3881/ac947a
- Wang et al. (2018) Wang, W., Wang, L., Li, X., Chen, Y., & Zhao, G. 2018, ApJ, 860, 136, doi: 10.3847/1538-4357/aac2cd
- Winn & Fabrycky (2015) Winn, J. N., & Fabrycky, D. C. 2015, ARA&A, 53, 409, doi: 10.1146/annurev-astro-082214-122246
- Wittenmyer et al. (2020) Wittenmyer, R. A., Wang, S., Horner, J., et al. 2020, MNRAS, 492, 377, doi: 10.1093/mnras/stz3436
- Wright et al. (2010) Wright, E. L., Eisenhardt, P. R. M., Mainzer, A. K., et al. 2010, AJ, 140, 1868, doi: 10.1088/0004-6256/140/6/1868
- Wright et al. (2012) Wright, J. T., Marcy, G. W., Howard, A. W., et al. 2012, ApJ, 753, 160, doi: 10.1088/0004-637X/753/2/160
- Wu et al. (2023) Wu, D.-H., Rice, M., & Wang, S. 2023, AJ, 165, 171, doi: 10.3847/1538-3881/acbf3f
- Zechmeister & Kürster (2009) Zechmeister, M., & Kürster, M. 2009, A&A, 496, 577, doi: 10.1051/0004-6361:200811296
- Zhou et al. (2019) Zhou, G., Huang, C. X., Bakos, G. Á., et al. 2019, AJ, 158, 141, doi: 10.3847/1538-3881/ab36b5
- Zhou & Lin (2007) Zhou, J.-L., & Lin, D. N. C. 2007, ApJ, 666, 447, doi: 10.1086/520043