††footnotetext: All experiments were implemented in Pytorch and Pytorch-Lightning, using a NVIDIA GeForce RTX 2080 Ti GPU.
Table 1: Demographic and clinical characteristics of the two datasets M(IQR), median, interquartile range; GOLD, Global Initiative for Chronic Obstructive Lung Disease
Demographic characteristics
COPDGene
COSYCONET
Age, Years, M (IQR)
63 (56 - 69)
66 (42 - 71)
Sex, % male (n)
54.1 (2836)
60.4 (278)
BMI, mean (SD)
28.5 (5.8)
26.6 (4.8)
%GOLD 1, % (n)
56.9 (2986)
85.2 (392)
Number of patches per patient, M (IQR)
0% config
319 (267 - 382)
308 (250 - 363)
20% config
5622 (523 - 745)
635 (521 - 747)
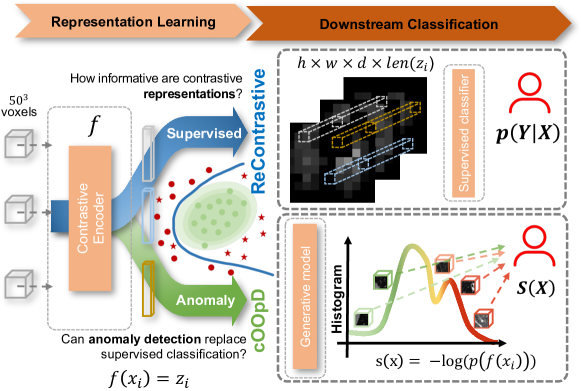
Figure 1: Pre-processed unlabeled patches are extracted and fed to a self-supervised contrastive task. Output representations value is address with ReContrastive, that maps the representations back to the original image and feeds it to a supervised classifier, whereas cOOpD allows for a reformulation of the task as anomaly detection.
Table 2: Influence of setting a maximum number of patches per patient (PpP) (N=100, 200, maximum available) on training the contrastive task (Section 2.1), evaluated in the ReContrastive ablation.
For comparable results, a maximum number of steps was set to 200000 and the validation data was set to fixed 300 patches.
For simplicity, inspiratory images with 0% patch overlap were used as input.
Our results show that the higher the number of patches, the higher the pretext task training loss. Regarding the evaluation on the downstream task, the highest performance is achieved for the experiment with the least amount of patches (N=100). ACC: accuracy
Max. # of PpP
ACC
AUROC
Precision
Recall
Val loss pretext
100
79.7
79.5
86.6
69.1
0.476
200
78.0
77.8
89.5
62.8
0.512
all
75.4
75.4
87.4
59.3
0.618
Table 3: This end-to-end supervised patch binary classifier (PatClass) receives a 3D patch as input, which label corresponds to the patient label (0 or 1), and outputs a patch probability. Patient-level classification is obtained by aggregating the patch probabilities with a Recurrent Neural Network (RNN) as described in [5] which showed to be the best performing method on the validation set.
Network & Hyperparameters
Value
Architecture
3D-ResNet34
Batch size
64
N epochs
100
Optimization
Adam optimizer, learning rate 1e-4 and Cosine Annealing, weight decay 1e-5
Loss
Cross Entropy Loss
Transformations and probability
5% elastic deformation, rotation, scaling, random crop, mirroring, gaussian noise and gaussian blur
Table 4: MIL + RNN implementation details. Implementation was as described in [5], except for the bellow hyperparameters. In our case, a slide corresponds to a patient and a tile to 3D patch.
Network & Hyperparameters
Batch size
N epochs
MIL (3D-ResNet34)
480
200
RNN-10
128
200
Table 5: Mean ± standard deviation of the AUROC in % of 3 runs on the internal (COPDGene) validation set for the best configuration (ResNet34 with 20% patch-overlap on the inspiratory + registered inspiratory). Best aggregation result is highlighted in bold and was then the only tested on the internal and external testsets.