DAMIC-M Collaboration
Search for Daily Modulation of MeV Dark Matter Signals with DAMIC-M
Abstract
Dark Matter (DM) particles with sufficiently large cross sections may scatter as they travel through Earth’s bulk. The corresponding changes in the DM flux give rise to a characteristic daily modulation signal in detectors sensitive to DM-electron interactions. Here, we report results obtained from the first underground operation of the DAMIC-M prototype detector searching for such a signal from DM with MeV-scale mass. A model-independent analysis finds no modulation in the rate of 1 events with periods in the range 1-48 h. We then use these data to place exclusion limits on DM in the mass range [0.53, 2.7] MeV/c2 interacting with electrons via a dark photon mediator. Taking advantage of the time-dependent signal we improve by 2 orders of magnitude on our previous limit obtained from the total rate of 1 events, using the same data set. This daily modulation search represents the current strongest limit on DM-electron scattering via ultralight mediators for DM masses around 1 MeV/c2.
Introduction.— There are numerous astrophysical and cosmological observations supporting the existence of a non-baryonic and non-luminous form of matter [1], known as dark matter (DM). Despite a wealth of experimental efforts to detect DM through its non-gravitational interactions [2, 3, 4], its identity remains unknown. DM particles with MeV-scale masses are viable candidates that appear in a range of natural, well-motivated scenarios [5, 6, 7, 6, 8, 9]. However, their discovery remains challenging since such light particles do not have sufficient kinetic energy to produce detectable nuclear recoils in direct-detection experiments [10]. Instead, DM-electron scattering would produce eV-scale electronic recoils, which would be observed in semiconductor-based detectors with (1 eV) ionization thresholds [11]. To date, the sensitivity of semiconductor searches [12, 13, 14, 15, 16] has been partly limited by background levels [17]. A time-dependent DM signal detected above a time-independent background can significantly increase the sensitivity of these searches.
Various phenomena give rise to daily-modulated DM signals in direct searches, including the variation of the velocity of the lab frame due to the Earth’s rotation [18], gravitational focusing of the DM flux by the Earth [19, 20, 18], and anisotropy in the response of the target material [21, 22, 23, 24, 25]. Furthermore, if the DM scattering cross-section is sufficiently large, the velocity distribution of DM particles at the detector may be distorted by their interactions in the Earth [26, 27, 28]. Over the course of a sidereal day, the position of the detector rotates with respect to the incoming DM flux. Thus, the DM particles will travel a greater or smaller distance across the Earth at different times, leading to a daily modulation.
Most experimental searches for daily modulations [29, 30, 31, 32] have targeted DM particles interacting with nuclei. Here, we focus on models with MeV-scale DM, which may be coupled to Standard Model particles via a kinetically-mixed dark photon [33, 34], and thus interact with electrons. For DM-electron scattering cross-sections currently within reach of semiconductor searches, interactions in the Earth may be substantial [35], which motivate the search for a daily modulated signal on top of a constant background [36, 37].
In this letter, we present a search for a daily modulated signal with a prototype of the DAMIC-M (Dark Matter in CCDs at Modane) experiment [38]. We first perform a model-independent search for modulations over a wide range of periods. We then report limits on DM particles with MeV-scale masses interacting with electrons, which incorporate, for the first time with an underground detector, a time-dependent analysis to provide a powerful discriminant between signal and background.
Setup and data.—The DAMIC-M experiment will feature 200 skipper charge-coupled devices (CCDs), for a target silicon mass of 700 g, installed under the French Alps at the Laboratoire Souterrain de Modane (LSM). DAMIC-M is sensitive to ionization signals of just a few electrons thanks to the extremely low level of dark current and the sub-electron readout noise of the devices. By operating prototype CCDs at LSM in the Low Background Chamber (LBC) we obtained world-leading limits on sub-GeV DM particles interacting with electrons [16]. The daily modulation results reported here are obtained with the same apparatus and data set, which are summarized in the following.
Two high-resistivity, (10 k cm) -type silicon CCDs [39, 40, 41] are installed in the LBC. Each CCD has pixels (pixel area m2) and is m thick, for a mass of g. The detectors are mounted in a high-purity copper box, which also shields infrared radiation. A lead shield of cm thickness, with the innermost 2 cm of ancient origin, encloses the copper box inside the LBC cryostat. An additional 15 cm of lead and 20 cm of high density polyethylene surround the cryostat to shield from environmental radiation. The measured background is events/keV/kg/day, consistent with expectations. The CCDs are kept at a temperature of K inside the vacuum cryostat at mbar.
Charge carriers produced by ionizing radiation in the silicon bulk of the CCD drift towards the - plane where pixels are located. Thermal diffusion while drifting results in a spatial variance, , of the charge collected in contiguous pixels [42]. In the readout process, the pixel charge is moved across the array by appropriate voltage clocking and read out serially by two amplifiers (referred as U and L) located at the corners of the CCD at the end of the serial register. These skipper amplifiers [43, 44, 45] allow for multiple non-destructive measurements (NDCMs) of the pixel charge. Sub-electron resolution is achieved by averaging a sufficient number () of NDCMs, with the resolution improving as . The performance of DAMIC-M CCDs is detailed in Ref. [46].
For this analysis we use 63 days of uninterrupted data-taking beginning on June 8th 2022 (the SR2 data set in Ref. [16]). Relevant CCD operating parameters include , corresponding to a pixel charge resolution of , and a pixel binning. In subsequent text, the term pixel is used to describe a bin of pixels from which charge is summed before being read out. To minimize dark current counts, only a fraction of the CCD is read out ( pixels), and its charge is cleared between consecutive images.
Image data reduction and pixel selection criteria are detailed in Ref. [16]. In brief, images are first calibrated from the fitted position of the 0 and 1 peaks in the pixel charge distribution. Then contiguous pixels with charge are joined into clusters. Those with total charge 7 are excluded from further analysis since they are unlikely to be produced by sub-GeV DM interactions with electrons. For each cluster we also exclude 10 trailing pixels in the horizontal and vertical directions to account for charge transfer inefficiencies. Defects in the CCDs may release charge during the readout, appearing in the images as “hot” pixels and columns [47]. These are identified by their increased rate of pixels with 1, and rejected. Lastly, we exclude one of the prototype CCDs due to the presence of several charge traps in the serial register (identified by a decreased rate of pixels with 1). A portion of the remaining CCD is also excluded for the same reason. The final integrated exposure after applying these selection criteria is 39.97 g-days, distributed over images.
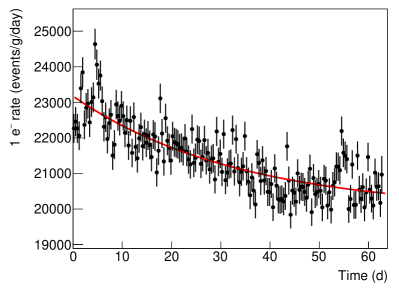
For each image the charge distribution of the selected pixels is fitted with the sum of two Gaussian functions corresponding to the 0 and 1 peaks. The number of pixels with 1 charge, , and its uncertainty are then obtained from the fitted parameters. The U and L sides of the image are fitted independently to account for small differences in the calibration and resolution of the amplifiers. We find the value of to be 80 and 30 pixels/image for the U and L amplifier, respectively. The difference in counts is due to a large portion of the L side being excluded by the serial register trap criteria. Corresponding rates of 1, , are then obtained dividing by the effective image exposure time ( days) and target mass after pixel selection. For each image the relative uncertainty is for the U (L) side. This set of 1 rates, measured every 10 min for 63 consecutive days, is used to search for a daily modulation.
The rate for the U side is shown as a function of time in Fig. 1. The rate is well-parameterized by a constant plus an exponential with time decay constant days. The L side has the same behavior. Since 1 day, a daily modulation analysis is largely unaffected. The observed time dependence is consistent with the dark current stabilizing over time, a characteristic of these types of devices.
Model-independent search for a daily modulation.—We first perform a model-independent analysis by fitting the measured rates to a function where and parameterize the exponential time dependence observed in the data, and and are the modulation amplitude, period and phase. This simplified model approximates a periodic signal with the first term of its Fourier expansion. We use a binned likelihood method to test the null hypothesis, absence of modulation, corresponding to . The likelihood function is
| (1) |
where is the set of model parameters and is the solar time when image was taken. The spread in the arrival time of the events within each image has negligible impact for the range of periods explored. The likelihood of the no-modulation hypothesis is found by maximizing Eq. (1) under the constraint , , while the global maximum for a given period is . The likelihood-ratio test statistic for the hypothesis is given by . The local significance of a departure from the hypothesis for any given period can then be quantified by the value of [48].
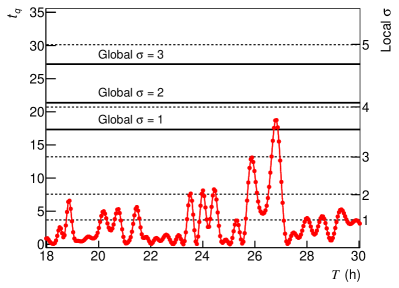
In Fig. 2 we show the value of the test statistic and the corresponding local significance as a function of in a range around 24 h. Global significances, calculated by examining the distribution of the maximum value of the test statistic under [49], are also shown in Fig. 2. We find that the measured rate is consistent with the null hypothesis (no-modulation) for periods close to 24 h, as well as over the wider range 1-48 h (not shown in Fig. 2). This null result indicates the lack of a discernible DM signal, and demonstrates the stability of our detectors over a time scale of days.
DM- scattering.—In this section, we introduce a new approach for constraining DM- scattering, which exploits the expected daily modulation due to DM interactions within the Earth. The rate of DM- scattering in a semiconductor is obtained by convolving the scattering cross-section with the DM velocity distribution at the detector and with the crystal form factor [11, 50, 51]:
| (2) | ||||
Here, is a reference DM- scattering cross-section, is the energy deposited as ionization and is the momentum transfer. We consider a model of DM which couples to Standard Model particles via a kinetically mixed dark photon. In this case, the DM form factor depends on the mass of the mediator , with for a heavy mediator () and for ultralight mediators () [35].
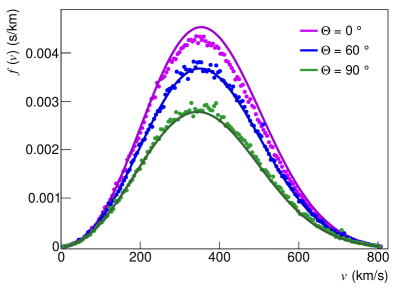
The velocity distribution of DM is expected to follow a Maxwell-Boltzmann distribution in the Galactic frame [52]111We use the Standard Halo Model [76] parameters with the Earth’s velocity fixed to its average value during the data-taking period, km/s.. The velocity distribution at the detector is obtained by boosting into the rest-frame of the laboratory, which is moving at a velocity . Here, is the velocity of the Sun in the Galactic frame, the Earth’s velocity in the Solar frame [54], and is the rotational velocity of the lab in an Earth-centered inertial frame [55, App. A]. The velocity distribution at the detector is therefore always time-dependent due to the Earth’s motion.
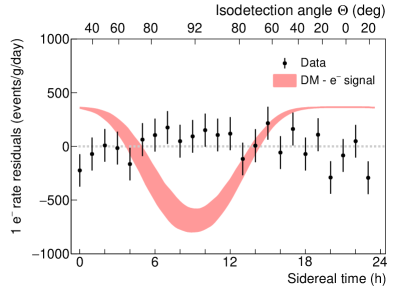
If the DM-scattering cross section is sufficiently large, however, the flux of DM may also be distorted by scattering of particles in the Earth before they reach the detector. The velocity distribution then depends on the isodetection angle [55], defined as the angle between the local zenith and the direction of the mean DM flux . For , the mean DM flux comes from directly above the detector, while at , it comes from directly below. The isodetection angle oscillates over a sidereal day with the Earth’s rotation, and thus the expected DM flux. During the data-taking period the isodetection angle at LSM ( N) varied in the range .
Depending on the regime of interest, a number of formalisms have been developed to estimate the DM flux at the detector as a function of , taking into account Earth-scattering (e.g. [56, 36, 57, 58, 55, 59, 60]). Here, we employ a modified version of the Verne code [61, 62]222Note that Verne uses an alternative convention for the isodetection angle ., which assumes that light DM particles travel along straight-line trajectories and either continue unaffected or are reflected back along their incoming path when they scatter [64]. DM scattering with Earth nuclei, implemented in Verne with charge-screening [35], is the dominant process for daily modulation effects. Since each corresponds to a 333Note that the isodetection angle corresponding to a given time in a sidereal day changes by several degrees during the data taking period, this code allows us to efficiently calculate over a wide range of parameter space.
We search for a daily modulation of the rate by performing an unbinned likelihood fit with Eq. (1), where includes both the background and signal model. For the background we use a Poisson model, , which gives the probability of measuring charges in a pixel given a dark current . As shown in Fig. 1, the dark current in our data stabilizes with an exponential decrease in time. Thus, we model the time-dependent dark current as , where and are the amplitude and time constant of the exponential decay of the dark current, and is its value once stabilized. The signal model, , gives the probability that charges are measured in a pixel for DM particles of mass and cross section ; the time dependence in accounts for the expected daily modulation. The fitting function in Eq. (1) is then:
| (3) |
where is the mass of one CCD pixel and are free parameters in the fit.
The DM signal is computed with Eq. (2) using QEDark [11] for the crystal form factor , which encodes the electronic response of the target. To convert the energy deposited in the DM interaction to electron-hole pairs, we use a semi-empirical model based on probabilities from the charge yield model in Ref. [73]. A Monte Carlo simulation of the charge diffusion process is then applied to include the detector response, with obtained from a surface laboratory calibration with cosmic rays [74, 16]. Lastly, a binning of the simulated pixel array is applied to match the data-taking conditions.
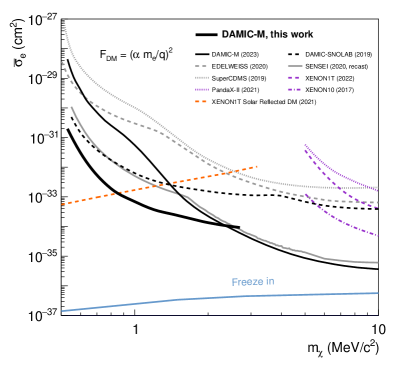
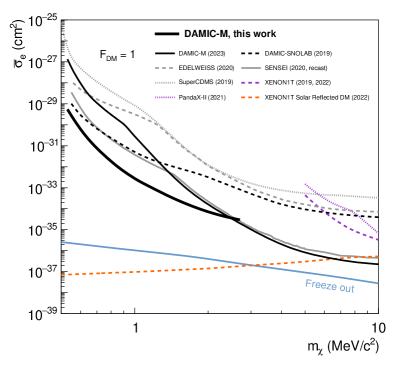
We minimize the joint log-likelihood for the U and L sides at fixed DM masses between 0.53 and 2.7 MeV/c2. To illustrate the sensitivity of the method, we show in Fig. 3 the residual rate after background subtraction, obtained by fitting the U-side data to the background model only. Also shown is the expectation for a DM particle of mass 1 MeV/c2 interacting via an ultralight mediator with cm2 (close to the current best limit on the cross section at this mass).
The fit finds no preference for a DM signal at any mass. Consequently, we derive exclusion limits using the likelihood-ratio test statistic , with null hypothesis given by . The corresponding 90% C.L. exclusion limits for ultralight (left) and heavy (right) mediators are shown in Fig. 4. These limits fall within the expected 68% sensitivity band as estimated by Monte Carlo simulations. Also shown are previous results from DAMIC-M and other direct detection experiments. Notably, the daily modulation analysis improves up to 2 orders of magnitude the previous DAMIC-M limits [16] obtained with the same data set. Cross-checks of the analysis are included in the Supplemental Material.
For DM masses MeV/c2 the signal is overwhelmingly comprised of 1. At higher masses the 2 signal becomes relevant in establishing the exclusion limit. However, a daily modulation analysis of the rate will not improve existing DAMIC-M limits at higher masses, since they already constrain the cross section to a level where Earth interactions are negligible. For this reason, we do not perform a full daily modulation analysis of .
Conclusions.— This DAMIC-M search for DM particles interacting with electrons excludes unexplored regions of parameter space between 0.53 and 2.7 MeV/c2. This is the first time that the daily modulation due to scattering of DM particles in the Earth, before they reach the detector, constrains DM-electron interactions. When combined with our previous limits, DAMIC-M provides the current best constraints from searches for a non-relativistic flux of DM particles incident on Earth, over the mass ranges MeV/c2 and MeV/c2 for ultralight and heavy mediator interactions, respectively 444Complementary searches for semi-relativistic DM fluxes from Solar reflection [70, 71], and cosmological [77, 78] and stellar evolution constraints [79, 80] also place limits in this mass range.. In addition, a model-independent search for modulations with period up to 48 h demonstrates the stability of our detector and allows for further improvements in time-dependent searches for a DM signal.
Acknowledgments.—We thank the LSM for their support in the installation and operation of the detector underground. The DAMIC-M project has received funding from the European Research Council (ERC) under the European Union’s Horizon 2020 research and innovation programme Grant Agreement No. 788137, and from NSF through Grant No. NSF PHY-1812654. The work at University of Chicago and University of Washington was supported through Grant No. NSF PHY-2110585. This work was supported by the Kavli Institute for Cosmological Physics at the University of Chicago through an endowment from the Kavli Foundation. We thank the College of Arts and Sciences at University of Washington for contributing the first CCDs to the DAMIC-M project. IFCA was supported by project PID2019-109829GB-I00 funded by MCIN/ AEI /10.13039/501100011033. BJK acknowledges funding from the Ramón y Cajal Grant RYC2021-034757-I, financed by MCIN/AEI/10.13039/501100011033 and by the European Union “NextGenerationEU”/PRTR. The Centro Atómico Bariloche group is supported by ANPCyT grant PICT-2018-03069. The University of Zürich was supported by the Swiss National Science Foundation. The CCD development work at Lawrence Berkeley National Laboratory MicroSystems Lab was supported in part by the Director, Office of Science, of the U.S. Department of Energy under Contract No. DE-AC02-05CH11231. We thank Teledyne DALSA Semiconductor for CCD fabrication. We acknowledge Santander Supercomputing support group at the University of Cantabria who provided access to the supercomputer Altamira at the Institute of Physics of Cantabria (IFCA-CSIC), member of the Spanish Supercomputing Network, for performing simulations.
References
- [1] G. Bertone, D. Hooper, and J. Silk, Phys. Rept. 405, 279 (2005), hep-ph/0404175.
- [2] J. M. Gaskins, Contemp. Phys. 57, 496 (2016), 1604.00014.
- [3] O. Buchmueller, C. Doglioni, and L. T. Wang, Nature Phys. 13, 217 (2017), 1912.12739.
- [4] J. Billard et al., Rept. Prog. Phys. 85, 056201 (2022), 2104.07634.
- [5] C. Boehm, P. Fayet, and J. Silk, Phys. Rev. D 69, 101302 (2004), hep-ph/0311143.
- [6] D. Hooper and K. M. Zurek, Phys. Rev. D 77, 087302 (2008), 0801.3686.
- [7] M. Pospelov, A. Ritz, and M. B. Voloshin, Phys. Lett. B 662, 53 (2008), 0711.4866.
- [8] X. Chu, T. Hambye, and M. H. G. Tytgat, JCAP 05, 034 (2012), 1112.0493.
- [9] S. Knapen, T. Lin, and K. M. Zurek, Phys. Rev. D 96, 115021 (2017), 1709.07882.
- [10] R. Essig, J. Mardon, and T. Volansky, Phys. Rev. D 85, 076007 (2012), 1108.5383.
- [11] R. Essig et al., JHEP 05, 046 (2016), 1509.01598.
- [12] SuperCDMS Collaboration, R. Agnese et al., Phys. Rev. Lett. 121, 051301 (2018), 1804.10697, [Erratum: Phys.Rev.Lett. 122, 069901 (2019)].
- [13] DAMIC Collaboration, A. Aguilar-Arevalo et al., Phys. Rev. Lett. 123, 181802 (2019), 1907.12628.
- [14] SENSEI Collaboration, L. Barak et al., Phys. Rev. Lett. 125, 171802 (2020), 2004.11378.
- [15] EDELWEISS Collaboration, Q. Arnaud et al., Phys. Rev. Lett. 125, 141301 (2020), 2003.01046.
- [16] DAMIC-M Collaboration, I. Arnquist et al., Phys. Rev. Lett. 130, 171003 (2023), 2302.02372.
- [17] P. Adari et al., SciPost Phys. Proc. 9, 001 (2022), 2202.05097.
- [18] C. Kouvaris and N. G. Nielsen, Phys. Rev. D 92, 075016 (2015), 1505.02615.
- [19] P. Sikivie and S. Wick, Phys. Rev. D 66, 023504 (2002), astro-ph/0203448.
- [20] M. S. Alenazi and P. Gondolo, Phys. Rev. D 74, 083518 (2006), astro-ph/0608390.
- [21] N. Bozorgnia, G. B. Gelmini, and P. Gondolo, Nuclear Instruments and Methods in Physics Research A 654, 162 (2011), 1011.6006.
- [22] N. Bozorgnia, G. B. Gelmini, and P. Gondolo, Phys. Rev. D84, 023516 (2011), 1101.2876.
- [23] S. Knapen, T. Lin, M. Pyle, and K. M. Zurek, Phys. Lett. B 785, 386 (2018), 1712.06598.
- [24] S. Griffin, S. Knapen, T. Lin, and K. M. Zurek, Phys. Rev. D 98, 115034 (2018), 1807.10291.
- [25] C. Boyd et al., (2022), 2212.04505.
- [26] J. I. Collar and F. T. Avignone, Phys. Lett. B 275, 181 (1992).
- [27] J. I. Collar and F. T. Avignone, III, Phys. Rev. D 47, 5238 (1993).
- [28] F. Hasenbalg et al., Phys. Rev. D 55, 7350 (1997), astro-ph/9702165.
- [29] R. Bernabei et al., The European Physical Journal C 74, 2827 (2014).
- [30] LUX Collaboration, D. S. Akerib et al., Phys. Rev. D 98, 062005 (2018).
- [31] PandaX-II Collaboration, X. Cui et al., Phys. Rev. Lett. 128, 171801 (2022).
- [32] PROSPECT Collaboration, M. Andriamirado et al., Phys. Rev. D 104, 012009 (2021).
- [33] B. Holdom, Physics Letters B 166, 196 (1986).
- [34] P. Galison and A. Manohar, Physics Letters B 136, 279 (1984).
- [35] T. Emken, R. Essig, C. Kouvaris, and M. Sholapurkar, JCAP 09, 070 (2019), 1905.06348.
- [36] C. Kouvaris and I. M. Shoemaker, Phys. Rev. D 90, 095011 (2014), 1405.1729.
- [37] N. Ávalos et al., Journal of Physics: Conference Series 2156, 012074 (2021).
- [38] I. Arnquist et al., The DAMIC-M Experiment: Status and First Results, 2022, arXiv:2210.12070.
- [39] S. E. Holland, Exper. Astron. 14, 83 (2002).
- [40] S. E. Holland, D. E. Groom, N. P. Palaio, R. J. Stover, and M. Wei, IEEE Transactions on Electron Devices 50, 225 (2003).
- [41] S. E. Holland, W. F. Kolbe, and C. J. Bebek, IEEE Transactions on Electron Devices 56, 2612 (2009).
- [42] DAMIC Collaboration, A. Aguilar-Arevalo et al., Phys. Rev. D 94, 082006 (2016).
- [43] J. Janesick et al., Proc. SPIE 1242, 223 (1990).
- [44] C. E. Chandler et al., Proc. SPIE 1242, 238 (1990).
- [45] J. Tiffenberg et al., Phys. Rev. Lett. 119, 131802 (2017).
- [46] DAMIC-M Collaboration, D. Norcini et al., Phys. Rev. D 106, 092001 (2022).
- [47] J. R. Janesick, Scientific charge-coupled devices (SPIE Optical Engineering Press, 2001).
- [48] G. Cowan, K. Cranmer, E. Gross, and O. Vitells, Eur. Phys. J. C 71, 1554 (2011), 1007.1727, [Erratum: Eur.Phys.J.C 73, 2501 (2013)].
- [49] E. Gross and O. Vitells, Eur. Phys. J. C 70, 525 (2010), 1005.1891.
- [50] S. K. Lee, M. Lisanti, S. Mishra-Sharma, and B. R. Safdi, Phys. Rev. D 92, 083517 (2015), 1508.07361.
- [51] S. M. Griffin, K. Inzani, T. Trickle, Z. Zhang, and K. M. Zurek, Phys. Rev. D 104, 095015 (2021), 2105.05253.
- [52] A. M. Green, J. Phys. G 44, 084001 (2017), 1703.10102.
- [53] We use the Standard Halo Model [76] parameters with the Earth’s velocity fixed to its average value during the data-taking period, km/s.
- [54] C. McCabe, JCAP 02, 027 (2014), 1312.1355.
- [55] T. Emken and C. Kouvaris, JCAP 10, 031 (2017), 1706.02249.
- [56] G. D. Starkman, A. Gould, R. Esmailzadeh, and S. K. Dimopoulos, Phys. Rev. D 41, 3594 (1990).
- [57] B. J. Kavanagh, R. Catena, and C. Kouvaris, JCAP 01, 012 (2017), 1611.05453.
- [58] M. S. Mahdawi and G. R. Farrar, JCAP 12, 004 (2017), 1709.00430.
- [59] D. Hooper and S. D. McDermott, Phys. Rev. D 97, 115006 (2018), 1802.03025.
- [60] M. S. Mahdawi and G. R. Farrar, JCAP 10, 007 (2018), 1804.03073.
- [61] B. J. Kavanagh, Phys. Rev. D 97, 123013 (2018), 1712.04901.
- [62] B. J. Kavanagh, Verne [Code, v1.3], https://github.com/bradkav/verne, DOI:10.5281/zenodo.7193430, 2017-2023.
- [63] Note that Verne uses an alternative convention for the isodetection angle .
- [64] A. Lantero-Barreda and B. J. Kavanagh, in preparation, 2023.
- [65] Note that the isodetection angle corresponding to a given time in a sidereal day changes by several degrees during the data taking period.
- [66] XENON Collaboration, E. Aprile et al., Phys. Rev. Lett. 123, 251801 (2019).
- [67] XENON Collaboration, E. Aprile et al., Phys. Rev. D 106, 022001 (2022).
- [68] PandaX-II Collaboration, C. Cheng et al., Phys. Rev. Lett. 126, 211803 (2021).
- [69] R. Essig, T. Volansky, and T.-T. Yu, Phys. Rev. D 96, 043017 (2017).
- [70] H. An, H. Nie, M. Pospelov, J. Pradler, and A. Ritz, Phys. Rev. D 104, 103026 (2021).
- [71] T. Emken, Phys. Rev. D 105, 063020 (2022), 2102.12483.
- [72] M. Battaglieri et al., US Cosmic Visions: New Ideas in Dark Matter 2017: Community Report, arXiv:1707.04591.
- [73] K. Ramanathan and N. Kurinsky, Phys. Rev. D 102, 063026 (2020).
- [74] DAMIC Collaboration, A. Aguilar-Arevalo et al., Phys. Rev. D 105, 062003 (2022).
- [75] Complementary searches for semi-relativistic DM fluxes from Solar reflection [70, 71], and cosmological [77, 78] and stellar evolution constraints [79, 80] also place limits in this mass range.
- [76] D. Baxter et al., The European Physical Journal C 81, 907 (2021).
- [77] G. Krnjaic and S. D. McDermott, Phys. Rev. D 101, 123022 (2020), 1908.00007.
- [78] C. Giovanetti, M. Lisanti, H. Liu, and J. T. Ruderman, Phys. Rev. Lett. 129, 021302 (2022), 2109.03246.
- [79] S. Davidson, S. Hannestad, and G. Raffelt, JHEP 05, 003 (2000), hep-ph/0001179.
- [80] J. H. Chang, R. Essig, and S. D. McDermott, JHEP 09, 051 (2018), 1803.00993.
- [81] T. Emken and C. Kouvaris, Phys. Rev. D 97, 115047 (2018), 1802.04764.
- [82] T. Emken and C. Kouvaris, Dark Matter Simulation Code for Underground Scatterings (DaMaSCUS) [Code, v1.1], https://github.com/temken/damascus, DOI:10.5281/zenodo.3726878, 2017-2020.
- [83] S. Knapen, J. Kozaczuk, and T. Lin, Phys. Rev. D 105, 015014 (2022).
- [84] S. M. Griffin, K. Inzani, T. Trickle, Z. Zhang, and K. M. Zurek, Phys. Rev. D 104, 095015 (2021).
- [85] T. Trickle, Phys. Rev. D 107, 035035 (2023).
Supplemental Material
Independent cross-checks have been performed at every step in the analysis, starting from the low-level image processing to the generation of the data pixel distribution, the identification of defects, the modeling of the DM signal, and the extraction of the DM signal upper limit. All of these checks yield consistent results.
The observed time dependence of the rate is consistent with dark current stabilizing over time, characteristic in these types of devices. To confirm this interpretation we check the time dependence of the 2 rate, , in the same data set. We sum the pixel charge distribution of 100 consecutive images to guarantee a sufficient number of pixels with 2 and then fit it with the sum of 3 Gaussians to obtain . The exponential time decay constant for when compared with that for is consistent with a Poisson process, as expected for dark current.
In Fig. 5 we compare the Verne DM velocity distributions at the detector with those obtained when the Earth-scattering effects are calculated using DaMaSCUS [55, 81, 82], a more accurate but computationally demanding 3D Monte Carlo simulation. The simplified approach adopted in Verne reproduces to better than 20% the DaMaSCUS predictions. We have repeated our analysis at a DM mass of 1 MeV/c2 using the DaMaSCUS code; the corresponding limits differ from those obtained with Verne by less than 30%. The use of Verne has also allowed for a number of additional checks. In the Verne calculation of the DM velocity distribution the Earth’s speed is fixed to km/s. To check the effect of this assumption we repeat the analysis using the largest and smallest value of , and km/s, corresponding to the beginning and the end of the data-taking period. The exclusion limits change by at most 15%.
We also perform a cross-check of the exclusion limits with a less sensitive but simpler method by computing the correlation
| (4) |
where and and are fixed to the period and phase predicted by the DM- scattering model described in the main text. The probability distribution of is obtained from toy Monte Carlo simulations, which include only the background model, and then used to derive a 90% limit on the amplitude of a putative daily modulation signal. We convert the rate to cross section using Eq. (2). The corresponding exclusion limits are a factor of 1.2 weaker than the nominal limits obtained from the likelihood.
For the model-independent analysis, we have performed toy-MC simulations under (no modulation), finding that the test statistic asymptotically follows a distribution with two degrees of freedom. We have also verified that our limits in Fig. 4 have the correct coverage by performing the analysis on toy Monte Carlo simulation, which include both a signal and background. We find that the signal is properly rejected or discovered according to our 90% C.L.
We use QEDark as the reference theoretical model for proper comparison with previous and forthcoming results from other experiments. We note that theoretical uncertainties are significant for DM masses below MeV/c2, with QEDark-based limits almost a factor 100 better than those obtained with DarkELF [83] and EXCEED-DM [84, 85] models (see Supplemental Material of Ref. [16].)