High-energy Neutrinos from the Inner Circumnuclear Region of NGC 1068
Abstract
High-energy neutrinos are detected by the IceCube Observatory in the direction of NGC 1068, the archetypical type II Seyfert galaxy. The neutrino flux, surprisingly, is more than an order of magnitude higher than the -ray upper limits at measured TeV energy, posing tight constraints on the physical conditions of a neutrino production site. We report an analysis of the sub-millimeter, mid-infrared, and ultraviolet observations of the central pc of NGC 1068 and suggest that the inner dusty torus and the region where the jet interacts with the surrounding interstellar medium (ISM) may be a potential neutrino production site. Based on radiation and magnetic field properties derived from observations, we calculate the electromagnetic cascade of the -rays accompanying the neutrinos. When injecting protons with a hard spectrum, our model may explain the observed neutrino flux above TeV. It predicts a unique sub-TeV -ray component, which could be identified by a future observation. Jet-ISM interactions are commonly observed in the proximity of jets of both supermassive and stellar-mass black holes. Our results imply that such interaction regions could be -ray obscured neutrino production sites, which are needed to explain the IceCube diffuse neutrino flux.
1 introduction
An excess of high-energy neutrinos with a global significance of 4.2 was identified in the direction of the active galaxy NGC 1068 by the IceCube Observatory (Abbasi et al., 2022). The neutrino energy flux observed by IceCube is more than an order of magnitude higher than the upper limits on the -ray flux at TeV energies, suggesting that the neutrino emission site must be highly -ray-obscured. This agrees with the indication, based on a comparison of the diffuse extragalactic fluxes, that neutrinos originate in cosmic environments that are optically thick to GeV–TeV -rays (Murase et al., 2016; Fang et al., 2022).
NGC 1068 at a distance of 14.4 Mpc (1″= 60 pc) is the brightest Seyfert galaxy (Fath, 1909; Bland-Hawthorn et al., 1997). The mass of the central black hole is estimated as (Lodato & Bertin, 2003; Minezaki & Matsushita, 2015). The bolometric luminosity of the active galactic nucleus (AGN) is estimated to be based on mid-infrared to sub-mm spectral modeling (Lopez-Rodriguez et al., 2018). No short- or long-term line variability has been found in the X-ray data, suggesting that a good fraction of the emission originates from regions well outside of the parsec-scale dusty and molecular torus (Bauer et al., 2015; Grafton-Waters et al., 2021).
Due to the high photon opacity to TeV -rays, a possible coronal region in the proximity of the central black is an appealing site for the neutrino production. Models of neutrino production in the corona of the supermassive black hole have been explored for example in Inoue et al. (2020); Murase et al. (2020); Kheirandish et al. (2021); Inoue et al. (2021); Anchordoqui et al. (2022); Inoue et al. (2022); Eichmann et al. (2022). The models generally require that the emission regions are located within Schwarzschild radii (Murase, 2022).
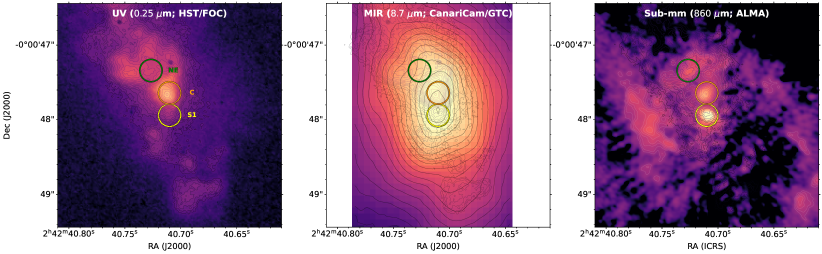
An extraordinary component of NGC 1068 is its bright and complex circumnuclear region. The AGN is hidden behind a nearly edge-on dusty and molecular disk at parsec scales extending up to 10-200 pc that is misaligned with the spiral galaxy (García-Burillo et al., 2016; Gámez Rosas et al., 2022). Radio and molecular line observations of the circumnuclear region (García-Burillo et al., 2019; Impellizzeri et al., 2019) suggest that the radiation pressure drives molecular outflows in the inner region of the gas disk ( pc). In addition, NGC 1068’s kiloparsec-scale, steep-spectrum radio jet interacts with the interstellar medium (ISM) in the central tens of pc. Along the jet axis, several nuclear radio sources are observed, referred to as radio emission “knots” as shown in Figure 1 (Gallimore et al., 2004; Lopez-Rodriguez et al., 2020).
Star formation is observed both inside the circumnuclear disk within pc and at a circumnuclear starburst ring at kpc scale. The star formation regions may contribute to the -ray emission at 1-100 GeV (Yoast-Hull et al., 2014). Though they are mostly optically thin to TeV -rays and thus cannot be the site where neutrinos are produced.
In this paper, we investigate the neutrino production in the central pc of NGC 1068 where the jet interacts with the ISM and in the dusty torus. We analyze the sub-millimeter (mm), mid-infrared (MIR), and ultraviolet (UV) observations of the radio knots to obtain the spectrum and energy density of the radiation fields. We also use sub-mm polarization measurements to infer the strength of the magnetic fields (B-fields). We find that the intense IR and optical fields of the knots may attenuate TeV -rays that accompany the production of high-energy neutrinos. The region, however, is not sufficiently thick to 10-100 GeV -rays, resulting in a unique sub-TeV -ray component that may be revealed by future observation. We present the observation and analysis of the radio knots in Section 2. We investigate the production of high-energy neutrinos and attenuation of TeV -rays in Section 3. Finally, we discuss and conclude in Section 4.
2 Observation of the jet-interacting knots
| Knot | Fluxes [Jy] | |||||
|---|---|---|---|---|---|---|
| m | m | m | m | m | m | |
| S1 (core) | ||||||
| C | ||||||
| NE | - | - | - | |||
Several bright knots are found within the central pc of NGC 1068 observed at radio observations (Gallimore et al., 2004). Specifically, knot ‘S1’ is identified as the core of NGC 1068. Knot ‘C’ is identified as the location of the interaction between the jet and a giant molecular cloud (GMC) at pc north from ‘S1’. Knot ‘NE’ is identified as the interaction of the jet with the ISM at pc north-east from ‘S1’ after the jet bent to an angle of east of north due to the interaction in knot ‘C’. Figure 1 shows the knots ‘S1’, ‘C’, and ‘NE’ over the total intensity observations used in this work.
We compute the energy spectral distribution (SED) of these knots at the highest angular resolution observations using imaging polarimetric observations at sub-mm, MIR, and UV wavelengths. The highest angular resolution observations are needed to ensure that the knots are spatially resolved, so the SED of each knot can be studied without the contamination of the extended and diffuse emission of the circumnuclear regions of NGC 1068. The polarimetric observations are needed to estimate the B-field strength of these regions. For the sub-mm observations, we use the m ( GHz) imaging polarimetric observations at an angular resolution of ( pc) by ALMA (Lopez-Rodriguez et al., 2020). For the MIR observations, we use the m ( GHz) imaging- and spectro-polarimetric observations at an angular resolution of ( pc) with CanariCam on the 10.4-m Gran Telescopio CANARIAS (GTC) (Lopez-Rodriguez et al., 2016). For the UV observations, we use the F253M UV filter with a center wavelength of m ( GHz) imaging polarimetric observations at an angular resolution of ( pc) with the Faint Object Camera (FOC) aboard the Hubble Space Telescope (HST). The HST/FOC observations have been reported by Kishimoto (1999).
Here, we present the re-reduced observations by Barnouin (in prep), which provides data with higher signal-to-noise than those previously produced by Kishimoto (1999). This is the first dataset of a large program to re-calibrate the imaging polarimetric observations of active nuclei observed by HST/FOC. Figure 1 presents the total intensity maps of the sub-mm, MIR, and UV observations used in this work.
We perform aperture photometry of the radio knots as follows. We use a circular aperture equal to the lowest angular resolution of the sub-mm-UV observations, which is ( pc) from the CanariCam/GTC observations. We sum the fluxes within the aperture and subtract the background level within the aperture. The background level is estimated using a region of the field-of-view from the observations without emission from the source. The final photometric error is estimated as the sum in quadrature of the background and photometric calibrations associated to each observations. Table 1 shows the measured photometry per wavelength.
Although the MIR observations show an extended point source (Fig. 1, middle panel), our measured fluxes are dominated, %, by the central unresolved source, where % of the total flux may arise from diffuse emission in the host galaxy (Mason et al., 2006; Lopez-Rodriguez et al., 2018). Furthermore, the resolved total emission at m using VLTI/GRAVITY and m using VLTI/MATISSE have been found to arise from optically thin dust in the central pc above the inner edge of the dusty torus (Gámez Rosas et al., 2022). The midplane of the dusty torus is optically thick within the m wavelength range (Lopez-Rodriguez et al., 2015, 2018; Gámez Rosas et al., 2022). These results constrain the MIR emission to arise from the central pc of the dusty torus of NGC 1068.
We estimate the B-field strength of the knots as follows. For the ‘S1’ knot, the B-field strength in the resolved dusty torus has been previously estimated using the m imaging polarimetric observations with ALMA (Lopez-Rodriguez et al., 2020). The ALMA observations measured the polarized flux arising from thermal emission by means of magnetically aligned dust grains in the equatorial plane of the dusty torus. Using the Davis-Chandrasekhar-Fermi (DCF) method (Davis & Greenstein, 1951; Chandrasekhar & Fermi, 1953), the B-field strength was estimated to be mG in the pc region of the eastern side along the equatorial plane of the torus. Furthermore, near-infrared (NIR; m) imaging polarimetric observations using MMT/MMT-pol measured the polarization from the central core of NGC 1068 at an angular resolution of ( pc) (Lopez-Rodriguez et al., 2015). The strong intrinsic polarization level of % with a position angle of polarization of indicated the presence of a strong and ordered B-field. The polarization arises from magnetically aligned dust grains from hot dust, K, at the inner edge of the dusty torus. Using a modified version of the DCF method, to account for no equipartition between the kinetic and magnetic energy, the B-field strength was estimated to be mG at pc of the dusty torus. Assuming that the B-field strength decreases with the distance from the core as , the B-field strength is estimated to be mG at the sublimation radius, pc, of the dusty torus. We take a fiducial B-field strength of mG for a radius of pc.
The knots ‘C’ and ‘NE’ are dominated by synchrotron emission at sub-mm wavelengths (García-Burillo et al., 2019). The m ALMA polarimetric observartions detected polarization levels of up to % and % in the ‘C’ and ‘NE’ knots respectively. For both knots, the B-field orientations seems to be related to the shock front between the jet and the GMC in the ISM (Lopez-Rodriguez et al., 2020) and heavily depolarized due to Faraday depolarization. We estimate the minimum magnetic field strength as G, where is the fraction of electrons contributing to the total energy, is the luminosity in Watt at the observed frequency in Hz, and is the volume of the source in m3. This equation assumes equipartition between B-field and relativistic particles and a spectral index of . The spectral indices of the ‘S1’ and ‘’NE’ knots are found to be (García-Burillo et al., 2019). Taking (i.e., electrons emit all the energy), the m fluxes in Table 1, physical sizes of pc, and a distance of Mpc, we estimate the minimum B-field strength of knot C and NE as mG and mG, respectively. Note that the region emitting synchrotron emission is highly localized and well-below the angular size of the radio observations (Gallimore et al., 2004), thus we assume an upper-limit of R pc.
The SEDs of knots ‘S1’ and ‘C’ are shown in Figure 4. Due to the relatively low -ray opacity at knot ‘NE’, it is unlikely a strong high-energy neutrino emitter and thus not included in the SED plot. However, we present the physical properties of knot ‘NE’ in this section for completeness.
3 Neutrino and gamma-ray production
Below we focus on knot S1 and knot C as potential neutrino emission sites. As explained in the previous section, we adopt benchmark parameters mG and pc for both knots and discuss the effect of alternative parameter values in Section 4. The radiation field at knot NE is too weak to attenuate the sub-TeV -rays co-produced with high-energy neutrinos and therefore cannot be an effective neutrino production site.
3.1 Neutrino production
Particle acceleration may happen in the accretion outflows and shocks produced by the jet-ISM collisions. Assuming that the radio knots have a physical size of pc and magnetic field G, protons may be accelerated up to , where is the fraction of the shock energy density that is injected into cosmic rays, i.e., the acceleration efficiency, and (Axon et al., 1998; Roy et al., 2000) is the velocity of the diffusive shocks or outflows.
ALMA observations suggest an density of in the torus and knots (García-Burillo et al., 2019). The effective optical depth of the molecular gas to proton-proton (pp) interaction is
| (1) |
where is the time when the protons are confined, is the dynamical time, is the diffusion time of cosmic rays, is the diffusion coefficient in the Bohm limit (Ptuskin et al., 2006), is the Larmor radius, is the amplitude of random field. The pp interaction time is , with being the inelastic cross section of the interaction of a proton at TeV with a rest-mass proton (Kafexhiu et al., 2014).
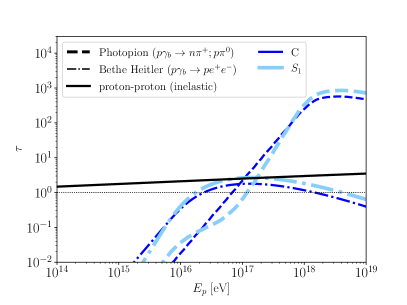
In the jet-ISM interaction region, the photopion production ( and ) and Bethe-Heitler process () are ineffective for TeV-PeV protons. The energy spectra of the radiation fields at the knots peak at IR energies, which are too low to interact with the protons that produce the IceCube neutrinos. As shown in Figure 2, these processes may be relevant for cosmic rays above 50 PeV, if particles at such high energies may be accelerated in the outflows.
We assume that the proton spectrum follows a simple power law, , with up to a break energy of 500 TeV and above the break. The shape of the proton spectrum above the break energy barely impacts the neutrino and -ray spectra below TeV. A hard proton spectrum may be caused by several factors. First, when the shock acceleration efficiency is high, an increase in the shock compression ratio due to the presence of relativistic particles may yield a spectral index smaller than 2 (Achterberg et al., 1984). Second, such a hard spectrum may be caused by the escape of the highest-energy particles ahead of the shock front (Blasi et al., 2005). Finally, when accelerated cosmic rays penetrate a dense gas clump, the higher-energy particles penetrate more efficiently as a result of a larger diffusion coefficient. This would also lead to a harder spectrum than at the shock (Celli et al., 2019). In addition to diffusive shock acceleration, other mechanisms may also produce a hard proton spectrum. A proton spectrum with would produce too much GeV-TeV -ray emission and be inconsistent with the -ray observations.
3.2 Optical depth to -rays
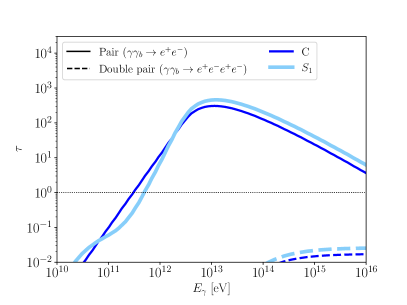
Based on the spectral energy distribution of the radiation fields found in Section 2, we compute the optical depth to high-energy -rays due to pair production () and double pair production () processes. As shown in Figure 3, with a size pc, knots S1 and C are optically thick to -rays above 400 GeV and 200 GeV, respectively. The TeV -rays produced together with the neutrinos, therefore, would be attenuated by the low-energy photons.
The magnetic energy density at the knots dominates over the radiation energy density. The intensity of knot C at eV corresponds to a differential luminosity of for a source distance of 14.4 Mpc 111A high internal photon energy density in an optically-thick source could be due to a high dust temperature obscured by the foreground (Gratadour et al., 2006; Yoast-Hull & Murray, 2019).. The ratio of the magnetic energy density and radiation energy density is . Electrons from the pair production would dissipate most of their energy through synchrotron radiation. A small fraction of them would up-scatter the IR and optical photons to 10-100 GeV -rays.
3.3 Gamma-ray and neutrino spectra
We compute the neutrino and injected -ray spectra using proton-proton cross sections from Koldobskiy et al. (2021) above 4 GeV and Kelner et al. (2006) below 4 GeV. The electromagnetic cascades of -rays are computed using a Monte Carlo code based on the thinning technique of CRPropa 3.2 (Alves Batista et al., 2022).
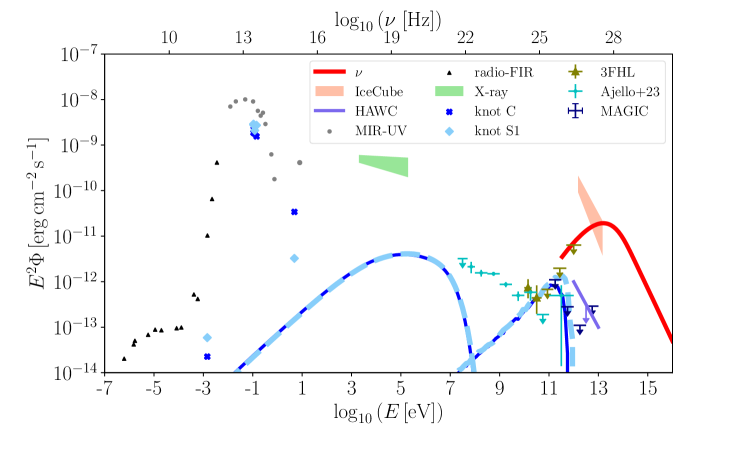
Figure 4 presents the broad-band spectral energy distribution of NGC 1068. Our model may explain of the neutrino flux at 3 TeV and of the flux above 10 TeV. The total neutrino luminosity is above 1 TeV. Since the jet-ISM interaction region is optically thin to -rays below GeV, the neutrino emission by the knots is constrained by the non-detection of the accompanying -ray emission at 0.1-1 TeV.
The -rays at GeV are mostly unattenuated pion decay products. Therefore, they follow the injection spectrum of , which has a similar shape as the proton spectrum . Electrons from the pair production of -rays are quickly cooled due to synchrotron radiation and inverse Compton scattering. The cooling results an electron spectrum that follows roughly and a corresponding synchrotron spectrum of up to a peak energy around MeV. Since the injected proton spectra in the models of both knots are assumed to be the same and the synchrotron emission is dominated by the injected power, the synchrotron spectra of the two knots look identical.
Our model predicts a peak in the -ray energy spectrum at 100 GeV to 1 TeV. Such a peak cannot be produced by proton interactions in the corona or starburst activities at larger radius and therefore is a unique feature of the jet-ISM interaction region. The peak is consistent with the analyses of the latest Fermi-LAT data, which suggest that NGC 1068 is marginally detected at 0.1-1 TeV at test statistic (Ajello et al., 2023; Blanco et al., 2023). Deeper observations of imaging air Cherenkov telescopes (IACTs) in the future may reveal or further constrain such a component.
4 conclusions and discussion
One of the first high-energy neutrino sources, NGC 1068, turned out to be highly obscured to TeV -rays. We show that protons may be accelerated by shocks generated when the jet collides with molecular clouds in the circumnuclear region, interact with the gas, and produce high-energy neutrinos and gamma-rays. Based on multi-wavelength observations of the knots and numerical simulation of electromagnetic cascades, we find that -rays above 200 GeV energies are attenuated due to interaction with IR and optical radiation fields. Comparing to the source spectrum measured by Abbasi et al. (2022) using a single power-law, the jet-ISM interaction region may explain the % of the observed neutrino flux above 10 TeV and contribute to 20% of the observed flux at 3 TeV.
Jet-ISM interaction is commonly observed in both Galactic (Abeysekara et al., 2018) and extragalactic jets. Notably, collision of jetted material is also evident in other candidate neutrino sources, such as TXS 0506+056 (Britzen et al., 2019) and NGC 4151 (Wang et al., 2011). Our model suggest that such regions may be promising sites for high-energy neutrino production. The thermal radiation at the interaction site may attenuate the -rays accompanying the neutrinos. -ray-obscured sources are needed to explain the diffuse astrophysical neutrino flux due to the tension of the cascaded -ray flux and the isotropic -ray background measured by Fermi-LAT (Murase et al., 2016; Fang et al., 2022). Jet-ISM interaction regions like NGC 1068’s knots may serve as such -ray-hidden sources.
Inoue et al. (2022) studied the neutrino production in the outer torus region and found a relatively low neutrino flux. The model presented in this work is different in two aspects. First, our model focuses on the regions where the jet interacts with the circumnuclear region rather than the torus itself. The radiation field revealed by our observation extends to optical and UV bands, which help attenuate -rays at TeV energies. Second, the magnetic field in the knots is observed to be significantly higher than that in the outer torus region assumed by Inoue et al. (2022). Thus most of the pairs dissipate their energy through synchrotron radiation at 0.1-1 MeV instead of inverse Compton radiation at 0.1-1 TeV.
The proton luminosity in our model is . We have assumed a hard proton spectrum with index . If the particles were accelerated with a softer spectrum, such as , the power of the relativistic protons would have to be significantly lower to be consistent with the -ray constraints at 1-10 TeV. In that case, the neutrino flux would be negligible. The jet-ISM interaction would instead contribute to the -ray emission at 1-100 GeV, which can hardly be explained by star formation regions alone (Yoast-Hull et al., 2014).
Our benchmark model adopts mG. While an even higher field is possible at knot S1, in general mG allows and thus yields similar results. A magnetic field of mG or an emission region with size pc would cause and hence overproduce sub-TeV -rays. As the -ray attenuation sensitively depends on the strength of the magnetic field and the size of the emission region, high angular resolution IR-sub-mm polarimetric observations are crucial to resolving a -ray-opaque neutrino emission site.
Deeper observations of NGC 1068 by IACTs and future data from Fermi-LAT at TeV may reveal the sub-TeV -ray flux predicted by our model or further constrain the opacity of the neutrino emission site to high-energy -rays. Future observation by IceCube and next-generation neutrino telescopes may also better measure the neutrino spectral shape and resolve the contribution by various components of NGC 1068.
References
- Abbasi et al. (2022) Abbasi, R., Ackermann, M., Adams, J., et al. 2022, Science, 378, 538, doi: 10.1126/science.abg3395
- Abeysekara et al. (2018) Abeysekara, A. U., et al. 2018, Nature, 562, 82, doi: 10.1038/s41586-018-0565-5
- Acciari et al. (2019) Acciari, V. A., Ansoldi, S., Antonelli, L. A., et al. 2019, ApJ, 883, 135, doi: 10.3847/1538-4357/ab3a51
- Achterberg et al. (1984) Achterberg, A., Blandford, R., & Periwal, V. 1984, A&A, 132, 97
- Ajello et al. (2023) Ajello, M., Murase, K., & McDaniel, A. 2023, arXiv e-prints, arXiv:2307.02333, doi: 10.48550/arXiv.2307.02333
- Ajello et al. (2017) Ajello, M., Atwood, W. B., Baldini, L., et al. 2017, ApJS, 232, 18, doi: 10.3847/1538-4365/aa8221
- Alves Batista et al. (2022) Alves Batista, R., Becker Tjus, J., Dörner, J., et al. 2022, J. Cosmology Astropart. Phys, 2022, 035, doi: 10.1088/1475-7516/2022/09/035
- Anchordoqui et al. (2022) Anchordoqui, L. A., Krizmanic, J., & Stecker, F. 2022, in 37th International Cosmic Ray Conference, 993, doi: 10.22323/1.395.0993
- Axon et al. (1998) Axon, D. J., Marconi, A., Capetti, A., et al. 1998, The Astrophysical Journal, 496, L75, doi: 10.1086/311249
- Barnouin (in prep) Barnouin, T. in prep
- Bauer et al. (2015) Bauer, F. E., Arévalo, P., Walton, D. J., et al. 2015, ApJ, 812, 116, doi: 10.1088/0004-637X/812/2/116
- Blanco et al. (2023) Blanco, C., Hooper, D., Linden, T., & Pinetti, E. 2023, arXiv e-prints, arXiv:2307.03259, doi: 10.48550/arXiv.2307.03259
- Bland-Hawthorn et al. (1997) Bland-Hawthorn, J., Gallimore, J. F., Tacconi, L. J., et al. 1997, Ap&SS, 248, 9, doi: 10.1023/A:1000567831370
- Blasi et al. (2005) Blasi, P., Gabici, S., & Vannoni, G. 2005, MNRAS, 361, 907, doi: 10.1111/j.1365-2966.2005.09227.x
- Britzen et al. (2019) Britzen, S., Fendt, C., Böttcher, M., et al. 2019, A&A, 630, A103, doi: 10.1051/0004-6361/201935422
- Celli et al. (2019) Celli, S., Morlino, G., Gabici, S., & Aharonian, F. A. 2019, MNRAS, 487, 3199, doi: 10.1093/mnras/stz1425
- Chandrasekhar & Fermi (1953) Chandrasekhar, S., & Fermi, E. 1953, ApJ, 118, 113, doi: 10.1086/145731
- Chhetri et al. (2013) Chhetri, R., Ekers, R. D., Jones, P. A., & Ricci, R. 2013, MNRAS, 434, 956, doi: 10.1093/mnras/stt975
- Davis & Greenstein (1951) Davis, Leverett, J., & Greenstein, J. L. 1951, ApJ, 114, 206, doi: 10.1086/145464
- Doyle et al. (2005) Doyle, M. T., Drinkwater, M. J., Rohde, D. J., et al. 2005, MNRAS, 361, 34, doi: 10.1111/j.1365-2966.2005.09159.x
- Eichmann et al. (2022) Eichmann, B., Oikonomou, F., Salvatore, S., Dettmar, R.-J., & Tjus, J. B. 2022, ApJ, 939, 43, doi: 10.3847/1538-4357/ac9588
- Fang et al. (2022) Fang, K., Gallagher, J. S., & Halzen, F. 2022, ApJ, 933, 190, doi: 10.3847/1538-4357/ac7649
- Fath (1909) Fath, E. A. 1909, Lick Observatory Bulletin, 149, 71, doi: 10.5479/ADS/bib/1909LicOB.5.71F
- Gallimore et al. (2004) Gallimore, J. F., Baum, S. A., & O’Dea, C. P. 2004, ApJ, 613, 794, doi: 10.1086/423167
- Gámez Rosas et al. (2022) Gámez Rosas, V., Isbell, J. W., Jaffe, W., et al. 2022, Nature, 602, 403, doi: 10.1038/s41586-021-04311-7
- García-Burillo et al. (2016) García-Burillo, S., Combes, F., Ramos Almeida, C., et al. 2016, ApJ, 823, L12, doi: 10.3847/2041-8205/823/1/L12
- García-Burillo et al. (2019) —. 2019, A&A, 632, A61, doi: 10.1051/0004-6361/201936606
- Gil de Paz et al. (2007) Gil de Paz, A., Boissier, S., Madore, B. F., et al. 2007, ApJS, 173, 185, doi: 10.1086/516636
- Grafton-Waters et al. (2021) Grafton-Waters, S., Branduardi-Raymont, G., Mehdipour, M., et al. 2021, A&A, 649, A162, doi: 10.1051/0004-6361/202039022
- Gratadour et al. (2006) Gratadour, D., Rouan, D., Mugnier, L. M., et al. 2006, A&A, 446, 813, doi: 10.1051/0004-6361:20042191
- Impellizzeri et al. (2019) Impellizzeri, C. M. V., Gallimore, J. F., Baum, S. A., et al. 2019, ApJ, 884, L28, doi: 10.3847/2041-8213/ab3c64
- Inoue et al. (2022) Inoue, S., Cerruti, M., Murase, K., & Liu, R.-Y. 2022, arXiv e-prints, arXiv:2207.02097, doi: 10.48550/arXiv.2207.02097
- Inoue et al. (2020) Inoue, Y., Khangulyan, D., & Doi, A. 2020, ApJ, 891, L33, doi: 10.3847/2041-8213/ab7661
- Inoue et al. (2021) —. 2021, Galaxies, 9, 36, doi: 10.3390/galaxies9020036
- Intema et al. (2017) Intema, H. T., Jagannathan, P., Mooley, K. P., & Frail, D. A. 2017, A&A, 598, A78, doi: 10.1051/0004-6361/201628536
- Kafexhiu et al. (2014) Kafexhiu, E., Aharonian, F., Taylor, A. M., & Vila, G. S. 2014, Phys. Rev. D, 90, 123014, doi: 10.1103/PhysRevD.90.123014
- Kelner et al. (2006) Kelner, S. R., Aharonian, F. A., & Bugayov, V. V. 2006, Phys. Rev. D, 74, 034018, doi: 10.1103/PhysRevD.74.034018
- Kheirandish et al. (2021) Kheirandish, A., Murase, K., & Kimura, S. S. 2021, ApJ, 922, 45, doi: 10.3847/1538-4357/ac1c77
- Kishimoto (1999) Kishimoto, M. 1999, ApJ, 518, 676, doi: 10.1086/307290
- Koldobskiy et al. (2021) Koldobskiy, S., Kachelrieß, M., Lskavyan, A., et al. 2021, Phys. Rev. D, 104, 123027, doi: 10.1103/PhysRevD.104.123027
- Lodato & Bertin (2003) Lodato, G., & Bertin, G. 2003, A&A, 398, 517, doi: 10.1051/0004-6361:20021672
- Lopez-Rodriguez et al. (2015) Lopez-Rodriguez, E., Packham, C., Jones, T. J., et al. 2015, MNRAS, 452, 1902, doi: 10.1093/mnras/stv1410
- Lopez-Rodriguez et al. (2016) Lopez-Rodriguez, E., Packham, C., Roche, P. F., et al. 2016, MNRAS, 458, 3851, doi: 10.1093/mnras/stw541
- Lopez-Rodriguez et al. (2018) Lopez-Rodriguez, E., Fuller, L., Alonso-Herrero, A., et al. 2018, ApJ, 859, 99, doi: 10.3847/1538-4357/aabd7b
- Lopez-Rodriguez et al. (2020) Lopez-Rodriguez, E., Alonso-Herrero, A., García-Burillo, S., et al. 2020, ApJ, 893, 33, doi: 10.3847/1538-4357/ab8013
- Mason et al. (2009) Mason, B. S., Weintraub, L., Sievers, J., et al. 2009, ApJ, 704, 1433, doi: 10.1088/0004-637X/704/2/1433
- Mason et al. (2006) Mason, R. E., Geballe, T. R., Packham, C., et al. 2006, ApJ, 640, 612, doi: 10.1086/500299
- Minezaki & Matsushita (2015) Minezaki, T., & Matsushita, K. 2015, ApJ, 802, 98, doi: 10.1088/0004-637X/802/2/98
- Murase (2022) Murase, K. 2022, ApJ, 941, L17, doi: 10.3847/2041-8213/aca53c
- Murase et al. (2016) Murase, K., Guetta, D., & Ahlers, M. 2016, Phys. Rev. Lett., 116, 071101, doi: 10.1103/PhysRevLett.116.071101
- Murase et al. (2020) Murase, K., Kimura, S. S., & Mészáros, P. 2020, Phys. Rev. Lett., 125, 011101, doi: 10.1103/PhysRevLett.125.011101
- Planck Collaboration et al. (2016) Planck Collaboration, Ade, P. A. R., Aghanim, N., et al. 2016, A&A, 594, A26, doi: 10.1051/0004-6361/201526914
- Ptuskin et al. (2006) Ptuskin, V. S., Moskalenko, I. V., Jones, F. C., Strong, A. W., & Zirakashvili, V. N. 2006, ApJ, 642, 902, doi: 10.1086/501117
- Roy et al. (2000) Roy, A. L., Wilson, A. S., Ulvestad, J. S., & Colbert, E. J. M. 2000. https://arxiv.org/abs/astro-ph/0009408
- Skrutskie et al. (2006) Skrutskie, M. F., Cutri, R. M., Stiening, R., et al. 2006, AJ, 131, 1163, doi: 10.1086/498708
- Wang et al. (2011) Wang, J., Fabbiano, G., Elvis, M., et al. 2011, ApJ, 736, 62, doi: 10.1088/0004-637X/736/1/62
- Willox & HAWC Collaboration (2022) Willox, E., & HAWC Collaboration. 2022, The Astronomer’s Telegram, 15765, 1
- Yoast-Hull et al. (2014) Yoast-Hull, T. M., Gallagher, J. S., I., Zweibel, E. G., & Everett, J. E. 2014, ApJ, 780, 137, doi: 10.1088/0004-637X/780/2/137
- Yoast-Hull & Murray (2019) Yoast-Hull, T. M., & Murray, N. 2019, MNRAS, 484, 3665, doi: 10.1093/mnras/stz223