How to perform modeling with independent and preferential data jointly?
Abstract
Continuous space species distribution models (SDMs) have a long-standing history as a valuable tool in ecological statistical analysis. Geostatistical and preferential models are both common models in ecology. Geostatistical models are employed when the process under study is independent of the sampling locations, while preferential models are employed when sampling locations are dependent on the process under study. But, what if we have both types of data collectd over the same process? Can we combine them? If so, how should we combine them? This study investigated the suitability of both geostatistical and preferential models, as well as a mixture model that accounts for the different sampling schemes. Results suggest that in general the preferential and mixture models have satisfactory and close results in most cases, while the geostatistical models presents systematically worse estimates at higher spatial complexity, smaller number of samples and lower proportion of completely random samples.
keywords:
INLA, Species Distribution Models, Geostatistics, Preferential models.[labelaff1]organization=Universitat de València, country=Spain. \affiliation[labelaff2]organization=AZTI, Txatxarramendi Ugartea z/g, 48395 Sukarrieta, country=Spain
1 Modelization
Continuous space autocorrelation models are widely applied for inferring, predicting, and projecting species distributions (Guisan et al., 2017; Fletcher and Fortin, 2019; Ovaskainen and Abrego, 2020). Geostatistical models refer to models applied over point referenced data (Diggle et al., 1998), while preferential models refer to models that account for the dependence between the process under study and the sampling locations (Diggle et al., 2010). Different studies have demonstrated the importance of accounting for the sampling process to infer good abundance estimates (Pennino et al., 2019; Watson et al., 2019; Dean et al., 2022). But, what if we have both randomly and preferentially sampled data? Could we merge them together? If so, how should we model them? Do we need to account for the different sampling schemes?
We tested three models as exposed in Fig 1, the aforementioned geostatistical and preferential models as well as a model encompassing a mixture of both sampling approaches (mixture model from now on). A priori, the more complex mixture model is deemed to be the most appropriate model as it models each data source according to its sampling approach, but in order to check that out, we conducted a simulation study with the final aim of comparing the suitability of all three models.
2 Simulation Study
The simulation was designed to test the three different models under different levels of spatial complexity, sample sizes and proportions of randomly and preferentialy drawed samples. Underlying species abundance distributions were based on a geostatistical process, thus spatial complexity was controlled by varying the range parameter. Each scenario was then replicated four times.
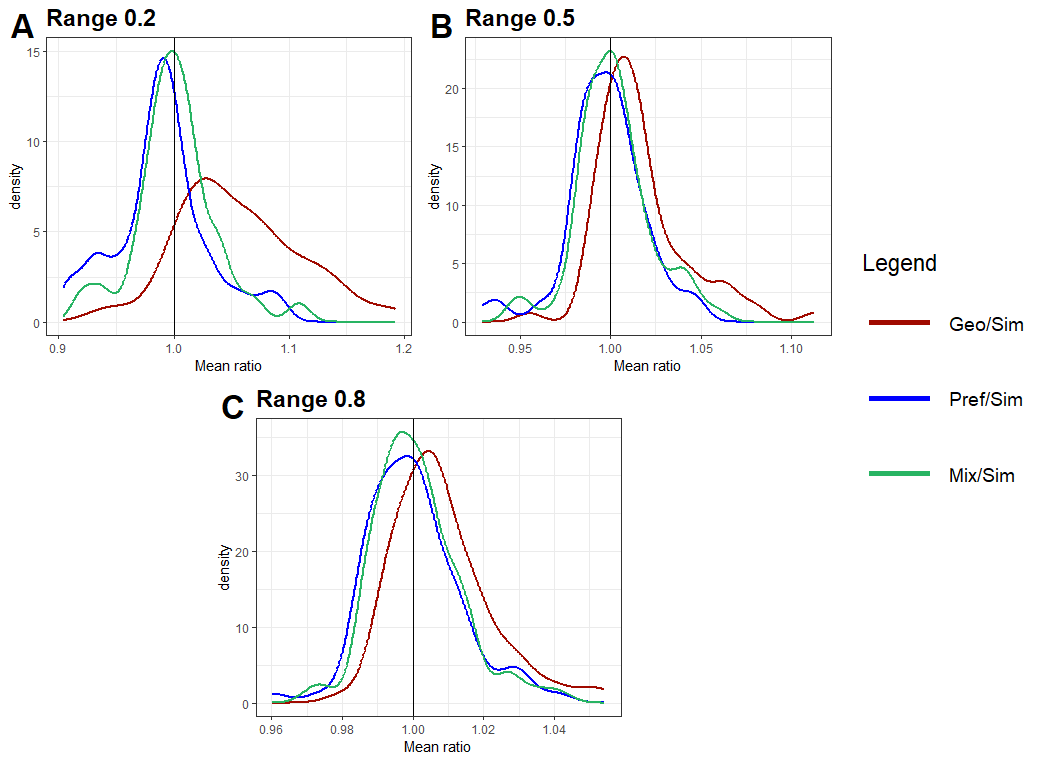
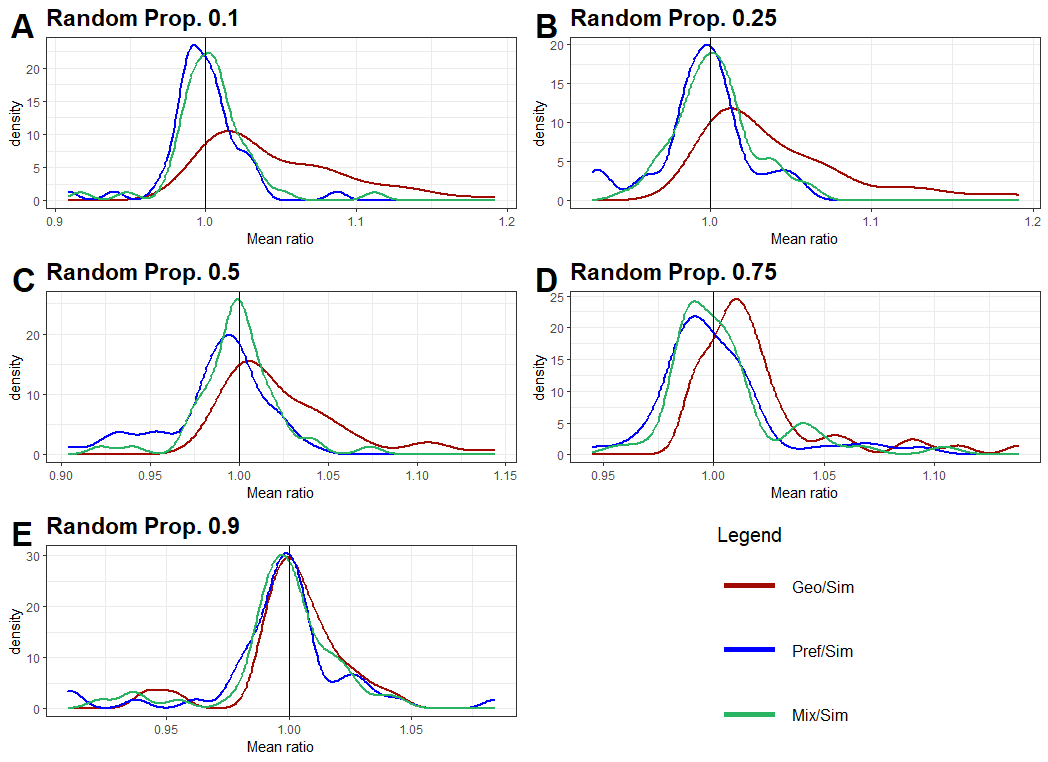
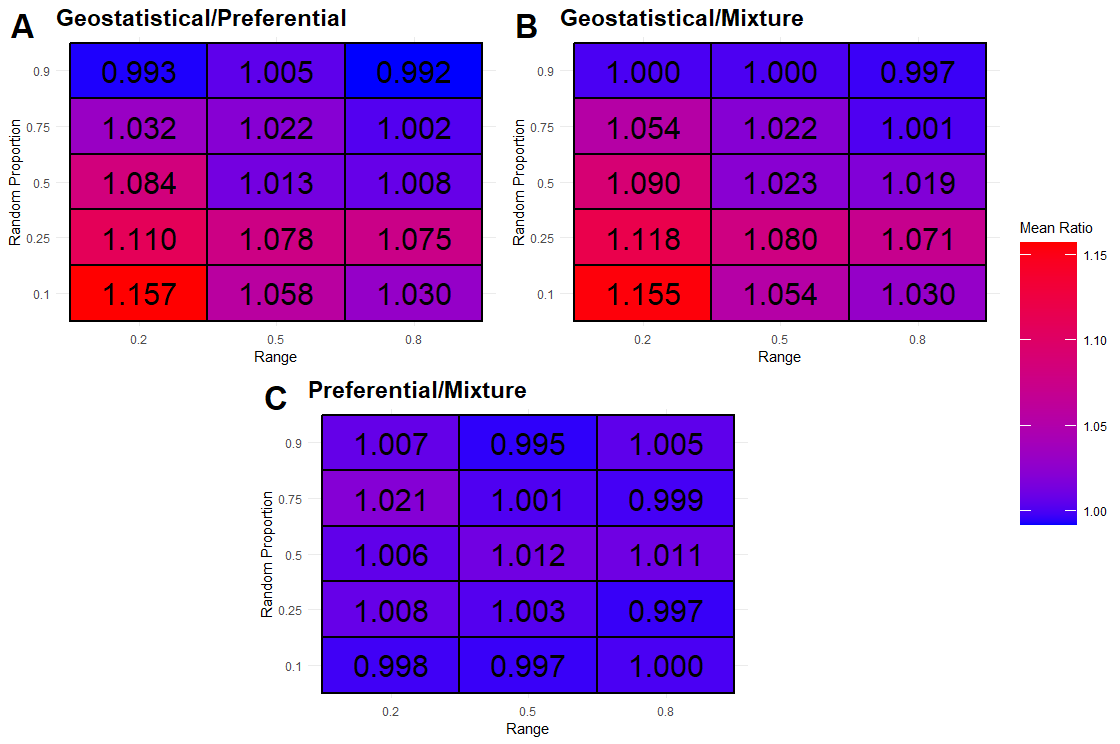
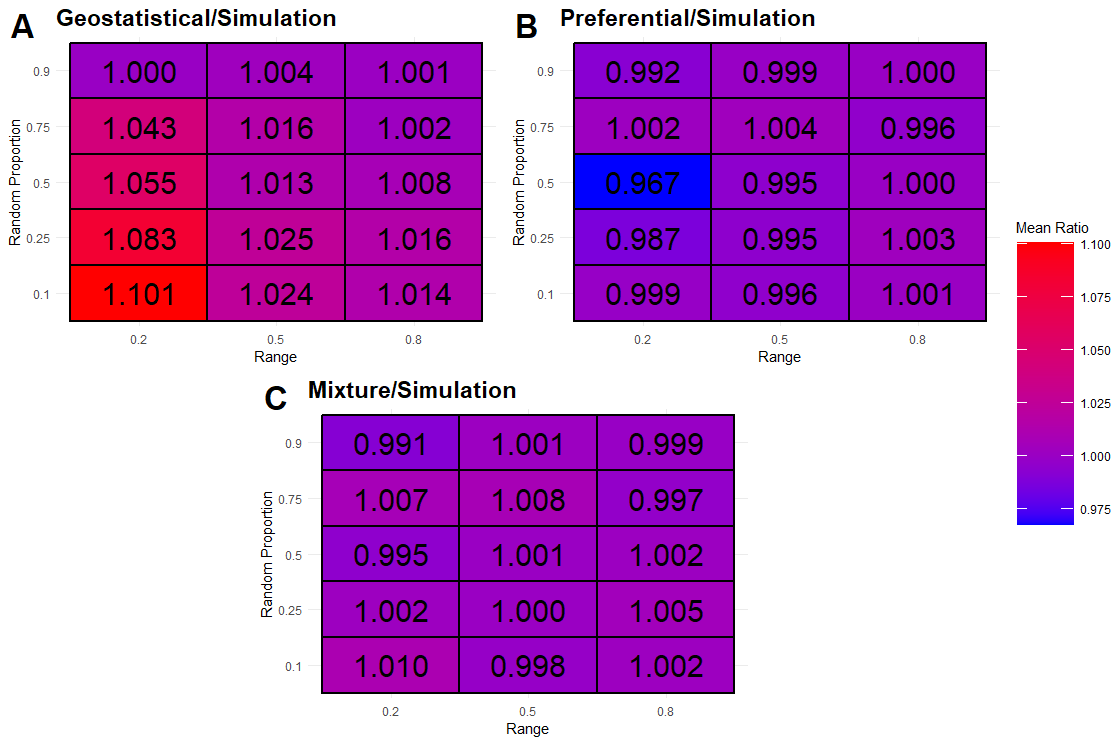
Models were fitted using the integrated nested Laplace approximation (INLA) methodology (Rue et al., 2009, 2017). Model performance was assessed based on three metrics: the Watanabe-Akaike Information Criterion (WAIC) (Watanabe, 2013) to evaluate the goodness-of-fit; the root mean squared error (RMSE) to evaluate the out of sample predictive capacity; and the ratio between the estimated abundance integration and the simulated overall abundance. Results showed no distinct advantage in terms of WAIC. Out-of-sample predictions however highlighted the overestimation tendency of geostatistical models (Pennino et al., 2019) with lower proportions of random samples and higher complexities of the underlying spatial pattern (see Tables 2 and 2). Interestingly, results showed that the preferential model performed as well as the mixture model even at high proportions of independent samples. Such good performance is driven by the fact that a combination of homogeneous and inhomogeneous point patterns results in another inhomogeneous point pattern with similar shape. Moreover, if the proportion of preferential samples were negligible, the sharing effect between the point process and the geostatistical process in the LGCP model would tend to zero, and therefore two independent processes.
| Geo/Pref | Geo/Mix | Pref/Mix | |
| (A) | Spatial range | ||
| (B) | Proportion of random samples | ||
| (C) | Total amount of samples | ||
| Geo/Sim | Pref/Sim | Mix/Sim | |
| (A) | Spatial range | ||
| (B) | Proportion of random samples | ||
| (C) | Total amount of samples | ||
3 Discussion
Spatial autocorrelation models have a longstanding history of successful application in quantitative ecology. Geostatistical and preferential models have become two fundamental approaches for dealing with point referenced data, the latter when the sample distribution is dependent on the process under study. The aim of this study was to test the suitability of these models as well as a mixture model when the sample includes both randomly and preferentially sampled data.
The geostatistical model tends to overestimate abundances (Pennino et al., 2019) when the number of random samples is low and the underlying spatial pattern is complex (see Fig. 2). Given that one can hardly ever know the complexity of the spatial pattern before conducting the study, we discourage the use of geostatistical models unless we have a large proportion of independent samples.
The preferential model perfoms just as well the more complex mixture model, which a priori is the gold standard model given that it accounts for the different sampling processes. Fig. 2 shows the similarity of the distributions of the ratios for the preferential and mixture model, and the systematic deviation for the geostatistical model. This is a consequence of the joint locations structure, which still demonstrates a spatial pattern, albeit with reduced intensity, as the mixture of the two samples results in a more evenly distributed set of locations. As a consequence, fitting a preferential model is suitable for the majority of the cases examined.
As a final remark, it is worth noting the importance of evaluating SDM models using out-of-sample data. All our conclusions came from out-of-sample predictive scores (i.e., RMSE and deviation from overall abundance) given that goodness-of-fit scores (i.e., WAIC) did not show significant differences across the three different models.
4 Conclusion
Preferential models yield good estimates when combining both preferentialy and randomly collected data to model target species distributions. Preferential models practically perform as well as the more complex mixture model proposed in this study, that accounts for the sampling process of each dataset. Geostatistical models display a tendency for overestimation when the proportion of random samples is low and the complexity of the underlying process is high. However, geostatistical models will also perform well when higher proportions of random samples are available. As well as when there is a large number of samples throughout the study region, and therefore it can be concluded that the area has been sufficiently explored.


References
- Dean et al. (2022) Dean, C.B., El-Shaarawi, A.H., Esterby, S.R., Mills Flemming, J., Routledge, R.D., Taylor, S.W., Woolford, D.G., Zidek, J.V., Zwiers, F.W., 2022. Canadian contributions to environmetrics. Canadian Journal of Statistics 50, 1355–1386. doi:10.1002/cjs.11743.
- Diggle et al. (2010) Diggle, P.J., Menezes, R., li Su, T., 2010. Geostatistical inference under preferential sampling. Journal of the Royal Statistical Society. Series C: Applied Statistics 59. doi:10.1111/j.1467-9876.2009.00701.x.
- Diggle et al. (1998) Diggle, P.J., Tawn, J.A., Moyeed, R.A., 1998. Model-based geostatistics. Journal of the Royal Statistical Society. Series C: Applied Statistics 47. doi:10.1111/1467-9876.00113.
- Fletcher and Fortin (2019) Fletcher, R., Fortin, M.J., 2019. Spatial ecology and conservation modeling: Applications with R. doi:10.1007/978-3-030-01989-1.
- Guisan et al. (2017) Guisan, A., Thuiller, W., Zimmermann, N.E., 2017. Habitat Suitability and Distribution Models. Cambridge University Press. doi:10.1017/9781139028271.
- Ovaskainen and Abrego (2020) Ovaskainen, O., Abrego, N., 2020. Joint species distribution modelling: with applications in R. Cambridge University Press. doi:10.1017/9781108591720.
- Pennino et al. (2019) Pennino, M.G., Paradinas, I., Illian, J.B., Muñoz, F., Bellido, J.M., López-Quílez, A., Conesa, D., 2019. Accounting for preferential sampling in species distribution models. Ecology and evolution 9, 653–663.
- Rue et al. (2009) Rue, H., Martino, S., Chopin, N., 2009. Approximate bayesian inference for latent gaussian models by using integrated nested laplace approximations. Journal of the Royal Statistical Society. Series B: Statistical Methodology 71. doi:10.1111/j.1467-9868.2008.00700.x.
- Rue et al. (2017) Rue, H., Riebler, A., Sørbye, S.H., Illian, J.B., Simpson, D.P., Lindgren, F.K., 2017. Bayesian computing with inla: A review. Annual Review of Statistics and Its Application 4, 395–421. doi:10.1146/annurev-statistics-060116-054045.
- Watanabe (2013) Watanabe, S., 2013. A widely applicable bayesian information criterion. Journal of Machine Learning Research 14.
- Watson et al. (2019) Watson, J., Zidek, J.V., Shaddick, G., 2019. A general theory for preferential sampling in environmental networks. The Annals of Applied Statistics 13, 2662 – 2700. doi:10.1214/19-AOAS1288.