Classical Out-of-Distribution Detection Methods Benchmark
in Text Classification Tasks
Abstract
State-of-the-art models can perform well in controlled environments, but they often struggle when presented with out-of-distribution (OOD) examples, making OOD detection a critical component of NLP systems. In this paper, we focus on highlighting the limitations of existing approaches to OOD detection in NLP. Specifically, we evaluated eight OOD detection methods that are easily integrable into existing NLP systems and require no additional OOD data or model modifications. One of our contributions is providing a well-structured research environment that allows for full reproducibility of the results. Additionally, our analysis shows that existing OOD detection methods for NLP tasks are not yet sufficiently sensitive to capture all samples characterized by various types of distributional shifts. Particularly challenging testing scenarios arise in cases of background shift and randomly shuffled word order within in domain texts. This highlights the need for future work to develop more effective OOD detection approaches for the NLP problems, and our work provides a well-defined foundation for further research in this area.
1 Introduction
Systems based on artificial intelligence (AI) have to be safe and trustworthy Amodei et al. (2016). Ensuring user reliance on these systems requires a cautious approach in making predictions. AI tools should avoid decisions on examples that significantly deviate from the training data. This is especially risky when the classifier shows excessive confidence in its incorrect decisions, leading to the propagation of errors in the system pipeline Commission et al. (2019). However, current models are often trained under the closed-world assumption, limited to specific domains Park et al. (2022). Test sets drawn from the same domain for evaluation may not reflect real-world scenarios accurately Teney et al. (2020). This poses challenges when deploying such models in production environments Schrouff et al. (2022).
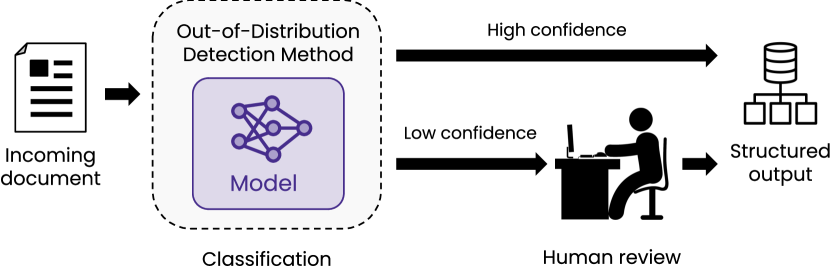
Real-world data is often completely different from training one. The change in data distribution can be caused by several factors such as user behavior, legal regulations, market trends or seasonal changes. In an open-world scenario, the AI-based system can be even exposed to inputs that deviate from the trained task. A significant risk that may arise is the possibility of model overconfidence while predicting data of this nature. As a result, there is a business need for detecting examples outside the domain Hendrycks and Gimpel (2017). Out-of-distribution (OOD) detection techniques can be well applied in a production system with human-in-the-loop technology Wu et al. (2022), where it is important to quickly identify whether an input sample is characterized by a distributional shift. Such an example should be handled then by a human expert in order to avoid potential misclassification by the model. The essence of such systems is to find a trade-off between the accuracy and automation Mosqueira-Rey et al. (2022) (Figure 1). This way, the model can achieve the highest possible performance on in-distribution (ID) data and difficult shifted data can be given to human verification, thus increasing the credibility of the overall system. The bottleneck here is a well-designed OOD detection method, which must be sensitive enough to capture all examples outside the domain.
The problem of OOD identification is mainly investigated for vision classification tasks Yang et al. (2022a); Kuan and Mueller (2022), whereas in the field of NLP, studies on this topic are limited. We fill the missing gap by proposing a comprehensive analysis of existing OOD approaches for text classification tasks. In this work, we focus on the post-hoc techniques which are most suitable for business applications i.e. they have to fulfil the requirement of smooth integration into existing systems, without the need for additional OOD training data or any changes in model architecture. Ultimately, we evaluated eight methods in two different scenarios. The first one includes grouping test data into three splits according to the similarity to the in-distribution set: Near-OOD, Far-OOD and Distinct-OOD Yang et al. (2021). The AI system is evaluated based on the degree of domain difference between training and test samples. The second scenario considers the division of datasets according to the shift of distribution Arora et al. (2021). There are many categories of distribution shift Hupkes et al. (2022), but in this study, we consider two types – semantic and background. Semantic shift occurs when new labels appear, which may be due to the lack of a sufficient number of classes representing the training data or the emergence of new classes over time. In distinction, the background shift is class independent. It appears when the characteristic features of text change (e.g. source origin, writing style), which can happen even within the same class. The reason may be language evolution, regional conditions, etc. – such factors are difficult to predict and adequately address in the training set. By preparing data separated into different kinds of shift, we gain an in-depth insight into the origin of the data, on which a particular OOD detection method performs better or worse.
We also provide a well-structured research environment that allows the full reproducibility of the achieved outcomes and evaluation of another NLP models. The source code is available on GitHub111 https://github.com/mateuszbaransanok/TrustworthyAI . To summarize, our contribution is as follows:
-
•
we adjust the existing OOD detection techniques to the text classification problems,
-
•
we comprehensively evaluate the revised methods using two different scenarios tailored to the NLP domain,
-
•
we deliver the complete experimental framework for evaluating the OOD methods.
2 Related Work
In recent years, there has been a growing interest in developing robust methods that can detect out-of-distribution examples. The work of Hendrycks and Gimpel (2017) has played a significant role in advancing this field. Their Maximum Softmax Probability (MSP) method, which relies on the softmax output of a neural network, has become a reference for subsequent research and still remains as the solid baseline approach Zhang et al. (2023). The benefit of the MSP was its independence from the specific task domain. Since then, many researchers have extended this method or proposed novel techniques to address the challenge of detecting OOD data.
The first to popularize the interest in the OOD topic were computer vision (CV) researchers Bengio et al. (2011). The emerged techniques in this field were summarized in a survey by Yang et al. (2021). The authors proposed a unified framework that groups OOD detection methods into categories based on their common underlying mechanisms. Among them, the following ones can be distinguished: (1) output-based Liu et al. (2020); Liang et al. (2018) techniques which detect OOD samples based on output vector obtained by classification model for given input; (2) gradient-based Huang et al. (2021) focus on analyzing the fluctuation of the gradient flow through the model layers to verify that the input is OOD; (3) density-based Zong et al. (2018) methods involve modeling a density function from the training set and then determining whether a new example belongs to the same distribution; (4) distance-based Sun et al. (2022); Ren et al. (2021) measure the dissimilarity between a new input and the training data by computing standard metrics such as cosine similarity, Euclidean or Mahalanobis distance. Another work of Yang et al. (2022a) provides a comprehensive evaluation of 13 methods for OOD detection in CV. Notably, the experimental results show that simple preprocessing techniques can be highly effective, outperforming even more sophisticated methods in identifying OOD examples. In addition, post-hoc methods have demonstrated considerable effectiveness in OOD detection and have made significant impact in this task. The NLP community is also more and more interested in addressing the challenge of OOD detection data, especially after the appearance of text processing automation systems. Despite the expectation that pre-trained language models (PLMs) would generalize well to unseen data, many existing transformer-based architectures perform poorly in an open-world assumption setup. This was proven by the work Yang et al. (2022b) where the authors created the GLUE-X benchmark to reliably test the robustness of PLMs against OOD samples exposure, without using any of the previously mentioned techniques dedicated to OOD. Their achieved results confirm the necessity of further development of OOD detection methods. Currently, researchers are continuously proposing techniques tailored for the NLP tasks Rawat et al. (2021); Zhou et al. (2021), revisiting existing ones Podolskiy et al. (2021) or designing completely novel approaches that can address specific shifts in data distribution Arora et al. (2021); Chen et al. (2023). The latter two publications particularly highlight the importance of dividing datasets into semantic and background shift sets, as they provide valuable findings and a better understanding of how the model works on different data types.
Evidently, there have been several NLP articles addressing OOD detection, but their comparison to existing methods has been limited. A comprehensive study which evaluates various OOD detection approaches on a larger scale and addressing the specific needs of businesses is still lacking. To fill this gap, we have developed a benchmark that provides a fair comparison of these techniques while testing their performance across different distributional shift scenarios. All the selected methods have been inspired by CV achievements, and we have specifically chosen those that can be easily integrated into an existing AI system with minimal complexity.
3 Benchmark Outline
This section provides an overview of the datasets and the model architecture, with a detailed description of the techniques reimplemented in our benchmark for detecting out-of-domain examples. The metrics used for evaluating the effectiveness of the detection methods are also presented.
3.1 Datasets
News Category Dataset Misra (2022) is one of the biggest news dataset. It contains around 210k news headlines from HuffPost published between 2012 and 2022. The dataset comprises of 42 classes that are heavily imbalanced. Therefore, the most similar classes were combined to avoid confusion between similar classes. Ultimately, we obtained 17 representative classes.
Twitter Topic Classification Antypas et al. (2022) is a topic classification dataset collected from Twitter posts. It consists of 3184 high-quality tweets that have been assigned to one of six classes.
SST-2 (The Stanford Sentiment Treebank) Socher et al. (2013) is a corpus with fully labeled parse trees that allows for an analysis of the compositional effects in language sentiment. The corpus includes almost 70k sentences extracted from movie reviews. Sentences were annotated with regard to their polarization (positive or negative).
IMDB Maas et al. (2011) is a large collection of movie reviews from the Internet Movie Database created for the binary sentiment classification task. According to the original 10-point movie rating scale from the website, the dataset samples were filtered to include only highly polarized texts annotated as positive () or negative ().
Yelp Polarity Review Zhang et al. (2015) dataset includes almost 600k customer reviews which are labeled as positive or negative based on the number of stars given by the reviewer. Specifically, texts with stars are labeled as negative, while those with are labeled as positive. Due to the large size of the dataset, we created a smaller version by randomly selecting a subset of 75k reviews.
Language Detection Dataset Saji (2021) is a small dataset for language detection task. It contains texts in 17 different languages. For benchmark purposes, we filter out languages that do not use Latin alphabet. We’ve also excluded English texts to create a clear out-of-distribution dataset. Finally, dataset consist around 6k samples and all of them are used for OOD evaluation.
20 Newsgroups McGraw Hill (1995) consists of around 18k newsgroups posts on 20 topics. It is divided in two sets for training and evaluation. Moreover, we allocated an additional subset from the training set for validation purposes.
3.2 Model
3.3 Methods
We decided to compare post-hoc methods that are suitable to apply to trained models. They mainly use information based on model statistics such as intermediate layer values, gradients or non-deterministic properties of dropout regularization, etc. Their implementation is technically straightforward and independent of the type of model used.
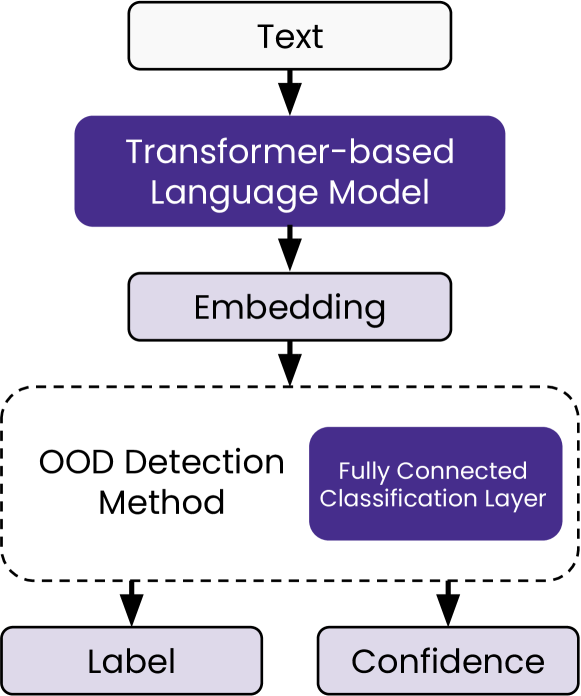
An overview of our benchmark methodology is outlined in Figure 2. In addition to label prediction, we obtain a real-valued confidence score that indicates the level of confidence that the model has in whether the given sample belongs to the ID data. We reimplemented eight OOD detection techniques and adapted them to the NLP classification pipeline.
-
(1)
Maximum Softmax Probability (MSP) Hendrycks and Gimpel (2017) employs the softmax score to check the certainty of whether an example belongs to a domain – we refer to it as the baseline method in our work.
-
(2)
Energy-based Liu et al. (2020) uses an energy score function to indicate model confidence.
-
(3)
Rectified Activations (ReAct) Sun et al. (2021) is a simple technique for reducing model overconfidence on OOD examples by truncating the high activations during evaluation.
-
(4)
KL-Matching (KLM) Hendrycks et al. (2022) calculates the minimum KL-divergence between the softmax probabilities and the mean class-conditional distributions.
-
(5)
GradNorm Huang et al. (2021) utilizes information obtained from the gradient space of model’s classification layer. This approach uses the vector norm of gradients to distinguish between ID and OOD samples, with the assumption that higher norm values correspond to in-distribution data.
-
(6)
Directed Sparisification (DICE) Sun and Li (2022) selectively chooses a subset of weights through sparsification, which helps to eliminate irrelevant information from the output.
-
(7)
Virtual-logit Matching (ViM) Wang et al. (2022a) combines information from feature space (PLM embedding) and output logits, providing both class-agnostic and class-dependent knowledge simultaneously for better separation of OOD data.
-
(8)
K-nearest neighbors (KNN) Sun et al. (2022) computes the distance between the embedding of an input example and the embeddings of the training set, and uses it to determine whether the example belongs to the ID or not.
The first four methods use signals originating from the output layer of the model. GradNorm focuses solely on the gradients that flow through the classification head, while methods from 6 to 8 operate on the embedding of a PLM. Most techniques (specifically no. 3-4, 6-8) need an initial configuration on the training or validation set to estimate the required statistics for ID data. To ensure consistency in the benchmarking process, the hyperparameters for the above methods were set to the values recommended in their original papers.
3.4 Metrics
To compare the chosen methods, we used three the most common metrics for OOD detection.
AUROC calculates the area under the Receiver Operating Characteristic (ROC) curve. The ROC curve plots the true positive rate against the false positive rate, and a larger area under the curve indicates better performance. This was used as our primary evaluation metric.
AUPR-IN measures the area under the Precision-Recall (PR) curve. The PR curve displays how well the method can identify true positives with high precision, and AUPR provides a measure of overall performance. The "IN" suffix indicates that this metric pertains to in-distribution data.
FPR@95 is the false positive rate when the true positive rate is set to 95%. Lower scores indicate better performance.
| Dataset | #Classes | Train / Val / Test | Avg. words |
|---|---|---|---|
| NC/I | 7 | 66223 / 26475 / 39688 | 9.95 |
| NC/O | 10 | - / - / 48522 | 9.77 |
| 6 | - / - / 3184 | 29.80 | |
| IMDB | 2 | 25000 / 5000 / 20000 | 231.15 |
| SST-2 | 2 | 43221 / 5000 / 20000 | 9.53 |
| Yelp | 2 | 50000 / 5000 / 20000 | 133.11 |
| Language | 9 | - / - / 5864 | 19.08 |
| NCR/I | 7 | - / - / 39688 | 9.95 |
| NCR/O | 10 | - / - / 48522 | 9.77 |
| Computer | 5 | 2965 / 456 / 1460 | 218.63 |
| Politics | 4 | 1959 / 315 / 979 | 406.53 |
| Sports | 4 | 2363 / 432 / 1182 | 224.43 |
4 Data Preparation
In our study, we have paid particular attention to provide a complete and unbiased comparison of OOD detection methods. To achieve this goal, we adopted two diverse perspectives: one inspired by the field of computer vision Yang et al. (2022a) and the other drawn from works dedicated to the NLP domain Rawat et al. (2021); Arora et al. (2021).
4.1 Scenario 1
The first perspective intends to provide a detailed analysis of considered techniques based on the similarity between OOD examples and the training set. The degree of similarity is defined here in a human-intuitive way, taking into account such factors as thematic proximity, task dissimilarity or the sentence correctness.
As a base in-distribution data, we chose News Category dataset using the seven most popular classes (NC/I). The remaining classes were considered as out-of-distribution split (NC/O) which represents data in close semantic shift. The Twitter Topic Classification dataset has categories that are similar to those in the News Category dataset, but the sentence construction is significantly different. Both sets create the Near-OOD data setup. Another prepared collection, Far-OOD includes datasets with reviews of movies, hotels and restaurants that are vastly different from NC/I data – it is a connection of SST-2, Yelp and IMDB. Additionally, we prepared one more group named Distinct-OOD containing Language Detection dataset. With the inclusion of non-English texts there, we obtain a distinct set of tokens that the RoBERTa model has not encountered before, creating a completely separate dataset from the in-distribution data.
Finally, we also designed two collections derived from the News Category dataset by randomly shuffling words from all those available within each category. The new dataset, called News Category Random, retained the original number of examples and the number of words in each sample. These sets aimed to examine the classification system behavior when presented with input sentences that are completely disrupted from their original context. The previous partition into ID (NCR/I) and OOD (NCR/O) subsets was maintained.
4.2 Scenario 2
This scenario investigated the performance of detection methods for OOD examples under semantic and background shift. For semantic shift, we utilized the 20 Newsgroups dataset that is a hierarchical collection of documents. Among the four top-level categories, we selected three - Computer, Sports, and Politics - as training sets for the model, while excluding the "misc" category due to potential data leakage issues. Subsequently, we generated various combinations of these categories, treating each one in turn as an in-distribution set, while considering the others as a OOD data. For example, the model could be trained on the samples from Computer class (ID dataset) and evaluated later on Sports and Politics (OOD).
In order to test the impact of background shift, we took three sentiment classification datasets – IMDB, SST-2 and Yelp, which are based on user reviews and represent different domains. Although these datasets have similar linguistic properties, the topics they address are distinct. Again, we constructed various combinations of these collections by treating each one as the ID set and the others as OOD sets.
| Near-OOD | Far-OOD | Distinct-OOD | ||||||
|---|---|---|---|---|---|---|---|---|
| Method | NC/O | IMDB | SST-2 | Yelp | Language | NCR/I | NCR/O | |
| MSP | 74.2±0.3 | 74.8±2.4 | 96.6±3.1 | 84.2±3.3 | 95.3±1.5 | 95.1±1.9 | 59.0±0.8 | 80.5±0.6 |
| Energy | 77.6±0.4 | 84.8±1.9 | 99.6±0.5 | 92.6±2.6 | 98.6±0.7 | 98.7±0.6 | 60.1±1.0 | 84.9±0.7 |
| GradNorm | 77.2±0.5 | 81.8±2.7 | 99.0±1.1 | 90.8±2.2 | 97.8±0.8 | 97.8±0.7 | 60.5±1.4 | 85.0±0.8 |
| KLM | 62.9±0.4 | 54.0±3.8 | 92.5±6.2 | 67.7±4.6 | 88.9±3.7 | 86.7±3.9 | 50.6±0.1 | 68.5±0.6 |
| ReAct | 77.5±0.4 | 84.5±2.0 | 99.6±0.5 | 92.4±2.8 | 98.6±0.7 | 98.7±0.6 | 60.0±1.0 | 84.7±0.7 |
| DICE | 58.2±0.6 | 60.9±3.2 | 76.6±5.8 | 60.9±1.4 | 84.4±2.2 | 69.3±2.8 | 51.2±0.9 | 60.4±1.4 |
| KNN | 80.1±0.2 | 92.9±1.2 | 99.8±0.1 | 96.4±1.1 | 99.5±0.1 | 99.6±0.1 | 67.6±1.3 | 88.7±0.5 |
| ViM | 79.9±0.2 | 89.2±1.5 | 90.6±3.1 | 96.0±0.9 | 92.9±1.6 | 98.1±0.8 | 60.7±0.8 | 86.1±0.4 |
5 Experiments
In this section, we describe the details of a training procedure and present the outcomes from the experiments.
5.1 Training Setup
The PLM fine-tuning duration took maximally epochs with an early stopping mechanism Raskutti et al. (2011) applied (patience epochs). By using this technique, we were able to conserve computational resources while still obtaining high-performing models. The learning rate hyperparameter was always set to . To prevent overfitting and enhance the model’s generalization capabilities, we used a weight decay with Adam optimizer Zhang (2018). The best performing model was selected based on F1-score achieved on the validation set, and the final results were reported on the test set (see Appendix A). To minimize the influence of randomness on the outcomes, we trained PLM five times for each task using different initial seeds.
During each experiment, the PLM was fine-tuned on ID data, which consisted of training and validation splits. The evaluation of the OOD detection methods themselves was performed on pre-defined test data. A complete overview of the split sizes along with the number of classes in all data collections is presented in Table 1.
5.2 Results
| ID | OOD | MSP | Energy | GradNorm | KLM | ReAct | DICE | KNN | ViM |
|---|---|---|---|---|---|---|---|---|---|
| Computer | Politics | 91.5±1.9 | 96.3±1.1 | 95.5±0.9 | 78.0±7.3 | 96.2±1.2 | 34.6±13.2 | 97.0±0.5 | 98.6±0.3 |
| Sports | 89.8±2.7 | 94.9±1.6 | 94.1±1.6 | 74.5±4.6 | 94.6±1.7 | 51.9±6.9 | 95.7±0.9 | 97.7±0.6 | |
| Politics | Computer | 94.4±0.8 | 96.0±0.6 | 95.5±0.7 | 82.8±4.6 | 95.9±0.6 | 63.9±3.2 | 96.9±0.2 | 98.3±0.2 |
| Sports | 91.4±1.1 | 93.4±0.9 | 92.9±1.0 | 72.3±5.6 | 93.3±0.9 | 58.6±2.4 | 95.3±0.4 | 97.3±0.3 | |
| Sports | Computer | 95.7±0.6 | 97.0±0.9 | 96.8±0.5 | 81.6±3.9 | 96.9±0.9 | 58.1±7.6 | 97.6±0.4 | 98.5±0.2 |
| Politics | 95.3±0.2 | 96.5±0.6 | 96.4±0.5 | 79.9±2.5 | 96.5±0.7 | 52.4±11.5 | 97.2±0.3 | 98.0±0.1 | |
| IMDB | SST-2 | 85.3±0.8 | 84.3±1.8 | 77.8±3.0 | 61.2±1.7 | 84.5±1.9 | 84.6±3.3 | 97.8±1.2 | 97.3±0.7 |
| Yelp | 76.0±3.3 | 74.9±4.1 | 66.2±3.6 | 32.0±1.0 | 75.3±4.3 | 49.6±8.6 | 97.5±1.1 | 98.4±0.8 | |
| SST-2 | IMDB | 83.2±1.4 | 82.7±2.2 | 70.3±2.3 | 55.0±2.7 | 83.3±2.4 | 34.5±10.7 | 87.2±1.7 | 83.9±3.3 |
| Yelp | 75.7±2.2 | 75.0±3.1 | 61.3±2.7 | 51.3±3.0 | 75.7±3.4 | 35.4±8.4 | 87.8±0.4 | 80.1±2.8 | |
| Yelp | IMDB | 79.5±0.5 | 79.2±1.6 | 71.7±1.9 | 38.6±1.3 | 79.5±1.6 | 26.8±5.1 | 84.7±0.8 | 88.6±0.7 |
| SST-2 | 91.6±0.5 | 91.5±0.9 | 86.1±1.0 | 59.9±2.5 | 91.7±0.9 | 55.8±8.5 | 98.5±0.3 | 99.0±0.1 |
The outcomes from experiments on data prepared in the first scenario (Section 4.1) are shown in Table 2. The KNN clearly outperformed the other OOD detection techniques on all three data groups. Energy-based method also stands out with its good results as well as ViM, except with its results on IMDB and Yelp dataset (worse than baseline MSP). As expected, the values of evaluation metrics on the NC/O dataset were the lowest among Near-OOD and Far-OOD divisions. This dataset was separated from the original dataset used in the training, making it the most difficult to properly identify as OOD due to the distributional closeness. The most challenging among the Far-OOD collections appeared to be SST-2, probably because of a small average number of words per example. The Language turned out to be the easiest dataset to detect OOD samples, and almost all methods performed well on it. The two worst performing approaches on the presented NLP tasks can be distinguished, i.e. DICE and KLM. Their measures were always worse than MSP, sometimes even nearly random (a little above 50%) – DICE on NC/O and KLM on Twitter.
Interesting results can be seen in the last part of Table 2. Randomization of words in case of NC/O dataset (which created NCR/O) significantly increased the model confidence in detecting OOD examples comparing with initial NC/O samples. However, the OOD methods could not cope well with shuffled in-domain News category data (NCR/I), which a human would recognize as the OOD.
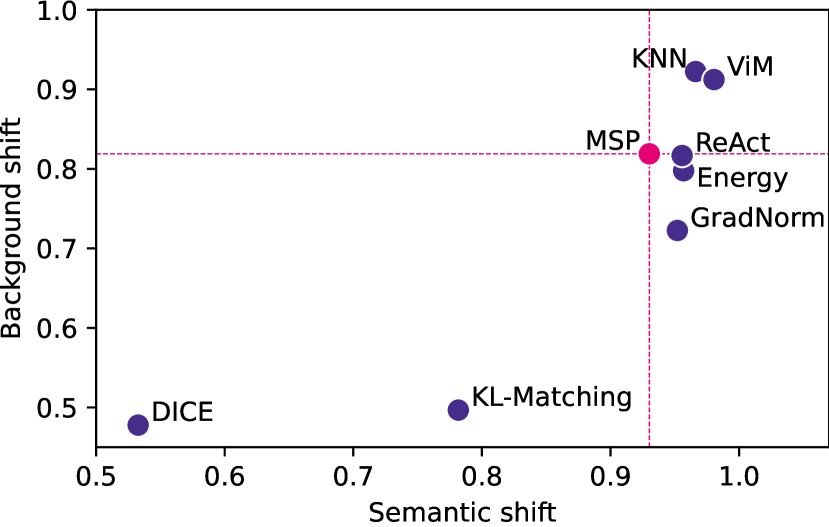
Table 3 presents AUROC scores obtained from the second scenario (Section 4.2) evaluation. The results demonstrate that the ViM method is more effective in detecting OOD samples with semantic shift to ID data. However, for background shift data, ViM is not always the best and is outperformed by KNN on IMDB and Yelp datasets. The SST-2 dataset proved to be problematic again, but only when used as a training set. It is worth noting that the average length of texts per SST-2 is considerably different from IMDB and Yelp collections, which mainly contain longer texts. These observations suggest that KNN is more stable in terms of different data characteristics. To further emphasize the importance of comparing methods based on the type of shift, we created a visualization in Figure 3. The ReAct, Energy, and GradNorm techniques turned out to be better than the baseline, but only for the semantic shift case.
To summarize, either KNN or ViM is the preferred choice among all the analyzed OOD detection approaches. Other reported metric values (AUPR-IN and FPR@95) from all experiments are attached in Appendix B.
5.3 Computational Resources
All experiments were conducted on a workstation equipped with a mid-range Nvidia RTX 3060 GPU with 12GB of memory, a high-end Intel(R) Core(TM) i9-10900X CPU with 20 cores and 40 threads, and 256 GB RAM. These resources provided sufficient capacity for running the experiments and training the models used in this work, including analysis and processing of large datasets. In total, we trained 35 models, taking 222 GPU-hours while evaluation alone lasted 124 GPU-hours.
6 Conclusions
The latest advancements in OOD detection techniques have surpassed the conventional MSP baseline. In this work, we applied some of them to the NLP classification problems, selecting only post-hoc approaches because of their easy integration to already trained PLM model. Most of the examined techniques achieved better results than the MSP, but their performance varied when subjected to different types of data distributional shift. Background shift was particularly challenging for the majority of methods to properly distinguish OOD examples. The KNN and ViM methods were found to be the most effective, and their performance was also stable. Hence, they are better alternatives to MSP for out-of-distribution detection. However, it should be kept in mind that it is likely that the ViM method is sensitive to cases where the language model was trained on short texts and later exposed to a long text from outside the domain.
The proposed by us the unique analysis of Distinct-OOD scenario, allowed to draw interesting findings. The tested methods were able to identify texts in different languages very easily as a OOD examples, but they had problems detecting OOD on the News Category Random with shuffled data. This means that PLM models, despite their ability to detect contextual nuances in text, still tends to behave like Bag-of-Words Zhang et al. (2010) in text classification tasks. Business-wise, such structurally disturbed examples should not be further processed by AI systems. Therefore, OOD methods employed in NLP should better address semantic disorders in input sentences.
In conclusion, the overall performance of current OOD detection techniques is still low and unsatisfactory, particularly when presented with the Near-OOD samples. Further research is necessary for the development of OOD detection methods, especially in the field of NLP, where more and more document processing automation systems are being developed, where ensuring reliability is important for users. Our work addresses the need for a comprehensive framework to evaluate the quality of OOD detection and provides easy extensibility to emerging methods.
7 Limitations
While our study provides valuable insights, it is important to keep in mind its limitations. Firstly, it was confined to text classification and did not include other NLP problems such as Named Entity Recognition (NER) Wang et al. (2022b), Question Answering (QA) Pandya and Bhatt (2021), etc. Expanding this research to a wider range of tasks would provide a better understanding of the methods’ performance in diverse data scenarios. Additionally, the inclusion of a task shift can be valuable, where the model is trained on a single task but OOD data come from a totally different prediction problems.
Secondly, we conducted our experiments using only RoBERTa model. We chose a widely used language model for text classification, but there are several other architectures worth testing, especially large language models (LLMs) Zhao et al. (2023) that now becoming extremely popular. A more comprehensive evaluation of the models and methods could provide more insights into whether the development of transformer-based methods contributes to better detection of OOD data.
Finally, due to restricted computational time, we did not perform a hyperparameter search for either model or methods. We just used recommend values from the original publications. This may have affected the obtained results, and it is certainly an aspect worth investigating in the future.
8 Ethics Statement
The authors believe that their work does not raise any ethical questions of harm or discrimination. Moreover, they acknowledge that the benchmark has a wide range of potential applications and want to make it clear that they are not responsible for any unethical applications of their work.
Acknowledgements
The research was conducted under the Implementation Doctorate programme of Polish Ministry of Science and Higher Education (DWD/6/0322/2022) with cooperation of the Artificial Intelligence Department at Wroclaw University of Science and Technology. It was partially co-funded by the European Regional Development Fund within the Priority Axis 1 “Enterprises and innovation”, Measure 1.2. “Innovative enterprises, sub-measure 1.2.1. “Innovative enterprises – horizontal competition” as part of ROP WD 2014-2020, support contract no. RPDS.01.02.01-02-0063/20-00. The work conducted by Maciej Zieba was supported by the National Centre of Science (Poland) Grant No. 2021/43/B/ST6/02853.
References
- Amodei et al. (2016) Dario Amodei, Chris Olah, Jacob Steinhardt, Paul F. Christiano, John Schulman, and Dan Mané. 2016. Concrete problems in AI safety. CoRR, abs/1606.06565.
- Antypas et al. (2022) Dimosthenis Antypas, Asahi Ushio, Jose Camacho-Collados, Leonardo Neves, Vitor Silva, and Francesco Barbieri. 2022. Twitter Topic Classification. In Proceedings of the 29th International Conference on Computational Linguistics, Gyeongju, Republic of Korea. International Committee on Computational Linguistics.
- Arora et al. (2021) Udit Arora, William Huang, and He He. 2021. Types of out-of-distribution texts and how to detect them. In Proceedings of the 2021 Conference on Empirical Methods in Natural Language Processing, pages 10687–10701, Online and Punta Cana, Dominican Republic. Association for Computational Linguistics.
- Bengio et al. (2011) Yoshua Bengio, Frédéric Bastien, Arnaud Bergeron, Nicolas Boulanger–Lewandowski, Thomas Breuel, Youssouf Chherawala, Moustapha Cisse, Myriam Côté, Dumitru Erhan, Jeremy Eustache, Xavier Glorot, Xavier Muller, Sylvain Pannetier Lebeuf, Razvan Pascanu, Salah Rifai, François Savard, and Guillaume Sicard. 2011. Deep learners benefit more from out-of-distribution examples. In Proceedings of the Fourteenth International Conference on Artificial Intelligence and Statistics, volume 15 of Proceedings of Machine Learning Research, pages 164–172, Fort Lauderdale, FL, USA. PMLR.
- Chen et al. (2023) Sishuo Chen, Wenkai Yang, Xiaohan Bi, and Xu Sun. 2023. Fine-tuning deteriorates general textual out-of-distribution detection by distorting task-agnostic features. EACL.
- Commission et al. (2019) European Commission, Content Directorate-General for Communications Networks, and Technology. 2019. Ethics guidelines for trustworthy AI. Publications Office.
- Hendrycks et al. (2022) Dan Hendrycks, Steven Basart, Mantas Mazeika, Andy Zou, Joe Kwon, Mohammadreza Mostajabi, Jacob Steinhardt, and Dawn Song. 2022. Scaling out-of-distribution detection for real-world settings.
- Hendrycks and Gimpel (2017) Dan Hendrycks and Kevin Gimpel. 2017. A baseline for detecting misclassified and out-of-distribution examples in neural networks. Proceedings of International Conference on Learning Representations.
- Huang et al. (2021) Rui Huang, Andrew Geng, and Yixuan Li. 2021. On the importance of gradients for detecting distributional shifts in the wild. In NeurIPS, volume abs/2110.00218.
- Hupkes et al. (2022) Dieuwke Hupkes, Mario Giulianelli, Verna Dankers, Mikel Artetxe, Yanai Elazar, Tiago Pimentel, Christos Christodoulopoulos, Karim Lasri, Naomi Saphra, Arabella Sinclair, Dennis Ulmer, Florian Schottmann, Khuyagbaatar Batsuren, Kaiser Sun, Koustuv Sinha, Leila Khalatbari, Maria Ryskina, Rita Frieske, Ryan Cotterell, and Zhijing Jin. 2022. State-of-the-art generalisation research in nlp: a taxonomy and review. CoRR, abs/2210.03050.
- Kuan and Mueller (2022) Johnson Kuan and Jonas Mueller. 2022. Back to the basics: Revisiting out-of-distribution detection baselines.
- Liang et al. (2018) Shiyu Liang, Yixuan Li, and R. Srikant. 2018. Enhancing the reliability of out-of-distribution image detection in neural networks. In International Conference on Learning Representations.
- Liu et al. (2020) Weitang Liu, Xiaoyun Wang, John D. Owens, and Yixuan Li. 2020. Energy-based out-of-distribution detection. In NeurIPS.
- Liu et al. (2019) Yinhan Liu, Myle Ott, Naman Goyal, Jingfei Du, Mandar Joshi, Danqi Chen, Omer Levy, Mike Lewis, Luke Zettlemoyer, and Veselin Stoyanov. 2019. Roberta: A robustly optimized BERT pretraining approach. CoRR, abs/1907.11692.
- Maas et al. (2011) Andrew L. Maas, Raymond E. Daly, Peter T. Pham, Dan Huang, Andrew Y. Ng, and Christopher Potts. 2011. Learning word vectors for sentiment analysis. In Proceedings of the 49th Annual Meeting of the Association for Computational Linguistics: Human Language Technologies, pages 142–150, Portland, Oregon, USA. Association for Computational Linguistics.
- McGraw Hill (1995) McGraw Hill. 1995. 20 newsgroups dataset.
- Misra (2022) Rishabh Misra. 2022. News category dataset. arXiv preprint arXiv:2209.11429.
- Mosqueira-Rey et al. (2022) Eduardo Mosqueira-Rey, Elena Hernández-Pereira, David Alonso-Ríos, José Bobes-Bascarán, and Ángel Fernández-Leal. 2022. Human-in-the-loop machine learning: A state of the art. Artif. Intell. Rev., 56(4):3005–3054.
- Pandya and Bhatt (2021) Hariom A Pandya and Brijesh S Bhatt. 2021. Question answering survey: Directions, challenges, datasets, evaluation matrices. arXiv preprint arXiv:2112.03572.
- Park et al. (2022) Hyunji Park, Yogarshi Vyas, and Kashif Shah. 2022. Efficient classification of long documents using transformers. In Proceedings of the 60th Annual Meeting of the Association for Computational Linguistics (Volume 2: Short Papers), pages 702–709, Dublin, Ireland. Association for Computational Linguistics.
- Podolskiy et al. (2021) A. V. Podolskiy, Dmitry Lipin, A. Bout, E. Artemova, and Irina Piontkovskaya. 2021. Revisiting mahalanobis distance for transformer-based out-of-domain detection. In AAAI Conference on Artificial Intelligence.
- Raskutti et al. (2011) Garvesh Raskutti, Martin J. Wainwright, and Bin Yu. 2011. Early stopping for non-parametric regression: An optimal data-dependent stopping rule. In 2011 49th Annual Allerton Conference on Communication, Control, and Computing (Allerton), pages 1318–1325.
- Rawat et al. (2021) Mrinal Rawat, Ramya Hebbalaguppe, and Lovekesh Vig. 2021. Pnpood : Out-of-distribution detection for text classification via plug andplay data augmentation.
- Ren et al. (2021) Jie Ren, Stanislav Fort, Jeremiah Liu, Abhijit Guha Roy, Shreyas Padhy, and Balaji Lakshminarayanan. 2021. A simple fix to mahalanobis distance for improving near-ood detection. CoRR, abs/2106.09022.
- Saji (2021) Basil Saji. 2021. A dataset for language detection. https://www.kaggle.com/datasets/basilb2s/language-detection. Accessed: 2023-04-15.
- Schrouff et al. (2022) Jessica Schrouff, Natalie Harris, Sanmi Koyejo, Ibrahim M Alabdulmohsin, Eva Schnider, Krista Opsahl-Ong, Alexander Brown, Subhrajit Roy, Diana Mincu, Christina Chen, Awa Dieng, Yuan Liu, Vivek Natarajan, Alan Karthikesalingam, Katherine A Heller, Silvia Chiappa, and Alexander D' Amour. 2022. Diagnosing failures of fairness transfer across distribution shift in real-world medical settings. In Advances in Neural Information Processing Systems, volume 35, pages 19304–19318. Curran Associates, Inc.
- Socher et al. (2013) Richard Socher, Alex Perelygin, Jean Wu, Jason Chuang, Christopher D. Manning, Andrew Ng, and Christopher Potts. 2013. Recursive deep models for semantic compositionality over a sentiment treebank. In Proceedings of the 2013 Conference on Empirical Methods in Natural Language Processing, pages 1631–1642, Seattle, Washington, USA. Association for Computational Linguistics.
- Sun et al. (2021) Yiyou Sun, Chuan Guo, and Yixuan Li. 2021. React: Out-of-distribution detection with rectified activations. In NeurIPS, pages 144–157.
- Sun and Li (2022) Yiyou Sun and Yixuan Li. 2022. Dice: Leveraging sparsification for out-of-distribution detection.
- Sun et al. (2022) Yiyou Sun, Yifei Ming, Xiaojin Zhu, and Yixuan Li. 2022. Out-of-distribution detection with deep nearest neighbors. In International Conference on Machine Learning, pages 20827–20840. PMLR.
- Teney et al. (2020) Damien Teney, Kushal Kafle, Robik Shrestha, Ehsan Abbasnejad, Christopher Kanan, and Anton van den Hengel. 2020. On the value of out-of-distribution testing: An example of goodhart’s law. In Proceedings of the 34th International Conference on Neural Information Processing Systems, NIPS’20, Red Hook, NY, USA. Curran Associates Inc.
- Vaswani et al. (2017) Ashish Vaswani, Noam Shazeer, Niki Parmar, Jakob Uszkoreit, Llion Jones, Aidan N Gomez, Ł ukasz Kaiser, and Illia Polosukhin. 2017. Attention is all you need. In Advances in Neural Information Processing Systems, volume 30. Curran Associates, Inc.
- Wang et al. (2022a) Haoqi Wang, Zhizhong Li, Litong Feng, and Wayne Zhang. 2022a. Vim: Out-of-distribution with virtual-logit matching. In NeurIPS, volume abs/2203.10807.
- Wang et al. (2022b) Yu Wang, Hanghang Tong, Ziye Zhu, and Yun Li. 2022b. Nested named entity recognition: A survey. ACM Trans. Knowl. Discov. Data, 16(6).
- Wu et al. (2022) Xingjiao Wu, Luwei Xiao, Yixuan Sun, Junhang Zhang, Tianlong Ma, and Liang He. 2022. A survey of human-in-the-loop for machine learning. Future Generation Computer Systems, 135:364–381.
- Yang et al. (2022a) Jingkang Yang, Pengyun Wang, Dejian Zou, Zitang Zhou, Kunyuan Ding, Wenxuan Peng, Haoqi Wang, Guangyao Chen, Bo Li, Yiyou Sun, Xuefeng Du, Kaiyang Zhou, Wayne Zhang, Dan Hendrycks, Yixuan Li, and Ziwei Liu. 2022a. Openood: Benchmarking generalized out-of-distribution detection. NeurIPS.
- Yang et al. (2021) Jingkang Yang, Kaiyang Zhou, Yixuan Li, and Ziwei Liu. 2021. Generalized out-of-distribution detection: A survey. arXiv preprint arXiv:2110.11334.
- Yang et al. (2022b) Linyi Yang, Shuibai Zhang, Libo Qin, Yafu Li, Yidong Wang, Hanmeng Liu, Jindong Wang, Xing Xie, and Yue Zhang. 2022b. Glue-x: Evaluating natural language understanding models from an out-of-distribution generalization perspective.
- Zhang et al. (2015) Xiang Zhang, Junbo Zhao, and Yann LeCun. 2015. Character-level Convolutional Networks for Text Classification. arXiv:1509.01626 [cs].
- Zhang et al. (2010) Yin Zhang, Rong Jin, and Zhi-Hua Zhou. 2010. Understanding bag-of-words model: A statistical framework. International Journal of Machine Learning and Cybernetics.
- Zhang et al. (2023) Yuhang Zhang, Weihong Deng, and Liang Zheng. 2023. Unsupervised evaluation of out-of-distribution detection: A data-centric perspective.
- Zhang (2018) Zijun Zhang. 2018. Improved adam optimizer for deep neural networks. In 2018 IEEE/ACM 26th International Symposium on Quality of Service (IWQoS), pages 1–2.
- Zhao et al. (2023) Wayne Xin Zhao, Kun Zhou, Junyi Li, Tianyi Tang, Xiaolei Wang, Yupeng Hou, Yingqian Min, Beichen Zhang, Junjie Zhang, Zican Dong, Yifan Du, Chen Yang, Yushuo Chen, Zhipeng Chen, Jinhao Jiang, Ruiyang Ren, Yifan Li, Xinyu Tang, Zikang Liu, Peiyu Liu, Jian-Yun Nie, and Ji-Rong Wen. 2023. A survey of large language models. CoRR, abs/2303.18223.
- Zhou et al. (2021) Wenxuan Zhou, Fangyu Liu, and Muhao Chen. 2021. Contrastive out-of-distribution detection for pretrained transformers. In Proceedings of the 2021 Conference on Empirical Methods in Natural Language Processing, pages 1100–1111, Online and Punta Cana, Dominican Republic. Association for Computational Linguistics.
- Zong et al. (2018) Bo Zong, Qi Song, Martin Renqiang Min, Wei Cheng, Cristian Lumezanu, Dae ki Cho, and Haifeng Chen. 2018. Deep autoencoding gaussian mixture model for unsupervised anomaly detection. In ICLR (Poster).
Appendix A Training Details
Each model was trained on five different seeds from range . Table 4 includes averaged classification metrics with standard deviation.
| Dataset | Accuracy | F1 Score | Precision | Recall |
|---|---|---|---|---|
| NC/I | 82.4±0.1 | 81.8±0.1 | 81.7±0.2 | 82.0±0.2 |
| Computer | 89.2±0.3 | 89.3±0.4 | 89.3±0.4 | 89.3±0.3 |
| Politics | 94.7±0.3 | 94.6±0.3 | 94.6±0.4 | 94.7±0.3 |
| Sports | 97.5±0.2 | 97.5±0.2 | 97.5±0.2 | 97.5±0.2 |
| IMDB | 94.7±0.1 | 94.7±0.1 | 94.7±0.1 | 94.7±0.1 |
| SST-2 | 93.9±0.1 | 93.8±0.1 | 93.7±0.1 | 93.8±0.1 |
| Yelp | 96.9±0.0 | 96.9±0.0 | 96.9±0.0 | 96.9±0.0 |
Appendix B Evaluation Details
The values for all metrics that were considered in our experiments are listed below. Tables 5 and 6 refer to the Scenario 1 of OOD data preparation; Tables 7 and 8 report the results from the Scenario 2.
| Method | NC/O | IMDB | SST-2 | Yelp | Language | NCR/I | NCR/O | |
|---|---|---|---|---|---|---|---|---|
| MSP | 71.7±0.4 | 97.3±0.3 | 98.4±1.5 | 91.9±1.8 | 97.4±0.8 | 99.2±0.3 | 59.2±1.1 | 80.4±0.7 |
| Energy | 74.5±0.6 | 98.5±0.2 | 99.8±0.2 | 96.3±1.3 | 99.2±0.4 | 99.8±0.1 | 58.8±1.3 | 84.0±0.9 |
| GradNorm | 73.9±0.7 | 98.2±0.3 | 99.5±0.6 | 95.4±1.1 | 98.8±0.4 | 99.7±0.1 | 58.5±1.9 | 83.8±1.0 |
| KL-Matching | 51.0±0.4 | 90.9±0.7 | 94.1±5.1 | 72.0±2.8 | 87.7±3.6 | 96.6±1.3 | 48.3±0.2 | 54.8±0.5 |
| ReAct | 74.3±0.5 | 98.4±0.2 | 99.8±0.2 | 96.1±1.4 | 99.2±0.4 | 99.8±0.1 | 58.9±1.4 | 83.7±0.9 |
| DICE | 51.8±0.7 | 96.0±0.4 | 91.0±2.6 | 82.6±0.9 | 94.1±0.9 | 95.0±0.5 | 51.0±1.0 | 56.7±1.5 |
| KNN | 78.5±0.1 | 99.3±0.1 | 99.9±0.0 | 98.3±0.5 | 99.8±0.1 | 99.9±0.0 | 68.9±1.3 | 88.6±0.6 |
| VIM | 77.1±0.1 | 99.0±0.2 | 96.5±1.1 | 98.1±0.5 | 97.1±0.6 | 99.7±0.1 | 58.9±0.9 | 85.5±0.4 |
| Method | NC/O | IMDB | SST-2 | Yelp | Language | NCR/I | NCR/O | |
|---|---|---|---|---|---|---|---|---|
| MSP | 82.3±0.8 | 77.3±4.8 | 19.6±18.8 | 61.3±7.8 | 21.5±6.7 | 29.3±10.7 | 91.3±0.5 | 75.2±1.4 |
| Energy | 75.2±1.0 | 55.7±7.3 | 2.4±2.7 | 35.8±10.5 | 7.1±3.5 | 7.6±3.5 | 89.0±0.6 | 63.8±1.9 |
| GradNorm | 75.9±0.8 | 65.1±6.9 | 5.7±6.3 | 44.0±7.9 | 11.2±4.0 | 12.9±5.0 | 88.8±0.7 | 63.7±2.1 |
| KL-Matching | 85.8±0.5 | 85.4±3.5 | 33.8±29.7 | 76.4±4.6 | 30.2±8.7 | 55.7±9.2 | 92.3±0.3 | 80.2±0.8 |
| ReAct | 75.3±1.1 | 55.3±7.2 | 2.2±2.5 | 35.6±10.6 | 7.0±3.4 | 7.6±3.6 | 89.2±0.6 | 64.2±1.9 |
| DICE | 95.2±0.3 | 99.9±0.0 | 100.0±0.0 | 99.9±0.1 | 99.4±0.9 | 100.0±0.0 | 96.3±0.3 | 97.1±0.5 |
| KNN | 73.9±0.6 | 34.4±5.4 | 0.2±0.1 | 22.1±8.6 | 2.2±0.7 | 1.4±0.5 | 85.7±0.7 | 56.1±1.6 |
| VIM | 71.5±0.5 | 57.8±4.7 | 86.5±12.4 | 23.7±5.2 | 63.3±10.7 | 13.2±8.0 | 88.9±0.5 | 63.4±1.1 |
| ID | OOD | MSP | Energy | GradNorm | KLM | ReAct | DICE | KNN | VIM |
|---|---|---|---|---|---|---|---|---|---|
| Computer | Politics | 95.2±1.1 | 97.7±0.7 | 97.4±0.5 | 77.7±8.2 | 97.6±0.7 | 56.1±11.4 | 98.2±0.3 | 99.1±0.2 |
| Sports | 93.3±1.9 | 96.4±1.1 | 96.0±1.0 | 71.3±5.5 | 96.2±1.2 | 64.3±9.0 | 97.1±0.6 | 98.3±0.4 | |
| Politics | Computer | 93.8±0.7 | 94.8±0.7 | 94.6±0.7 | 67.3±9.0 | 94.7±0.7 | 68.9±2.2 | 96.7±0.2 | 97.9±0.2 |
| Sports | 91.6±1.2 | 92.8±1.0 | 92.4±1.2 | 60.8±9.6 | 92.6±1.1 | 67.5±1.9 | 95.8±0.3 | 97.1±0.3 | |
| Sports | Computer | 96.3±0.7 | 96.9±1.1 | 97.1±0.5 | 70.1±7.4 | 96.8±1.1 | 67.2±6.4 | 98.0±0.3 | 98.7±0.2 |
| Politics | 96.6±0.4 | 97.1±0.9 | 97.4±0.5 | 75.3±1.7 | 97.1±0.9 | 66.0±9.7 | 98.2±0.2 | 98.6±0.1 | |
| IMDB | SST-2 | 86.2±1.4 | 84.8±1.8 | 73.7±6.6 | 52.2±1.2 | 85.0±1.8 | 85.5±3.6 | 98.1±1.0 | 97.6±0.6 |
| Yelp | 82.1±2.8 | 80.8±3.6 | 71.5±3.3 | 38.8±0.6 | 81.2±3.9 | 51.4±8.0 | 97.9±0.8 | 98.6±0.6 | |
| SST-2 | IMDB | 85.7±1.5 | 85.1±2.0 | 69.4±3.0 | 48.6±1.4 | 85.7±2.2 | 41.1±5.0 | 91.4±0.8 | 86.5±2.5 |
| Yelp | 76.3±2.8 | 75.4±3.5 | 60.5±3.5 | 47.4±1.5 | 76.3±3.8 | 40.6±3.6 | 91.4±0.4 | 82.5±2.6 | |
| Yelp | IMDB | 83.5±0.5 | 82.7±2.5 | 76.1±2.3 | 41.1±0.5 | 83.0±2.4 | 36.8±1.6 | 88.2±0.6 | 91.2±0.5 |
| SST-2 | 93.8±0.4 | 93.7±0.7 | 88.8±0.8 | 50.2±1.6 | 93.9±0.7 | 63.3±8.2 | 98.9±0.2 | 99.3±0.1 |
| ID | OOD | MSP | Energy | GradNorm | KLM | ReAct | DICE | KNN | VIM |
|---|---|---|---|---|---|---|---|---|---|
| Computer | Politics | 55.9±11.7 | 20.9±7.4 | 31.0±8.4 | 61.6±12.6 | 21.3±7.5 | 99.9±0.1 | 17.3±4.6 | 7.2±1.8 |
| Sports | 61.4±9.3 | 30.8±8.8 | 39.7±8.7 | 66.7±9.6 | 31.4±8.6 | 99.1±0.9 | 29.6±6.3 | 14.1±5.6 | |
| Politics | Computer | 38.4±8.9 | 22.0±4.0 | 28.1±8.9 | 42.1±9.8 | 22.7±4.1 | 98.8±0.9 | 22.8±4.6 | 9.4±1.6 |
| Sports | 55.8±7.4 | 35.6±4.7 | 42.5±9.4 | 59.4±7.8 | 36.5±4.7 | 99.4±0.5 | 35.8±5.0 | 16.2±3.1 | |
| Sports | Computer | 27.9±6.6 | 18.1±5.7 | 18.2±5.1 | 32.2±5.1 | 18.8±6.0 | 96.0±2.3 | 11.8±4.2 | 6.0±1.6 |
| Politics | 30.5±3.6 | 21.0±2.8 | 21.0±2.9 | 33.9±2.3 | 21.7±3.3 | 95.5±7.4 | 17.7±2.6 | 9.1±1.2 | |
| IMDB | SST-2 | 65.6±0.9 | 68.5±9.4 | 67.3±1.6 | 65.6±0.9 | 69.1±10.7 | 54.4±9.6 | 12.5±8.2 | 14.0±3.9 |
| Yelp | 92.3±1.3 | 92.8±2.8 | 93.3±1.0 | 92.3±1.3 | 92.6±2.9 | 93.8±7.2 | 15.1±9.1 | 8.2±6.5 | |
| SST-2 | IMDB | 77.7±2.3 | 79.6±7.3 | 81.8±1.5 | 78.0±2.3 | 79.1±8.9 | 100.0±0.0 | 88.3±10.9 | 79.0±17.8 |
| Yelp | 84.5±2.4 | 85.8±6.2 | 87.6±1.2 | 84.8±2.3 | 85.2±7.0 | 99.7±0.2 | 81.0±9.0 | 82.2±13.1 | |
| Yelp | IMDB | 83.7±0.6 | 83.5±1.4 | 87.1±0.7 | 83.6±0.6 | 83.2±1.4 | 99.7±0.1 | 74.9±3.8 | 62.4±2.5 |
| SST-2 | 58.4±2.4 | 58.6±4.0 | 66.7±2.5 | 58.4±2.4 | 57.9±4.2 | 96.1±4.7 | 3.8±1.5 | 2.4±0.8 |