Is Task-Agnostic Explainable AI a Myth?
Abstract
Our work serves as a framework for unifying the challenges of contemporary explainable AI (XAI). We demonstrate that while XAI methods provide supplementary and potentially useful output for machine learning models, researchers and decision-makers should be mindful of their conceptual and technical limitations, which frequently result in these methods themselves becoming black boxes. We examine three XAI research avenues spanning image, textual, and graph data, covering saliency, attention, and graph-type explainers. Despite the varying contexts and timeframes of the mentioned cases, the same persistent roadblocks emerge, highlighting the need for a conceptual breakthrough in the field to address the challenge of compatibility between XAI methods and application tasks.
1 Introduction
The development of explainability methods, or their incorporation into AI models, has often been motivated by the aim of enhancing user trust in the model. Users may view explanations similarly; for instance, a survey of clinicians by (Tonekaboni et al., 2019) revealed that they perceive explainability as “a means to justify their clinical decision-making.”
Despite numerous results highlighting limitations of explanations (Adebayo et al., 2018; Rudin, 2019; Slack et al., 2020; Tomsett et al., 2020; Neely et al., 2021; Bilodeau et al., 2022), they continue to be considered in high-risk decision contexts, such as healthcare (Loh et al., 2022).
While various methods have been developed and used, we observe a missing link between the theoretical or technical problems that these methods address and the way in which practitioners may hope to apply them – to assist with actual real-world tasks and decision-making. Our work elucidates why XAI methods are not, in general, reliable decision justification enablers.
We focus on a broad class of explanations, for which a complex uninterpretable machine learning model is first trained, and then XAI aims to “explain” its predictions for a given input. We expose the unstable foundations of the examined XAI methods by presenting three illustrative research case studies that disclose a prevailing pattern across various machine learning tasks, data domains, and time frames. This pattern can be succinctly described as follows:
-
•
Stage 1: XAI method is developed, but its utility is presented in a simplistic setup; theoretical guarantees relevant to potential real-world tasks are missing.
-
•
Stage 2: As variations of the method are developed, an alternative perspective allows for a more comprehensive evaluation, revealing the method’s limitations and bringing its reliability into question.
-
•
Stage 3: The inconclusive, and sometimes contradictory results, provided by subsequent evaluation techniques, metrics, and theoretical considerations, make it challenging to determine the best-suited method variation for specific practical tasks and to identify when the method is truly effective and dependable. It demonstrates that the methods cannot be considered reliable task-agnostic explainers.
Our work is not a survey but can serve as a framework for unifying the challenges in the development process of contemporary XAI, which tends to follow the listed above stages. We hope this framework assists researchers, current practitioners, and potential XAI users in a better contextual understanding of what XAI currently is and is not.
In the following, we investigate three XAI research trajectories covering image, text, and graph data, which utilize saliency, attention, and graph-based explanation methods, respectively. Each research story is presented in a distinct section, wherein the subsections directly correspond to the stages delineated in the framework we propose.
2 Saliency explainers & image data
The first research story is a classic of explainable AI literature. Natural to modern deep learning pipelines and straightforward to implement, saliency methods have quickly become a popular XAI tool (Samek et al., 2021). The idea behind them is to apply the first-order approximation of the amount of influence that the input data has on the machine learning model output.
The saliency methods can be used across different data domains. Originally, they were introduced for computer vision tasks and are still frequently applied in this context. In the following discussion, we also focus on image data.
2.1 Stage 1: Idea and methods
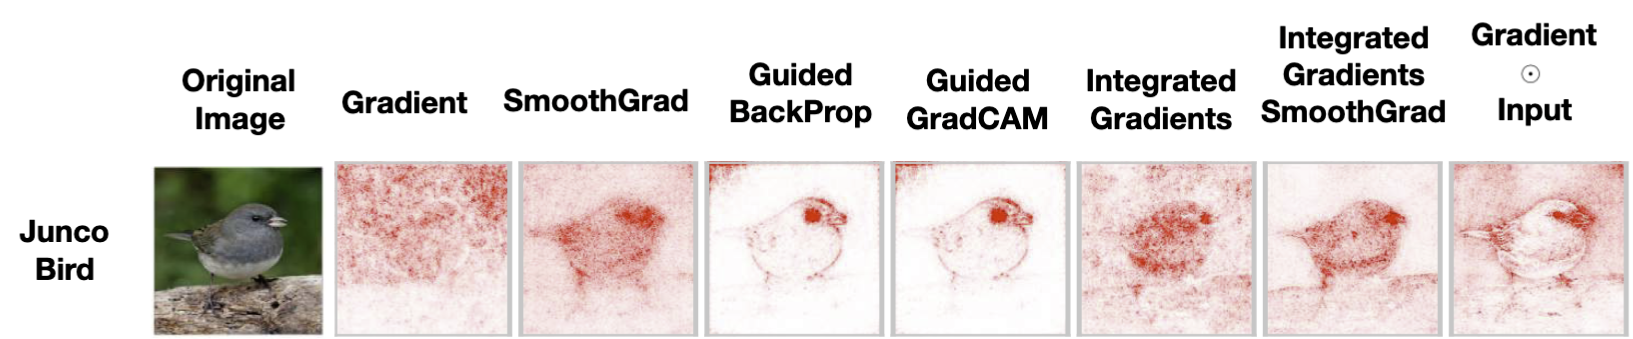
The vanilla saliency method (Simonyan et al., 2014) boils down to a gradient computation of output with respect to input data. The result is a map with the same dimensionality as the input, showing each input part’s detailed “importance” (here, gradient). Taking images as an example, each pixel gets its attribution value, which is a gradient of output with respect to this pixel. The end product is a saliency map (Figure 1).

The initial gradient idea sparked a fruitful investigation that aimed to make the gradient-based influence approximation better and the resulting maps “clearer” (Figure 2). The engineered methods included combining gradients with input data values, smoothing gradients by adding noise and averaging, integrating gradients over a path from a baseline image (e.g., a black image), zeroing out negative gradients while backpropagating or combining gradients and final convolutional layer feature maps (GradientxInput (Shrikumar et al., 2017), SmoothGrad (Smilkov et al., 2017), Integrated (Sundararajan et al., 2017), Guided Backpropagation (Springenberg et al., 2015), GradCAM (Selvaraju et al., 2016))
None of those methods was evaluated in a quantitative way, as pointed out by the paper introducing SmoothGrad, the latest of the listed above methods: “Since there is no ground truth to allow for quantitative evaluation of sensitivity maps, we follow prior work and focus on two aspects of qualitative evaluation.”(Smilkov et al., 2017) The two mentioned aspects relied on purely visual qualitative analysis.
At that stage, evaluations and comparisons prioritized visual aspects. Although many methods drew inspiration from theoretical concepts, they lacked a direct connection and guarantees related to how well the “explanations” correspond to the model’s “reasoning” process.
2.2 Stage 2: Experiments questioning reliability
Throughout that development phase, assessments were carried out to determine if the saliency maps generated aligned with the method’s initial goal to “explain” the model. The method’s reliability was called into question through meticulously designed experiments.
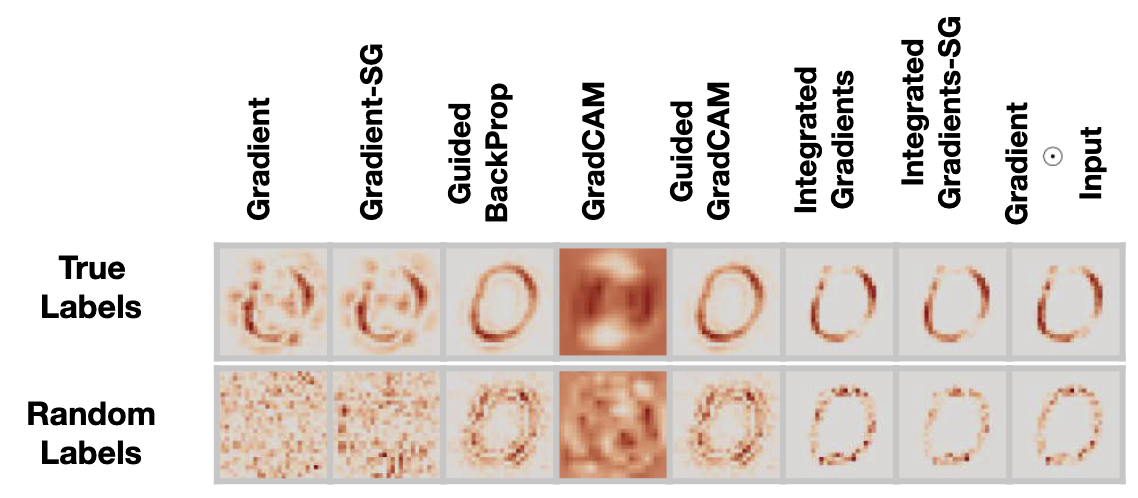
A fresh perspective on the evaluation and validity of the saliency methods came in the work “Sanity Checks for Saliency Maps” (Adebayo et al., 2018). The paper introduced two sanity checks that could reveal if a given saliency method is not working as intended, i.e., serving as an explanation. The two checks analyzed how the saliency maps change
-
•
when the model weights are randomized;
-
•
when the model is trained on data with random labels.
The results of the novel quantitative empirical analysis were alarming. Only two of the tested methods fully passed the checks. The other ones produced visually very similar results independent of whether the model was properly trained, had randomized weights or was trained on random labels. For example, if saliency maps for the classification of a digit 0 were generated for a model trained on the MNIST dataset with random labels, the “explanations” looked as in Figure 3. Many saliency methods produced sensible “explanations”, while the network was unable to classify with a better than random guessing accuracy.
One might point out that this analysis is still purely visual. Indeed, the authors also compared pre- and post-randomization saliency maps quantitatively, and, for some of the methods, the metrics were telling a different story than the visuals, i.e., in some cases, some metrics distinguished between the two scenarios (pre- and post-randomization) while visually the produced maps seemed very similar.
2.3 Stage 3: Beyond original visual assessment
It became evident that solely relying on a visual comparison of methods is insufficient for assessing their effectiveness. As a result, new metrics and tests have been developed to evaluate the connection between methods and their corresponding tasks. However, designing these metrics presented challenges.
2.3.1 Metrics and ground truth
A natural next step might be to find “good metrics”, based on which it could be determined whether or not a given saliency method is best at producing “relevant explanations”. This, however, is a tough problem when ground truth explanations are unknown; many suggested metrics for saliency map evaluation have been shown to be unreliable (Tomsett et al., 2020; Hedström et al., 2023). Another approach is to use a dataset with known ground truth. Under such a scenario, we can see which method recovers the ground truth best. The results, however, do not necessarily generalize to a real-world dataset of interest (Yang & Kim, 2019). Moreover, a “golden” metric would not be a complete problem solution. A visual inspection might be the actual way how users interact with an explanation method. If this is the case, we would need to ensure that conclusions based on visual perception are helpful for a task of interest; a proper metric would be insufficient.
2.3.2 Sanity checks
Not only metrics but also the tests themselves are so far unable to tell the whole story. A sanity check or an evaluation protocol is not a task-independent indicator of the saliency method’s validity. We should take into account how the saliency method, model, and task interact with each other, as this might confound the final validity or invalidity conclusion. For example, even if the network weight randomization sanity check fails, it actually does not determine that the tested saliency method is generally insensitive to model weights. It rather shows that the inductive bias in the network is strong enough that for some specific combinations of saliency method and task, the method produces “explanation-like” looking outputs (Yona & Greenfeld, 2021). Moreover, the above sanity checks are not exhaustive, and other tests have been proposed (Kindermans et al., 2019).
Saliency maps are explanations that can be generated for any differentiable models. However, in light of these limitations, providing concrete guarantees or applying rigorous assessment tools to accurately establish their comparative effectiveness and reliability is currently unattainable.
3 Attention explainers & textual data
Let us consider another explainability method based on potentially “interpretable” attention components of a model.
The attention mechanism (Bahdanau et al., 2015; Vaswani et al., 2017) is a technique used in neural networks to focus on certain parts of the input data selectively. By emphasizing or ignoring certain information, attention can improve model performance and, possibly, model explainability potential. While attention “explanations” are currently used across different tasks, attention was initially introduced as part of natural language processing models. In the following, we focus on the NLP domain.
3.1 Stage 1: Idea and methods
The attention weights that determine focus on the given input part can be considered “importance” weights, i.e., the bigger the weight, the more critical the input element is (Figure 4)111The attention mechanism is used in different layers, and the input to the attention module is not necessarily the model input. In the following, we will focus on attention weights with respect to NLP model inputs. The attention weights “interpretation” occurs in a much broader context (e.g., various data modalities, different attention module types, variability across layers). Highlighting input elements with the greatest attention scores has been used in numerous research papers to visualize neural network “reasoning process” and to somehow “explain” it, for example (Xu et al., 2015; Choi et al., 2016; Lee et al., 2017; Mullenbach et al., 2018; Chen et al., 2020).

At that stage, interpreting weights in the attention module as “importance” is abstract and ill-defined. Used to highlight key input components, this high-level concept aids users in identifying crucial input aspects but falls short of providing a thorough understanding of underlying mechanisms and the model’s “reasoning”.
3.2 Stage 2: Investigations challenging dependability
If the attention weights are employed as explanations for the model’s “reasoning process”, it is essential to assess them as such and examine their correlation with the model’s actual behavior.
The work “Attention is not explanation” (Jain & Wallace, 2019) raised concern about the ongoing natural adoption of the attention mechanism for explainability purposes. The authors posed the following questions:
-
•
Do attention weights correlate with other feature importance measures?
-
•
Do alternative attention weights significantly change model predictions?
Based on the performed empirical tests, the answer to both was “No, largely they do not.”
To answer the first question, the work compared computed attention scores with importance measures based on gradients (see Section 2) and leave-one-out methods – one input element was removed, and the amount of change in the output was attributed as the importance of this element. The experiments demonstrated no consistent correlation between the attention scores and those two other importance attribution methods.
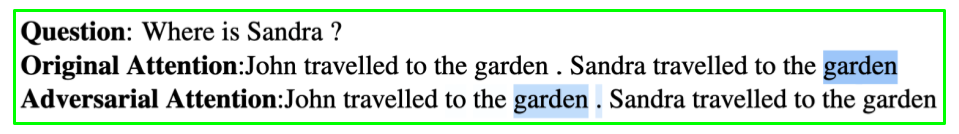
The second question was addressed by assessing the output change in the case of permuted attention weights and adversarial attention weights, which were found by maximizing the distance from the original attention scores while keeping the model output similar. The two tests showed there exist many alternative attention weights configurations (found by shuffling or adversarially) that produce similar model outputs (Figure 5).
3.3 Stage 3: Inconsistencies in evaluation methods
Previously established evaluation methods were not comprehensive; further research and findings demonstrate numerous nuances related to the evaluation process and the evaluation tasks. Various papers have attempted to make attention mechanisms “more explanatory”, while others suggest that attention may serve as an explanation for some tasks but not for others.
3.3.1 Adversarial weights
The mentioned above conclusions were shortly questioned by “Attention is not not explanation” (Wiegreffe & Pinter, 2019). The authors found the permuted and adversarial attention weights experiments insufficient to support the claim that attention is not an explanation.
Therefore they suggested new diagnostic tests. The experiments were performed on the datasets filtered by a procedure that checked if a model with an attention module was significantly better than a model with fixed uniform weights. If the test outcome was negative, the authors did not consider the given dataset further, claiming that “attention is not explanation if you don’t need it.”.
Then an adversary network was trained for the whole dataset, unlike (Jain & Wallace, 2019), who found adversarial weights per individual data instance. This change in adversary computation was justified by the statement that manipulating part of the trained model per instance did not actually demonstrate a full adversarial model able to produce claimed adversarial explanations.
The new experimental analysis showed that the fully adversarial model did manage to find adversarial attention weights, but they were not as distant from the original weights as in (Jain & Wallace, 2019). Moreover, the adversarial weights seemed to have less encoded information when tested with the introduced diagnostic tool, which compared the performance of the MLP network with the final layer averaging token representations using original attention vs. adversarial weights. The traditional original attention weights resulted in better MLP evaluation scores. The authors conclude that in the current form, attention weights cannot be treated as “one true, faithful interpretation of the link” between model inputs and outputs but that the experimental analysis done so far does not show that attention is not an explanation.
3.3.2 Correlation with other attributions
While (Wiegreffe & Pinter, 2019) found the experimental analysis for agreement between attention importance and other feature importance measures valid, the later work (Neely et al., 2021) claims that measuring agreement is not a proper evaluation method. Consistency as evaluation implicitly assumes that one of the methods is nearly ideal, since we aim to find a high correlation with it. This is not necessarily true. (Neely et al., 2021) show little correlation between a range of feature attribution methods.
3.3.3 Further points
(Serrano & Smith, 2019) claim attention weights do not form good explanations as it is easier to make a model flip its decision by removing features with higher gradient importance rather than ones with high attention weights. Conversely, (Vashishth et al., 2019) point out that cited above (Jain & Wallace, 2019; Wiegreffe & Pinter, 2019; Serrano & Smith, 2019) all evaluated attention explainability for a single NLP task type. (Vashishth et al., 2019) claim that in other NLP tasks, attention is “more explainable”. Some researchers attempt to modify attention mechanisms so that it better reflects the model’s decision process (Mohankumar et al., 2020).
The debate, on whether attention is a good explanation and, if so, when, is still ongoing (Bibal et al., 2022). The discrepancies observed among evaluations result in no guarantees when applying this explanation method in task-agnostic settings, given the numerous variations in behaviors encountered.
4 Graph-type explainers & graph data
Let us continue to the most recent research story, which in contrast to saliency 2 and attention 3 starts with some set of clearly defined quantitative “explainability” evaluation tests.
As Graph Neural Networks (GNNs) emerged as a new paradigm of machine learning on graphs, a need for XAI methods for GNNs arose.
The saliency methods (Section 2) can be applied to GNNs, as pioneered by (Pope et al., 2019; Baldassarre & Azizpour, 2019). Attention weights XAI ideas (Section 3) can be used as well and transfer directly to the GNN domain when Graph Attention Networks are the model of choice (Velickovic et al., 2018).
Although these two categories of explainability techniques can be employed, the inherent nature of graphs that combine feature information and topological structure gave rise to many XAI ideas targeting graph-based data.
4.1 Stage 1: Idea and methods
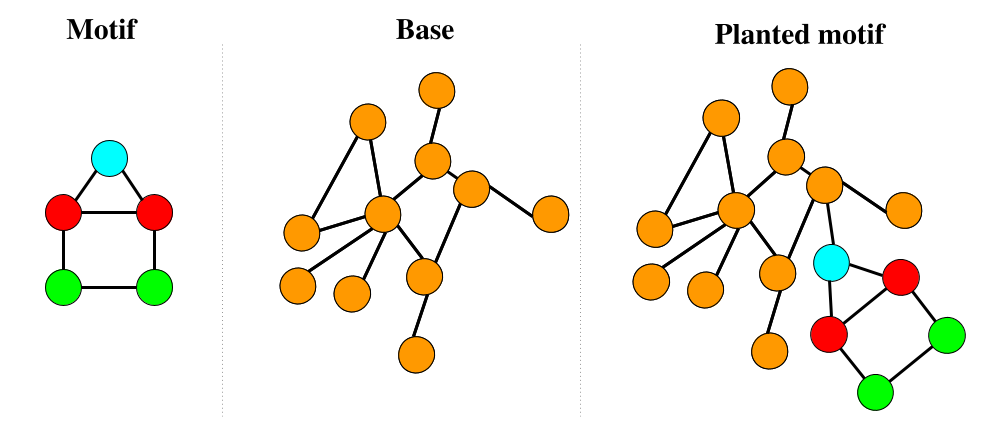
The first method providing explanations specifically for GNNs was GNNExplainer (Ying et al., 2019). GNNExplainer aims to find a compact subgraph that is the most influential driver behind a GNN prediction. This subgraph is determined by the edge and feature masks found in a gradient-based optimization procedure.
To evaluate the method (Ying et al., 2019) suggest a set of synthetic datasets. The graphs in the datasets are generated randomly, and the ground truth classes are dictated by predefined motifs planted in the graphs (Figure 6). The explainers can then be evaluated based on their ability to find those motifs. (Ying et al., 2019) evaluate predictions also qualitatively on two real-world datasets.
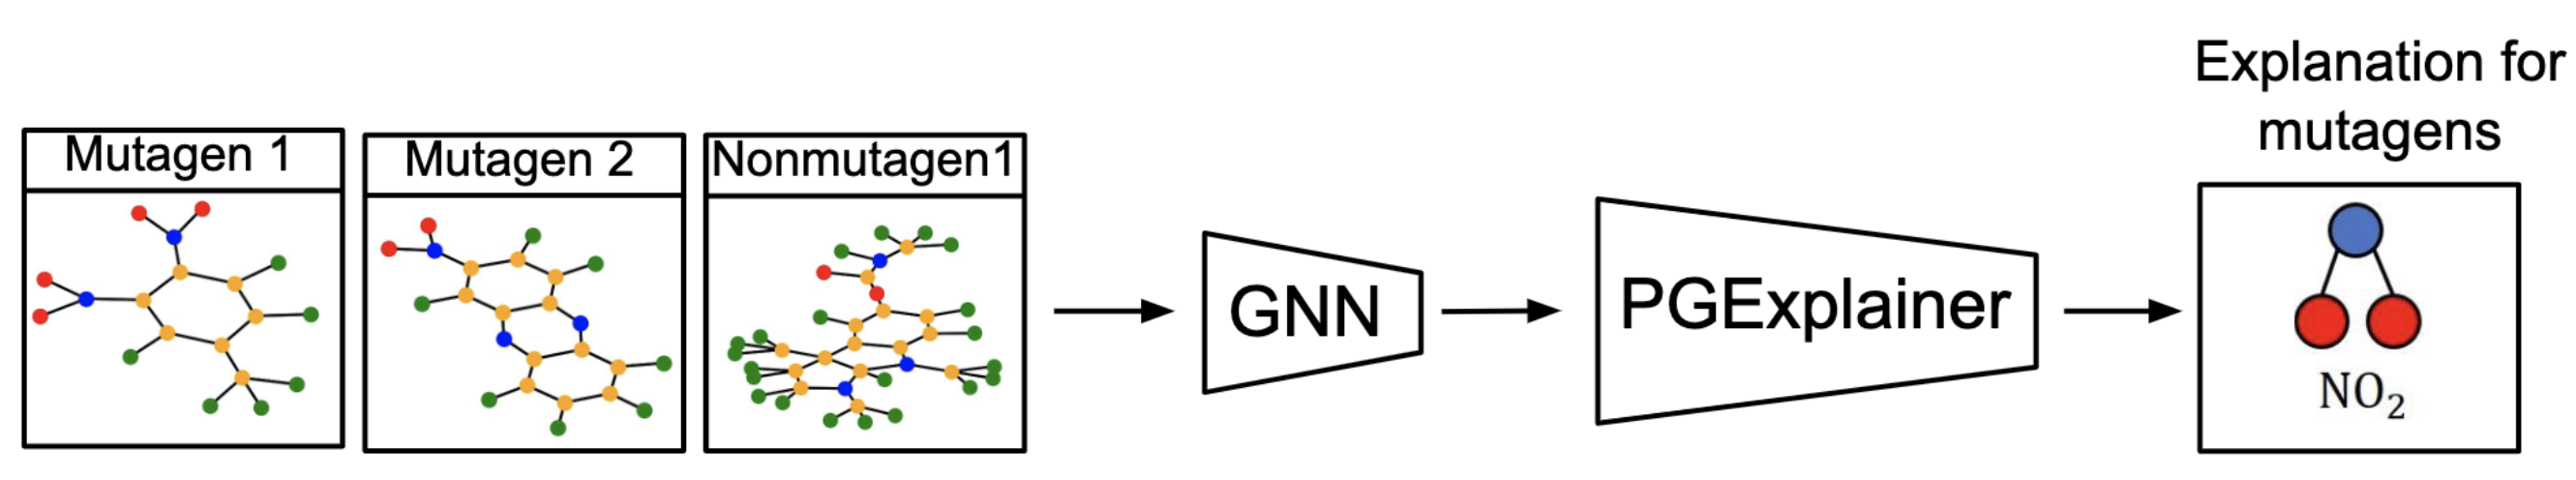
The subsequent work, such as PGExplainer (Luo et al., 2020), PGMExplainer (Yuan et al., 2021), and SubgraphX (Vu & Thai, 2020), followed (Ying et al., 2019) and evaluated GNN explainers on the suggested synthetic datasets or their close variants. The set of real-world datasets employed displayed variation. One dataset frequently but not always utilized (Dai et al., 2022) to evaluate GNN explainers is MUTAG (Debnath et al., 1991) (Figure 7). Real-world datasets usually do not have ground truth “explanations”, therefore the evaluation is either qualitative or based on some metric showing how the model’s predictions change after manipulating the original graph, e.g., by removing the explanation part from the graph or taking the produced explanation as input, without the rest of the graph.
At this phase, the construction of graph explainable artificial intelligence (XAI) involves artificial tasks and an absence of definitive assurances.
4.2 Stage 2: Navigating datasets limitations
(Faber et al., 2021) find the state of evaluation of former GNN explainers’ work not satisfactory. They find evaluation procedures with synthetic datasets and also with real-world datasets limited and unreliable. They argue that former evaluations on real-world datasets done by manipulating the input graphs (for example, removing the explanation subgraph and checking how significantly the model output changes) are improper. For instance, in the case of more complex explanations, if a class corresponds to the presence of motif A or motif B, when both motifs are in a graph, removing either of the motifs would not change the model output. This would indicate that the removed motif is not important for the prediction, while it actually is. Moreover, they point out that, similarly to other data domains, manipulating input graphs changes input data distribution, which might affect the evaluation procedure.
Therefore they recommend using synthetic benchmark datasets with known ground truth. However, they find existing synthetic datasets and evaluation procedures prone to several pitfalls that prevent a fair explainers comparison:
-
•
Bias term GNN model can learn a bias term; for example, by default, it could output class 0, which corresponds to some planted motif A, and output class 1 if found evidence of the existence of motif B. Therefore, explainers will have no success finding motif A as an explanation subgraph because of the bias terms; this motif A is simply not used by the GNN reasoning process.
-
•
Redundant evidence If detecting only part of the motif suffices to produce a correct output, we should not expect an explainer to be able to find a full explanation subgraph.
-
•
Trivial explanation The existence of a trivial explanation, such as nearest neighbors nodes or personalized Page Rank (Page et al., 1999) attributions, might result in a positive evaluation of a GNN explainer, while it might be doing something trivial not connected to the GNN “reasoning”.
-
•
GNN performance and alignment In case GNN performs poorly on a given task, the fact that an explainer does not find a proper explanation may be due to imperfect GNN training and not an underperforming GNN explainer. Moreover, if architecture enforces processing of focus on the non-explanation graph part, a GNN explainer will be unable to uncover the pure explanatory part.
Three synthetic benchmark datasets introduced by (Faber et al., 2021) aim to avoid the above pitfalls. The authors evaluate several saliency gradient-based methods (Section 2) and two graphs targeting explainers GNNExplainer and PGMExplaner. The latter did not perform well on the proposed benchmarking datasets, while the former gave “mixed results”, with no method mastering all three datasets.
4.3 Stage 3: Lack of evaluation standardization
As the field of GNN explainers grew, several experimental research papers attempted to evaluate a set of developed GNN explainability methods.
(Agarwal et al., 2023) develop a flexible synthetic data generator taking (Faber et al., 2021) recommendations into account. The best performer among tested methods for the generated dataset is graph-data-focused SubgraphX. However, gradient-based methods take the lead when the experiments are conducted for three real-world datasets (modified for unique explanations).
(Amara et al., 2022) agree with (Faber et al., 2021) and argue that the initial set of synthetic datasets “gives only poor informative insight.” They show that simple baselines (e.g., Page Rank) almost always beat the developed, more sophisticated explainers on those datasets. Moreover, they evaluate GNN explainers on ten real-world datasets without ground-truth explanations. In contrast to (Faber et al., 2021), they perform an experimental evaluation using metrics quantifying GNN model output change when the explanatory part is removed or the only part left. Overall they find that the simple gradient saliency method performs best. Additionally, they present a decision tree of what explainability method is recommended depending on the metric of interest and explanation type. However, when testing the framework on a new dataset, the best-performing explainer turned out to be different from all the methods in the suggested decision tree for any choice of metrics and any explanation type.
When testing on a different set of real-world datasets without ground truth (Yuan et al., 2022) conclude that graph-data focused SubgraphX method “outperforms the other methods significantly and consistently.” On the contrary, a study of the use case of cyber malware analysis finds that the gradient-based methods perform best (Warmsley et al., 2022).
(Longa et al., 2022) introduce a set of synthetic datasets with known ground truth, aiming to follow (Faber et al., 2021) guidelines. The experimental analysis shows that which method performs best is not constant and changes between datasets. Not only datasets but also a GNN architecture influences strongly performance of explainability methods, which work well for some architectures and fail for others.
All of the above experimental studies use various evaluation protocols, a changing set of explainability methods, a different set of synthetic or real-world datasets, and various GNN model architectures.
The above, therefore, indicates that there are no comprehensive guidelines available for practitioners and that the field has yet to reach a consensus on evaluation methods for graph XAI.
5 Summary
5.1 Lack of reliability guarantees for XAI methods
We established a unifying framework to address XAI challenges, identifying a recurring three-stage pattern in method development, regardless of data type, explanation unit, or timeline. Initially, XAI methods lack real-world applicability due to simplistic presentation and missing guarantees. Assessing emerging variations reveals limitations and reliability concerns. Inconsistent evaluation results challenge the determination of tasks for specific methods, dismissing universally applicable XAI methods.
We illustrated the pattern in three cases – image, textual, and graph data with saliency, attention, and graph-type explainers (respectively addressed in Sections 2, 3, and 4). These cases, developed at different timescales, encountered similar roadblocks, emphasizing shared challenges in XAI development and proving a pervasive absence of comprehensive evaluation frameworks, standardized metrics, and robust reliability guarantees in the explainable AI domain.
Even though we did not cover all XAI areas, similar stories to the ones presented exist, and the same challenges apply. For example, not-covered techniques, such as SHAP (Lundberg & Lee, 2017) and LIME (Ribeiro et al., 2016), have been demonstrated to exhibit instability and inconsistency. This means that minor changes to the input can lead to significant differences in the explanations provided, and even reapplying the same method to an identical input can yield dissimilar results (Alvarez-Melis & Jaakkola, 2018; Slack et al., 2020; Lee et al., 2019). These methods also lack robust metrics for evaluating the “quality” of explanations (Lakkaraju et al., 2022).
5.2 Missing method-task link
Despite the abovementioned limitations, AI explainability methods continue to be applied in various contexts, propelled by the increasing demand for transparency, accountability, and trust in AI systems.
Effectively pairing XAI methods with problems they can address presents its own unique challenge. Currently, there is a scarcity of guidelines indicating which method or combination of methods would be best suited for a specific problem or dataset (Han et al., 2022). While numerous XAI surveys and taxonomies of developed methods exist, they primarily focus on technical categories (e.g., gradient vs. attention methods) rather than on categories that would suggest dataset and problem-specific XAI methods (e.g., debugging, decision making, spurious correlations), assuming they exist.
As an example, in a recent survey of XAI for healthcare (Jin et al., 2022) also used technical categories and stated: “At the current state of the art, which method we should choose still does not have a definite answer.”
6 Towards provably useful XAI
In this section, we analyze what conceptual and methodological breakthroughs are needed in order to break the recurring pattern blocking XAI methods development.
We hypothesize that one of the main challenges between the current state of XAI and provably useful XAI methods is the missing method-task link.
To be able to guarantee the method’s usability and reliability in a specific task, we need either to root explanations deeply in theory directly corresponding to the task’s requirements or to create use-case-inspired explanations and then empirically evaluate them in the targeted application.
6.1 Task-relevant theoretical guarantees
While many current methods are inspired by some mathematical concepts, these concepts are not directly relevant to a task. For example, if a method assigning importance to individual features has a theoretical guarantee that, in the case of a linear model, it recovers the true model’s coefficients, that might be a desirable mathematical behavior, but it might be utterly irrelevant for an actual task involving a complex model.
Two examples of frequently applied methods with strong mathematical underpinnings are Integrated Gradients (Sundararajan et al., 2017) and SHAP (Lundberg & Lee, 2017). Recent research (Bilodeau et al., 2022) indicates, however, that the mathematical “guarantees” result in these methods provably failing at practical applications. Specifically, (Bilodeau et al., 2022) show that “for any feature attribution method that satisfies the completeness and linearity axioms, users cannot generally do better than random guessing for end-tasks such as algorithmic recourse and spurious feature identification.”
As pointed out by (Bilodeau et al., 2022), such methods are also considered across healthcare applications, for example, for ICU false alarm reduction task (Zaeri-Amirani et al., 2018) or cancer prognosis and diagnosis (Zhou et al., 2021; Roder et al., 2021). Therefore it is of great practical significance that users understand that common conceptions related to outputs of these methods may not hold, “for instance, positive feature attribution does not, in general, imply that increasing the feature will increase the model output. Similarly, zero feature attribution does not, in general, imply that the model output is insensitive to changes in the feature.”
If a theory is to guarantee the method’s reliability, we need to ensure that this theory is rooted in a specific task, holds in circumstances under which the method is practically applied, and that its assumptions and limitations are clear to the user.
6.2 Task-inspired development and evaluation
Another way to ensure the method’s usefulness and reliability is through a rigorous evaluation on a real-world task of interest.
There exist some evaluation procedures for current methods; however, existing evaluation is really limited. XAI evaluations involving humans often rely on simplistic proxy tasks or subjective opinions on explanations quality (Ribeiro et al., 2016; Lundberg & Lee, 2017; Ribeiro et al., 2018; Jeyakumar et al., 2020). A recent study reveals a positive impact of explanations, specifically that they can “reduce overreliance on AI systems during decision-making” (Vasconcelos et al., 2023). In this study, the decision-making task involved finding a reachable exit in a maze, with a model suggesting a correct exit either with or without an explanation that described or visualized a suggested path (correct or incorrect). However, the generalizability of this conclusion remains uncertain, as both the problem setup and the explanations were simplistic and synthetically generated. Another issue is the lack of distinction in some studies between the performance of a model with and without explanations. For instance, the highly cited work “Explainable Machine-Learning Predictions for the Prevention of Hypoxaemia during Surgery” (Lundberg et al., 2018) demonstrates in a study involving five anesthesiologists that doctors’ predictions improve when provided with model suggestions and corresponding explanations. However, the evaluation does not include the baseline of using only the model without explanations.
Human expert studies on real-world tasks represent the gold standard for evaluations (Doshi-Velez & Kim, 2017); however, despite efforts to reduce their cost for XAI tests, they remain resource-intensive (Chen et al., 2022). Even when conducted, obtaining definitive answers can be challenging. For example, studies by (Jesus et al., 2021; Amarasinghe et al., 2022) attempt to address the lack of application-grounded XAI evaluations by assessing a few explanation methods for credit card fraud detection. Both studies focus on the same problem of identifying fraudulent transactions, and both recruit the same group of experts. However, a slight change in the experimental setup leads to contrasting conclusions: (Jesus et al., 2021) report better metrics for a model with explanations compared to one without, whereas (Amarasinghe et al., 2022) do not observe a significant difference.
In summary, it is challenging and expensive to compare and evaluate non-task-specific methods, and it is unfeasible to estimate methods’ reliability for all possible real-world tasks.
However, if a method were initially developed with a specific real-world task application target and needed to be evaluated only for this application, then rigorous and empirical evaluation under realistic settings would be possible and lead to significant conclusions.
7 Conclusions
Given the present state of XAI, explanations without solid evidence for enhancing human-AI collaboration should not be used to justify decisions or establish trust in machine learning models. To transform the dynamics of explainability method development, a stronger focus on practical applications is crucial to avoid following the presented XAI development pattern.
We suggest treating explanations without explicit task-relevant guarantees as black boxes themselves. They can be useful but should not be trusted.
8 Acknowledgements
We thank Jure Leskovec and Carlos Guestrin for the discussions that inspired the work on this paper. AC was supported by Stanford School of Engineering Fellowship.
References
- Adebayo et al. (2018) Adebayo, J., Gilmer, J., Muelly, M., Goodfellow, I., Hardt, M., and Kim, B. Sanity checks for saliency maps. In Proceedings of the 32nd International Conference on Neural Information Processing Systems, NIPS’18, pp. 9525–9536, Red Hook, NY, USA, 2018. Curran Associates Inc.
- Agarwal et al. (2023) Agarwal, C., Queen, O., Lakkaraju, H., and Zitnik, M. Evaluating explainability for graph neural networks. Scientific Data, 10(144), 2023. URL https://www.nature.com/articles/s41597-023-01974-x.
- Alvarez-Melis & Jaakkola (2018) Alvarez-Melis, D. and Jaakkola, T. S. On the robustness of interpretability methods. 2018. URL http://arxiv.org/abs/1806.08049. ICML Workshop on Human Interpretability in Machine Learning (WHI 2018), Stockholm, Sweden.
- Amara et al. (2022) Amara, K., Ying, Z., Zhang, Z., Han, Z., Zhao, Y., Shan, Y., Brandes, U., Schemm, S., and Zhang, C. Graphframex: Towards systematic evaluation of explainability methods for graph neural networks. In Learning on Graphs Conference, LoG 2022, 9-12 December 2022, Virtual Event, volume 198 of Proceedings of Machine Learning Research, pp. 44. PMLR, 2022. URL https://proceedings.mlr.press/v198/amara22a.html.
- Amarasinghe et al. (2022) Amarasinghe, K., Rodolfa, K. T., Jesus, S. M., Chen, V., Balayan, V., Saleiro, P., Bizarro, P., Talwalkar, A., and Ghani, R. On the importance of application-grounded experimental design for evaluating explainable ML methods. CoRR, abs/2206.13503, 2022. doi: 10.48550/arXiv.2206.13503. URL https://doi.org/10.48550/arXiv.2206.13503.
- Bahdanau et al. (2015) Bahdanau, D., Cho, K., and Bengio, Y. Neural machine translation by jointly learning to align and translate. In 3rd International Conference on Learning Representations, ICLR 2015, San Diego, CA, USA, May 7-9, 2015, Conference Track Proceedings, 2015. URL http://arxiv.org/abs/1409.0473.
- Baldassarre & Azizpour (2019) Baldassarre, F. and Azizpour, H. Explainability techniques for graph convolutional networks. CoRR, abs/1905.13686, 2019. URL http://arxiv.org/abs/1905.13686.
- Bibal et al. (2022) Bibal, A., Cardon, R., Alfter, D., Wilkens, R., Wang, X., François, T., and Watrin, P. Is attention explanation? an introduction to the debate. In Proceedings of the 60th Annual Meeting of the Association for Computational Linguistics (Volume 1: Long Papers), pp. 3889–3900, Dublin, Ireland, May 2022. Association for Computational Linguistics.
- Bilodeau et al. (2022) Bilodeau, B., Jaques, N., Koh, P. W., and Kim, B. Impossibility theorems for feature attribution. December 2022.
- Chen et al. (2020) Chen, P., Dong, W., Wang, J., Lu, X., Kaymak, U., and Huang, Z. Interpretable clinical prediction via attention-based neural network. BMC Med. Inform. Decis. Mak., 20(Suppl 3):131, July 2020.
- Chen et al. (2022) Chen, V., Johnson, N., Topin, N., Plumb, G., and Talwalkar, A. Use-case-grounded simulations for explanation evaluation. In NeurIPS, 2022.
- Choi et al. (2016) Choi, E., Bahadori, M. T., Sun, J., Kulas, J., Schuetz, A., and Stewart, W. Retain: An interpretable predictive model for healthcare using reverse time attention mechanism. Advances in neural information processing systems, 29, 2016.
- Dai et al. (2022) Dai, E., Zhao, T., Zhu, H., Xu, J., Guo, Z., Liu, H., Tang, J., and Wang, S. A comprehensive survey on trustworthy graph neural networks: Privacy, robustness, fairness, and explainability. April 2022.
- Debnath et al. (1991) Debnath, A. K., Lopez de Compadre, R. L., Debnath, G., Shusterman, A. J., and Hansch, C. Structure-activity relationship of mutagenic aromatic and heteroaromatic nitro compounds. correlation with molecular orbital energies and hydrophobicity. J. Med. Chem., 34(2):786–797, February 1991.
- Doshi-Velez & Kim (2017) Doshi-Velez, F. and Kim, B. Towards a rigorous science of interpretable machine learning. February 2017.
- Faber et al. (2021) Faber, L., K. Moghaddam, A., and Wattenhofer, R. When comparing to ground truth is wrong: On evaluating GNN explanation methods. In Proceedings of the 27th ACM SIGKDD Conference on Knowledge Discovery & Data Mining, KDD ’21, pp. 332–341, New York, NY, USA, August 2021. Association for Computing Machinery.
- Han et al. (2022) Han, T., Srinivas, S., and Lakkaraju, H. Which explanation should i choose? a function approximation perspective to characterizing post hoc explanations. In Advances in Neural Information Processing Systems, volume 35, pp. 5256–5268. Curran Associates, Inc., 2022.
- Hedström et al. (2023) Hedström, A., Bommer, P., Wickstrøm, K. K., Samek, W., Lapuschkin, S., and Höhne, M. M.-C. The Meta-Evaluation problem in explainable AI: Identifying reliable estimators with MetaQuantus. February 2023.
- Jain & Wallace (2019) Jain, S. and Wallace, B. C. Attention is not Explanation. In Proceedings of the 2019 Conference of the North American Chapter of the Association for Computational Linguistics: Human Language Technologies, Volume 1 (Long and Short Papers), pp. 3543–3556, Minneapolis, Minnesota, June 2019. Association for Computational Linguistics. doi: 10.18653/v1/N19-1357. URL https://aclanthology.org/N19-1357.
- Jesus et al. (2021) Jesus, S., Belém, C., Balayan, V., Bento, J. a., Saleiro, P., Bizarro, P., and Gama, J. a. How can i choose an explainer? an application-grounded evaluation of post-hoc explanations. In Proceedings of the 2021 ACM Conference on Fairness, Accountability, and Transparency, FAccT ’21, pp. 805–815, New York, NY, USA, 2021. Association for Computing Machinery. ISBN 9781450383097. doi: 10.1145/3442188.3445941. URL https://doi.org/10.1145/3442188.3445941.
- Jeyakumar et al. (2020) Jeyakumar, J. V., Noor, J., Cheng, Y.-H., Garcia, L., and Srivastava, M. How can i explain this to you? an empirical study of deep neural network explanation methods. Adv. Neural Inf. Process. Syst., 33:4211–4222, 2020.
- Jin et al. (2022) Jin, D., Sergeeva, E., Weng, W.-H., Chauhan, G., and Szolovits, P. Explainable deep learning in healthcare: A methodological survey from an attribution view. WIREs Mech Dis, 14(3):e1548, May 2022.
- Kindermans et al. (2019) Kindermans, P.-J., Hooker, S., Adebayo, J., Alber, M., Schütt, K. T., Dähne, S., Erhan, D., and Kim, B. The (un)reliability of saliency methods. In Explainable AI: Interpreting, Explaining and Visualizing Deep Learning, pp. 267–280. Springer International Publishing, Cham, 2019.
- Krishna et al. (2022) Krishna, S., Han, T., Gu, A., Pombra, J., Jabbari, S., Wu, S., and Lakkaraju, H. The disagreement problem in explainable machine learning: A practitioner’s perspective. February 2022.
- Lakkaraju et al. (2022) Lakkaraju, H., Slack, D., Chen, Y., Tan, C., and Singh, S. Rethinking explainability as a dialogue: A practitioner’s perspective. February 2022.
- Lee et al. (2019) Lee, E., Braines, D., Stiffler, M., Adam Hudler, A., and Harborne, D. Developing the sensitivity of LIME for better machine learning explanation. In Artificial Intelligence and Machine Learning for Multi-Domain Operations Applications. SPIE, May 2019.
- Lee et al. (2017) Lee, J., Shin, J.-H., and Kim, J.-S. Interactive visualization and manipulation of attention-based neural machine translation. In Proceedings of the 2017 Conference on Empirical Methods in Natural Language Processing: System Demonstrations, pp. 121–126, Copenhagen, Denmark, September 2017. Association for Computational Linguistics.
- Loh et al. (2022) Loh, H. W., Ooi, C. P., Seoni, S., Barua, P. D., Molinari, F., and Acharya, U. R. Application of explainable artificial intelligence for healthcare: A systematic review of the last decade (2011-2022). Comput. Methods Programs Biomed., 226:107161, November 2022.
- Longa et al. (2022) Longa, A., Azzolin, S., Santin, G., Cencetti, G., Liò, P., Lepri, B., and Passerini, A. Explaining the explainers in graph neural networks: a comparative study. October 2022.
- Lundberg & Lee (2017) Lundberg, S. M. and Lee, S.-I. A unified approach to interpreting model predictions. In Proceedings of the 31st International Conference on Neural Information Processing Systems, NIPS’17, pp. 4768–4777, Red Hook, NY, USA, December 2017. Curran Associates Inc.
- Lundberg et al. (2018) Lundberg, S. M., Nair, B., Vavilala, M. S., Horibe, M., Eisses, M. J., Adams, T., Liston, D. E., Low, D. K.-W., Newman, S.-F., Kim, J., and Lee, S.-I. Explainable machine-learning predictions for the prevention of hypoxaemia during surgery. Nat Biomed Eng, 2(10):749–760, October 2018.
- Luo et al. (2020) Luo, D., Cheng, W., Xu, D., Yu, W., Zong, B., Chen, H., and Zhang, X. Parameterized explainer for graph neural network. In Proceedings of the 34th International Conference on Neural Information Processing Systems, NIPS’20, Red Hook, NY, USA, 2020. Curran Associates Inc. ISBN 9781713829546.
- Mohankumar et al. (2020) Mohankumar, A. K., Nema, P., Narasimhan, S., Khapra, M. M., Srinivasan, B. V., and Ravindran, B. Towards transparent and explainable attention models. In Proceedings of the 58th Annual Meeting of the Association for Computational Linguistics, pp. 4206–4216, Online, July 2020. Association for Computational Linguistics. doi: 10.18653/v1/2020.acl-main.387. URL https://aclanthology.org/2020.acl-main.387.
- Mullenbach et al. (2018) Mullenbach, J., Wiegreffe, S., Duke, J., Sun, J., and Eisenstein, J. Explainable prediction of medical codes from clinical text. In Proceedings of the 2018 Conference of the North American Chapter of the Association for Computational Linguistics: Human Language Technologies, Volume 1 (Long Papers), pp. 1101–1111, New Orleans, Louisiana, June 2018. Association for Computational Linguistics.
- Neely et al. (2021) Neely, M., Schouten, S. F., Bleeker, M. J. R., and Lucic, A. Order in the court: Explainable AI methods prone to disagreement. May 2021. ICML 2021 Workshop on Theoretic Foundation, Criticism, and Application Trend of Explainable AI.
- Page et al. (1999) Page, L., Brin, S., Motwani, R., and Winograd, T. The pagerank citation ranking: Bringing order to the web. Technical Report 1999-66, Stanford InfoLab, November 1999. URL http://ilpubs.stanford.edu:8090/422/. Previous number = SIDL-WP-1999-0120.
- Pope et al. (2019) Pope, P. E., Kolouri, S., Rostami, M., Martin, C. E., and Hoffmann, H. Explainability methods for graph convolutional neural networks. In 2019 IEEE/CVF Conference on Computer Vision and Pattern Recognition (CVPR), pp. 10772–10781. IEEE, June 2019.
- Ribeiro et al. (2016) Ribeiro, M. T., Singh, S., and Guestrin, C. “why should I trust you?”: Explaining the predictions of any classifier. In Proceedings of the 22nd ACM SIGKDD International Conference on Knowledge Discovery and Data Mining, KDD ’16, pp. 1135–1144, New York, NY, USA, August 2016. Association for Computing Machinery.
- Ribeiro et al. (2018) Ribeiro, M. T., Singh, S., and Guestrin, C. Anchors: High-Precision Model-Agnostic explanations. AAAI, 32(1), April 2018.
- Roder et al. (2021) Roder, J., Maguire, L., Georgantas, 3rd, R., and Roder, H. Explaining multivariate molecular diagnostic tests via shapley values. BMC Med. Inform. Decis. Mak., 21(1):211, July 2021.
- Rudin (2019) Rudin, C. Stop explaining black box machine learning models for high stakes decisions and use interpretable models instead. Nature Machine Intelligence, 1:206–215, 05 2019. doi: 10.1038/s42256-019-0048-x.
- Samek et al. (2021) Samek, W., Montavon, G., Lapuschkin, S., Anders, C. J., and Müller, K.-R. Explaining deep neural networks and beyond: A review of methods and applications. Proc. IEEE, 109(3):247–278, March 2021.
- Selvaraju et al. (2016) Selvaraju, R. R., Das, A., Vedantam, R., Cogswell, M., Parikh, D., and Batra, D. Grad-cam: Why did you say that? visual explanations from deep networks via gradient-based localization. CoRR, abs/1610.02391, 2016. URL http://arxiv.org/abs/1610.02391.
- Serrano & Smith (2019) Serrano, S. and Smith, N. A. Is attention interpretable? In Proceedings of the 57th Annual Meeting of the Association for Computational Linguistics, pp. 2931–2951, Florence, Italy, July 2019. Association for Computational Linguistics. doi: 10.18653/v1/P19-1282. URL https://aclanthology.org/P19-1282.
- Shrikumar et al. (2017) Shrikumar, A., Greenside, P., and Kundaje, A. Learning important features through propagating activation differences. In Proceedings of the 34th International Conference on Machine Learning, volume 70 of Proceedings of Machine Learning Research, pp. 3145–3153. PMLR, 06–11 Aug 2017. URL https://proceedings.mlr.press/v70/shrikumar17a.html.
- Simonyan et al. (2014) Simonyan, K., Vedaldi, A., and Zisserman, A. Deep inside convolutional networks: Visualising image classification models and saliency maps. In 2nd International Conference on Learning Representations, ICLR 2014, Banff, AB, Canada, April 14-16, 2014, Workshop Track Proceedings, 2014. URL http://arxiv.org/abs/1312.6034.
- Slack et al. (2020) Slack, D., Hilgard, S., Jia, E., Singh, S., and Lakkaraju, H. Fooling lime and shap: Adversarial attacks on post hoc explanation methods. In Proceedings of the AAAI/ACM Conference on AI, Ethics, and Society, AIES ’20, pp. 180–186, New York, NY, USA, 2020. Association for Computing Machinery. ISBN 9781450371100. doi: 10.1145/3375627.3375830. URL https://doi.org/10.1145/3375627.3375830.
- Smilkov et al. (2017) Smilkov, D., Thorat, N., Kim, B., Viégas, F. B., and Wattenberg, M. Smoothgrad: removing noise by adding noise. CoRR, abs/1706.03825, 2017. URL http://arxiv.org/abs/1706.03825.
- Springenberg et al. (2015) Springenberg, J. T., Dosovitskiy, A., Brox, T., and Riedmiller, M. A. Striving for simplicity: The all convolutional net. In 3rd International Conference on Learning Representations, ICLR 2015, San Diego, CA, USA, May 7-9, 2015, Workshop Track Proceedings, 2015. URL http://arxiv.org/abs/1412.6806.
- Sundararajan et al. (2017) Sundararajan, M., Taly, A., and Yan, Q. Axiomatic attribution for deep networks. In Proceedings of the 34th International Conference on Machine Learning, volume 70 of Proceedings of Machine Learning Research, pp. 3319–3328. PMLR, 2017.
- Tomsett et al. (2020) Tomsett, R., Harborne, D., Chakraborty, S., Gurram, P., and Preece, A. D. Sanity checks for saliency metrics. In The Thirty-Fourth AAAI Conference on Artificial Intelligence, AAAI 2020, The Thirty-Second Innovative Applications of Artificial Intelligence Conference, IAAI 2020, The Tenth AAAI Symposium on Educational Advances in Artificial Intelligence, EAAI 2020, New York, NY, USA, February 7-12, 2020, pp. 6021–6029. AAAI Press, 2020. URL https://ojs.aaai.org/index.php/AAAI/article/view/6064.
- Tonekaboni et al. (2019) Tonekaboni, S., Joshi, S., McCradden, M. D., and Goldenberg, A. What clinicians want: Contextualizing explainable machine learning for clinical end use. In Proceedings of the Machine Learning for Healthcare Conference, MLHC 2019, 9-10 August 2019, Ann Arbor, Michigan, USA, volume 106 of Proceedings of Machine Learning Research, pp. 359–380. PMLR, 2019. URL http://proceedings.mlr.press/v106/tonekaboni19a.html.
- Vasconcelos et al. (2023) Vasconcelos, H., Jörke, M., Grunde-McLaughlin, M., Gerstenberg, T., Bernstein, M. S., and Krishna, R. Explanations can reduce overreliance on AI systems during decision-making. Proc. ACM Hum. Comput. Interact., 7(CSCW1):1–38, 2023. doi: 10.1145/3579605. URL https://doi.org/10.1145/3579605.
- Vashishth et al. (2019) Vashishth, S., Upadhyay, S., Tomar, G. S., and Faruqui, M. Attention interpretability across NLP tasks. September 2019.
- Vaswani et al. (2017) Vaswani, A., Shazeer, N., Parmar, N., Uszkoreit, J., Jones, L., Gomez, A. N., Kaiser, L., and Polosukhin, I. Attention is all you need. In Advances in Neural Information Processing Systems 30: Annual Conference on Neural Information Processing Systems 2017, December 4-9, 2017, Long Beach, CA, USA, pp. 5998–6008, 2017.
- Velickovic et al. (2018) Velickovic, P., Cucurull, G., Casanova, A., Romero, A., Liò, P., and Bengio, Y. Graph attention networks. In 6th International Conference on Learning Representations, ICLR 2018, Vancouver, BC, Canada, April 30 - May 3, 2018, Conference Track Proceedings. OpenReview.net, 2018. URL https://openreview.net/forum?id=rJXMpikCZ.
- Vu & Thai (2020) Vu, M. N. and Thai, M. T. Pgm-explainer: Probabilistic graphical model explanations for graph neural networks. In Advances in Neural Information Processing Systems 33: Annual Conference on Neural Information Processing Systems 2020, NeurIPS 2020, December 6-12, 2020, virtual, 2020.
- Warmsley et al. (2022) Warmsley, D., Waagen, A., Xu, J., Liu, Z., and Tong, H. A survey of explainable graph neural networks for cyber malware analysis. In 2022 IEEE International Conference on Big Data (Big Data), pp. 2932–2939. IEEE, December 2022.
- Wiegreffe & Pinter (2019) Wiegreffe, S. and Pinter, Y. Attention is not not explanation. In Proceedings of the 2019 Conference on Empirical Methods in Natural Language Processing and the 9th International Joint Conference on Natural Language Processing, EMNLP-IJCNLP 2019, Hong Kong, China, November 3-7, 2019, pp. 11–20. Association for Computational Linguistics, 2019. doi: 10.18653/v1/D19-1002. URL https://doi.org/10.18653/v1/D19-1002.
- Xu et al. (2015) Xu, K., Ba, J., Kiros, R., Cho, K., Courville, A. C., Salakhutdinov, R., Zemel, R. S., and Bengio, Y. Show, attend and tell: Neural image caption generation with visual attention. In Proceedings of the 32nd International Conference on Machine Learning, ICML 2015, Lille, France, 6-11 July 2015, volume 37 of JMLR Workshop and Conference Proceedings, pp. 2048–2057. JMLR.org, 2015. URL http://proceedings.mlr.press/v37/xuc15.html.
- Yang & Kim (2019) Yang, M. and Kim, B. Benchmarking attribution methods with relative feature importance. July 2019.
- Ying et al. (2019) Ying, R., Bourgeois, D., You, J., Zitnik, M., and Leskovec, J. GNNExplainer: Generating explanations for graph neural networks. Adv. Neural Inf. Process. Syst., 32:9240–9251, December 2019.
- Yona & Greenfeld (2021) Yona, G. and Greenfeld, D. Revisiting sanity checks for saliency maps. October 2021. NeurIPS 2021 1st Workshop on eXplainable AI approaches for debugging and diagnosis.
- Yuan et al. (2021) Yuan, H., Yu, H., Wang, J., Li, K., and Ji, S. On explainability of graph neural networks via subgraph explorations. In Proceedings of the 38th International Conference on Machine Learning, volume 139 of Proceedings of Machine Learning Research, pp. 12241–12252. PMLR, 2021.
- Yuan et al. (2022) Yuan, H., Yu, H., Gui, S., and Ji, S. Explainability in graph neural networks: A taxonomic survey. IEEE Trans. Pattern Anal. Mach. Intell., PP, September 2022.
- Zaeri-Amirani et al. (2018) Zaeri-Amirani, M., Afghah, F., and Mousavi, S. A feature selection method based on shapley value to false alarm reduction in ICUs a Genetic-Algorithm approach. In 2018 40th Annual International Conference of the IEEE Engineering in Medicine and Biology Society (EMBC), pp. 319–323, July 2018.
- Zhou et al. (2021) Zhou, K., Arslanturk, S., Craig, D. B., Heath, E., and Draghici, S. Discovery of primary prostate cancer biomarkers using cross cancer learning. Sci. Rep., 11(1):10433, May 2021.