Ejecta, Rings, and Dust in SN 1987A with JWST MIRI/MRS
Abstract
Supernova (SN) 1987A is the nearest supernova in 400 years. Using the JWST MIRI Medium Resolution Spectrograph, we spatially resolved the ejecta, equatorial ring (ER) and outer rings in the mid-infrared 12,927 days after the explosion. The spectra are rich in line and dust continuum emission, both in the ejecta and the ring. Broad emission lines (280-380 km s-1 FWHM) seen from all singly-ionized species originate from the expanding ER, with properties consistent with dense post-shock cooling gas. Narrower emission lines (100-170 km s-1 FWHM) are seen from species originating from a more extended lower-density component whose high ionization may have been produced by shocks progressing through the ER, or by the UV radiation pulse associated with the original supernova event. The asymmetric east-west dust emission in the ER has continued to fade, with constant temperature, signifying a reduction in dust mass. Small grains in the ER are preferentially destroyed, with larger grains from the progenitor surviving the transition from SN into SNR. The ER is fit with a single set of optical constants, eliminating the need for a secondary featureless hot dust component. We find several broad ejecta emission lines from [Ne ii], [Ar ii], [Fe ii], and [Ni ii]. With the exception of [Fe ii] 25.99m, these all originate from the ejecta close to the ring and are likely being excited by X-rays from the interaction. The [Fe ii] 5.34m to 25.99m line ratio indicates a temperature of only a few hundred K in the inner core, consistent with being powered by 44Ti decay.
1 Introduction
Supernovae (SNe) are important contributors to the chemical evolution of the universe over cosmic time, however, their relative net contribution to dust production in the early universe is still debated. While extant studies of SNe have shown that these events are prodigious sources for dust production (e.g. Matsuura et al., 2011; Niculescu-Duvaz et al., 2022; Shahbandeh et al., 2023), they have found that their ability to also destroy dust is similarly (and potentially equally) proficient (e.g., Gall & Hjorth, 2018; Slavin et al., 2020; Kirchschlager et al., 2023). Assessing the effects of SNe on their host galaxies, and understanding how their dust production and destruction processes occurs over months to years, requires time-series observations at a high angular resolution to build realistic models.
SN 1987A provides a once-in-a-lifetime opportunity to investigate the evolution of a supernova into a supernova remnant (SNR; McCray & Fransson, 2016). On February 23, 1987, light from a massive blue supergiant (BSG) Sanduleak -69 202 in the Large Magellanic Cloud (LMC), 50 kpc from us (Pietrzyński et al., 2019), which collapsed and exploded as a supernova was visible to the naked eye (e.g., Arnett et al., 1989); producing an initial burst of neutrinos consistent with the formation of a neutron star (Burrows, 1988). In the intervening years, SN 1987A has been extensively studied across the electromagnetic spectrum revealing important insights into the physics of supernovae, the properties of stellar explosions, and the evolution of stars.
The SN 1987A morphology is comprised of asymmetrical inner ejecta, a dense equatorial ring (ER) approximately 2 arcsec in diameter inclined at 43∘ from the line-of-sight, and two faint outer rings 5 arcsec in diameter. The outer rings, thought to be produced at the same time as the ER, have an expansion velocity of 26 km s-1 (Crotts & Heathcote, 2000), whilst the ejecta is expanding at a rate of 2000–10000 km s-1 (McCray, 1993; Fransson et al., 2013; Larsson et al., 2016; Kangas & Fruchter, 2021).
Emission from the ER is the dominant component of SN 1987A observations from the X-ray to the mid-infrared (IR). The ER was initially photoionized by the SN shock breakout, but that emission has faded away and the emission from the ER is now dominated by shock interaction. The ER was likely produced in a binary merger event during the progenitor’s red supergiant phase of evolution (Morris & Podsiadlowski, 2009) and was initially expanding at 10.3 km s-1 relative to the SN. As shocks from the blast wave interacted with the dense gas in the ER, 30 hot spots began to form and steadily brighten in the ring in optical wavelengths (Pun et al., 1995; Bouchet et al., 2000; Fransson et al., 2015; McCray & Fransson, 2016), increasing the expansion velocity of the ring to 700 km s-1 (Larsson et al., 2019a; Kangas et al., 2022a). Once the initial shock from the blast wave passed (at 7,500 days) these hot spots began to fade and there is increasing interaction outside the ER as the forward shock expands outwards. Interactions with reverse shocks propagating into the SN ejecta also affect recent processing, gradually destroying the ring in the process (Fransson et al., 2015; Larsson et al., 2019a; Orlando et al., 2019; Arendt et al., 2020; Kangas et al., 2022b).
Using the T-ReCS instrument, Bouchet et al. (2004) resolved 10 m emission from SN 1987A at day 6067 tracing its warm dust morphology; this emission is dominated by the ER, with less than 10-5 M⊙ of warm progenitor dust. Spitzer InfraRed Spectrograph (IRS) observations revealed the ER is comprised of warm ( 180 K) silicate dust (Bouchet et al., 2006; Dwek et al., 2010; Arendt et al., 2016). This emission brightened up to day 8708 as the dust grains were collisionally heated by the shocked gas, however, the shape of the dust spectrum remained unchanged.
Cryogenic Spitzer IRAC fluxes (obtained from day 6130) appeared to be strengthening in agreement with the IRS spectra, however, a secondary hot K dust component of undetermined composition appeared to be necessary to fit the blue-end (3 – 8 m) of the spectral energy distribution (SED; Dwek et al. 2010). Imaging with the warm Spitzer mission continued to monitor the SN 1987A light curves until day 11,885 (Arendt et al., 2020). These appear to peak between day 8500–9000 before undergoing a gradual fading in luminosity since day 9810 post-explosion, which is consistent with the passage of the forward shock through the ER and the gradual destruction of dust emitting at these shorter wavelengths.
In the IR, CO and SiO vibration bands from the ejecta became apparent in the integrated spectra of SN 1987A from day 200 post-explosion (Roche et al., 1991; Spyromilio et al., 1988), and dust formation in the ejecta occurred between 400 and 500 days, consequently obscuring some of the optical and near-IR emission and re-radiating this light in the mid-IR (Lucy et al., 1989; Bouchet et al., 1991; Wooden et al., 1993). This dust was characterised by a featureless single-temperature graybody emission spectrum.
The Herschel far-IR observations (Matsuura et al., 2011) unveiled a large reservoir of newly condensed cold dust with temperature T K and mass M M⊙, depending on whether its composition arises solely from amorphous carbon or a mix of amorphous carbon and silicates (Matsuura et al., 2015). The origin of this dust was unambiguously confirmed to be from the inner ejecta of SN 1987A by the Atacama Large Millimetre Array (ALMA; Indebetouw et al. 2014; Matsuura et al. 2017). This extremely efficient dust condensation in the ejecta (measured 24 years after the explosion) requires almost all the expected Mg and Si produced in the SN to condense into grains and is significantly higher than the dust mass measured by Bouchet et al. (1991) and Wooden et al. (1993) in the first few years post-explosion. This ejecta dust, 36 years after the explosion, has not yet experienced processing by the reverse shock (France et al., 2010; Chevalier & Fransson, 2017); it remains unclear how much of this dust will survive and dissipate into the interstellar medium once this interaction occurs.
The SN 1987A ejecta has a complex asymmetric morphology. In the optical, the ejecta is elongated north-south with a faint central region (Larsson et al., 2011), and is currently undergoing a free expansion interior to the ER (Larsson et al., 2016, 2019b). ALMA observations show the CO and SiO molecules in the ejecta have different distributions, with cold dust emission coincident with the faint optical region (Kamenetzky et al., 2013; Indebetouw et al., 2014).
Several near- and mid-IR lines from the ejecta were observed during the first years after explosion with both ground-based instruments and the Kuiper Airborne Observatory. These have proved to be extremely useful as diagnostics of the temperature, density and abundances in the ejecta (Aitken et al., 1988; Rank et al., 1988; Spyromilio et al., 1990; Wooden et al., 1993; Colgan et al., 1994). In particular, the line ratios of the [Fe II] lines indicated a low filling factor for the iron in the core of the ejecta (Li et al., 1993; Kozma & Fransson, 1998), indicative of 56Ni heating, during the first weeks after explosion, creating low-density bubbles in the core. Also the [Fe II] line profiles were very useful for probing the asymmmetry and abundance mixing of the ejecta (Spyromilio et al., 1990; Haas et al., 1990). These observations have provided some of the most important constraints on the explosion mechanism.
The launch of JWST (Rigby et al., 2023; Gardner et al., 2023) with its superb sensitivity and high spatial resolution images and integral field spectrographs (IFS) has opened a new era in mid-IR observations, enabling us to obtain IR data on SN 1987A at a comparable resolution to the optical HST data and sub-mm ALMA data. For instance, NIRSpec observations reveal asymmetry in the ejecta, likely due to a binary merger prior to explosion and morphological 3D structures in the circumstellar medium (Larsson et al., 2023).
With the Mid-Infrared Instrument (MIRI; Wright et al. 2023) Medium Resolution Spectrometer (MRS) onboard JWST, we can finally observe and spatially resolve the ER and ejecta of SN 1987A at mid-IR wavelengths with a high S/N ratio. The paper is organised as follows. In Section 2 we describe the observations and data reduction. Our results are presented in Section 3. Finally, in Section 4 we discuss the implications of these data. The conclusions are summarised in Section 5.
2 Observations and data reduction
SN 1987A was observed with the MIRI/MRS on 2022-07-16 as part of the guaranteed time programme #1232 (PI: Wright). The observations consist of 94 groups of three integrations using the fastr1 readout pattern for all three bands (SHORT, MEDIUM, LONG), which provided complete spectral coverage from 4.9 to 27.9 m at medium resolution (R 4000–1500; Jones et al. 2023). As no wavelength channel was prioritised for the SN 1987A MRS observations, a 4-point extended source dither pattern in the ‘negative’ direction optimised for ‘ALL’ channels was selected. The MRS fields of view range from 3.2 3.7 in channel 1 to 6.6 7.7 in channel 4 (Wells et al., 2015; Argyriou et al., 2023). No target acquisition was employed and no dedicated background observations were taken. The total MRS integration time corresponded to 9396s, or approximately 3.75 hr including all overheads.
Simultaneous MIRI imaging in the F560W, F770W, and F1000W filters was obtained to improve the astrometric accuracy of the MRS data. These observations were taken using the slowr1 readout pattern (to reduce data volume), with 10 groups and 3 integrations, using the same dither pattern as the MRS data.
To reduce our MRS data we used a development version of the JWST Calibration Pipeline (Bushouse et al., 2023) retrieved on May-23-2023111https://github.com/spacetelescope/jwst, with versions 11.17.0 and ‘jwst_1090.pmap’ of the Calibration Reference Data System (CRDS) and CRDS context, respectively, and development versions of the FLT-5 MRS calibration files which include an improved photometric calibration derived from the Cycle 1 calibration program. We ran all raw data files through the Detector1Pipeline to convert the ramp files into rate images. Since inaccuracies in the spacecraft pointing information can be introduced by guide star catalogue errors and roll uncertainty (see Pontoppidan et al., 2022), we corrected the world coordinate system (WCS) reference keywords in our rate images by determining the offset of point sources detected in the F560W simultaneous imaging field to their Gaia Data Release 3222https://www.cosmos.esa.int/web/gaia/dr3 counterparts. This resulted in an offset correction of in RA and in Dec. This correction is expected to be accurate to 0.1 (Patapis et al., 2023), with the upper limit due to uncertainties in the relative astrometry between the MRS and imager. The pointing correction must be applied before running stage 2 of the pipeline as the WCS solution is attached to the files in its first step.
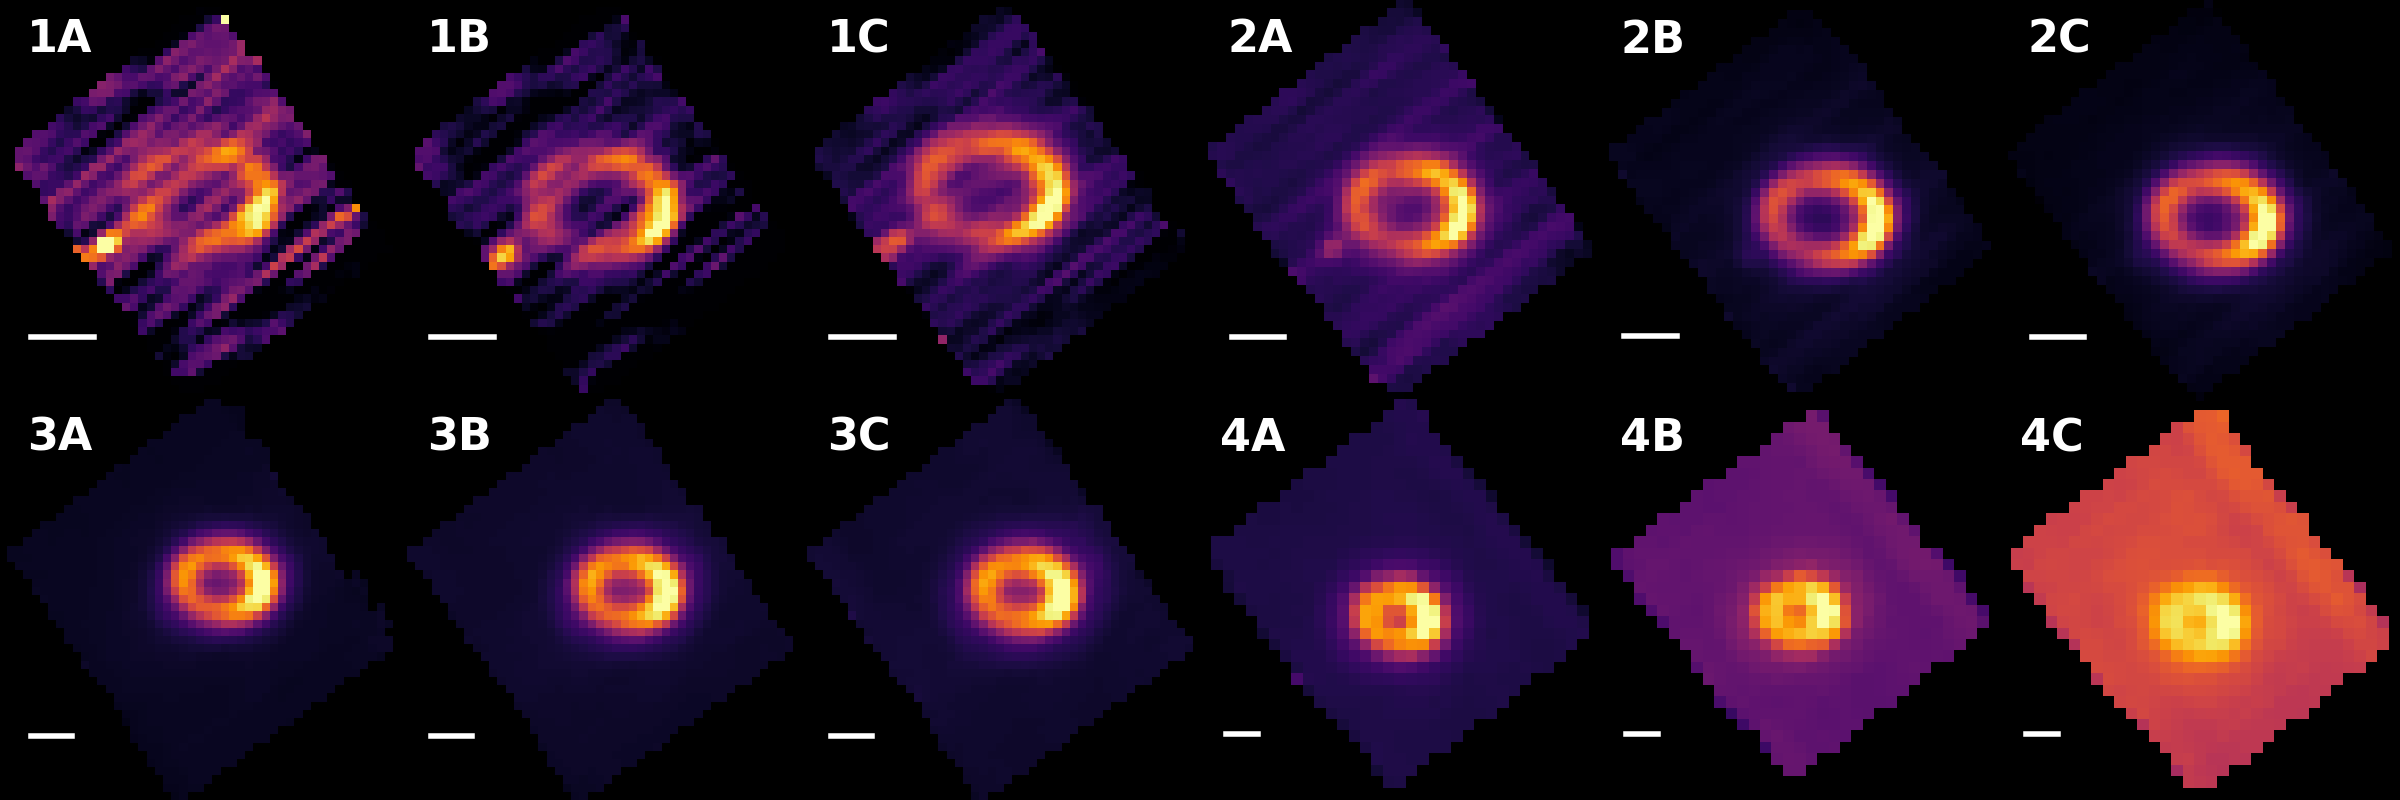
We ran all files through Spec2Pipeline, with the optional residual_fringe step switched on to produce flux calibrated rate images, from which we constructed spectral cubes for all of the 12 MRS sub-bands using Spec3Pipeline. MRS data usually contain large numbers of ‘warm’ pixels which are not flagged in the bad pixel mask as they evolve over time. For data where no dedicated background is available, these can have a significant impact on cubes and extracted spectra, where they manifest as spurious emission lines. To account for these when producing our cubes, we used the updated outlier_detection step in Spec3Pipeline to capture and omit these pixels from the cube-building process. We show sample slices from each of the 12 sub-band cubes in Fig. 1 to highlight some features of our MRS data.
Channel 1 and 2 cubes suffer from a ‘striping’ in the x-dimension of the cube frame, which is residual dark current. Even though the pipeline subtracts a dark current reference from the data, drifts in the effective dark current over time cause such residuals. Unfortunately, without dedicated background observations, this residual cannot be removed without risking the subtraction of real signal from SN1987A. The channel 4 cubes suffer from an increased signal towards the right edge in the cube frame. This likely results from a more uncertain flux calibration near the slice edges. We omitted these regions from our analysis.
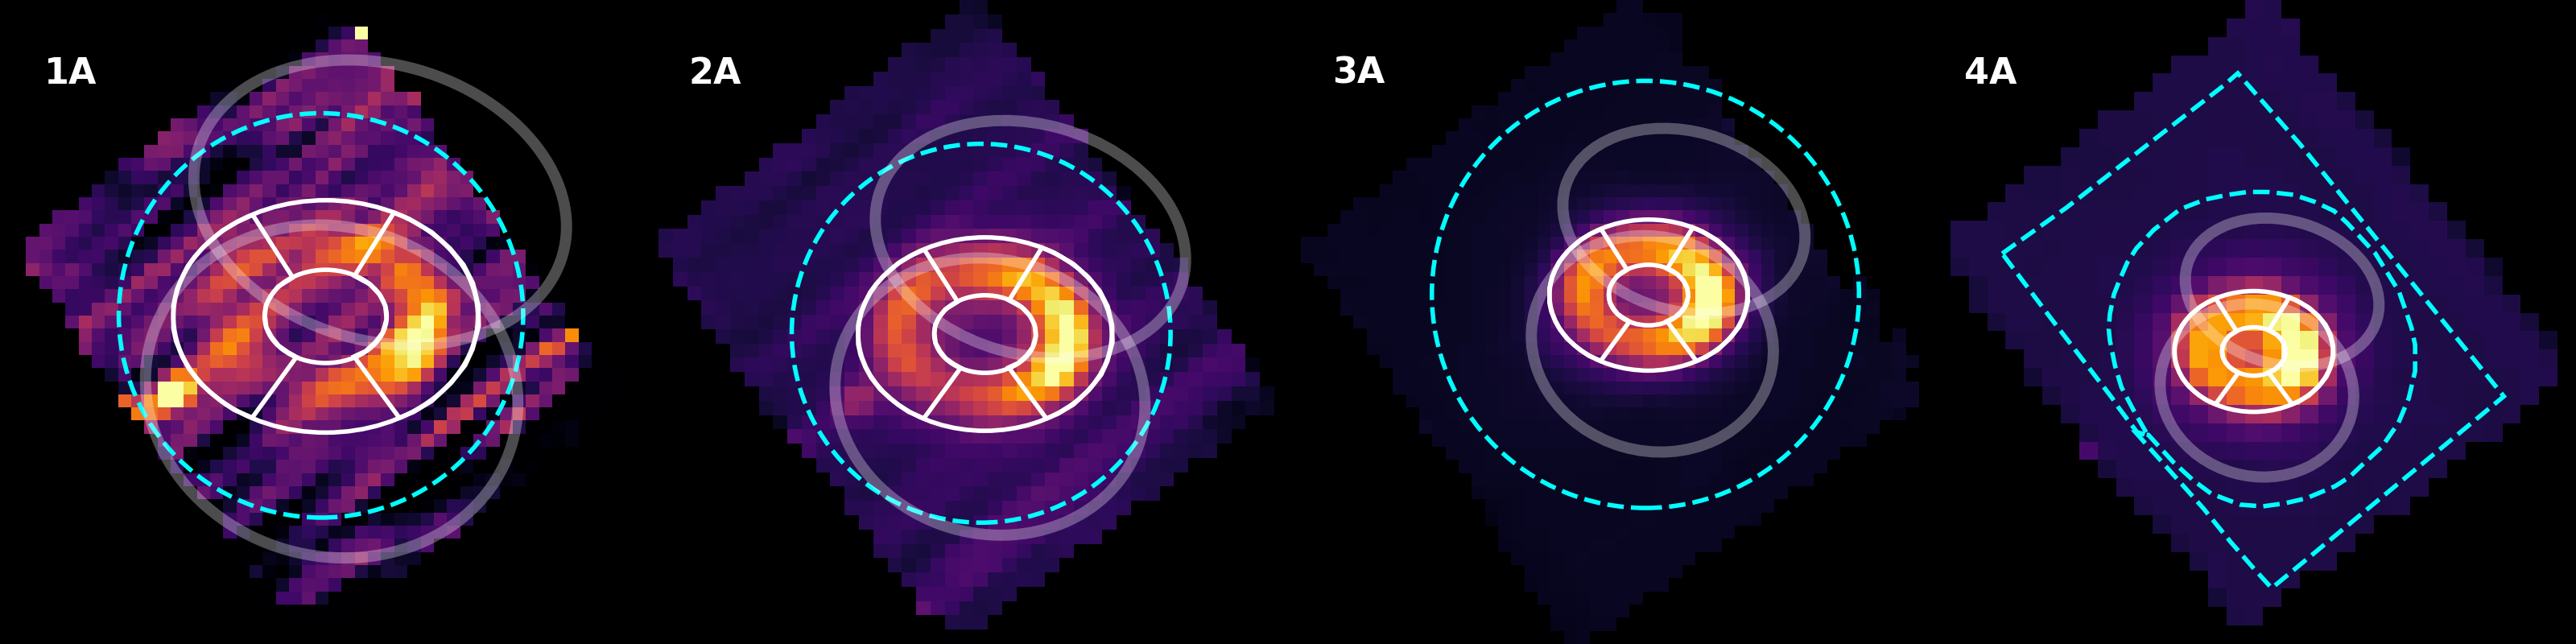
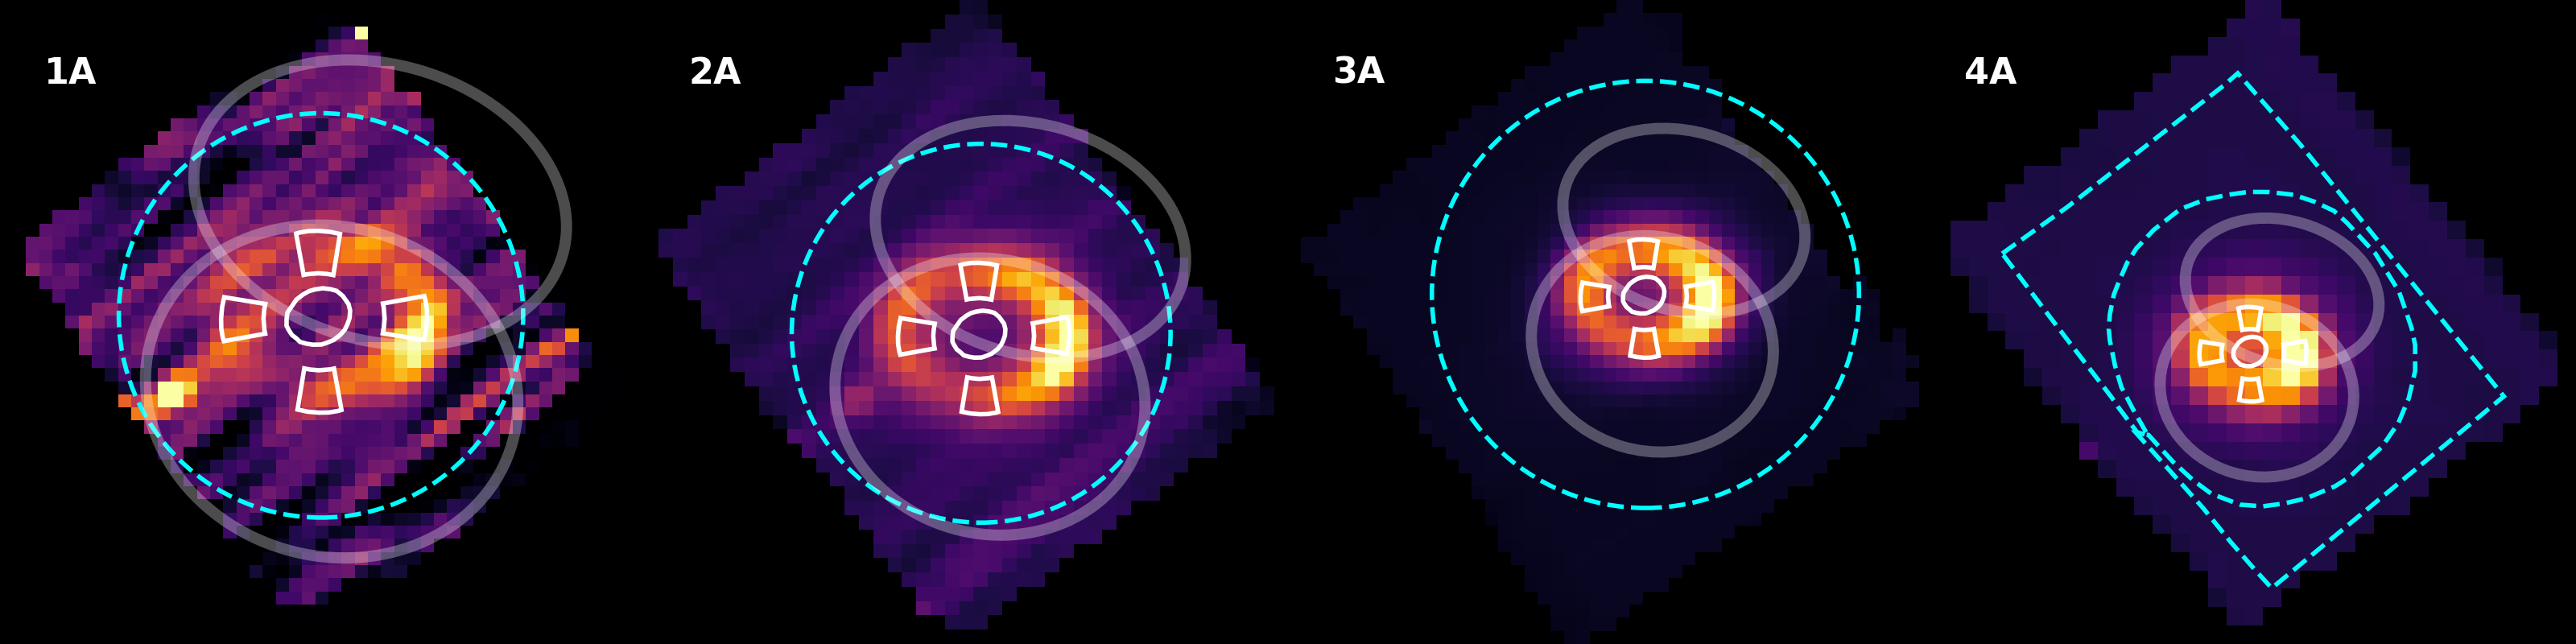
Two final aspects of our data to contend with were the degradation in spatial resolution and increasing background from band 1A through 4C, both of which are evident in Fig. 1. The former presents challenges in creating representative full-band MRS spectra from small regions of the SN 1987A system. These are discussed in more detail below. As we had no dedicated background pointing we were required to use regions within the sub-band FOVs to create a background that could be subtracted from our spectra. We defined circular regions surrounding SN 1987A for channels 1–3, with the backgrounds extracted from all pixels exterior to the circle. For channel 4 we used a polygonal region surrounding SN 1987A but omitting the bright edge of the cubes mentioned previously. These background regions are shown in Fig. 2, along with the location of the outer rings defined using their morphology in the [Ne ii] 12.81354 m line. It is clear from Fig. 2 that the outer rings take up a significant fraction of the channel 1 and 2 FOVs making it impractical to have a ‘true’ background. The sizes of background boundaries in these channels are therefore a trade-off between producing a representative background while mitigating contamination from the line emission from outer rings (see Sect. 3.1).
Due to the complex morphology of SN 1987A, we have extracted spectra from several locations in the MRS cube. These include 1) the total ER; 2) segments of equal size from the east and west sides of the ER; 3) four smaller cardinal point regions from the N, S, E and W portions of the ER, comparable in size to the hot-spots observed in the optical, 4); the central ejecta, and finally 5); the entire SN 1987A system to enable comparisons with past Spitzer observations. All regions are shown in Fig. 2. Spectral regions were defined using SAO Image DS9 (Joye & Mandel, 2003) and extracted using the aperture module in the Astropy Photutils package333https://photutils.readthedocs.io/en/stable/ (Bradley et al., 2022a) by parsing the regions using the Astropy Regions package444https://astropy-regions.readthedocs.io/en/stable/ (Bradley et al., 2022b). We applied an additional post-pipeline residual fringe correction to our spectra to account for the high-frequency fringing in channels 3 and 4, thought to originate in the MIRI/MRS dichroics, which are not effectively removed in the pipeline. This correction is now included in the JWST Calibration Pipeline package under the extract_1d step. Finally, to produce the total, full-band MRS spectrum of SN 1987A we scaled the MRS sub-band fluxes for minor offsets by determining the median flux difference in the overlapping wavelength regions, starting from the band 1A. These sub-band offsets were typically at the % level, with the worst-case offset of % being at the band 2C/3A overlap region where MRS fringing is most problematic. The scaled sub-band spectra were stitched using the combine_1d tool in the JWST Calibration Pipeline package.
3 Results
With the MRS we have detected and spatially resolved the 5–28 m emission from the ejecta, ER and outer rings of SN 1987A at day 12,927 after the explosion. The ER is well resolved and isolated from the nearby Stars 2 (which is not visible in the mid-IR) and 3 (Figure 1) which have affected lower spatial resolution observations of the system, especially at shorter wavelengths. The ER produces most of the IR emission, however, this emission has a complex morphology and is not evenly distributed over the ring. It is brightest on the west side. This is consistent with the evolution of the peak hot spot emission observed by HST in the ER from the northeast to the west side circa 2006 (Fransson et al., 2016; Larsson et al., 2019a), due to the asymmetric distribution of matter in the ER. Similar behaviours are also observed in the X-ray (Frank et al., 2016) and near-IR (Kangas et al., 2022a; Larsson et al., 2023).
The line emission from the ER originates from dense clumps of gas, observed as hotspots in the optical images, while we find that the continuum emission is more spatially extended. This is illustrated for the H I 7.460 m Pfund- line and nearby continuum in Figure 3. In order to quantify the differences in the spatial distribution, we fit the ER with an elliptical model with a Gaussian radial profile and sinusoidal intensity in the azimuthal direction. While this model does not account for all of the substructure in the ER, it captures the bulk of the emission and hence provides a good estimate of the overall size. The semi-major (minor) axes of the best-fit ellipses are () for the line image, compared to () for the continuum image.
In the collapsed MIRI/MRS data cubes the overall morphology is comparable to the T-ReCS 10 m data observed by Bouchet et al. (2004, 2006) at days 7241, 7565, 8720 and VLT/VISIR 10–18 m images at days 10950–10976 (Matsuura et al., 2022). Higher spatial resolution JWST mid-IR images of SN 1987A obtained on the same day post-explosion as the MIRI/MRS data including the ER morphology are discussed in depth in Bouchet et al. (in prep). Strikingly the resolved emission from the [Ne ii] lines reveals the outer ring structure (see Sect. 3.1) and the central compact ejecta is seen in the [Ar ii] and [Fe ii] emission lines (see Sect. 3.4).
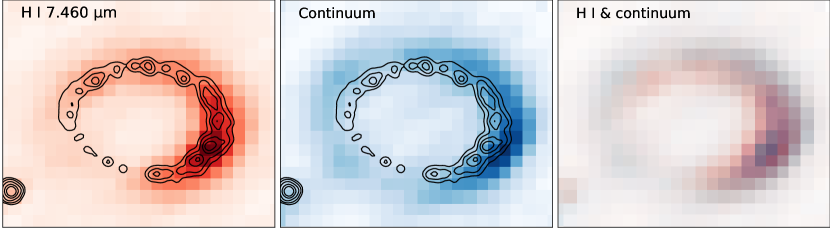
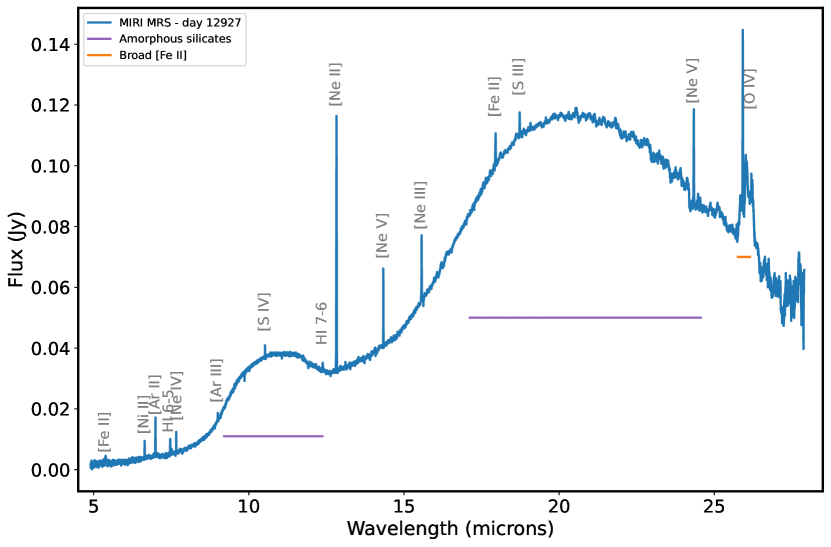
Figure 4 shows the total background-subtracted MRS spectrum of SN 1987A, for the region defined by the white annulus shown in the upper part of Fig. 2. The spectra are rich in atomic emission lines and silicate dust. These spectral features and their interpretation are discussed in detail in the following sections.
| Species | 555Vacuum wavelengths from the compilation by van Hoof (2018) | Velocity | FWHM | Flux |
|---|---|---|---|---|
| (m) | (km s-1) | (km s-1) | ( W cm-2) | |
| [Ni ii] | 6.6360 | 266.42.4 | 303.75.6 | 232.33.8 |
| [Ar ii] | 6.985274 | 262.51.7 | 288.84.1 | 483.06.0 |
| [Na iii] | 7.31775 | 274.622.3 | 354.744.6 | 30.73.9 |
| H i+He i 6-5666H i 8-6 7.502493 m was also detected | 7.459858 | 244.65.4 | 344.112.4 | 207.86.9 |
| [Ne vi] | 7.6524 | 277.21.7 | 106.64.4 | 85.62.9 |
| [Ar iii] | 8.99138 | 258.95.7 | 166.415.4 | 35.72.7 |
| [S iv] | 10.51049 | 286.82.4 | 105.55.6 | 33.61.6 |
| [Ni ii] | 10.6822 | 229.514.1 | 285.243.8 | 20.92.4 |
| H i+He i 7-6 | 12.371898 | 238.98.7 | 384.423.4 | 66.13.5 |
| [Ne ii] | 12.813548 | 275.31.3 | 297.03.3 | 1425.014.0 |
| [Ne v] | 14.32168 | 273.10.7 | 98.91.7 | 94.51.4 |
| [Ne iii] | 15.5551 | 275.22.5 | 170.97.7 | 142.14.9 |
| [Fe ii] | 17.936026 | 242.85.9 | 280.215.8 | 117.85.6 |
| [S iii] | 18.71303 | 254.69.6 | 145.014.5 | 33.53.9 |
| [Ne v] | 24.3175 | 278.73.7 | 137.69.7 | 92.65.4 |
| [O iv] | 25.8903 | 342.75.9 | 122.612.4 | 124.912.2 |
| Ring-East ( ster) | Ring-North ( ster) | Ring-West ( ster) | Ring-South ( ster) | ||||||||||
|---|---|---|---|---|---|---|---|---|---|---|---|---|---|
| Species | 777Vacuum wavelengths from the compilation by van Hoof (2018) | Velocity | FWHM | Flux | Velocity | FWHM | Flux | Velocity | FWHM | Flux | Velocity | FWHM | Flux |
| (m) | (km s-1) | (km s-1) | W/cm2 | (km s-1) | (km s-1) | W/cm2 | (km s-1) | (km s-1) | W/cm2 | (km s-1) | (km s-1) | W/cm2 | |
| [Ni ii] | 6.6360 | 335.35.2 | 225.412.2 | 5.350.26 | 144.01.9 | 212.04.6 | 14.20.26 | 250.00.9 | 230.72.1 | 37.20.29 | 429.13.2 | 212.57.0 | 7.490.23 |
| [Ar ii] | 6.985274 | 320.04.1 | 239.010.9 | 9.220.34 | 135.71.5 | 233.03.6 | 29.30.40 | 263.00.5 | 228.31.3 | 82.70.40 | 420.14.0 | 215.59.9 | 11.90.47 |
| [Na iii] | 7.31775 | — | — | — | — | — | — | 272.69.4 | 297.421.5 | 4.150.27 | — | — | — |
| H i 6-5888H i 8-6 7.502493 m was also detected in each spectrum | 7.459858 | 307.87.4 | 252.918.1 | 3.880.24 | 95.03.6 | 258.78.7 | 13.50.40 | 242.33.0 | 274.27.4 | 33.90.80 | 427.46.4 | 282.416.0 | 6.100.30 |
| [Ne vi] | 7.6524 | 267.24.5 | 114.59.8 | 2.210.18 | 269.93.9 | 110.19.8 | 2.700.20 | 273.42.3 | 127.66.0 | 5.100.20 | 288.99.1 | 90.524.0 | 0.8300.178 |
| [Ar iii] | 8.99138 | 241.413.1 | 175.735.7 | 0.9140.147 | 98.032.4 | 381.554.2 | 1.600.25 | 255.56.6 | 253.320.1 | 4.220.26 | — | — | — |
| [S iv] | 10.51049 | 288.37.4 | 99.417.6 | 0.6780.105 | 279.06.2 | 101.511.8 | 0.8760.104 | 297.84.2 | 83.910.6 | 1.510.16 | — | — | — |
| [Ni ii] | 10.6822 | — | — | — | — | — | — | 258.34.1 | 232.010.3 | 3.830.14 | — | — | — |
| H i 7-6 | 12.371898 | — | — | — | 96.45.4 | 252.813.0 | 2.970.14 | 256.23.8 | 296.410.1 | 8.680.25 | 443.519.9 | 501.063.6 | 3.210.33 |
| [Ne ii] | 12.813548 | 299.21.9 | 296.15.1 | 30.20.45 | 144.40.85 | 246.02.1 | 63.00.47 | 276.40.7 | 237.71.7 | 185.81.2 | 406.81.0 | 256.02.5 | 41.10.35 |
| [Ne v] | 14.32168 | 269.51.6 | 106.64.1 | 2.840.093 | 269.21.2 | 93.23.0 | 2.780.074 | 271.51.1 | 96.02.9 | 4.640.11 | 282.82.3 | 86.97.6 | 1.350.083 |
| [Ne iii] | 15.5551 | 267.15.2 | 181.617.9 | 3.130.22 | 231.86.4 | 241.117.5 | 6.190.34 | 284.41.7 | 187.04.9 | 15.70.33 | 375.14.3 | 268.410.9 | 3.500.12 |
| [Fe ii] | 17.936026 | 247.411.4 | 275.831.3 | 2.670.25 | 127.84.9 | 247.710.6 | 4.970.20 | 243.32.4 | 230.46.9 | 11.70.28 | 336.412.5 | 225.727.8 | 3.020.34 |
| [S iii] | 18.71303 | 242.79.4 | 138.716.8 | 1.410.17 | 241.89.8 | 146.418.0 | 1.420.17 | 264.014.7 | 162.426.9 | 2.630.45 | — | — | — |
| [Ne v] | 24.3175 | 276.75.2 | 142.213.0 | 3.050.24 | 269.86.6 | 125.519.7 | 2.480.29 | 273.65.8 | 126.216.9 | 4.030.41 | 292.111.2 | 125.019.9 | 1.300.22 |
| [O iv] | 25.8903 | 347.36.4 | 136.116.1 | 4.120.43 | 335.317.1 | 143.340.4 | 3.700.95 | 337.06.5 | 116.415.2 | 5.970.69 | 365.716.4 | 198.358.3 | 4.090.89 |
3.1 Line emission from the Equatorial Ring and surrounds
3.1.1 Emission line spectral properties
To investigate the emission line properties of the ER and its adjacent regions, we analyzed the spectrum corresponding to the whole ring, shown in Figure 4, as well as the spectra extracted for the four cardinal point sub-regions of the ER that are shown in the lower part of Fig. 2. Emission line radial velocities, full-width half-maximum (FWHM) values and integrated line fluxes were measured using the Gaussian emission line fitting (ELF) routines written by P. J. Storey within the dipso spectral analysis package (Howarth et al., 2014). Results are presented in Table 1 for the whole ER spectrum and in Table 2 for the four cardinal point spectra. The solid angle corresponding to each spectral extraction is listed in the table headers.
Sixteen emission line detections are listed in each table. H i 8-6 7.502 m was also detected. In addition, a very broad 26-m feature with multiple peaks (FWZI8000 km s-1) is present in each of the spectra, corresponding to [Fe ii] 25.98839 m, superposed on what is a narrow [O iv] 25.8903 m line (see Fig. 4). A weaker blueshifted component to this feature is discussed in Section 3.4 and shown in Figure 15. For the whole ER spectrum the integrated [Fe ii] 25.99 m line flux is measured to be W cm-2, similar to the flux levels measured for this line from a time sequence of Spitzer spectra obtained up to day 7954 (Arendt et al., 2016). A broad redshifted emission line corresponding to [Fe ii] 5.340169 m is also present in the whole ER spectrum, with a flux of W cm-2, a heliocentric line centre radial velocity of +245030 km s-1 and an FWHM of 160070 km s-1. The only cardinal point spectrum in which the 5.34 m line is detected is the Ring-South spectrum (flux= W cm-2, velocity km s-1, FWHM km s-1). These lines are due to the ejecta-ring interaction and are discussed further in Section 3.4.
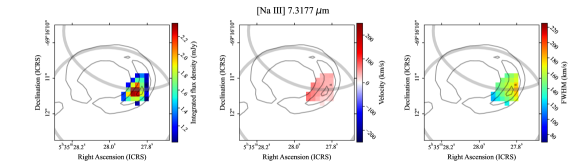
A comparison of the MRS line fluxes for the whole ER listed in Table 1 with those listed by Arendt et al. (2016) from their Spitzer 10–40 m spectral sequence shows the latter fluxes to be generally an order of magnitude larger. This might be due to the Spitzer line flux measurements having been made with larger apertures. A comparison of the relative line intensity patterns seen in the JWST-MRS and Spitzer-IRS datasets indicates that, relative to [S iv] 10.51 m, the low degree of ionization [Fe ii] and [Ne ii] lines have brightened by factors of 5-12 in the MRS spectra. Arendt et al. (2016) suspected the presence of [Ni ii] 6.64 m, H i 7.46 m and [Ne vi] 7.65 m in their R=90 5–10 m Spitzer spectra - these lines are confirmed by the MRS spectra. The MRS detection of [Ar iii] 8.99 m appears to be new. The other new line detections are [Fe ii] 5.340169 m, [Ni ii] 10.6822 m and [Na iii] 7.31775 m, both seen in the whole-Ring and in the Ring-West spectra.
The 10–40 m Spitzer-IRS spectra discussed by Arendt et al. (2016) had a resolving power of R=600. The 5 times greater resolving power of the 5–27 m JWST-MRS spectra allows higher resolution FWHM and radial velocity measurements to be made. Inspection of the FWHM values for the lines in the whole ER spectrum listed in Table 1 reveals two groupings: (a) eight lines with FWHM values of between 280 and 380 km s-1, namely all the lines that arise from singly ionized species (Ni+, Ar+, H+, Ne+ and Fe+), together with lines from doubly ionized Na2+ and Ar2+; and (b) seven lines arising mainly from more highly ionized species (Ne5+, Ne4+, Ne2+, S3+, S2+ and O3+), with FWHM values between 99 and 171 km s-1. The [S iv] 10.51 m, [Ne vi] 7.65 m and [Ne v] 14.32 m lines are particularly narrow (99–107 km s-1 FWHM) - not much larger than the instrumental resolution measured at those wavelengths by Jones et al. (2023), while the larger line widths (123–145 km s-1) measured for the [S iii] 18.71 m, [Ne v] 24.32 m and [O iv] 24.89 m lines are consistent with the instrumental resolutions measured by Jones et al. (2023) for this lower resolution part of the MRS range.
The general expansion of the ER may contribute to the broadening of some of the lines seen in the whole-ER spectrum, an effect which should be reduced in the individual cardinal point spectra. Comparison of the FWHM values measured for the whole ER (Table 1) with those measured for the cardinal point spectra (Table 2) shows that for the singly ionized species their FWHM values are appreciably lower in the cardinal point spectra. However, this is not the case for the much narrower lines that arise from the more highly ionized species, for which the whole-ER and cardinal point FWHM values are similar. This behaviour indicates that while the emission from the singly and doubly ionized species originates from the ER itself, that from the more highly ionized species may have a partly different origin. This is also shown by the line maps presented in Section 3.1.2. Support for this interpretation comes from a consideration of the radial velocity differences seen in Table 2 across the four cardinal point spectra. For lines from singly ionized species, the mean difference between the radial velocities measured for the Ring-South and Ring-North spectra was +286.745.5 km s-1, while the East-West mean difference was +46.929.5 km s-1. In contrast, for the more highly ionized species, the corresponding radial velocity differences were much smaller, +45.749.1 km s-1 (South-North) and 10.0 km s-1 (East-West). We take this as confirmation that the lines from singly and doubly ionized species originate principally from the expanding ER and that the much narrower lines from more ionized species must originate from a different emission component.
Gröningsson et al. (2008) presented 6 km s-1 resolution optical spectra of northern and southern parts of the ER, obtained in 2002 at days 5702–5705 past explosion, at a time when the northern quadrant was the brightest part of the ER. They saw a mixture of narrow lines (FWHM=10-29 km s-1), from H i up to [Ne v], and broad lines (line widths larger than 200 km s-1), from H i up to [Fe xiv]. They attributed the narrow lines to unshocked pre-ionized gas in the ER and the broad lines to recombining post-shock gas. By the time of our MIRI-MRS observations of the ER on day 12927, the only broad emission lines seen were from the singly ionized species, consistent with the ongoing recombination of the post-shock gas and with Gröningsson et al. (2008)’s prediction that “As more and more gas cools we expect the width of especially the low ionization lines to increase.”
From optical emission line diagnostics and thermally broadened line widths, Gröningsson et al. (2008) estimated electron densities –5000 cm-3 and electron temperatures –24,000 K for their narrow-line component. The narrow-line [Ne v] 14.32/24.32 m line flux ratio is the only electron density diagnostic available from our MRS spectra of the ER. For the Ring-West spectrum, the brightest of the four cardinal point spectra (see Table 2), this ratio is measured to be 1.1510.115, while for the whole-ER spectrum (see Table 1) the ratio is found to be 1.0210.059. Using the atomic data of Galavis et al. (1997) and Griffin & Badnell (2000), these ratios correspond to electron densities of between 700 and 4300 cm-3 for electron temperatures in the range K, similar to the parameters derived by Gröningsson et al. (2008) for their narrow line component.
The detection of two [Ni ii] lines in the Ring-West spectrum allows a constraint to be placed on the electron temperature of this part of the ER. Using the atomic data of Nussbaumer & Storey (1982), Quinet & Le Dourneuf (1996) and Bautista (2004), the observed [Ni ii] 6.64/10.68 m flux ratio of 9.710.35 requires an electron temperature T K. For temperatures higher than this the 10.68 m line (which originates from a higher level than the upper level of the 6.64 m transition) would become too strong. This temperature limit is consistent with strong post-shock cooling having taken place in the dense ER clumps.
3.1.2 Line emission maps
Here, we discuss the spatially resolved line emission structure of SN 1987A over the MRS IFS for the different narrow- and broad-line-emitting species. For each selected emission line, we formed continuum-subtracted images by subtracting from each line-centred image a mean image from adjacent line-free regions on either side of the line, each off-image having the same spectral bandwidth as the line-centred image.
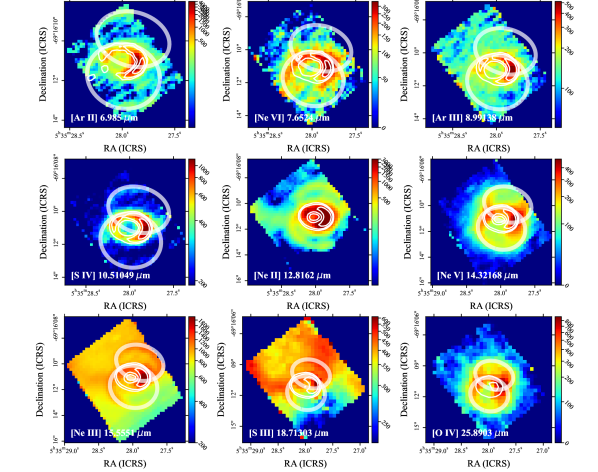
Fig. 5 shows continuum-subtracted images for nine emission lines, using display ranges designed to bring out fainter levels of emission. All of the images show strong ER emission, peaking at the western quadrant. The outer rings are prominent in the [Ne ii], [Ne iii], [Ne v], [Ne vi] and [O iv] images, with the observed distributions of the latter three ions predominantly following the morphology of the outer rings. All of the line images shown in Fig. 5 display some level of extended emission beyond the extent of the inner and outer rings. For [Ne v] and [O iv] this lower surface brightness emission appears to closely envelop the outer rings but for [Ne ii], [Ne iii] and, in particular, [S iii] 18.71 m, part of a large ring-like structure fills the north-eastern half of the IFS FoV, passing through the northern part of the ER. In order to check for radial velocity variations across this structure that might support a very large expanding ring interpretation, we extracted spectra of the [S iii] 18.71 m line at three positions in the ring-like structure: one from near its north-eastern edge; one near its north-western edge; and one just to the north of the ER. However, the measured [S iii] radial velocities showed a difference of only 4.90.7 km s-1 between the NE and NW positions, with the velocity of the position north of the ER measured to be in between those of the other two. We interpret these results as not providing strong support for a very large expanding ring interpretation.
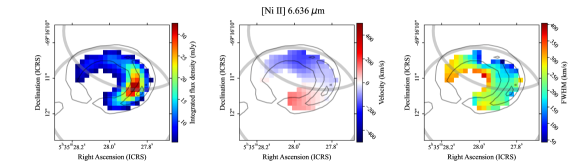
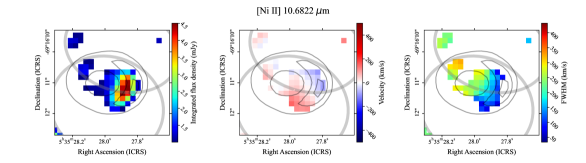
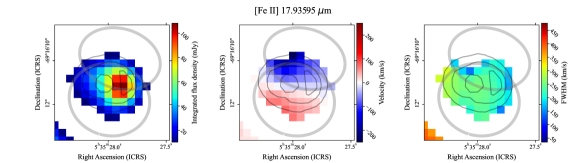
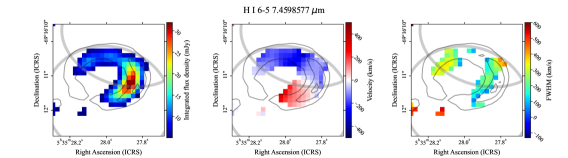
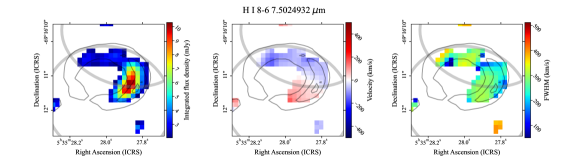
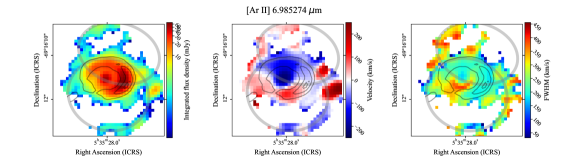
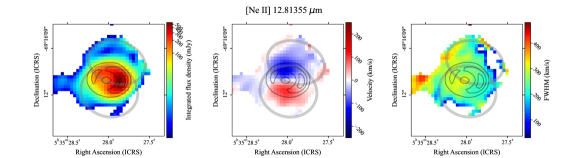
We have identified spectral features of both small and large spatial scales by manually searching through the spectral axis MRS sub-band datacube using small and large apertures at varying locations around the system. We then identified the emitting species associated with each feature before slicing a sub-cube around the feature using the Spectral-Cube999https://spectral-cube.readthedocs.io/en/latest/ Astropy affiliated package (Ginsburg et al., 2014). We carefully fitted and subtracted the continuum from each of the sub-cube spaxels using regions away from the spectral feature and accounting for the variation in sampling and residual fringing. With the resulting sub-cubes, we created sets of moment maps using Spectral-Cube. From the 0th, 1st, and 2nd moments, we produced integrated line intensity maps, velocity maps which account for the systemic barycentric velocity of SN 1987A of 287 km s-1 (Gröningsson et al., 2008), and FWHM maps. We applied a cut across all maps based on an integrated intensity threshold to mask regions with little or no line emission. The moment maps for a selection of lines are shown in Figs. 6, 7 and 8. Lines from singly ionized species, the majority of those plotted in the three figures, all show a strong radial velocity difference between the blue-shifted northern part of the ER and the red-shifted southern part, consistent with the cardinal point radial velocity measurements for singly ionized species listed in Table 2, and with previous ground-based results (e.g. Kjær et al., 2007).
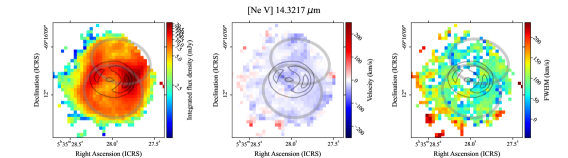
The radial velocity map shown in Fig. 8 for [Ne v] 14.32 m, a representative of the more highly ionized species, does not show any radial velocity changes across the ER, consistent with its velocity measurements in Table 2, which show differences of only 2.01.8 and 13.62.5 km s-1 between its East-West and South-North radial velocities, respectively. But Table 2 also shows that the fluxes measured for [Ne v] and other high ionization species peak in the Ring-West aperture, indicating a relationship between the narrow-line component and the ER material. However, the narrow-line component also extends to the outer rings and beyond, up to the edges of the MRS FoV - see Figs. 5 and 8 for e.g. [Ne v], with the mean surface brightness of the [Ne v] 14.32-m line in the background aperture (Fig. 2) corresponding to 4 per cent of its surface brightness in the Ring-West aperture.
.
3.2 Dust in the Equatorial Ring
3.2.1 Dust Composition
The MRS spectrum of the ER, shown in Figure 4, is dominated by continuum emission from amorphous silicate dust, characterised by the broad 10 m and 18 m spectral features. No evidence for polycyclic aromatic hydrocarbons (PAH) emission is present in the spectrum; the improved resolution of the MRS has not revealed any new solid-state dust species in the mid-IR spectra compared to Spitzer/IRS observations.
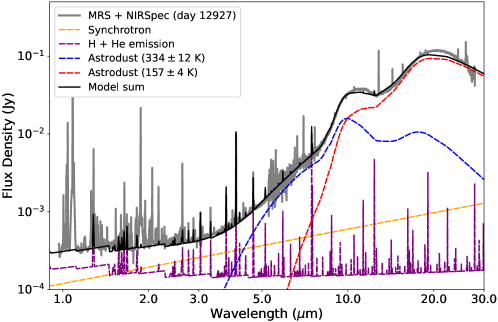
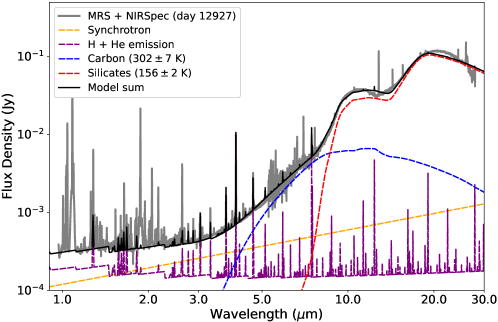
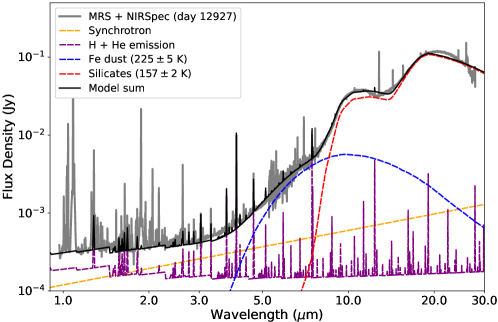
In order to determine which dust properties best reproduce the shape of the dust continuum observed with JWST, we fitted the 5.3–28 MRS and the 0.9–5.3 NIRSpec data (Larsson et al., 2023) with two-temperature dust models of varying grain compositions. We accounted for the synchrotron emission for day 12,927 using the model constructed from ALMA observations of the ER that is described by Equation 1 of Cendes et al. (2018). We used the parameters from the torus model listed in Table 6 of Cendes et al. (2018) and the updated value of the spectral index of 0.7 from Cigan et al. (2019). The parameters for the synchrotron component were fixed and did not vary in our fit. We also included bound-free and free-free emission from H I, He I, and He II with a temperature of K that was used by Larsson et al. (2023) to fit the NIRSpec data. The models are shown in Figure 9 and the best-fit temperatures and corresponding dust masses are listed in Table 3.
We find that the 0.9–28 spectral range is best-reproduced by a single grain composition of astrodust (Hensley & Draine, 2023) emitting at 1574 and 33412 K. This model is shown in the top panel of Figure 9. As described in Hensley & Draine (2023), astrodust reproduces the observational properties of dust in the diffuse ISM and is made up of composite grains that consist of different compositions (primarily silicates and oxides) on small scales but are effectively one uniform composition on larger scales of 0.05 . We assumed that the grains are oblate spheroids with an axial ratio of 1.4:1, a porosity of 0.2, and a density of 2.74 g cm-3 (see Hensley & Draine, 2023). Since the mass absorption coefficients are size-independent in the mid-IR wavelength range, the choice of grain size did not affect our best-fit parameters.
We also attempted to fit the spectra using a silicate dust grain composition (Draine & Lee, 1984), but as was found in earlier studies (e.g. Dwek et al., 2010), we required an additional featureless dust component to account for the shorter wavelength emission. For this second component, we used carbon dust from Draine & Lee (1984) (middle panel of Figure 9) and iron dust from Ordal et al. (1985) (bottom panel). Both combinations fit the spectra fairly well, even though the fits are slightly poorer than the astrodust in the 3–5 range. The corresponding dust masses and temperatures are listed in Table 3. The total dust mass required from the Fe dust component is unreasonably high, so we disfavour this composition as a dominant component producing the shorter-wavelength dust continuum.
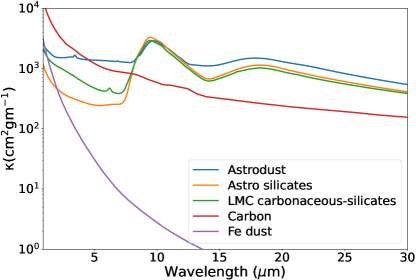
Out of the grain compositions that we used, only the astrodust composition could reproduce the observed spectrum without the need for an additional featureless grain composition. The reason for this can be seen in the comparison of the mass absorption coefficient () values for each of the grain species, shown in Figure 10. It can be seen that the astrodust opacity is significantly larger in the 2.5–7.0 range, and the peak-to-continuum ratio for the broad 9.8 and 20 features lower, compared to silicates from Draine & Lee (1984) and the LMC carbonaceous-silicate grains from Weingartner & Draine (2001).
| Dust | Temperature | Mass |
|---|---|---|
| Composition | (K) | () |
| Astrodust | 334 12 | |
| Astrodust | 157 4 | |
| Carbon | 302 7 | |
| Silicates | 156 2 | |
| Iron | 225 5 | |
| Silicates | 157 2 |
Note. — Dust temperatures and masses for the models shown in Figure 9. The listed uncertainties are the 3- uncertainties from the fit.
| Day | T1 | M1 | T2 | M2 |
|---|---|---|---|---|
| (K) | () | (K) | () | |
| 6805 | ||||
| 7138 | ||||
| 7296 | ||||
| 7555 | ||||
| 7799 | ||||
| 7955 | ||||
| 12927 |
Note. — Dust temperatures and masses for two-component fits to the 5-30 spectra from Spitzer (days 6805–7955) and JWST MRS (day 12927) using the astrodust composition from Hensley & Draine (2023). The listed uncertainties are the 3- uncertainties from the fit.
3.2.2 Temporal Evolution
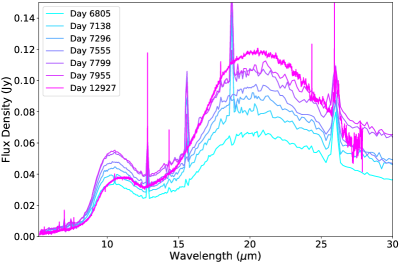
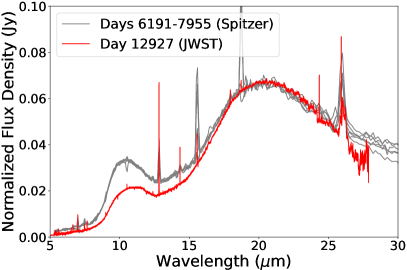
The comparison between the Spitzer/IRS spectra from previous epochs to the day 12,927 total MIRI/MRS spectra extracted from SN 1987A is shown in the left panel of Figure 11. The Spitzer IRS data from days 6000 to 8000 have been reduced in a consistent manner using the optimal extraction from the Combined Atlas of Sources with Spitzer IRS Spectra (CASSIS; Lebouteiller et al. 2011), with the Short-Low scaled to match the Long-Low flux following Dwek et al. (2010). The MRS spectrum is obtained from within an elliptical region just inside the background boundaries (see Fig.2) and includes all emission from the ER and inner region and is thus comparable to the Spitzer IRS data in which the SN 1987A system is not spatially resolved. It can be seen that since day 8000, the brightness of the broad 20 silicate feature has continued to increase whereas the part below 15 has decreased. This effect is clearly illustrated in the right panel of Figure 11 where the spectra have been normalized to the flux density of the 20–21 range of the day 6805 spectrum. As was shown by Dwek et al. (2010), the Spitzer spectra (grey curves) have an almost identical spectral shape. However, while the day 12927 MRS spectrum shows the same approximate shape above 18 µm (the spectral region that samples the cold dust component), the relative flux densities at shorter wavelengths are significantly lower.
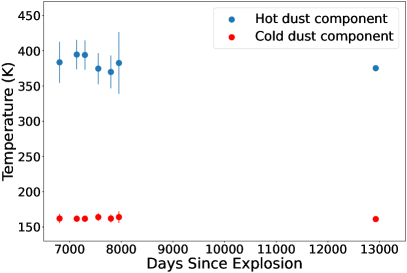
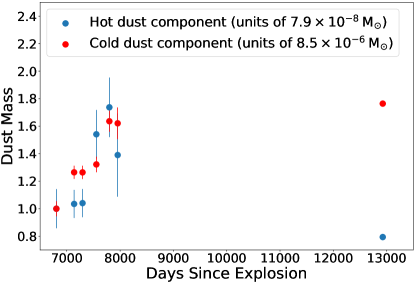
In order to determine the evolution of the dust parameters over time, we fitted all spectra shown in Figure 9 with a two-temperature dust model using the astrodust composition. For a consistent comparison between Spitzer IRS and MRS, we only fitted the 5–28 range common to both instruments. We included the previously discussed time-varying synchrotron component (Cendes et al., 2018) in the model. The resulting dust temperatures and masses are summarized in Table 4 and shown in Figure 12. Interestingly, the dust temperature has remained the same within the uncertainties across all epochs. The cold dust mass measured from the most recent MRS data has increased slightly since day 8000, but the mass of the hot dust component dropped by more than 40% (right panel of Figure 12). This is likely indicative of significant destruction of the small grain component over time, as previously noted by Arendt et al. (2020) based on Spitzer IRAC imaging observations.
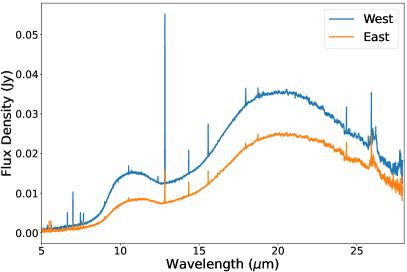
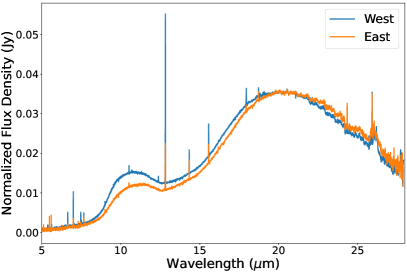
The temporal evolution does not occur in a uniform way over the entire ER. As was shown with IRAC imaging at 3.6 and 4.5 µm (Arendt et al., 2020) and with mid-IR imaging (Matsuura et al., 2022) the brightening of the ER started in the east in the 2000’s after which it faded again and the brightening started in the west by the late 2010’s. Figure 1 confirms that the W is still brighter than other portions of the ring over the whole wavelength range of the MRS. A comparison of the spectra taken from the E and W segments of the ER (Figure 2) is shown in Figure 13. The W is approximately 50% brighter than the E part. Apart from the lower overall flux in the E, there are also some spectral changes that can be seen in the spectra normalised at 20 µm in the right panel of this figure. The eastern part has a relatively stronger long wavelength part and the 10 µm silicate band is weaker and its peak has slightly shifted to the red in comparison to the W. This spectral difference can be explained by a relatively higher dust temperature in the W. To model the dust parameters like the dust mass and temperature of the two segments requires a careful determination of the local underlying synchrotron continuum for the two ring segments and is planned for a future paper.
3.3 Other Dust Emission
In contrast to the inner ER, no dust emission was detected in the region corresponding to the two outer rings which are three times more extended than the ER and currently remain unaffected by the blast wave.
The ejecta dust was too faint to be detected by Spitzer. Dust emission may be present in the JWST/MRS ejecta spectra, however, this requires more mature calibration and extraction procedures to separate any potential contamination from the ring, as such the ejecta’s solid-state component is subject to a future paper after follow-up Cycle 2 JWST/MRS observations have been obtained (PID #2763).
3.4 Emission from the ejecta and ejecta - ER interaction
During our search for small-scale emission line structures in the SN 1987A system we found that, in addition to the primary emission line peaks with radial velocities consistent with an origin in the ER, outer rings, or diffuse ISM, some lines had additional high-velocity blue- and/or red-shifted features in the northeast and southwest of the ER. Two of these, [Fe ii] 5.340169 m and [Fe ii] 25.98839 m have already been described in Sect. 3.1.1. Further to these, high-velocity components were detected for [Ni ii] 6.636 m, [Ar ii] 6.985 m, and [Ne ii] 12.814 m. Because the spectral and spatial information complements each other nicely, we discuss first the integrated line spectra and later the spatial maps. One may note that especially at the longer wavelengths the velocity resolution is considerably better than the spatial, although smoothed over a surface of constant line of sight velocity.
From observations of the HST light curve and imaging, we know that the ejecta is powered by radioactive decay of 44Ti and X-rays from the ejecta – ER interaction (Larsson et al., 2011). The X-ray-shielded inner ejecta is mainly powered by radioactive decay of 44Ti, while the outer parts are heated by the photoelectric absorption of X-rays (Fransson et al., 2013). In the spectra, the ejecta are seen as broad lines expanding with velocity , where the dense, metal-rich core of the SN has a velocity of , mainly emitting in lines from Fe i-ii, O i, Mg i-ii, Si i and Ca ii, but also from H i, and He i, mixed into the core (Chugai et al., 1997; Kozma & Fransson, 1998; Jerkstrand et al., 2011). The 44Ti input is partly in gamma-rays and partly positrons, where the former mainly escapes at these late epochs while the positrons are deposited locally in the Fe and O-rich gas. Because of the very low temperature of the gas in the core, K, it is expected that a major fraction of this energy will be emitted in the [Fe ii] 25.99 m line (Kozma & Fransson, 1998; Jerkstrand et al., 2011). This and other [Fe ii] lines are therefore of special interest for understanding the conditions in the core of the SN.
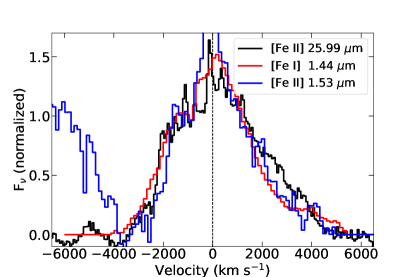
In Fig. 14 we show an extraction of the central part (see Fig. 2) of the ejecta in the [Fe ii] 25.99 m line, together with the NIR [Fe i] 1.443 m and [Fe ii] 1.534 m lines from the JWST NIRSpec spectra (Larsson et al., 2023). The three lines have similar profiles, in spite of different ionization stages and excitation energies. The [Fe ii] 25.99 m line, which has the best spectral resolution, extends from on the blue side to on the red side. The line is quite asymmetric, with a steep blue side and a more extended red side.
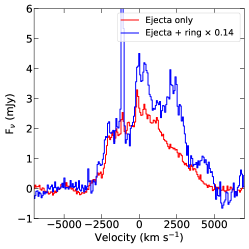
This central extraction showed only faint traces of the other lines mentioned above. However, an extraction also covering the ER (Fig. 2) had a clear signal for all of these. In Fig. 15 we show on the left panel a comparison of this extraction with the central extraction. In this plot we have scaled the total extraction by a factor of 0.14 to agree at , mainly reflecting the small central extraction region compared to the total extraction (Fig. 2). The most notable difference is the strong peak at , but also a fainter peak at . The peak at corresponds to the interaction region in the SW, as can be seen on the line maps below. The central peak, not seen in central extraction, may come from the part of the dense ejecta above the ER plane, which has been bright also in earlier SINFONI observations (Larsson et al., 2016), when it was still located inside the ER. Because of the expansion, it is now projected against the ER.
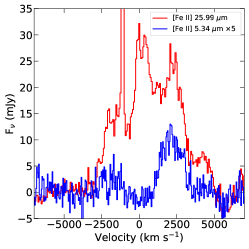
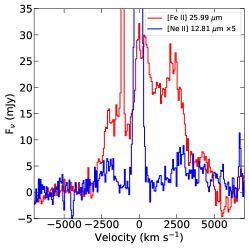
In the middle panel, we show a comparison with the [Fe ii] 5.340 m line. This comparison is interesting because it shows a major difference with the [Fe ii] 25.99 m line in that the low-velocity emission is very low compared to the emission peaks at and . This indicates that there is little [Fe ii] 5.340 m emission from the central parts of the ejecta, as was indicated from the central extraction. It also separates out the emission from the ER interaction on the blue side, which is not easily distinguished from the 25.99 m line.
The right panel of Fig. 15 shows a corresponding comparison with the [Ne ii] 12.81 m line. This shows a similar line shape as the [Fe ii] 5.340 m line, with a stronger red component and a weaker blue component at similar velocities, but with little central emission.
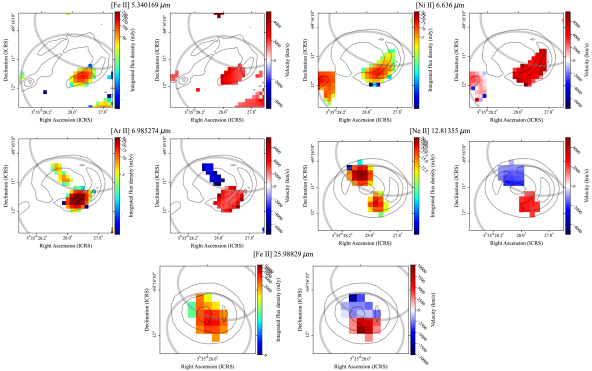
To determine the morphology and radial velocity of these structures spatially we again produced intensity and velocity maps using the 0th and 1st moments using Spectral-Cube, this time masking the contribution of the low-velocity component. The resulting maps are shown in Fig. 16. Significant, highly red-shifted emission centred at km s-1 and projected towards the southwestern ER is observed in all lines. In the cases of [Ar ii] 6.985 m, [Ni ii] 6.636 m, and [Fe ii] 25.988 m, a blue-shifted component is also observed, though projected towards the northeast of the ER. The location and velocity of these features agree with the JWST NIRSpec study of Larsson et al. (2023), who found broad [Fe i] 1.443 m and [Fe ii] 1.644 m towards the northeast and southwest of the ER. Larsson et al. (2023) attributed these features to the interaction of the expanding ejecta with the reverse shock and also noted that northeast-southwest elongated morphology has been observed in all other atomic lines from the ejecta (Wang et al., 2002; Kjær et al., 2010; Larsson et al., 2013, 2016). We suggest here that the high-velocity emission observed in our MIRI/MRS observations results from that same ejecta-reverse shock interaction. A more detailed analysis of the ejecta and interaction regions will be presented in future work.
.
4 Discussion
The MIRI MRS observations presented above reveal the first spatially resolved spectral maps in the 5 to 28 m wavelength region. The gas emission lines arise in the ER, the ejecta, the outer rings and the region between the ER and the outer rings. The continuum, which is dominated by dust emission, arises primarily in the ER.
The improved spectral resolution over Spitzer reveals the kinematic origin of the lines as well as enabling the discovery of new gas emission lines such as [Fe ii] 5.34 m, [Na iii] 7.32 m, [Ar iii] 8.99 m, and [Ni ii] 10.68 m (Sect. 3.1). The origin of the narrow but centrally located [Ar ii] lines is discussed by Fransson et al. (submitted). The [Ni ii] lines set an electron temperature of T K in the western lobe. This relatively low temperature plus the low degree of ionization of the broad-line emitting species in the ER are consistent with dense post-shock cooling gas emission. The current higher density of the western side compared to the rest of the ER has likely also elevated the temperature and heating of the dust in the western lobe (Matsuura et al., 2022).
The origin of the narrow-line component, associated with the spectra of the more highly ionized species, is less clear. On the one hand, the surface brightnesses of the narrow lines peak at the equatorial ring, indicating some degree of association with the material in the ER. On the other hand, the narrow-line emission component shows no significant radial velocity variations and extends far beyond the ER, permeating the outer rings and reaching the edges of the MRS field with declining surface brightness. Candidate mechanisms to produce this narrow-line, higher degree of ionization, emission component include photoionization by X-ray and ultraviolet photons from shocks passing through the ER, and flash ionization by the original UV photon pulse of circumstellar or interstellar material of sufficiently low density that recombination has not yet completed.
Previously Dwek et al. (2010) and Arendt et al. (2016) used a two-component dust model to fit the low-resolution Spitzer/IRS spectra, consisting of a warm dust amorphous silicate component with a temperature of 180 K to model the 8–35 m emission and a secondary featureless hot dust component fit to the 5–8 m flux assumed to have an amorphous carbon ( K) composition. This secondary component may also be fit by iron grains as its optical constants are also featureless which would result in hot dust temperatures of 350 K. Arendt et al. (2016) determined temperatures of 190 K and 525 K for the silicate and carbonaceous components, respectively. Using the same sets of mass absorption coefficients as Dwek et al. (2010) and Arendt et al. (2016) we obtain slightly cooler temperatures for both components in our dust model fits to the MRS data, as we account for the contribution from the extrapolated long-wavelength synchrotron component and the H and He continuum emission in the near-IR. Our multi-component model is also representative of the near-IR emission which prior models of the ER emission did not manage to fit successfully.
In our analysis, astrodust (Hensley & Draine, 2023) optical constants best fit the NIRSpec and MIRI spectra. Astrodust is comprised of C, O, Mg, Si, and Fe in a single-grain material, including amorphous silicates in the form Mg1.3(Fe,Ni)0.3SiO3.6 and no large carbonaceous grains. This eliminates the need for two-grain compositions (silicates plus a featureless component typically assumed to be carbon) spatially coexisting, which form from completely divergent condensation pathways in the RGB phase of evolution. Grains formed during this phase are primarily oxygen-rich, due to CNO processes in the core resulting in low carbon abundances, with any remaining C atoms locked up in CO molecules. The additional benefit of our model is that the cooler temperature we obtain for our hot dust component can be reached by collisional heating under thermal equilibrium, eliminating the need for the more problematic stochastic heating which very small amorphous hydrocarbons from previous fits would require (Arendt et al., 2016; Dwek et al., 2010).
While beyond the scope of the present study, detailed modelling of the various components of the SN 1987A MRS spectra with laboratory data is an important step toward understanding the evolution of dust in SNe. Using Dorschner et al. (1995) optical constants for amorphous silicates which Jones et al. (2014) found best fit the spectra of RSGs in the LMC results in fits to the ER which are too sharp to reproduce the 10 and 20-micron features. Likely, some additional components at the few percent level including SiO2, Al2O3, CaCO3, Fe oxides, carbides, and sulphur compounds, which are all included in the artificial astrodust composite grains, would be required. Pure Fe is ruled out as a viable candidate due to the large dust mass that would be required (Table 3).
The evolution of the hot dust 15 m component is consistent with the steady decline seen in the 3.6 and 4.5 m flux measured during Spitzer’s warm mission. The Spitzer cryogenic data pre-day 8000 was found to follow the same trends as the X-ray emission prior to diverging post-day 8000 (Arendt et al., 2016, 2020). This corresponds to the collisional heating of the dust in the ER before a transition to radiative heating or a change in the physical conditions in the ring, for instance, grain destruction or a change in the dust grain size distribution. Thermal sputtering timescale suggests that grain destruction may become prominent from day 9200 after the explosion (Dwek et al., 2010). This dust processing and destruction are conclusively shown for the hot dust in the MRS spectra obtained on day 12977, however, the effects are negligible for the cold dust emission which may even be growing in mass (though not significantly) due to the expanding propagation of the forward shock wave sweeping up remnant circumstellar material.
Dust grains in the ring are expected to have a distribution of grain sizes that are heated to different temperatures, with the resulting emission spectrum reflecting a continuous temperature gradient as a function of grain size. In our fits, this gradient is approximated by a two-temperature-component model. The temperature differential between our hot and cold components in the astrodust model is, therefore, likely a consequence of the dust grain size distribution, with the hot dust component corresponding to smaller grains and the cold component to the larger ones. The trend seen in Figure 12 can thus be interpreted as circumstellar material from the progenitor being swept up by the blast wave expanding through the ring, with the smaller grains being simultaneously destroyed in the ER on timescales of a few years (Arendt et al., 2016). Once the grains stop being replenished in sufficient amounts destruction of the small grains dominates, whereas the large grains are more likely to survive the passage of the high-velocity shock, resulting in the divergence in dust masses between the hot and cold components seen in the MRS data. This scenario requires the hot grains to be non-carbonaceous, as the binding energy makes carbonaceous grains relatively stable against thermal and non-thermal sputtering (Fischera et al., 2002).
SOFIA observations (Matsuura et al., 2019) identify a 31.5–70 m excess which may be attributed to dust re-formation after the passage of the forward shock, warm dust emission from the ejecta or the survival of large grains. Matsuura et al. (2019) prefer the reformation of dust grains after the shock front. There is however no indication in the MRS data of a warm dust component from the ejecta nor a re-formed dust component or substantial grain growth in the ring, given the consistency between the long-wavelength MIRI/MRS and Spitzer/IRS data. This suggests that dust reformation in the post-shock region of this system does not easily occur or occurs on much longer time scales given the low densities (Biscaro & Cherchneff, 2014). Our results support the survival of large grains in the shocks.
The different line shapes between the [Fe ii] 25.99 m line on the one hand and the [Fe ii] 5.340 m and [Ne ii] 12.81 m lines, on the other hand, show that the excitation of the outer parts of the ejecta, close to the ER, and the central region are different. The excitation energy of the upper level of the [Fe ii] 25.99 m line corresponds to 550 K, while it is 2676 K for the [Fe ii] 5.340 m line, 1115 K for the [Ne ii] 12.81 m line and 2045 K for the [Ar ii] 6.985 m line. From the modelling of the 8-year spectrum in Jerkstrand et al. (2011) the temperature in the 44 Ti-powered inner core is K. The excitation of the [Fe ii] 25.99 m line can therefore occur at low temperatures, while the much higher excitation energies of the other lines require a higher electron temperature. This is consistent with the observed dip in the central line profile of the [Fe ii] 5.340 m line. The temperature at 35 years may be different from the above, but these line profiles indicate a very low temperature in the core also at the present epoch. Models of the X-ray transfer in the ejecta from the ejecta – ER interaction also show that most of the X-rays have not yet penetrated to the central parts of the core (Fransson et al., 2013; Kangas et al., 2022b). The high-velocity Fe-rich regions which have expanded to close to the reverse shock are, however, not shielded from the X-rays due to a much smaller column density between the reverse shock and ejecta. They will therefore be heated efficiently, as is directly seen from the line profiles and the maps, and will have a much higher temperature. More detailed modelling of the shock interaction is required for a more quantitative estimate.
5 Conclusions
We have presented mid-IR spectra of SN 1987A obtained with the MRS instrument onboard JWST on day 12,927 post-explosion. The 5–28 m MRS spectroscopic observations spatially resolve the ER, ejecta, outer rings and surrounding environment. We find:
-
1.
Infrared line emission from the ER coincides with the dense clumps of gas observed as hotspots in the optical images, while we find that the dust continuum emission is more spatially extended.
-
2.
Emission line radial velocities, FWHM values and integrated line fluxes were measured at four cardinal points in the ER and for the whole ring. Nineteen emission lines, from thirteen species, were detected. The majority of the lines identified have previously been detected in Spitzer spectra of SN 1987A, including [Ni ii] 6.64 m, H i 7.46 m and [Ne vi] 7.65 m which were previously only tentatively identified. However, [Fe ii] 5.34 m, [Na iii] 7.32 m, [Ar iii] 8.99 m and [Ni ii] 10.68 m are new detections.
-
3.
The MRS lines are approximately an order of magnitude fainter compared to the Spitzer detections on day 7954, which could be partly attributable to a smaller extraction region for the MRS lines. However, relative to [S iv] 10.51 m, the low degree of ionization [Fe ii] and [Ne ii] lines have brightened by factors of 5–12 in the MRS spectra.
-
4.
The velocity structures of the ER lines indicate that they arise from two regions: The singly ionized species show broad lines (280-380 km s-1 FWHM) and their radial velocities indicate that they originate from the expanding ER. Their low degree of ionization, together with the upper limit of 6500 K on the ER electron temperature provided by the ratio of the [Ni ii] 6.64- and 10.68-m lines, are consistent with recombination of post-shock gas. Lines from the more highly ionized species are narrower (99-171 km s-1) and their lack of any radial velocity variations across the ER and beyond indicates that they arise from a different emission component. The ratio of the [Ne v] 14.32- and 24.32-m lines at the ER implies electron densities for this component of between 700–4300 cm-3 for T K, while a [Ne v] 14.32-m continuum-subtracted image shows the emission to also be associated with material located in the outer rings and beyond. The higher degree of ionization of these species may have been produced by either X-ray and ultraviolet photons from shocks progressing through the ER, or else by flash ionization by the UV photon pulse associated with the original supernova explosion.
-
5.
The overall shape and positions of the features in the ER spectrum are generally consistent with the Spitzer/IRS spectra obtained between days 6000 and 8000. No resonances from other solid-state features are apparent in the higher-resolution MRS spectra. However, the relative flux densities m are significantly lower in the MRS spectra.
-
6.
The 0.9–28 NIRSpec and MIRI spectral range is best-reproduced by a single set of astrodust optical constants emitting at 1574 and 33412 K. This is contrary to previous models of dust emission from the ER which require a secondary population of very small, carbon or iron grains of unknown origin radiating at significantly higher temperatures to spatially coexist with the cool astronomical silicate grains. The inclusion of the continuum from synchrotron and bound-free emission in our models significantly lowers the temperature of the ‘hot’ component even when this secondary population is represented by amorphous carbon or iron grains.
-
7.
Fitting both the MRS and Spitzer spectra with the same two-temperature model produces a consistent dust temperature in the ring between day 7000 and 12927. However, there is a significant difference in the mass of the hot dust at day 12927 compared to 7955, suggesting the hot, smaller dust grains are being destroyed.
-
8.
The large dust grains from the progenitor preferentially survive the SN explosion and processing by the forward shock as it evolves into an SNR.
-
9.
There is a shift in the amorphous silicate feature position between the East and West ER components indicating a difference in the shock processing.
-
10.
Our spectra show a number of lines from the ejecta which, with the exception of the [Fe ii] 25.99-m line, only have been seen during the first years after explosion. This includes [Fe ii] 5.34 m, [Ar ii] 6.99m and [Ne ii] 12.81 m. The [Fe ii] 25.99 m line is in the centre still powered by the radioactive 44Ti decay, while the emission at is powered by the ER - ejecta interaction. This is also consistent with the line profiles and spatial distribution of the other lines above. The central [Fe ii] 5.34 m to 25.99 m line ratio is consistent with a very cool central ejecta, shielded from the X-rays.
References
- Aitken et al. (1988) Aitken, D. K., Smith, C. H., James, S. D., et al. 1988, MNRAS, 235, 19P, doi: 10.1093/mnras/235.1.19P
- Arendt et al. (2016) Arendt, R. G., Dwek, E., Bouchet, P., et al. 2016, AJ, 151, 62, doi: 10.3847/0004-6256/151/3/62
- Arendt et al. (2020) —. 2020, ApJ, 890, 2, doi: 10.3847/1538-4357/ab660f
- Argyriou et al. (2023) Argyriou, I., Glasse, A., Law, D. R., et al. 2023, arXiv e-prints, arXiv:2303.13469, doi: 10.48550/arXiv.2303.13469
- Arnett et al. (1989) Arnett, W. D., Bahcall, J. N., Kirshner, R. P., & Woosley, S. E. 1989, ARA&A, 27, 629, doi: 10.1146/annurev.aa.27.090189.003213
- Astropy Collaboration et al. (2022) Astropy Collaboration, Price-Whelan, A. M., Lim, P. L., et al. 2022, ApJ, 935, 167, doi: 10.3847/1538-4357/ac7c74
- Bautista (2004) Bautista, M. A. 2004, A&A, 420, 763, doi: 10.1051/0004-6361:20035719
- Biscaro & Cherchneff (2014) Biscaro, C., & Cherchneff, I. 2014, A&A, 564, A25, doi: 10.1051/0004-6361/201322932
- Bouchet et al. (2004) Bouchet, P., De Buizer, J. M., Suntzeff, N. B., et al. 2004, ApJ, 611, 394, doi: 10.1086/421936
- Bouchet et al. (2000) Bouchet, P., Lawrence, S., Crotts, A., et al. 2000, IAU Circ., 7354, 2
- Bouchet et al. (1991) Bouchet, P., Phillips, M. M., Suntzeff, N. B., et al. 1991, A&A, 245, 490
- Bouchet et al. (2006) Bouchet, P., Dwek, E., Danziger, J., et al. 2006, ApJ, 650, 212, doi: 10.1086/505929
- Bradley et al. (2022a) Bradley, L., Sipőcz, B., Robitaille, T., et al. 2022a, astropy/photutils: 1.5.0, 1.5.0, Zenodo, doi: 10.5281/zenodo.6825092
- Bradley et al. (2022b) Bradley, L., Deil, C., Ginsburg, A., et al. 2022b, astropy/regions: v0.7, v0.7, Zenodo, doi: 10.5281/zenodo.7259631
- Burrows (1988) Burrows, A. 1988, ApJ, 334, 891, doi: 10.1086/166885
- Bushouse et al. (2023) Bushouse, H., Eisenhamer, J., Dencheva, N., et al. 2023, JWST Calibration Pipeline, 1.9.5, Zenodo, Zenodo, doi: 10.5281/zenodo.7692609
- Cendes et al. (2018) Cendes, Y., Gaensler, B. M., Ng, C. Y., et al. 2018, ApJ, 867, 65, doi: 10.3847/1538-4357/aae261
- Chevalier & Fransson (2017) Chevalier, R. A., & Fransson, C. 2017, in Handbook of Supernovae, ed. A. W. Alsabti & P. Murdin, 875, doi: 10.1007/978-3-319-21846-5_34
- Chugai et al. (1997) Chugai, N. N., Chevalier, R. A., Kirshner, R. P., & Challis, P. M. 1997, ApJ, 483, 925, doi: 10.1086/304253
- Cigan et al. (2019) Cigan, P., Matsuura, M., Gomez, H. L., et al. 2019, ApJ, 886, 51, doi: 10.3847/1538-4357/ab4b46
- Colgan et al. (1994) Colgan, S. W. J., Haas, M. R., Erickson, E. F., Lord, S. D., & Hollenbach, D. J. 1994, ApJ, 427, 874, doi: 10.1086/174193
- Crotts & Heathcote (2000) Crotts, A. P. S., & Heathcote, S. R. 2000, ApJ, 528, 426, doi: 10.1086/308141
- Dorschner et al. (1995) Dorschner, J., Begemann, B., Henning, T., Jaeger, C., & Mutschke, H. 1995, A&A, 300, 503
- Draine & Lee (1984) Draine, B. T., & Lee, H. M. 1984, ApJ, 285, 89, doi: 10.1086/162480
- Dwek et al. (2010) Dwek, E., Arendt, R. G., Bouchet, P., et al. 2010, ApJ, 722, 425, doi: 10.1088/0004-637X/722/1/425
- Earl et al. (2022) Earl, N., Tollerud, E., O’Steen, R., et al. 2022, astropy/specutils: v1.9.1, v1.9.1, Zenodo, doi: 10.5281/zenodo.7348235
- Fischera et al. (2002) Fischera, J., Tuffs, R. J., & Völk, H. J. 2002, A&A, 395, 189, doi: 10.1051/0004-6361:20021271
- France et al. (2010) France, K., McCray, R., Heng, K., et al. 2010, Science, 329, 1624, doi: 10.1126/science.1192134
- Frank et al. (2016) Frank, K. A., Zhekov, S. A., Park, S., et al. 2016, ApJ, 829, 40, doi: 10.3847/0004-637X/829/1/40
- Fransson et al. (2016) Fransson, C., Larsson, J., Spyromilio, J., et al. 2016, ApJ, 821, L5, doi: 10.3847/2041-8205/821/1/L5
- Fransson et al. (2013) —. 2013, ApJ, 768, 88, doi: 10.1088/0004-637X/768/1/88
- Fransson et al. (2015) Fransson, C., Larsson, J., Migotto, K., et al. 2015, ApJ, 806, L19, doi: 10.1088/2041-8205/806/1/L19
- Galavis et al. (1997) Galavis, M. E., Mendoza, C., & Zeippen, C. J. 1997, A&AS, 123, 159, doi: 10.1051/aas:1997344
- Gall & Hjorth (2018) Gall, C., & Hjorth, J. 2018, ApJ, 868, 62, doi: 10.3847/1538-4357/aae520
- Gardner et al. (2023) Gardner, J. P., Mather, J. C., Abbott, R., et al. 2023, PASP, 135, 068001, doi: 10.1088/1538-3873/acd1b5
- Ginsburg et al. (2014) Ginsburg, A., Robitaille, T., Beaumont, C., & ZuHone, J. 2014, Release Candidate 2 - includes yt interop, v0.2-rc2, Zenodo, doi: 10.5281/zenodo.11485
- Griffin & Badnell (2000) Griffin, D. C., & Badnell, N. R. 2000, Journal of Physics B Atomic Molecular Physics, 33, 4389, doi: 10.1088/0953-4075/33/20/315
- Gröningsson et al. (2008) Gröningsson, P., Fransson, C., Leibundgut, B., et al. 2008, A&A, 492, 481, doi: 10.1051/0004-6361:200810551
- Haas et al. (1990) Haas, M. R., Colgan, S. W. J., Erickson, E. F., et al. 1990, ApJ, 360, 257, doi: 10.1086/169115
- Hensley & Draine (2023) Hensley, B. S., & Draine, B. T. 2023, ApJ, 948, 55, doi: 10.3847/1538-4357/acc4c2
- Howarth et al. (2014) Howarth, I. D., Murray, J., Mills, D., & Berry, D. S. 2014, DIPSO: Spectrum analysis code, Astrophysics Source Code Library, record ascl:1405.016. http://ascl.net/1405.016
- Indebetouw et al. (2014) Indebetouw, R., Matsuura, M., Dwek, E., et al. 2014, ApJ, 782, L2, doi: 10.1088/2041-8205/782/1/L2
- Jerkstrand et al. (2011) Jerkstrand, A., Fransson, C., & Kozma, C. 2011, A&A, 530, A45, doi: 10.1051/0004-6361/201015937
- Jones et al. (2014) Jones, O. C., Kemper, F., Srinivasan, S., et al. 2014, MNRAS, 440, 631, doi: 10.1093/mnras/stu286
- Jones et al. (2023) Jones, O. C., Álvarez-Márquez, J., Sloan, G. C., et al. 2023, MNRAS, 523, 2519, doi: 10.1093/mnras/stad1609
- Joye & Mandel (2003) Joye, W. A., & Mandel, E. 2003, in Astronomical Society of the Pacific Conference Series, Vol. 295, Astronomical Data Analysis Software and Systems XII, ed. H. E. Payne, R. I. Jedrzejewski, & R. N. Hook, 489
- Kamenetzky et al. (2013) Kamenetzky, J., McCray, R., Indebetouw, R., et al. 2013, ApJ, 773, L34, doi: 10.1088/2041-8205/773/2/L34
- Kangas et al. (2022a) Kangas, T., Ahola, A., Fransson, C., et al. 2022a, arXiv e-prints, arXiv:2301.00172. https://arxiv.org/abs/2301.00172
- Kangas & Fruchter (2021) Kangas, T., & Fruchter, A. S. 2021, ApJ, 911, 14, doi: 10.3847/1538-4357/abe76b
- Kangas et al. (2022b) Kangas, T., Fransson, C., Larsson, J., et al. 2022b, MNRAS, 511, 2977, doi: 10.1093/mnras/stab3683
- Kirchschlager et al. (2023) Kirchschlager, F., Schmidt, F. D., Barlow, M. J., De Looze, I., & Sartorio, N. S. 2023, MNRAS, 520, 5042, doi: 10.1093/mnras/stad290
- Kjær et al. (2007) Kjær, K., Leibundgut, B., Fransson, C., et al. 2007, A&A, 471, 617, doi: 10.1051/0004-6361:20077561
- Kjær et al. (2010) Kjær, K., Leibundgut, B., Fransson, C., Jerkstrand, A., & Spyromilio, J. 2010, A&A, 517, A51, doi: 10.1051/0004-6361/201014538
- Kozma & Fransson (1998) Kozma, C., & Fransson, C. 1998, ApJ, 497, 431, doi: 10.1086/305452
- Larsson et al. (2011) Larsson, J., Fransson, C., Östlin, G., et al. 2011, Nature, 474, 484, doi: 10.1038/nature10090
- Larsson et al. (2013) Larsson, J., Fransson, C., Kjaer, K., et al. 2013, ApJ, 768, 89, doi: 10.1088/0004-637X/768/1/89
- Larsson et al. (2016) Larsson, J., Fransson, C., Spyromilio, J., et al. 2016, ApJ, 833, 147, doi: 10.3847/1538-4357/833/2/147
- Larsson et al. (2019a) Larsson, J., Spyromilio, J., Fransson, C., et al. 2019a, ApJ, 873, 15, doi: 10.3847/1538-4357/ab03d1
- Larsson et al. (2019b) Larsson, J., Fransson, C., Alp, D., et al. 2019b, ApJ, 886, 147, doi: 10.3847/1538-4357/ab4ff2
- Larsson et al. (2023) Larsson, J., Fransson, C., Sargent, B., et al. 2023, ApJ, 949, L27, doi: 10.3847/2041-8213/acd555
- Lebouteiller et al. (2011) Lebouteiller, V., Barry, D. J., Spoon, H. W. W., et al. 2011, ApJS, 196, 8, doi: 10.1088/0067-0049/196/1/8
- Li et al. (1993) Li, H., McCray, R., & Sunyaev, R. A. 1993, ApJ, 419, 824, doi: 10.1086/173534
- Lucy et al. (1989) Lucy, L. B., Danziger, I. J., Gouiffes, C., & Bouchet, P. 1989, in IAU Colloq. 120: Structure and Dynamics of the Interstellar Medium, ed. G. Tenorio-Tagle, M. Moles, & J. Melnick, Vol. 350, 164, doi: 10.1007/BFb0114861
- Matsuura et al. (2011) Matsuura, M., Dwek, E., Meixner, M., et al. 2011, Science, 333, 1258, doi: 10.1126/science.1205983
- Matsuura et al. (2015) Matsuura, M., Dwek, E., Barlow, M. J., et al. 2015, ApJ, 800, 50, doi: 10.1088/0004-637X/800/1/50
- Matsuura et al. (2017) Matsuura, M., Indebetouw, R., Woosley, S., et al. 2017, MNRAS, 469, 3347, doi: 10.1093/mnras/stx830
- Matsuura et al. (2019) Matsuura, M., De Buizer, J. M., Arendt, R. G., et al. 2019, MNRAS, 482, 1715, doi: 10.1093/mnras/sty2734
- Matsuura et al. (2022) Matsuura, M., Wesson, R., Arendt, R. G., et al. 2022, MNRAS, 517, 4327, doi: 10.1093/mnras/stac3036
- McCray (1993) McCray, R. 1993, ARA&A, 31, 175, doi: 10.1146/annurev.aa.31.090193.001135
- McCray & Fransson (2016) McCray, R., & Fransson, C. 2016, ARA&A, 54, 19, doi: 10.1146/annurev-astro-082615-105405
- Morris & Podsiadlowski (2009) Morris, T., & Podsiadlowski, P. 2009, MNRAS, 399, 515, doi: 10.1111/j.1365-2966.2009.15114.x
- Niculescu-Duvaz et al. (2022) Niculescu-Duvaz, M., Barlow, M. J., Bevan, A., et al. 2022, MNRAS, 515, 4302, doi: 10.1093/mnras/stac1626
- Nussbaumer & Storey (1982) Nussbaumer, H., & Storey, P. J. 1982, A&A, 110, 295
- Ordal et al. (1985) Ordal, M. A., Bell, R. J., Alexander, R. W., J., Long, L. L., & Querry, M. R. 1985, Appl. Opt., 24, 4493, doi: 10.1364/AO.24.004493
- Orlando et al. (2019) Orlando, S., Miceli, M., Petruk, O., et al. 2019, A&A, 622, A73, doi: 10.1051/0004-6361/201834487
- Patapis et al. (2023) Patapis, P., Argyriou, I., Law, D. R., et al. 2023, arXiv e-prints, arXiv:2307.01025. https://arxiv.org/abs/2307.01025
- Pietrzyński et al. (2019) Pietrzyński, G., Graczyk, D., Gallenne, A., et al. 2019, Nature, 567, 200, doi: 10.1038/s41586-019-0999-4
- Pontoppidan et al. (2022) Pontoppidan, K. M., Barrientes, J., Blome, C., et al. 2022, ApJ, 936, L14, doi: 10.3847/2041-8213/ac8a4e
- Pun et al. (1995) Pun, C. S. J., Kirshner, R. P., Sonneborn, G., et al. 1995, ApJS, 99, 223, doi: 10.1086/192185
- Quinet & Le Dourneuf (1996) Quinet, P., & Le Dourneuf, M. 1996, A&AS, 119, 99
- Rank et al. (1988) Rank, D. M., Pinto, P. A., Woosley, S. E., et al. 1988, Nature, 331, 505, doi: 10.1038/331505a0
- Rigby et al. (2023) Rigby, J., Perrin, M., McElwain, M., et al. 2023, PASP, 135, 048001, doi: 10.1088/1538-3873/acb293
- Roche et al. (1991) Roche, P. F., Aitken, D. K., & Smith, C. H. 1991, MNRAS, 252, 39P, doi: 10.1093/mnras/252.1.39P
- Shahbandeh et al. (2023) Shahbandeh, M., Sarangi, A., Temim, T., et al. 2023, MNRAS, 523, 6048, doi: 10.1093/mnras/stad1681
- Slavin et al. (2020) Slavin, J. D., Dwek, E., Mac Low, M.-M., & Hill, A. S. 2020, ApJ, 902, 135, doi: 10.3847/1538-4357/abb5a4
- Spyromilio et al. (1990) Spyromilio, J., Meikle, W. P. S., & Allen, D. A. 1990, MNRAS, 242, 669, doi: 10.1093/mnras/242.4.669
- Spyromilio et al. (1988) Spyromilio, J., Meikle, W. P. S., Learner, R. C. M., & Allen, D. A. 1988, Nature, 334, 327, doi: 10.1038/334327a0
- van Hoof (2018) van Hoof, P. A. M. 2018, Galaxies, 6, 63, doi: 10.3390/galaxies6020063
- Wang et al. (2002) Wang, L., Wheeler, J. C., Höflich, P., et al. 2002, ApJ, 579, 671, doi: 10.1086/342824
- Weingartner & Draine (2001) Weingartner, J. C., & Draine, B. T. 2001, ApJ, 548, 296, doi: 10.1086/318651
- Wells et al. (2015) Wells, M., Pel, J. W., Glasse, A., et al. 2015, PASP, 127, 646, doi: 10.1086/682281
- Wooden et al. (1993) Wooden, D. H., Rank, D. M., Bregman, J. D., et al. 1993, ApJS, 88, 477, doi: 10.1086/191830
- Wright et al. (2023) Wright, G. S., Rieke, G. H., Glasse, A., et al. 2023, PASP, 135, 048003, doi: 10.1088/1538-3873/acbe66