Design of a mobile neutron spectrometer for the Laboratori Nazionali del Gran Sasso (LNGS)
Abstract
Environmental neutrons are a source of background for rare event searches (e.g., dark matter direct detection and neutrinoless double beta decay experiments) taking place in deep underground laboratories. The overwhelming majority of these neutrons are produced in the cavern walls by means of intrinsic radioactivity of the rock and concrete. Their flux and spectrum depend on time and location. Precise knowledge of this background is necessary to devise sufficient shielding and veto mechanisms, improving the sensitivity of the neutron-susceptible underground experiments. In this report, we present the design and the expected performance of a mobile neutron detector for the LNGS underground laboratory. The detector is based on capture-gated spectroscopy technique and comprises essentially a stack of plastic scintillator bars wrapped with gadolinium foils. The extensive simulation studies demonstrate that the detector will be capable of measuring ambient neutrons at low flux levels () at LNGS, where the ambient gamma flux is by about 5 orders of magnitude larger.
1 Introduction
Underground laboratories render rare event searches possible thanks to the powerful attenuation of the cosmic rays by rock overburden. In this very low event rate regime, ambient neutrons originating from the surrounding rock induce background via capture reactions, elastic and inelastic collisions for a variety of elusive searches, e.g., dark matter direct detection and neutrinoless double beta decay experiments. It is crucial that both flux and energy spectrum of the environmental neutrons are measured with scrutiny in order to evaluate their impact on the experimental sensitivity and to help design an adequate shield, suppressing the external neutron background.
In deep underground laboratories, the vast majority of the cavern wall neutrons are produced in two mechanisms, the spontaneous fission of and the reactions, prompted by the -emitters in the decay chain of and , on the light nuclei present in the rock, such as , , and [1]. As a third mechanism, neutrons are produced by the muon interactions in the rock as well. However, the flux of muon-induced neutrons is about two to three orders of magnitude smaller than that of radioactivity-induced neutrons at large depth underground [2].
Located 1400 m below Gran Sasso mountains, corresponding to a depth of 3800 meter-water-equivalent [3], Laboratori Nazionali del Gran Sasso (LNGS) has been hosting numerous rare event searches. The thermal and fast neutrons in the laboratory environment were measured on different occasions in the past [4, 5, 6, 7, 8, 9, 10, 11, 12, 13, 14, 15]. Based on these measurements, projected background rates due to ambient neutrons with a shielding in place were estimated for several dark matter and neutrinoless double beta decay experiments at LNGS [16, 17, 18, 19, 20, 21, 22]. Ambient neutrons were likewise surveyed in other deep underground labs around the globe in an attempt to contribute to the hosted experiments [23, 24, 25, 26, 27, 28, 29, 30, 31, 32, 33].
The results on ambient neutron fluxes at LNGS vary considerably, as they highly depend on the uranium and thorium content, and the water level of the surrounding rock and concrete [12]. In fact, it was previously shown that due to the different compositions, the rock in Hall C produces 10 times more neutrons than that in Hall A [1]. Hitherto, the neutrons were measured at various locations with [4, 6, 10, 12, 14] and [7] counters, liquid scintillators doped with [5] and [15], undoped liquid scintillator cells interleaved by sheets [9], [11] and [13] crystal scintillators, and a neutron converter based on solution [8]. Not only the different measurement locations but also the different detection systems with idiosyncratic systematics make it difficult to reconcile between the measurement results [12]. Detectors also covered different neutron energy ranges. For instance, the best spectrum so far was achieved with the Gd-loaded liquid scintillator (1.2 ton) embedded in the LVD experiment [34]; however, with a high energy threshold of [15].
In order to monitor the neutron fluxes in different experimental halls and to make the direct comparison between these measurements much easier, a mobile neutron spectrometer would be a valuable asset for the scientific infrastructure of the LNGS. The design of such portable neutron counter must meet the following minimum requirements:
-
•
Given the low neutron fluxes at level, the detector should have an effective area of 0.1-1 to accumulate enough statistics within a couple of months of running, while the design should be kept as simple as possible for transportation and maintenance purposes.
-
•
Since the gamma fluxes are about 5 orders of magnitude bigger than the neutron fluxes [11], an excellent gamma discrimination is mandatory.
-
•
As per environmental considerations by local authorities, the liquid scintillators are not currently permitted at LNGS.
Bonner Sphere Spectrometers (BSS) [35] have been widely used to measure the neutron fluxes and energy spectra in deep underground laboratories [7, 27, 33, 30, 28, 32]. In this method, a set of thermal neutron detectors (typically gaseous or counters) are placed at the centre of moderating spheres of different radii. Each sphere is sensitive to a particular neutron energy range. The neutron energies are not measured directly. Rather, the incident neutron spectrum is inferred from the individual count rates in each sphere upon an unfolding process. Despite good gamma discrimination and large energy range from thermal to GeV scale, the system provides poor energy resolution and may be susceptible to significant uncertainties as a result of sophisticated spectral unfolding [36]. A detection scheme that enables event-by-event neutron energy reconstruction may overcome these drawbacks, thus being preferred over BSS for the portable neutron detector project.
While BSS use passive moderators, capture-gated neutron spectrometers [37, 38, 39, 40] employ active moderators in conjunction with thermal neutron capture agents. This technique allows neutrons to be recorded thanks to the coincidence between the neutron capture signal and the neutron-induced proton recoil signals in the active medium. The sum energy of the proton recoils that precede the capture signal, in principle, adds up to the incoming neutron energy; hence event-by-event neutron energy reconstruction can be realized. Since liquid scintillators are not a viable option at LNGS, plastic scintillators as an active medium in the mobile neutron counter become an apparent choice. Segmented capture-gated neutron spectrometers, combining plastic scintillators with proportional counters, were already developed to operate in underground laboratories [41, 42], representing a candidate detection scheme for this particular project. However, such hybrid detector design is not favorable due to the detector complexity and large size.
Table 1 summarizes various properties of common neutron capture agents that can be utilized in combination with plastic scintillators. Development of lithium-loaded plastic scintillators has recently been an active area of research [43, 44, 45, 46, 47]. To the best of our knowledge, commercial production has not been launched to date. Plastic scintillator-based capture-gated neutron spectrometers incorporating scintillators [48, 49] and -enriched glasses [50, 51] have been previously demonstrated. Neutron capture pulses generated in the -doped medium generally have longer tails than the background pulses produced via Compton scattering of gamma rays in the plastic scintillator. Thus, the neutron identification is accomplished by an offline pulse shape discrimination analysis. A big drawback of this approach is that as the background rate induced by the ambient gamma radiation is many orders of magnitude larger than the neutron-induced signal rate at LNGS, the data acquisition system would experience a heavy load during months-long measurement campaigns.
| Isotope | Natural Abundance (%) | Reaction | (b) |
|---|---|---|---|
| 7.5 | 940 | ||
| 19.8 | (93.7%) | 3840 | |
| 12.2 | 20600 | ||
| 14.8 | 60900 | ||
| 15.6 | 254000 |
Capture-gated neutron spectroscopy based upon commercially available boron-loaded plastic scintillators is a well-established concept [37, 38, 52]. The heavy capture products ( and ) induce electron-equivalent () scintillation [37], which is localized. Additionally, could be fully absorbed depending on the total scintillator size, leading to a maximum possible capture signal at . Unfortunately, the ambient gamma field at LNGS, extending up to [11], would outweigh the capture signals in rate, hampering pristine neutron identification. Aside from that, a boron-loaded plastic scintillator batch of the size of our interest is prohibitively expensive. An alternative boron-based design would involve combining unloaded plastic scintillators with gaseous boron trifluoride () thermal neutron detectors. However, we already abandoned this hybrid scheme due to the reasons stated above.
Two isotopes, and , with very large neutron capture cross sections make gadolinium highly attractive. Despite the fact that plastic scintillator technologies with Gd-loading were explored by various groups [53, 54, 55], Gd-doped plastic scintillators are yet to be commercialized. A novel type of Gd-based capture-gated neutron detector was previously demonstrated [56, 57, 58], in which blocks of undoped plastic scintillators were interleaved with gadolinium sheets. The cascade of 3-4 post-capture -rays whose energy sum is and for and captures, respectively leaves energy deposit in the scintillator above the gamma background level with an efficiency that increases with size. This enables neutron capture events to be distinguished on a quasi-background-free basis with a sufficiently large detector at LNGS. Furthermore, since the high light yield and the transparency of the plastic scintillators are not compromised by Gd-loading, the proton recoils preceding the capture signal can be reconstructed more accurately, hence better neutron energy resolution. As we will show later, this detection scheme fulfills the main requirements of the project. Alternatively, cadmium could be chosen instead of gadolinium, as presented in Ref. [59]. However, the use of cadmium was avoided due to its toxicity.
2 Design
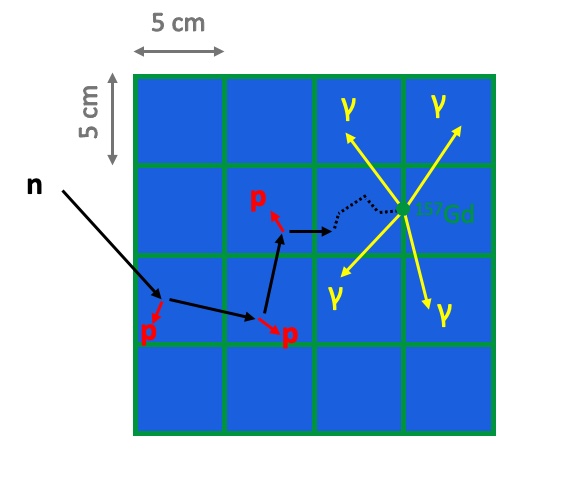
The detection principle of the LNGS mobile neutron spectrometer is illustrated in Figure 1. The detector essentially consists of a stack of plastic scintillator bars. The four sides of each bar are covered by thin Gd foils to enhance the neutron detection sensitivity. A fast neutron loses energy through proton recoils in the scintillator bars. Following the thermalization, the neutron is captured in the Gd foil, resulting in emission of multiple high energy gamma rays. Since the most energetic gamma line present in the natural radioactivity of the LNGS cavern is at ( decay in the series), an energy deposit above this level would be identified as a neutron capture signal with a negligible background. The capture of a fast neutron would also reveal that the neutron lost essentially all of its energy in the scintillator bars. Therefore, the neutron energy can be reconstructed based on prior proton recoil signals. Time correlation between delayed capture and preceding recoil interactions establishes a ground to remove the uncorrelated background pulses imitating proton recoils. Additionally, the capture of ambient thermal neutrons on the support structure and gamma shield is possible and the resulting high energy -rays will be detected by the system as well. However, thermal neutron capture signals will not be preceded by time-correlated proton recoils.
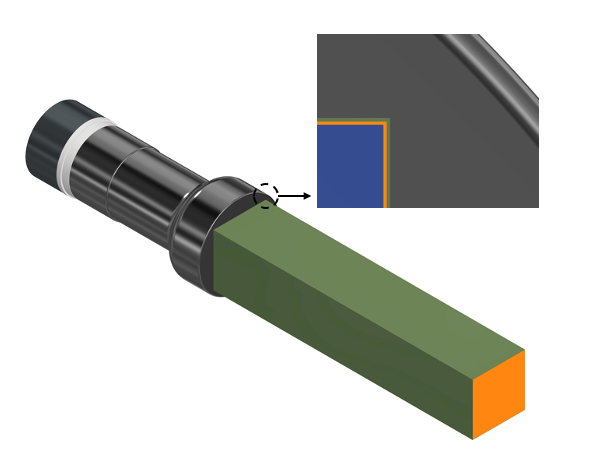
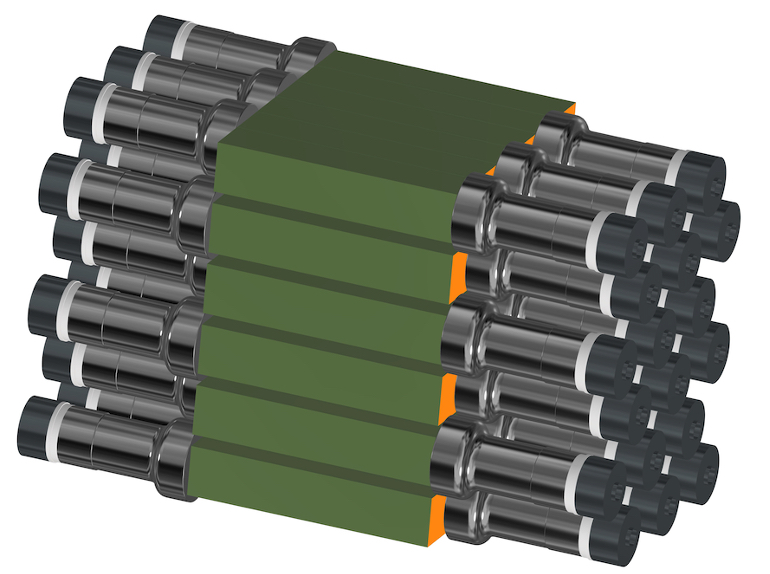
Since Gd-loading dictates a segmented structure, the detector can be composed of independent detector segments. Figure 2 (left) portrays a single detector module, which essentially consists of a 3-inch photomultiplier tube (PMT) and a plastic scintillator bar of dimensions 5 cm x 5 cm x 25 cm. The PMT is of 9302B series, manufactured by ET Enterprises Limited [60] using ultra-low background glass. The PMTs are equipped with mu-metal shields against Earth’s magnetic field. The plastic scintillator is of EJ-200 type fabricated by Eljen Technology [61]. To improve the light collection, the scintillator is wrapped by 3M ESR (Enhanced Specular Reflector) [62] film on all sides not facing the PMT. The scintillator is glued to the PMT window by a thin layer of optical cement (EJ-500 by Eljen Technology) to accomplish optical coupling and mechanical stability. Finally, the reflector layer is covered by 100 m thick Gd foils on all four lateral sides. These foils are 5 cm by 25 cm in size and supplied by Stanford Advanced Materials [63]. The production process of Gd foils encompasses several stages, namely, melting, purification, ingot casting, extrusion, rolling, and surface treatment, by which 99.9% purity (in weight) is attained. The mobile neutron spectrometer is made of 36 identical detector modules in 6 x 6 arrangement as shown in Figure 2 (right). Note that all modules are individually wrapped by thin black foils, not displayed in the figure, in order to ensure light-tightness. The rows in the scintillator array are separated by a vertical gap of 1.2 cm, whereas there is no horizontal gap between the scintillators within each row. For every pair of neighboring detector modules, no two PMTs are situated on the same side of the scintillator array. Considering that the PMT window (3 inch diameter) has larger area than the scintillator face (5 cm x 5 cm), this detector layout achieves the best possible compactness. In addition, the detector architecture includes a gamma shield, which will be discussed in Section 3.1.
2.1 Determination of detector segmentation and segment size
There are major design constraints to impose for practical as well as physical reasons. First of all, the number of PMT channels should be reasonably small, in fact not greater than 40, which allows to use the existing data acquisition (DAQ) board provided by the Institute for Data Processing and Electronics at Karlsruhe Institute of Technology (KIT) for this project. The details regarding the DAQ system will be presented in Section 4. Secondly, light guides are avoided because of adding complexity and extra dead material to the detector, and attenuating the signal size. Thirdly, the light collection within a detector segment should be fairly uniform, i.e., no significant position dependence to ensure good energy resolution. Finally, the detector should have an adequate size (surface area of 0.5 ) and a decent neutron efficiency (3 %) to record at least 10 neutrons (fast) per day at LNGS, if a total neutron flux of is assumed.
The uniform light collection without the aid of light guides can be achieved using transparent but not too long plastic scintillator bars. If the scintillator slabs are short enough to ensure the homogeneous light collection, then one PMT per plastic bar is sufficient. Given the number of channels in the DAQ board, the detector can comprise up to 40 scintillator-PMT pairs. The scintillators can be a cylinder or a cuboid. Based on previous applications and good practice, cuboid plastic scintillators were preferred despite that the coupling between a PMT and a cylindrical bar appears much simpler222Optical simulations show that a cylindrical scintillator results in larger light collection efficiency on average yet larger positional variations than a cuboid scintillator of similar size. . Furthermore, discarding the light guide-based approach requires that for uniform light detection there must be no optically-decoupled spot on the scintillator-PMT interface. Thus, the PMT window size is a natural guide to the transverse dimensions of the scintillator bars. The typical PMT choices are 2- and 3-inch diameter ones and they can cover the entire scintillator cross-sections of 3.5 cm x 3.5 cm and 5 cm x 5 cm, respectively.
A scintillator size of 30 cm x 30 cm x 25 cm (surface area of 0.48 ) was deemed adequately large for the neutron flux measurements and picked as a starting point to explore detector segmentation. The scintillator volume could be cut into segments of size of 3.5 cm x 3.5 cm x 25 cm if 2-inch PMTs were used. This would require more than 40 channels in the DAQ board, which can not be accommodated. In the scenario of 3-inch PMTs, the same volume could be divided into 36 segments with the dimensions of 5 cm x 5 cm x 25 cm, satisfying the channel requirement. The choices for the PMT window size as well as the transverse dimensions of the scintillator segments were then made right away.
Although the segment cross-section was determined, the segments could also be assembled from smaller segments, also wrapped by reflector and Gd foils, to enhance the Gd-loading, hence the neutron efficiency. However, the more pixels the segments have, the more the light collection uniformity degrades and the worse the energy resolution becomes. In order to examine the impact of the design parameters on the light collection uniformity, Geant4 [64] simulation toolkit, version 10.06.p02, was utilized.
Two mini-segmentation cases as well as that of no mini-segmentation were considered to simulate the light collection within a detector module. Given the benchmark segment size of 5 cm x 5 cm x 25 cm, the dimensions of the mini-segments were x x 25 cm, where the width, , was set to 1.25 cm, 2.5 cm and 5 cm, corresponding to 4 by 4 and 2 by 2 mini-segmentation, and no mini-segmentation, respectively. Each mini-segment was covered by a reflector layer on all sides except the front end. The scintillator faces and the PMT window were coupled by 125 m thick optical glue. A tiny air gap was placed between scintillator and reflector to bolster total internal reflections. Gadolinium foils do not bear an impact on the optical response, so they were ignored in the geometry for this study. Table 2 summarizes the detector components and their optical properties used in the light collection simulations. No wavelength dependence was assumed for the optical parameters presented therein.
| Component | Refractive Index | Absorption Length (cm) | Reflectivity |
|---|---|---|---|
| EJ-200 Plastic Scintillator | 1.58 | 380 | |
| PMT Borosilicate Glass | 1.49 | ||
| EJ-500 Optical Cement | 1.57 | 1.65 | |
| Enhanced Specular Reflector | 0.95 |
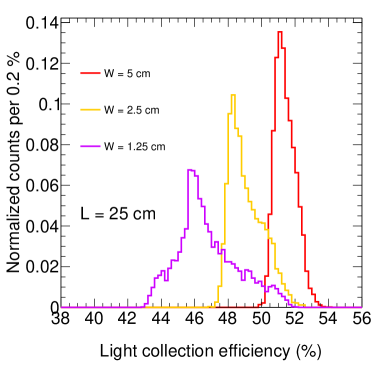
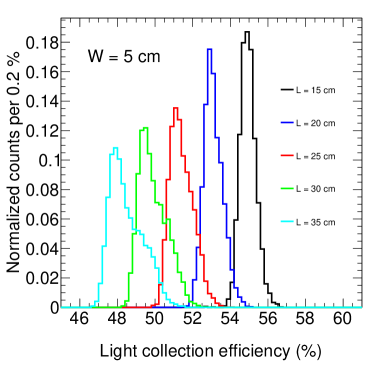
To compute the position-dependent light collection efficiency (LCE), photons were uniformly generated over the scintillator module, which was then divided into cells of 0.5 cm x 0.5 cm x 0.5 cm. About 25000 photons were originated from each cell. The light collection efficiency here is defined as the ratio of the number of photons hitting the PMT photocathode (right behind the PMT window) to the total number photons generated in a cell. Note that the photocathode has an active diameter of 70 mm. Figure 3 (left) shows the light collection efficiency distribution of the cells for the three segmentation scenarios given the length of the scintillator module, cm. As expected, the case without mini-segmentation ( cm) is the most optically favorable option. The LCE distribution for cm and cm has a mean of 51.43% and a standard deviation of 0.62%. Furthermore, the impact of the scintillator length on LCE was analyzed. Although shorter modules are optically more favorable, they produce smaller neutron efficiencies, as the efficiency is proportional to the detector size, i.e., less likely for post-capture -rays to escape without energy deposit. By the same token, the ambient gamma background rate also scales with the module length. In Figure 3 (right), the LCE distributions of the modules with various lengths are compared given the width of 5 cm. The LCE distributions for cm and cm possess mean values of 49.91% and 48.50% and standard deviations of 0.74% and 0.88%, respectively. Considering the trade-off between LCE, neutron efficiency and gamma background rate, a cautious choice of cm and cm was made for the segment size. In Section 2.2, it will be established that this design provides sufficient neutron detection efficiency.
2.2 Determination of gadolinium foil thickness
The effect of the gadolinium foil thickness on the neutron detection performance was investigated within the same Geant4 framework as in Section 2.1. The reference hadronic physics list, QGSP_BIC_HP, was selected for the neutron simulations, which includes the high-precision transport model of neutrons with energies below based on evaluated neutron data libraries. At thermal energies, the neutron wavelength becomes comparable to the inter-atomic distances of the hydrogenous medium, complicating the neutron scattering as a result of molecular effects [66]. In order for a more accurate modelling of thermal neutron-hydrogen interactions (<) in the plastic scintillator, G4NeutronHPThermalScattering library was also implemented, using the available evaluated thermal neutron scattering data for polyethylene as a proxy material.
Thanks to the initiative of the neutrino physics community, it has been widely known that Geant4’s modelling of the Gd gamma cascade following the neutron capture has shortcomings [67]. Since many of the post-capture -rays escape the detector due to its small size, a correct description of the Gd deexcitation cascade in simulations (i.e., individual gamma spectrum and gamma multiplicity) is essential for an accurate computation of the expected neutron efficiency. An improved Geant4-based Gd(n, ) model developed by the LZ dark matter experiment was employed in neutron simulations [68, 69].
In simulations, neutrons were launched uniformly in all directions from the surface of a sphere with a radius of 90 cm. The center of the sphere coincides with that of the full detector assembly shown in Figure 2 (right). Neutrons follow the standardized energy distribution of a bare source [70] with a low energy cut-off at . The spectral shape above this energy is a good approximation for that of the LNGS ambient neutrons calculated in Ref. [1]. Three Gd-foil thicknesses were investigated, namely 10, 30 and . 100 million neutrons were generated for each thickness configuration.
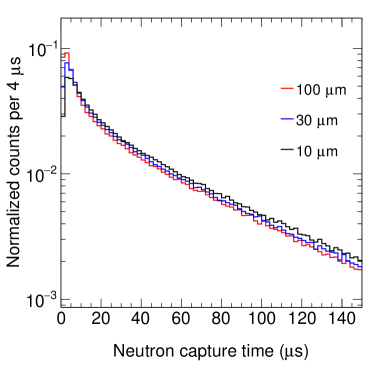
The neutron capture time profiles of the detector setups with different Gd foil thicknesses are presented in Figure 4 (left). The capture time distributions are essentially very much alike except that more prompt captures take place with increasing thickness. Ultimately, thickness is already sufficient to capture almost all thermal neutrons reaching the Gd layer given of mean free path of the thermal neutrons in Gd. However, Gd isotopes also have appreciable capture cross sections above thermal energies. As the thickness increases, more neutrons are captured rapidly prior to the thermalization. These instant captures may pose a challenge for the detector electronics, since the proton recoil and neutron capture signals are not well-separated. Thus, we required the capture time to be greater than as a conservative measure in our analysis. Furthermore, about 88% and 95% of the captures occur within and , respectively. The upper end of the coincidence window was then set to in order to detect the most of the captures, while minimizing the gamma accidentals.
Figure 4 (right) shows the neutron detection efficiencies for three detector configurations. The efficiency here was defined as the probability of a neutron entering the active detector volume from any direction to be captured by Gd foils within 1 to after its generation and then to induce gamma energy deposits, whose sum is above the selected threshold energy. The efficiency curves are almost identical at 30 and , whereas the efficiencies are slightly lower when thick foils are used. Since thinner Gd foils are more complicated to fabricate, hence more expensive, thick foils were selected considering all three thicknesses resulted in similar performances.
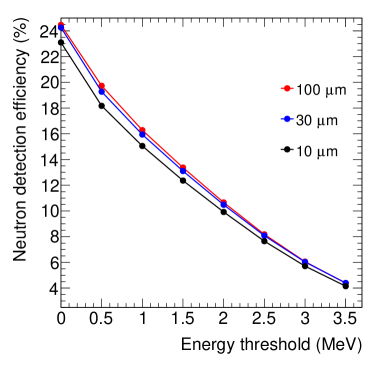
The highest -line originating from the natural radioactivity at the LNGS cavern walls is at . Therefore, the energy threshold to tag the Gd capture must be above this value in order to distinguish Gd capture -rays. The exact threshold value depends on energy resolution, which will be discussed in Section 3. However, it can be inferred from Figure 4 (right) that the neutron efficiency is expected to be bigger than the minimum requirement of 3%. Note that the fractions of neutron capture events on gadolinium, hydrogen and carbon are 82.8%, 16.9% and 0.3%, respectively, in the active medium of the detector. The captures on hydrogen were excluded in the analyses, since hydrogen capture events produce single -rays, which would eventually be vetoed by the energy threshold cut.
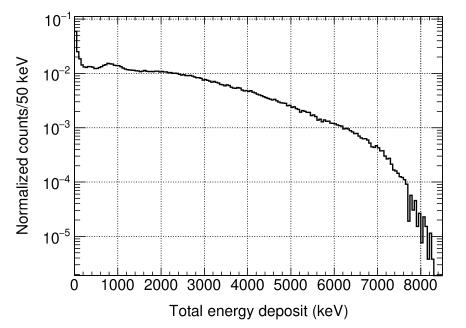
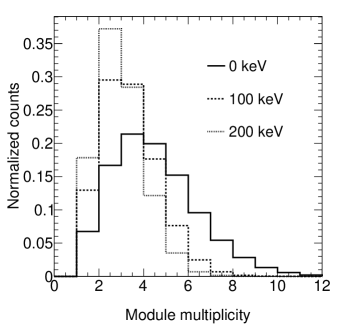
Finally, we investigated the energy sum and hit multiplicity distributions of the Gd(n, ) events in order to further our understanding. The dataset simulated with thick foils was used for this purpose. Figure 5 (left) illustrates the spectrum of the energy deposits summed over all detector modules. Since the capture -rays are not entirely contained in the detector, the spectrum is rather featureless and ends at about . Figure 5 (right) shows the distributions of the number of modules that are hit by the -rays for the events, where the total energy deposition is at least . The distributions were drawn for several energy thresholds required per module. When all modules with non-zero energy sum are counted, the average hit multiplicity is 3.98.
3 Simulated detector response
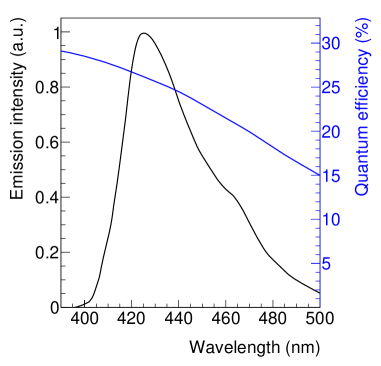
The simulation of the complete detector response to gammas and neutrons was carried out by turning on scintillation and quantum efficiency processes in plastic scintillators and PMTs, respectively. Besides the optical parameters described in Table 2, the electron scintillation yield was set to 10000 photons/MeV as per the product specifications and the proton scintillation yield was taken from Ref. [71]. Figure 6 illustrates the emission spectrum of the plastic scintillator as well as the PMT quantum efficiency (QE) as a function of the scintillation wavelength. The effective QE averaged over the scintillation spectrum is about 24%. Combining it with the mean LCE of 51.43% and the electron scintillation yield, an energy scale factor of 1.234 photoelectrons/keV was derived. This conversion factor was used to obtain electron-equivalent reconstructed energy of an event after counting the number of photoelectrons over all detector modules.
3.1 Suppression of gamma-induced background
The high ambient gamma flux at LNGS is a potential source of accidental coincidences mimicking proton recoils and neutron capture pulses in the detector. An environmental -ray will be misidentified as a real proton recoil pulse if it randomly leaks into the coincidence time window. To reduce accidental -events preceding a proper capture pulse, applying a high energy threshold on the prompt signal (proton recoil) is not appropriate. Plastic scintillators yield quenched light output for proton recoils [72]. In EJ-200, 2.6 signal is produced if a neutron deposits all its energy in a single scatter [42]. Implementing a high energy cut on the proton recoil pulse similar to that on the capture pulse would render the detector completely insensitive to < neutrons. Therefore, a gamma shield should be put in place in order to reduce the probability of accidental gammas mimicking a proton recoil pulse.
In order to assess the impact of the shield, a series of gamma background simulations was performed. The shield, fully encapsulating the detector, was modelled as a hollow box with varying thicknesses. The inner dimensions of the shield are 36.2 cm x 41.2 cm x 59 cm. Lead was chosen as a shielding material. The environmental gamma flux at LNGS was measured by various groups at different lab locations [11, 73, 74, 75, 76]. The flux numbers range from 0.15 to 1 . Conservatively, 1 was assumed for the gamma rate estimation. The measured gamma spectrum in Ref. [73, 74], which extends up to , was fed into the Geant4 particle generator. Taking a similar approach as in Section 2.2, the gamma particles were generated isotropically from the surface of a sphere with a radius of 90 cm. The energy of an event was reconstructed from the total number of photoelectrons as aforementioned. The gamma rates as a function of the shield thickness were then derived.
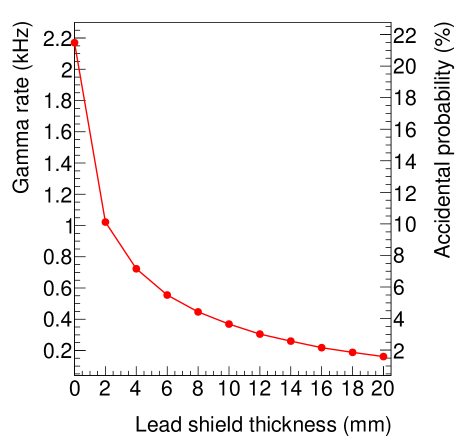
Figure 7 shows the rate of ambient gamma events leaving more than a total of energy deposit in the whole detector as a function of the lead shield thickness. The chosen value of for the threshold was driven by the response of the EJ-200 scintillator to neutrons, corresponding to the start point energy of the simulated neutron spectrum in Section 2.2. A neutron induces on average a proton recoil of energy during a single scatter. A proton recoil of that energy produces slightly above 50 scintillation in the plastic [71]. Since neutrons undergo multiple elastic collisions before the capture, it can be anticipated that neutrons will induce a total of at least 50 energy in proton recoils most of the time. Therefore, only the ambient gamma events with more than energy deposit, now a well-motivated design threshold, could then fake the proton recoils in our setup. Note that this threshold energy is equivalent to 60 detected photoelectrons, clearly not a weak signal. In the real application, however, this threshold may be revised and slightly increased depending on noise terms originating from the data acquisition system. Figure 7 indicates that the accidental probability within the coincidence capture time window of [1-100] s can be kept below 5% with a 6 mm thick lead shield. Note that the thicknesses above were not considered due to the heavy weight compromising the mobility of the system.
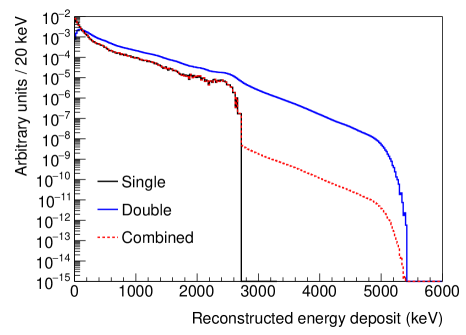
External -rays can also induce a neutron capture signal. In principle, these fake capture pulses can be very efficiently eliminated with an appropriate energy cut given that the flux of the environmental -rays with energies above is suppressed by five orders of magnitude with respect to that of -rays from decays in the cavern walls [73]. However, two gamma rays that randomly enter the detector at about the same time may produce coincidentally summed events [77]. These 2-fold pile-up events result in pulses with energies extending up to , which can not be removed trivially. This pile-up effect was exploited to estimate the high energy background for the capture pulses and to devise shielding against the spurious capture events of pile-up origin.
To incorporate the effect of the pile-up in the background gamma spectrum, a simple model presented in Ref. [78] was followed. Suppose represents the probability density function (PDF) of the no-pile-up (single) spectrum. Then, the PDF of the pile-up (double) spectrum, , will just be the convolution of the two single PDFs:
| (3.1) |
Then, the combined PDF will read as:
| (3.2) |
where is the pile-up probability. It is equal to the single rate () times the pile-up time window (). A typical PMT pulse is a few tens of nanoseconds wide. However, the raw PMT pulses need to be stretched due to the characteristics of the data acquisition system (see Section 4). The stretched pulses will not be wider than as a design criterion. Thus, was set to as the pile-up time window for the high energy background estimation. Since , pile-up at higher orders is negligible. Figure 8 provides an illustrative example on how pile-up induces background for our capture signals. It should be noted that thanks to the segmented detector layout, two random gammas hitting different detector segments are expected to be resolved within a much shorter window in reality than the assumed .
The impact of the lead shield on the pile-up-induced background was investigated as in what follows: First, the combined PDFs were derived for various lead shield thicknesses. Second, the PDFs were normalized to the total single rate in order to estimate high energy background at different thresholds. The high energy pulses alone do not mimic a fast neutron capture event, they have to be accompanied by a preceding accidental -ray. Thus, the rate of fake neutron captures owing to the pile-up was obtained after multiplying the high energy gamma rate by the accidental probability at a given lead thickness.
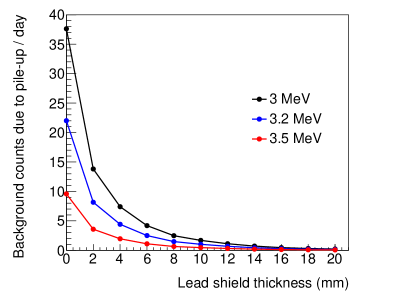
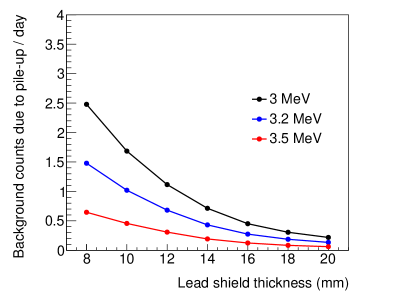
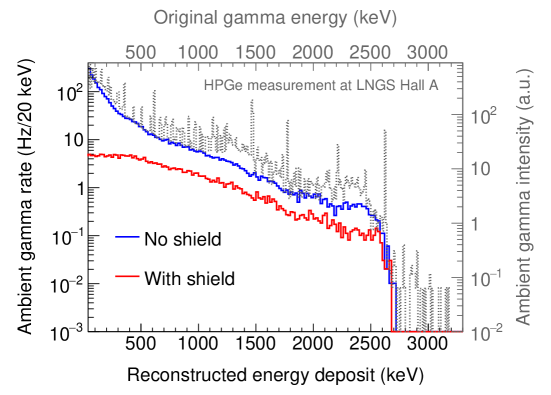
Figure 9 shows the rate of this background as a function of the lead shield thickness at three different high energy thresholds. The background rates become almost flat starting at 16 mm. At this thickness, 0.45 background events per day is expected at the threshold of , whereas the real fast neutron expectation is typically 10 events per day, as aforementioned. It can be argued that a thinner lead shield thickness may indeed be sufficient. However, it should be noted that our neutron detection efficiency is yet to be experimentally verified and that the neutron flux at LNGS is likely to vary significantly. The expected signal rates may turn out to be lower or higher. For this reason, the lead thickness was chosen to be 16 mm, which is rather conservative. Note that the accidental probability at this thickness is 2.16%. Figure 10 presents the expected background gamma spectra with and without the lead shield. The background gamma rate is suppressed by almost a factor of 15 with the lead shield.
3.2 Complete detector response to neutrons
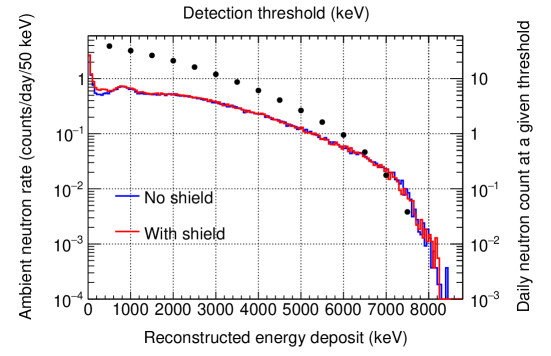
The full detector response to the fast neutrons was implemented by repeating the simulation steps described in Section 2.2 with the addition of the particle type-dependent (proton and electron) scintillation emission. The neutron flux for the full detector simulation was assumed to be . The number was based on a previous on-site measurement in Ref. [9] and corresponds to the flux of neutrons with energies between 1 and 10 MeV. In the neutron simulations, the neutron energies are sampled from the spectrum, which also has an artificial low-energy cut-off at 1 MeV (reason explained in Section 2.2) and an end point at 10 MeV. The simulated gamma spectra, following the neutron capture on Gd, are shown in Figure 11 for the unshielded and shielded detector configurations. The integrated neutron capture rate is about 12 neutrons per day at the capture threshold of . The shield does not affect the neutron detection efficiency. The rate of the neutron captures on lead leaving at least of energy deposit in the scintillator modules is 0.006 counts per day.
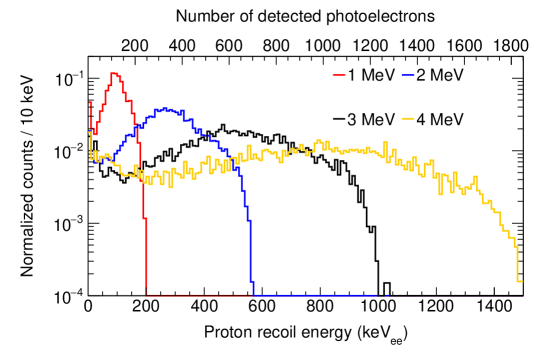
Capture signals of the fast neutrons will always be preceded by proton recoils. In order to examine our experimental sensitivity to the proton recoils, captures of 1, 2, 3 and neutrons were analyzed. Figure 12 shows the electron-equivalent energy distributions of the proton recoils of these neutrons. With a probability of 85%, neutrons produce recoil signals, whose sum energy is greater than the threshold of 50 . The same probability is about 95% for the other three neutron groups. Thus, operating the detector at the neutron energy threshold of seems quite feasible. As stated in Section 1, Ref. [15] reported ambient neutron measurement at LNGS with the best resolution up to date, albeit at a high neutron threshold of . By design, this neutron spectrometer has a promising potential to reduce the neutron threshold down to or even lower. Note that the unfolding of the proton recoil spectrum and the impact of the detector segmentation on the neutron energy reconstruction were not scrutinized here, as they are not within the scope of this report.
Lastly, thermal neutrons were studied as a background source. Thermal neutrons can also be captured in the detector. If the capture pulse is preceded by an accidental gamma within the capture time window, it would pose as a signal event. The thermal neutron flux numbers vary between 0.32 [12] and 5.3 [4] across the measurements. Assuming the largest flux value, the rate of thermal neutron captures on both gadolinium and lead, leaving at least of energy in the scintillator volume and being coincident with an accidental -ray, is 2.26 counts per day. In the real application, the sum rates of this background and pile-up-induced background will be determined from the sideband measurements (i.e., studying the events where the preceding pulse lies outside the chosen coincidence time window), as they are tied to random coincidences.
Muon-induced neutron activity is another critical background source for rare event searches at LNGS. In principle, the designed detector will be sensitive to neutrons of this origin as well. However, the flux of the muon-induced neutrons, heavily suppressed at these depths, is at least two orders of magnitude lower than that of radioactivity-induced neutrons, as stated previously in Section 1. The event rate will therefore be statistically insignificant. Moreover, the muon-induced neutron spectrum extends to several GeV [2]. The design was optimized to detect neutrons, hence only muon-induced neutrons within this energy region will be detected efficiently. Therefore, although we may occasionally observe a muon-induced neutron event, the proposed system is focused on the detection of radioactivity-induced neutron activity.
4 Data acquisition and mechanical setup
The data acquisition (DAQ) will be handled by the board that was previously built at KIT for the TRISTAN experiment [79]. The main board allows a digital readout of up to 40 channels thanks to the five 8-channel analog-to-digital converters (ADC) located on individual mezzanine boards. Each ADC board comes with an 8-channel programmable-gain amplifier and anti-alias filters. The PMT signals are digitized at a sampling frequency of 62.5 MHz (i.e., 16 ns of pulse sampling width). Since the typical PMT pulses are much faster, each raw pulse will be stretched via a low-pass circuit individually in order for a commensurate waveform sampling by the DAQ board. This front-end circuitry is currently being designed and the stretched pulses are expected be shorter than (See Section 3.1).
The trigger decision will be made based on the sum of the pulses from multiple detector modules that are hit simultaneously by the capture gamma rays. This master trigger will have a high threshold (3 ) to select neutron capture candidate events. Multiple modules, where the total energy deposition is greater than 3 , as well as a single module with 3 energy deposit can activate the master trigger. An event will be centered around the master trigger time and extend backward and forward. The Field Programmable Gate Array (FPGA) on the main board will be set up to look at all channels and find pulses above a certain threshold within the event window. This secondary threshold ensures that only waveform snippets that are significantly above the baseline are recorded. The coincidence time between the capture pulse and proton recoils is not a part of hardware trigger, but will be imposed during offline analysis. Note that the acquisition scheme will grant dead time-free readout. Additionally, the system will be capable of adopting an external trigger as master trigger.
Ideally, a fast neutron capture event will be triggered by the Gd(n, ) pulse passing the assumed threshold of 3 , and then preceding proton recoils with an energy sum of at least 50 will be identified in the pre-trigger window ( wide). However, that may not always be the case. For instance, a neutron, captured in the detector, may produce 3 proton recoils, which would trigger an event. In this case, the actual capture pulse would follow the trigger pulse and could be found in the post-trigger window (also wide). Thus, the event would be constructed in the correct order during offline analysis and the proton recoils would be selected (with no high-energy cut-off) if and only if the capture pulse passes the relevant threshold. Thanks to the pre- and post-trigger recording, we can maintain the sensitivity to the high energy tail of the neutron spectrum.
Concerning the mechanical setup, all system components will be loaded on a sturdy 2-tier utility cart on wheels. The bottom shelf will host the detector modules and the lead shield, whereas the DAQ board, the front-end circuit, the high voltage (HV) crate and the computer will be placed on the top shelf. The PMT and HV cables will be delivered from bottom floor to top floor. The design of the complete mechanical structure is ongoing.
5 Summary
We presented the design of a mobile neutron spectrometer for the LNGS underground laboratory. The detector consists of 36 independent modules arranged in a 6-by-6 array. In each module, a plastic scintillator bar, after being wrapped by reflector and gadolinium foils, is affixed to a 3-inch PMT via optical glue. The proton recoils prompted by the thermalization of a fast neutron in the scintillator gives a measure of the neutron’s initial energy. The high energy deposit following the capture of the thermalized neutron on gadolinium enables neutron tagging. The time coincidence between the capture signal and the preceding proton recoils lies at the core of the design, which provides an excellent background suppression. A further reduction in background originating from accidental gammas is accomplished by a thick lead shield. The detector construction is currently in progress.
We also studied the expected detector performance within the Geant4 simulation framework. The simulations indicate that the neutron threshold energy down to can be feasibly reached. Using a simulated neutron source with a clipped energy spectrum (1-10 MeV), the neutron detection efficiency was found to be 6 % at the capture gamma energy threshold of . We expect to detect about 12 neutrons per day, assuming an ambient neutron flux of .
Two background sources were thoroughly investigated, namely thermal neutrons and the pile-up of environmental gammas. Thermal neutrons will be captured on gadolinium sheets and the capture pulses can accidentally pair up with an ambient gamma, hence faking fast neutron capture events. Based on the largest thermal neutron flux number ever measured at LNGS, , we established that the upper limit for the thermal neutron-induced background rate would be 2.26 counts per day. Concerning the pile-up phenomenon, two random environmental gammas can quasi-simultaneously leave energy deposits in the detector and the summed pulse may be misidentified as a genuine capture pulse. Combined with an accidental gamma within the coincidence window, false neutron capture events may arise. Assuming an ambient gamma flux of 1 , the pile-up-induced background rate was conservatively estimated to be about 0.45 events per day at the capture signal threshold of . The rate of ambient gammas leaving at least energy deposit (assumed threshold for the preceding proton recoil signal) in the detector is 218 Hz. The probability of an ambient gamma faking a proton recoil within the coincidence time window is 2.16%.
Acknowledgments
We are grateful to LNGS for their cooperation and support throughout the entire project with special thanks to Alba Formicola and Axel Boeltzig. We acknowledge the financial support from the German Federal Ministry of Education and Research (BMBF) under the grant number 05A21VK1 and the Italian National Institute for Nuclear Physics (INFN). We also thank Axel Boeltzig for the comments on this manuscript.
References
- [1] H. Wulandari, J. Jochum, W. Rau and F. von Feilitzsch, Neutron flux at the Gran Sasso underground laboratory revisited, Astroparticle Physics 22 (2004) 313–322.
- [2] D. Mei and A. Hime, Muon-induced background study for underground laboratories, Phys. Rev. D 73 (2006) 053004, [astro-ph/0512125].
- [3] J. A. Formaggio and C. Martoff, Backgrounds to sensitive experiments underground, Annual Review of Nuclear and Particle Science 54 (2004) 361–412.
- [4] E. Bellotti, M. Buraschi, E. Fiorini and C. Liguori, New measurement of rock contaminations and neutron activity in the Gran Sasso tunnel, Tech. Rep. INFN/TC-85/19, Italian National Institute for Nuclear Physics (INFN) Milan Unit, 1985.
- [5] R. Aleksan et al., Measurement of fast neutrons in the Gran Sasso laboratory using a doped liquid scintillator, Nuclear Instruments and Methods in Physics Research Section A: Accelerators, Spectrometers, Detectors and Associated Equipment 274 (1989) 203–206.
- [6] A. Rindi, F. Celani, M. Lindozzi and S. Miozzi, Underground neutron flux measurement, Nuclear Instruments and Methods in Physics Research Section A: Accelerators, Spectrometers, Detectors and Associated Equipment 272 (1988) 871–874.
- [7] P. Belli et al., Deep underground neutron flux measurement with large counters, Il Nuovo Cimento A (1965-1970) 101 (1989) 959–966.
- [8] M. Cribier et al., Radiochemical measurement of fast neutrons using a aqueous solution, Nucl. Instrum. Meth. A 365 (1995) 533–541.
- [9] F. Arneodo et al., Neutron background measurements in the Hall C of the Gran Sasso Laboratory, Nuovo Cim. A 112 (1999) 819–831.
- [10] Z. Dębicki et al., Thermal neutrons at Gran Sasso, Nuclear Physics B - Proceedings Supplements 196 (2009) 429–432.
- [11] M. Haffke et al., Background measurements in the Gran Sasso Underground Laboratory, Nucl. Instrum. Meth. A 643 (2011) 36–41, [1101.5298].
- [12] A. Best et al., Low energy neutron background in deep underground laboratories, Nuclear Instruments and Methods in Physics Research Section A: Accelerators, Spectrometers, Detectors and Associated Equipment 812 (2016) 1–6.
- [13] A. Boeltzig et al., Improved background suppression for radiative capture reactions at LUNA with HPGe and BGO detectors, Journal of Physics G Nuclear Physics 45 (Feb., 2018) 025203.
- [14] Z. Dębicki et al., Neutron flux measurements in the Gran Sasso national laboratory and in the Slanic Prahova Salt Mine, Nuclear Instruments and Methods in Physics Research Section A: Accelerators, Spectrometers, Detectors and Associated Equipment 910 (2018) 133–138.
- [15] G. Bruno and W. Fulgione, Flux measurement of fast neutrons in the Gran Sasso underground laboratory, European Physical Journal C 79 (Sept., 2019) 747, [1905.05512].
- [16] H. Wulandari et al., Study on neutron induced background in the CRESST experiment, IAU Symp. 220 (2004) 491, [hep-ex/0310042].
- [17] I. Abt et al., A New Double Beta Decay Experiment at LNGS: Letter of Intent, hep-ex/0404039.
- [18] F. Bellini et al., Monte Carlo evaluation of the external gamma, neutron and muon induced background sources in the CUORE experiment, Astroparticle Physics 33 (2010) 169–174.
- [19] A. Wright, P. Mosteiro, B. Loer and F. Calaprice, A highly efficient neutron veto for dark matter experiments, Nuclear Instruments and Methods in Physics Research Section A: Accelerators, Spectrometers, Detectors and Associated Equipment 644 (2011) 18–26.
- [20] XENON100 collaboration, E. Aprile et al., The neutron background of the XENON100 dark matter search experiment, J. Phys. G 40 (2013) 115201, [1306.2303].
- [21] XENON1T collaboration, E. Aprile et al., Conceptual design and simulation of a water Cherenkov muon veto for the XENON1T experiment, JINST 9 (2014) P11006, [1406.2374].
- [22] CUORE collaboration, C. Alduino et al., The projected background for the CUORE experiment, Eur. Phys. J. C 77 (2017) 543, [1704.08970].
- [23] H. J. Kim et al., Measurement of the neutron flux in the CPL underground laboratory and simulation studies of neutron shielding for WIMP searches, Astropart. Phys. 20 (2004) 549–557.
- [24] UKDMC, ZEPLIN-II, ILIAS collaboration, V. A. Kudryavtsev, Neutron background in the Boulby Underground Laboratory, J. Phys. Conf. Ser. 120 (2008) 042028.
- [25] S. Rozov et al., Monitoring of the thermal neutron flux in the LSM underground laboratory, arXiv e-prints (Jan., 2010) arXiv:1001.4383, [1001.4383].
- [26] K. Eitel and the EDELWEISS collaboration, Measurements of neutron fluxes in the LSM underground laboratory, Journal of Physics: Conference Series 375 (jul, 2012) 012016.
- [27] H. Park, J. Kim, Y. Hwang and K.-O. Choi, Neutron spectrum at the underground laboratory for the ultra low background experiment, Applied Radiation and Isotopes 81 (2013) 302–306.
- [28] D. Jordan et al., Measurement of the neutron background at the Canfranc Underground Laboratory LSC, Astropart. Phys. 42 (2013) 1–6.
- [29] Z. Zeng, H. Gong, Q. Yue and J. Li, Thermal neutron background measurement in CJPL, Nuclear Instruments and Methods in Physics Research Section A: Accelerators, Spectrometers, Detectors and Associated Equipment 804 (2015) 108–112.
- [30] Q. Hu et al., Neutron background measurements at China Jinping underground laboratory with a Bonner Multi-sphere Spectrometer, Nucl. Instrum. Meth. A 859 (2017) 37–40, [1612.04054].
- [31] K. Mizukoshi et al., Measurement of ambient neutrons in an underground laboratory at the Kamioka Observatory, Progress of Theoretical and Experimental Physics 2018 (12, 2018) .
- [32] M. Grieger et al., Neutron flux and spectrum in the Dresden Felsenkeller underground facility studied by moderated counters, Phys. Rev. D 101 (Jun, 2020) 123027.
- [33] Y. S. Yoon, J. Kim and H. Park, Neutron background measurement for rare event search experiments in the YangYang underground laboratory, Astroparticle Physics 126 (2021) 102533.
- [34] M. Aglietta et al., The Most powerful scintillator supernovae detector: LVD, Nuovo Cim. A 105 (1992) 1793–1804.
- [35] R. L. Bramblett and T. Bonner, Neutron evaporation spectra from (p, n) reactions, Nuclear Physics 20 (1960) 395–407.
- [36] D. Thomas and A. Alevra, Bonner sphere spectrometers—a critical review, Nuclear Instruments and Methods in Physics Research Section A: Accelerators, Spectrometers, Detectors and Associated Equipment 476 (2002) 12–20.
- [37] W. Feldman, G. Auchampaugh and R. Byrd, A novel fast-neutron detector for space applications, Nuclear Instruments and Methods in Physics Research Section A: Accelerators, Spectrometers, Detectors and Associated Equipment 306 (1991) 350–365.
- [38] E. Kamykowski, Comparison of calculated and measured spectral response and intrinsic efficiency for a boron-loaded plastic neutron detector, Nuclear Instruments and Methods in Physics Research Section A: Accelerators, Spectrometers, Detectors and Associated Equipment 317 (1992) 559–566.
- [39] T. Aoyama, K. Honda, C. Mori, K. Kudo and N. Takeda, Energy response of a full-energy-absorption neutron spectrometer using boron-loaded liquid scintillator BC-523, Nuclear Instruments and Methods in Physics Research Section A: Accelerators, Spectrometers, Detectors and Associated Equipment 333 (1993) 492–501.
- [40] J. Abdurashitov et al., A high resolution, low background fast neutron spectrometer, Nuclear Instruments and Methods in Physics Research Section A: Accelerators, Spectrometers, Detectors and Associated Equipment 476 (2002) 318–321.
- [41] T. Langford et al., Fast neutron detection with a segmented spectrometer, Nuclear Instruments and Methods in Physics Research Section A: Accelerators, Spectrometers, Detectors and Associated Equipment 771 (2015) 78–87.
- [42] T. Langford, E. Beise, H. Breuer, C. Heimbach, G. Ji and J. Nico, Development and characterization of a high sensitivity segmented fast neutron spectrometer (FaNS-2), Journal of Instrumentation 11 (jan, 2016) P01006.
- [43] N. Zaitseva et al., Pulse shape discrimination with lithium-containing organic scintillators, Nuclear Instruments and Methods in Physics Research Section A: Accelerators, Spectrometers, Detectors and Associated Equipment 729 (2013) 747–754.
- [44] R. Breukers, C. Bartle and A. Edgar, Transparent lithium loaded plastic scintillators for thermal neutron detection, Nuclear Instruments and Methods in Physics Research Section A: Accelerators, Spectrometers, Detectors and Associated Equipment 701 (2013) 58–61.
- [45] N. J. Cherepy et al., Bismuth- and lithium-loaded plastic scintillators for gamma and neutron detection, Nuclear Instruments and Methods in Physics Research Section A: Accelerators, Spectrometers, Detectors and Associated Equipment 778 (2015) 126–132.
- [46] E. Mark Ellis, C. Hurlbut, C. Allwork and B. Morris, Neutron and gamma ray pulse shape discrimination with EJ-270 lithium-loaded plastic scintillator, in 2017 IEEE Nuclear Science Symposium and Medical Imaging Conference (NSS/MIC), pp. 1–5, 2017. DOI.
- [47] I. B. Nemchenok, I. I. Kamnev, E. A. Shevchik and I. A. Suslov, Lithium-loaded plastic scintillators for the detection of thermal neutrons, Bulletin of the Russian Academy of Sciences: Physics 85 (2021) 476–479.
- [48] V. N. Potapov et al., A combined spectrometric detector of fast neutrons, Instruments and Experimental Techniques 58 (2015) 329–336.
- [49] K. Wilhelm, J. Nattress and I. Jovanovic, Development and operation of a :ZnS(Ag)—scintillating plastic capture-gated detector, Nuclear Instruments and Methods in Physics Research Section A: Accelerators, Spectrometers, Detectors and Associated Equipment 842 (2017) 54–61.
- [50] J. Bart Czirr and G. L. Jensen, A compact neutron coincidence spectrometer, its measured response functions and potential applications, Nuclear Instruments and Methods in Physics Research Section A: Accelerators, Spectrometers, Detectors and Associated Equipment 349 (1994) 532–539.
- [51] J. Nattress, M. Mayer, A. Foster, A. Barhoumi Meddeb, C. Trivelpiece, Z. Ounaies et al., Capture-gated spectroscopic measurements of monoenergetic neutrons with a composite scintillation detector, IEEE Transactions on Nuclear Science 63 (2016) 1227–1235.
- [52] P. Holm, K. Peräjärvi, S. Ristkari, T. Siiskonen and H. Toivonen, A capture-gated neutron spectrometer for characterization of neutron sources and their shields, Nuclear Instruments and Methods in Physics Research Section A: Accelerators, Spectrometers, Detectors and Associated Equipment 751 (2014) 48–54.
- [53] L. Ovechkina, K. Riley, S. Miller, Z. Bell and V. Nagarkar, Gadolinium loaded plastic scintillators for high efficiency neutron detection, Physics Procedia 2 (2009) 161–170.
- [54] J. Dumazert, R. Coulon, M. Hamel, F. Carrel, F. Sguerra, S. Normand et al., Gadolinium-loaded plastic scintillators for thermal neutron detection using compensation, IEEE Transactions on Nuclear Science 63 (2016) 1551–1564.
- [55] D. M. Poehlmann, D. Barker, H. Chagani, P. Cushman, G. Heuermann, A. Medved et al., Characterization of Gadolinium-loaded Plastic Scintillator for Use as a Neutron Veto, 1812.11267.
- [56] I. PaweŁczak, J. Tõke, E. Henry, M. Quinlan, H. Singh and W. Schröder, Nstar—a capture gated plastic neutron detector, Nuclear Instruments and Methods in Physics Research Section A: Accelerators, Spectrometers, Detectors and Associated Equipment 629 (2011) 230–238.
- [57] Y. Kuroda et al., A mobile antineutrino detector with plastic scintillators, Nuclear Instruments and Methods in Physics Research Section A: Accelerators, Spectrometers, Detectors and Associated Equipment 690 (2012) 41–47.
- [58] D. Mulmule et al., A plastic scintillator array for reactor based anti-neutrino studies, Nuclear Instruments and Methods in Physics Research Section A: Accelerators, Spectrometers, Detectors and Associated Equipment 911 (2018) 104–114.
- [59] Y. Liu, Y.-G. Yang, Y. Tai and Z. Zhang, A capture-gated fast neutron detection method*, Chinese Physics C 40 (jul, 2016) 076201.
- [60] ET Enterprises Limited. https://et-enterprises.com.
- [61] Eljen Technology. https://eljentechnology.com.
- [62] 3M™. https://www.3m.com.
- [63] Stanford Advanced Materials. https://www.samaterials.com.
- [64] GEANT4 collaboration, S. Agostinelli et al., GEANT4–a simulation toolkit, Nucl. Instrum. Meth. A 506 (2003) 250–303.
- [65] J. A. Green, A. L. Guckes, J. R. Tinsley and B. J. Baldonado, Gamma Array Simulation Toolkit for Modeling the NDSE Gamma Ray Detector Wall, Tech. Rep. DOE/NV/03624-1339, Nevada National Security Site (NNSS), 2022.
- [66] L. Thulliez, C. Jouanne and E. Dumonteil, Improvement of Geant4 Neutron-HP package: From methodology to evaluated nuclear data library, Nucl. Instrum. Meth. A 1027 (2022) 166187, [2109.05967].
- [67] Generic liquid-scintillator anti-neutrino detector Geant4 simulation (GLG4sim), “Additional Gadolinium Support for GLG4sim.” https://www.phys.ksu.edu/personal/gahs/GLG4sim/Gd.html, 2006.
- [68] LZ collaboration, D. S. Akerib et al., Projected WIMP sensitivity of the LUX-ZEPLIN dark matter experiment, Phys. Rev. D 101 (2020) 052002, [1802.06039].
- [69] M. Solmaz, Search for annual and diurnal modulations in the LUX experiment and assembling a tagged neutron source for the LZ Outer Detector. PhD thesis, UC, Santa Barbara (main), 2020.
- [70] R. Weinmann-Smith, S. Croft, M. T. Swinhoe and A. Enqvist, Changes to the neutron spectrum caused by source encapsulation, ESARDA Bulletin (2017) 44–53.
- [71] T. A. Laplace et al., Low Energy Light Yield of Fast Plastic Scintillators, Nucl. Instrum. Meth. A 954 (2020) 161444, [2009.07217].
- [72] J. Birks, The Theory and Practice of Scintillation Counting. Pergamon, 1964.
- [73] F. Bellini et al., Monte Carlo evaluation of the external gamma, neutron and muon induced background sources in the CUORE experiment, Astropart. Phys. 33 (2010) 169–174, [0912.0452].
- [74] C. Bucci et al., Background study and Monte Carlo simulations for large-mass bolometers, The European Physical Journal A 41 (2009) 155–168.
- [75] C. Arpesella, Background measurements at Gran Sasso Laboratory, Nuclear Physics B - Proceedings Supplements 28 (1992) 420–424.
- [76] D. Malczewski, J. Kisiel and J. Dorda, Gamma background measurements in the Gran Sasso National Laboratory, Journal of Radioanalytical and Nuclear Chemistry 295 (2013) 749–754.
- [77] D. Bemmerer et al., Feasibility of low energy radiative capture experiments at the LUNA underground accelerator facility, Eur. Phys. J. A 24 (2005) 313–319, [nucl-ex/0502007].
- [78] T. Ahsan, C. Swanson, T. Qian, T. Rubin and S. Cohen, “The pulse-pile-up tail artifact in pulse-height spectra.” Unpublished manuscript available on webpage at https://w3.pppl.gov/ppst/docs/ahsan.pdf, July, 2021.
- [79] TRISTAN group, “Conceptual design report: KATRIN with TRISTAN modules.” https://www.katrin.kit.edu/downloads/TRISTAN__Technical_Design_Report%20(10).pdf, 2021.