Detecting the sensitive spots of the African interurban transport network
Abstract
Transport systems are vulnerable to events that create disruptions. This situation is particularly sensitive in parts of Africa with a low density of highways and an increasing level of violence. Here, we measure the risk of the African transport network based on two separate indices: the intensity of future events and the impact of one event on the flow that travels through the network. To estimate the intensity of future events happening in city , we construct a self-exciting point process. To estimate the impact of an event, we consider a network of all highways in the continent and a modelled flow between any pair of cities. Based on both indicators, we construct the diagram and classify cities based on their combined impact and intensity. Results show that certain cities in the network have a high risk and increase the vulnerability of Africa’s infrastructure. These cities have a high propensity for suffering subsequent violence against their civilians, and given their connectivity structure, they also substantially affect the overall regional functioning. Removing just ten edges would require rerouting 32% of trips according to our model. The top 100 edges where violence might happen account for 17% of the trips. We find that cities with the highest risk are those characterised by small and medium size and large degree, meaning they act as hubs. Vulnerable areas tend to be characterised by the presence of terrorist groups like Boko Haram in Nigeria.
Research
1 Introduction
Transport systems are vulnerable to congestion, weather, and other events that create delays and disruptions or isolate entire regions ganin2017resilience ; maureira2017everyday . This situation is particularly relevant in parts of the African transport network for three reasons. First, Africa has a vast and fragmented territory, and the density of highways is reduced compared to other parts of the world, so few alternatives exist in the case of a network disruption. Second, the lack of resources and infrastructure makes the market of goods in the continent susceptible to increases in transportation costs. And thirdly, because of the increasing violence against civilians in the region. It is estimated that between 2001 and 2021, the number of casualties attributed to violence against civilians in Africa has increased 260% raleigh2010introducing . Terrorist groups use the fragility of the network to increase their control in some areas and the impact of their attacks. These problems will likely intensify due to extreme weather conditions. Droughts and extreme heat are correlated with violence, with a standard deviation rise in annual temperatures corresponding to an 11.3% rise in the rate of intergroup conflict, and a standard deviation rise in drought conditions corresponding to 1.3% rise in the chance of conflict in an area burke2015climate ; harari2018conflict .
Here, we aim to measure the vulnerability of the African transport network based on two separate indices: the intensity of events affecting a specific location and the impact that an event has on the estimated flow that travels through the network.
We use data from Africapolis and the network of all highways in the continent constructed from OpenStreetMap Africapolis ; OpenStreetMap ; prieto2022detecting ; prieto2022constructing . Major highways and roads are considered within the urban network, so it is possible to compute a gravity-based estimate for the flow between any pair of cities and assign it to the shortest route between them based on existing infrastructure. We construct two metrics to capture the vulnerability of different locations within the network. First, the impact that a violent event in a specific location could have in terms of disrupting the flow. This impact is computed based on the flow that would be observed if a node is removed. Second, the intensity at which violent events happen in that location. To estimate the intensity of violent events, we use data from the Armed Conflict Location & Event Data project (ACLED) that monitors political violence across Africa, and other parts of the world, mainly from local media reports raleigh2010introducing . We construct a self-exciting point process to determine the intensity of events happening at some location based on previous events nearby. Thus, for each node in the network, we construct its daily intensity and its impact on the network flow .
We detect that a few nodes in the network are likely to suffer future events, and their impact on the infrastructure is surprisingly high. We find that the cities with the highest risk are those characterised by small and medium size and high city degree, that is, cities which create transport shortcuts in the network that otherwise do not exist. We show that these areas tend to be characterised by terrorist groups like Boko Haram in Nigeria and Al-Shabaab in Somalia.
2 Literature review
2.1 Violence against civilians in Africa is increasing and concentrated
Data from the Armed Conflict Location & Event Data project (ACLED) is captured mostly from local media and gives the location, dates, actors, fatalities, and types of reported political violence and protest events worldwide raleigh2010introducing . Between 2000 and 2021, ACLED reported over 250,000 events in Africa, with over half a million casualties, including nearly 64,000 events registered as violence against civilians. During 2021, 23 events daily can be considered violence against civilians in Africa, causing nearly 43 fatalities. This means an increase of more than 400% in the past ten years.
Violence against civilians has four key aspects. First, few events account for most casualties ZipfTerrorism ; guo2019common . Of the 8,000 events classified as violence against civilians in 2021, the top 5% most violent account for 52% of the casualties. Thus, roughly one daily event causes half of the civilian casualties in Africa. Second, is that violence is primarily urban radil2022urban . Most violent events happen inside or nearby cities and are suffered directly by their population. Third, violence is highly heterogeneous, meaning that some cities have high levels of violence, whilst others are relatively peaceful ViolenceNorthWestAfrica ; buhaug2008contagion . For example, Mogadishu (Somalia) had nearly 100 casualties in 2021 related to violence against civilians, whilst Abuja (Nigeria), with a similar population, had only one casualty raleigh2010introducing . Finally, violence has some stability across time, meaning that if a city is peaceful for one year, chances are that it will remain peaceful for the subsequent years. In contrast, violent cities also tend to remain violent for years. For instance, Mogadishu (Somalia) had nearly 100 casualties in 2021 related to violence against civilians, but it had more than 100 casualties each year for more than a decade, whilst Abuja (Nigeria) had only one casualty in 2021, and it had the same low violence well over a decade. Thus, although violence against civilians is increasing in Africa, it is due to some events highly concentrated in a few cities. As observed in other parts, violence is highly concentrated in a few locations, and they tend to be stable over time, meaning that it is possible to use data from past events to forecast the intensity of future ones LawCrimeConcentration ; CrimeConcentrationVaryingCitySize .
We use that violence against civilians is highly concentrated in a few locations and is relatively stable over time to model its temporal patterns. The Hawkes process is a mathematical model for a ‘self-exciting’ process hawkes1971spectra ; chuang2019mathematical . The model is based on a counting process of a sequence of ‘arrivals’ of some event over time, for example, earthquakes, gang violence, trade orders, or bank defaults MohlerExcitingPointProcess ; laub2015hawkes . It is based on the idea that after a major shock, the probability of subsequent events is high. For example, if an earthquake occurs, replicas are expected. Similarly, after a recent attack, chances are that the circumstances that promoted it still prevail, so more events are also expected porter2012self ; yuan2019fast ; telesca2006global ; clauset2013estimating . The Hawkes process is a non-Markovian extension of the Poisson process that records recent events. In a Hawkes process, we assume a time-varying intensity that depends on all the events in city up to time . The Hawkes process produces the intensity function , which can be interpreted as the “temperature” of city . It is a combination of all recent events up to time that enables us to obtain a daily description of events in city . Furthermore, the function enables us to construct some metrics for that city, for example, the per capita intensity.
Not all events cause the same impact. For example, in 2021, more than 8,000 events were classified as violence against civilians, but five events caused more than 100 civilian casualties, whilst more than 4,000 events had no casualties. Thus, one way to measure the severity of an attack is by the number of deaths ZipfTerrorism . In a similar way in which an earthquake with a higher seismic intensity is expected to have more replicas, we assume that an event with more casualties causes a higher impact and likely more subsequent reactions.
2.2 Urban networks are vulnerable
The location of cities relative to others has relevant socio-economic impacts. Cities near major urban regions can benefit from borrowed agglomeration economies meijers2016borrowing . Economic activities distribute themselves in response to geographical centrality StreetNetw . Proximity, however, does not accurately capture accessibility or travel distance, but details concerning barriers, obstructions and the existing infrastructure are needed to capture city interactions. Considering different cities as nodes and the road infrastructure between them as the edges of a network is one of the most natural ways to analyse city interactions barbosa2018human . Networks provide a structured model and different conceptions and measurements of centrality. As with every model, certain simplifications are made, favouring others, for example, deciding which roads and which cities to analyse, defining when a road passes through a city, or detecting when two road segments are connected.
Based on a network, there are many ways to measure a node’s importance, for example, by its degree or a combination of its degree and the degree of neighbours or other node attributes buechel2013dynamics ; singh2020node . Node betweenness is a commonly used metric that gives the number of times a node occurs in the shortest paths between all possible pairs of nodes in a network freeman1978centrality . However, we use a weighted node betweenness to detect the importance of cities. The weights correspond to a combination of two urban properties: the cities’ population and the distance between them. More journeys are expected to happen to and from bigger cities, and fewer journeys are expected between distant locations. Thus, we combine both factors using a gravity model to estimate the number of interurban trips, which is one of the most widely-used models for considering the strength of interactions between spatial units, in this case the flow of people. The gravity model generally uses population size and the physical distance, the road distance or the travel time between origin and destination to estimate the number of journeys between two cities Gravity . The procedure for obtaining the weighted betweenness based on the gravity model is our method to asses the relevance that a city has within a network. Cities with high intermediacy receive considerable traffic. If traffic through a city with high intermediacy is disrupted, consequences for inter-city travel are high.
Here, we aim to decode urban hierarchies by analysing the connectivity of cities and detecting the impact of the flow between them when one is removed from the system ArcautePercolation16 . The removal of cities from the system aims to capture a scenario when journeys through a city are no longer possible due to the presence of a violent group. If violence becomes dominant in a city, then journeys that would be routed through that city must find an alternative and frequently longer route. Thus, some journeys between cities will ultimately be discouraged due to violence.
3 Methods
For the constructed network of African interurban highways, we compute two metrics. One is used to proxy the intensity of violence or risk that a city has a sizeable disruption, and the second metric is used to detect the impact of a disruption in terms of the network. Both metrics are constructed at a city level, so we have the intensity of events, and the impact for city .
3.1 Measuring the intensity of events
Although there are many expressions for a Hawkes process laub2015hawkes , we express the intensity for city as as
| (1) |
Equation 1 only considers events that happened before some time measured in days. The intensity increases (jumps) in units immediately after the occurrence of an event at time , and the intensity decays exponentially with time at rate . For an event taking place at time , we set the parameter to be equal to the reported number fatalities. Other definitions of could depend on the size of the event (number of protesters, for instance, or number of police officers employed), the state intervention (number of arrests), the social media impact (number of tweets related to the protest), or the media coverage (the space devoted in the newspapers to such event). The parameter is the “cooling” parameter of the Hawkes process and refers to the speed at which one event is more or less significant in future days. With high values of , the process has a faster memory decay, in which case, captures the number of casualties of recent days. The number is the expected number of casualties in city at time considering all events in . The value of used is the same for all cities (assuming a homogeneous cooling-down effect), and it is estimated by maximising the correlation between and the observed number of casualties in all cities during the two weeks after time . Therefore, the obtained gives the best estimate of casualties in the upcoming 14 days. The estimated value of the cooling parameter is . More details about the estimation process are in the Supplementary information. The result is for each city, which we then project to the edges around it with a simple average to create
3.2 Estimating the flow between cities
To estimate the flows of goods and visitors along each path in the network, we construct a gravity model based on available data. This assumes that the flow between cities and is a function of the road distance between them and their population. The predicted flow of people between location and location is modelled as Equation 2
| (2) |
where is the flow, and are the populations of the two locations, respectively, and is the road distance between them. is used to normalise all flows so they sum to 1, thus conveying a share of all flows rather than the number of travellers using the road. We construct our estimate without fitting to observed data, so we test the sensitivity of our results to various values of , including values obtained from the literature on migration in Africa prieto2022detecting . For the purposes of experiments that follow, we use , but checks for robustness are included in the supplementary information. We limit the maximum travel distance in the model to 3,500 km, equivalent to the distance from Lagos (in Nigeria) to Dakar (in Senegal). This value represents the span of an aspiring economic corridor and an area of proposed economic cooperation /content/publication/9789264265875-en . The gravity model gives us flows between cities in the network. We then project flows between and for all along the shortest path in the African urban network described above to give us . The total flows into a city are summed to construct .
3.3 Percolation and violence
We use two approaches to understand the resilience of the interurban network to shocks. The first samples edges in the network in proportion to conflict intensity until we are left with an empty graph, with all cities isolated from others. The remaining strategy assumes that violence is correlated with the potential to spill from one location to another. A Mantel test (a statistical test of the correlation between two matrices) mantel1967detection whether the distance between events in time is correlated with the distance between those events in space and uses a simple Pearson correlation between the spatial distance matrix and temporal distance matrix. In our data, the location of violence in space and time is not correlated over the entire period (, ), when we split the data by country and year, a third of the space-time partitions have —likely because our dataset covers such a long period that simple correlations do not capture the peaks and troughs in violence. Knox tests (a test for space-time interaction using space and time distances) Knox also show that we see far more attacks that are close in space and time than we would expect to occur by chance. We can also look into the data and see that in 2013, militants took control of three towns in Mali: Kidal, Gao and Timbuktu. In 2016, Djibo, Arbinda and Dori in Burkina Faso came under the influence of militant groups. These tests confirm other work, which shows that conflict in one area raises the chance of conflict in adjacent areas harari2018conflict .
Percolation.
Here, we borrow from ArcautePercolation16 ; maureira2017everyday to remove nodes from the network and observe changes to its properties. Rather than removing nodes at thresholds according to distance or risk, we use a stochastic approach. At each step of our methodology, we sample an individual edge in proportion to conflict intensity , remove it from the network, and monitor the changes to the network that are triggered by the removal of the edge. We proceed, gradually removing edges according to and thus —with some variance— move across the intensity probability distribution. We allow the network to accumulate damage, simulating the effect of prolonged and cascading conflict. Although a network spanning the continent will not see broad enough conflict to disrupt the network to the extremes we test here, the patterns shown can reveal aspects of the network structure.
Cascading events.
We then use a form of bursty percolation, which assumes that violence can spill over from one area to another in each round but does not allow damage to accumulate as before: we reset the network each round and run repeated simulations. In this approach, we draw an edge from the network with a probability proportional to its intensity of conflict and remove it. We then take all edges within 100km of the seed edge and perform Bernoulli trails for each. In these trials, the probability of failure at proximate edges is weighted by the intensity of conflict associated with each edge. This is akin to performing a biased coin flip, where the level of violence determines the coin’s bias. Each edge that “fails” is also removed from the network along with the seed edge. At the end of each round, we compute a series of statistics to measure the damage done. We reconstruct the entire network after each round and observe the distributions of these statistics to the network after 1000 rounds, simulating the effect of limited but cascading conflict.
3.4 Measuring the impact of node removals
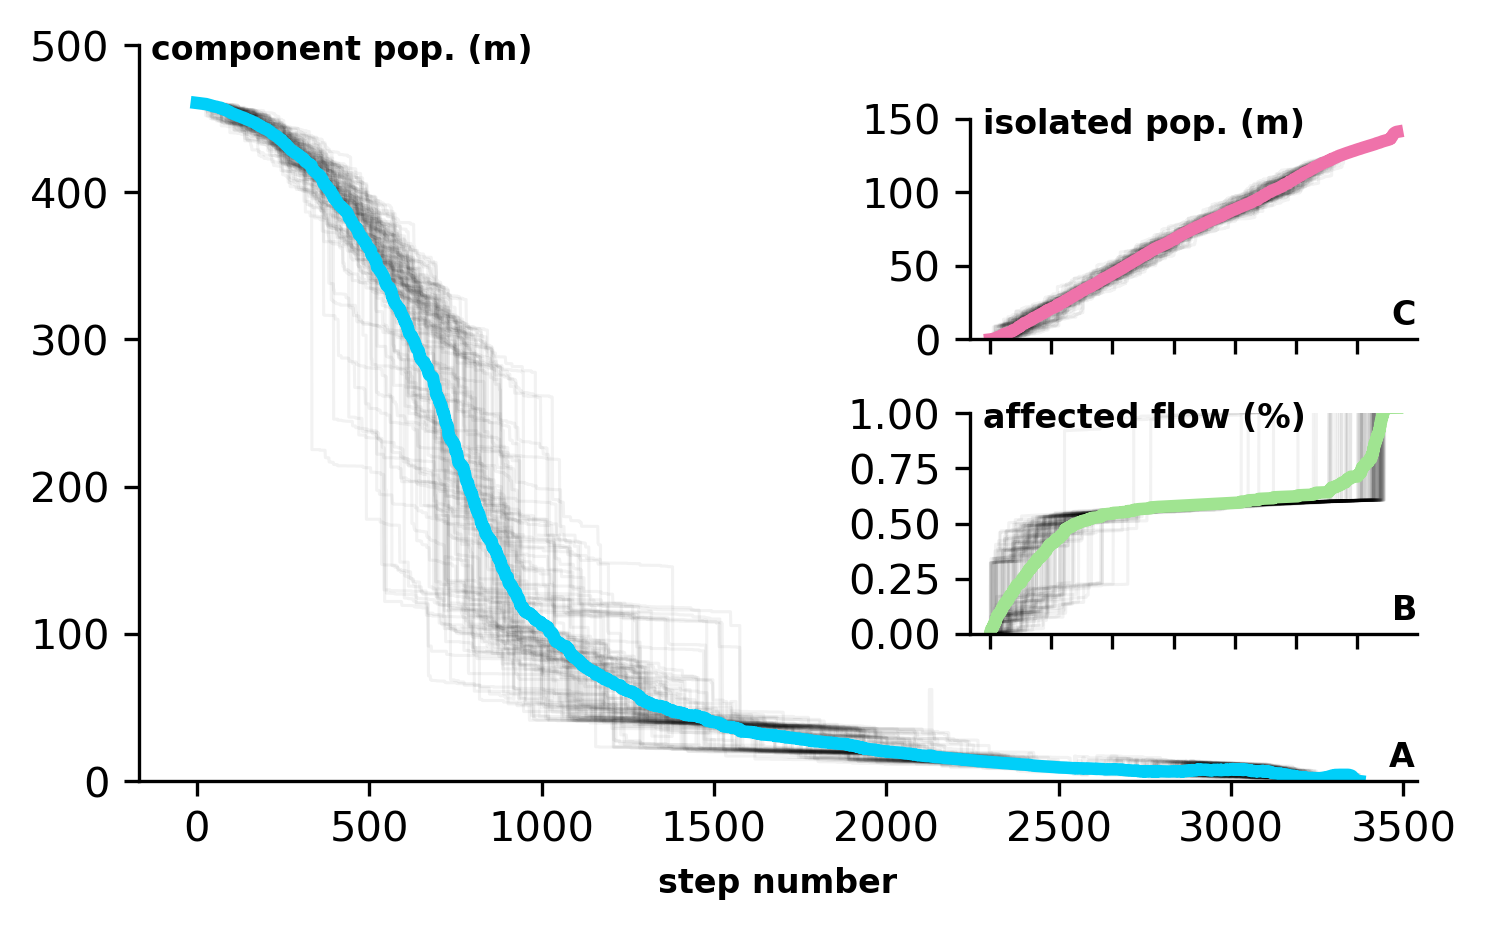
At each step of the percolation, we track the population of the largest component as it fragments due to conflict along the network, the population of all isolates created by the attacks on the network, and the percentage of all flows that need to be rerouted to preserve trade and migration on the continent. First, the largest component: by monitoring the size of largest component —weighted as its total population— we look at threats to economic integration on the continent, which requires trade and migration between cities. Second, isolates: a simple measure of the affected population is the total population of all isolates created at each step of the process as we remove edges. Third, affected flows: what percentage of flows rely on edges removed in the percolation?
We also compute a detour (in km) resulting from rerouting flows between a pair or origin and destination nodes which can no longer take place through the shortest path due to road disruption. This measure does not use gravity estimates and it is based strictly on the network road network.
4 Results
The intensity of future events is estimated by adding the number of casualties in city . Each event is affected by memory decay. One casualty in the city at time has an immediate effect of adding one unit to the intensity, so . However, as new events happen, the value of past information decreases. We obtain that after one week, one casualty adds only 0.5 units to . After one month, one casualty at time only adds 0.05 units to the intensity, so . Thus, unless more casualties occur in the city, the intensity cools down after time .
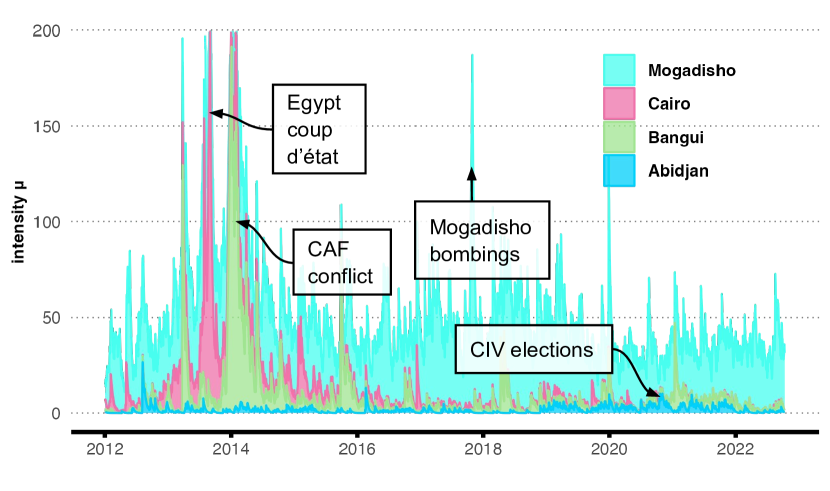
For some cities, such as Mogadisho (Somalia), the intensity is maintained with high levels, indicating an intense and stable violent process. In other cases, the intensity reflects specific moments, such as elections or conflict. High values of correspond to significant outbreaks of violence in that city. For example, the rate in Cairo (Egypt) had values above 500 in 2013 during Egypt’s coup d’état, indicating more than 500 casualties per day (Figure 1). A similar value was observed in Mogadisho (Somalia) in 2015 during its bombings. In Bangui (Central African Republic), roughly 300 casualties were observed daily between 2013 and 2014, corresponding to its conflict. During the 2020 national elections in Ivory Coast, there was also an increase in the daily casualties in its main city, Abidjan, but the daily number of casualties was below ten units during the whole period. Figure 9 in supplementary information shows how conflict is evolving as violence increases in West Africa, decreases after the Arab Spring in North Africa, and persists in the Horn of Africa.
4.1 Relationship between impact and intensity
We identify edges and nodes with a high impact disrupting the network . Edge impact is derived from flows along those roads; for node impact, we recast these weights so that each node is assigned an impact according to the sum of flows to and through it according to the gravity model. Generally, cities with high traffic are characterised by a high centrality, creating shortcuts in the network between big cities. Because of its population, most cities in Egypt have a high impact on the network, as removing them would reduce integration in the country. The same pattern occurs in parts of Nigeria. Cities with a low impact are more isolated, tend to have a smaller degree, or are adjacent to redundant travel options. For example, cities in South Africa tend to have a small impact, as well as cities in Ethiopia. They reflect either high isolation from the network or rich connection to it (Figure 2).
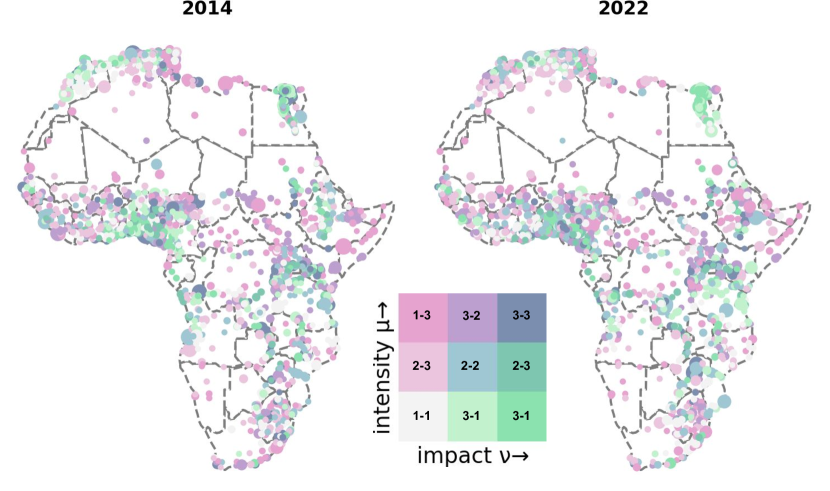
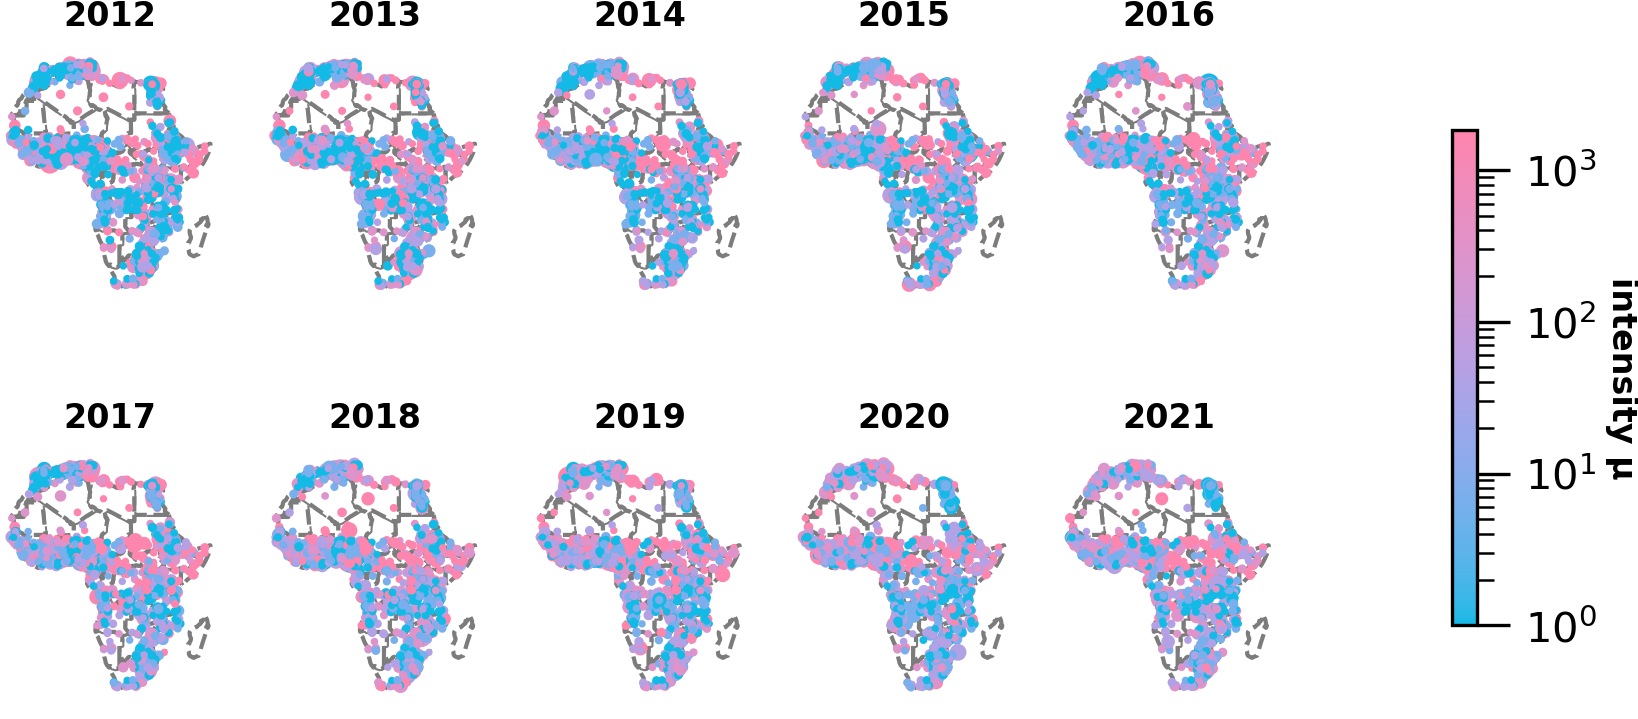
We analyse the intensity of cities for . That is, we observe the 2022 year and analyse the expected levels of violence for future days. Most cities in North Africa have low intensity, reflecting fewer violent outbreaks in the region. However, cities in Nigeria, Burkina Faso, Somalia or Ethiopia have higher intensity, reflecting recent episodes of violence (Figure 2). By looking at different periods we can look at how these patterns are changing; we map for for comparison. Conflict in Nigeria, in particular, is growing.
Based on the propensity for future events and the impact that an intervention could have, we identify nine groups according to their colour (Figure 2). The colour assigned to each city is the diagram of cities. Group 1-1 are cities with low impact and low intensity, meaning that due to violence, there are few events expected there, but also, if some outbreak of violence occurs, the impact will be reduced. In Africa, there are 280 cities with a population of 18 million in this group. In total, cities with the lowest risk of conflict represent 13.5% of the continent’s urban population. We report disaggregate these results by class and region in Table 1.
| Group | Africa | North | West | East | Central | South | ||||||
|---|---|---|---|---|---|---|---|---|---|---|---|---|
| () | cities | pop | cities | pop | cities | pop | cities | pop | cities | pop | cities | pop |
| 1-1 | 280 | 18 | 110 | 8 | 48 | 2 | 34 | 2 | 40 | 2 | 48 | 3 |
| 1-2 | 207 | 15 | 85 | 7 | 39 | 2 | 24 | 2 | 18 | 1 | 41 | 3 |
| 1-3 | 161 | 23 | 114 | 18 | 17 | 1 | 6 | 1 | 3 | 0 | 21 | 2 |
| 2-1 | 181 | 19 | 37 | 3 | 46 | 4 | 41 | 6 | 26 | 3 | 31 | 4 |
| 2-2 | 178 | 24 | 42 | 7 | 54 | 7 | 28 | 4 | 15 | 1 | 39 | 5 |
| 2-3 | 190 | 81 | 119 | 61 | 24 | 4 | 11 | 2 | 6 | 0 | 30 | 14 |
| 3-1 | 118 | 15 | 11 | 4 | 42 | 3 | 10 | 2 | 14 | 2 | 41 | 4 |
| 3-2 | 217 | 54 | 17 | 3 | 87 | 22 | 19 | 2 | 13 | 2 | 81 | 25 |
| 3-3 | 241 | 164 | 11 | 10 | 121 | 66 | 31 | 31 | 25 | 20 | 53 | 37 |
Many cities in the highest class have the largest populations, so the 241 cities in this group represent 163 million inhabitants or 39% of the total. There is significant violence in West Africa, a populous and busy economic corridor home to Africa’s largest economy (Nigeria) and largest city (Lagos), and many cities at risk in East Africa. There are some cities with a high impact and a high intensity , reflecting locations where a violent outbreak is likely to happen and where the impact in the network could be huge. This is the case, for example, for cities in Kenya, such as Nairobi. Although its levels of violence are smaller than elsewhere (including cities in Somalia), its network position creates a higher impact. There are just 23 million people in the low risk, high flow—and thus peacefully integrated—condition.
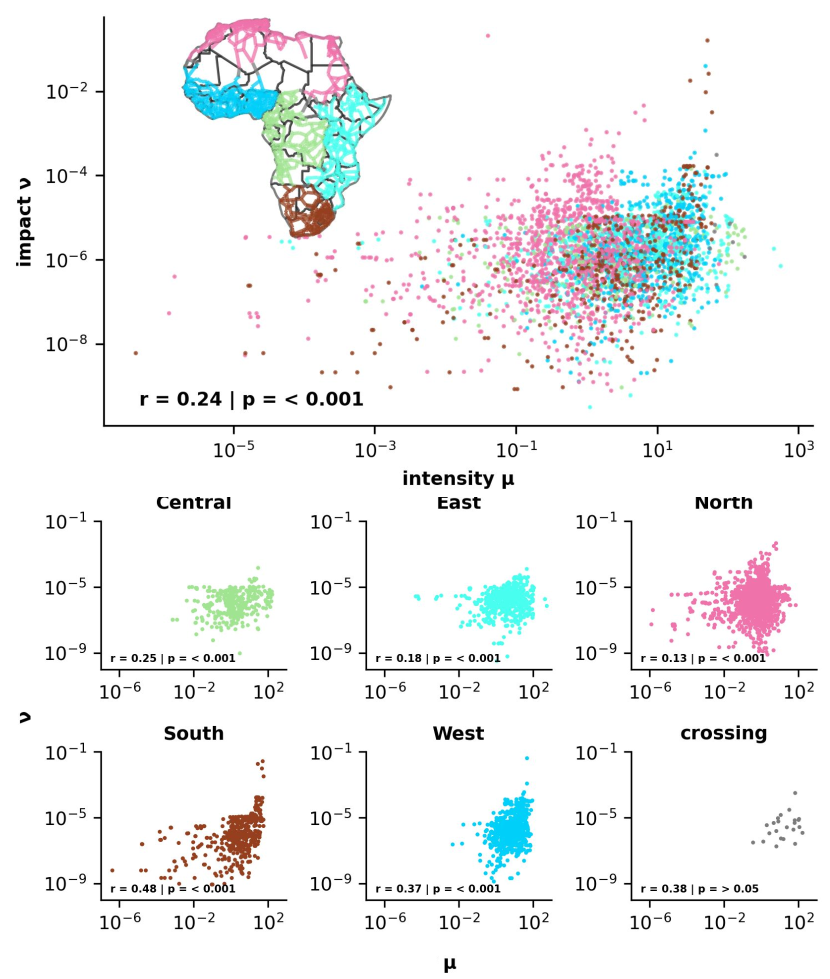
We check pairwise correlations between and along the edges in 2022 to see if the conflict is associated with the flow on the network. We can imagine a world where conflict occurs peripherally because people may be drawn to violence or terrorism when economic opportunities are limited harari2018conflict , but it may also be the case that conflict requires people as well as activity and is thus centrally located. Without a more robust empirical strategy, we cannot decompose cause and effect, but we can explore whether or not the important corridors are also prone to conflict. This is important because it indicates whether or not violence poses a risk to or is limiting Africa’s integration and economy. Figure 3 shows this relationship on aggregate and by region.
The strongest correlation is in the South, including a high along an edge connecting Johannesburg, in South Africa, to the network—a path facilitating 16% of all flows. Many of the highest combined values are in the West, with a road between Ikorodu and Lagos in Nigeria. This road accounts for 4% of all flows according to the gravity model. Both of these cities are important hubs in the network and vital centres of activity in the economy.
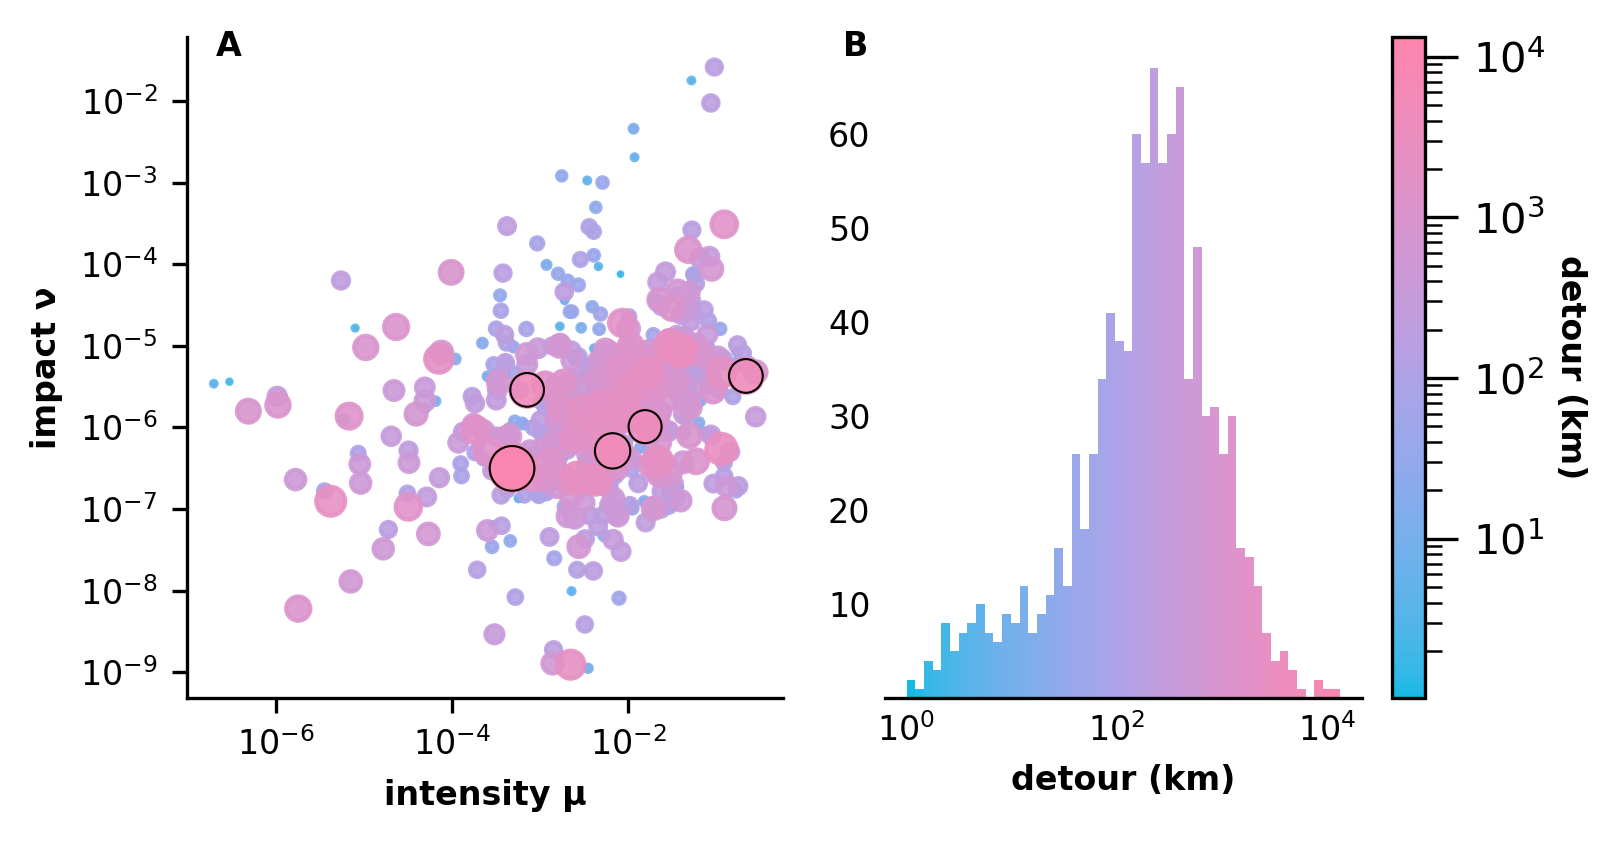
We also look at the detour resulting from the removal of an edge. This is the change in average shortest path (km) on the network after removing that edge. This varies from 1 km to 10 thousand km. Most of the largest detours, highlighted in Figure 4, cross regions, indicating that economic integration would become more costly if violence occurs in these areas. Aside from crossing roads, the highest detours are in the North and East, while the South and West have redundancy.
4.2 How robust is the system?
The impact of a network intervention is measured by the number of people that would be removed from the connected component (Figure 5). Results show that East Africa has the highest vulnerability since a network disruption would disconnect more people. Many of the most prosperous and populous cities are in North and West Africa, so even though we see these regions less prevalent across simulations—compared to the East—they represent a disproportionate amount of potential damage to the network when conflict does occur in those regions. That is, the conflict that isolates entire cities is rarer in the North and West compared to the East, but when it does occur, the damage—quantified in terms of millions of people removed from Africa’s integrated economy—tends to be more significant.
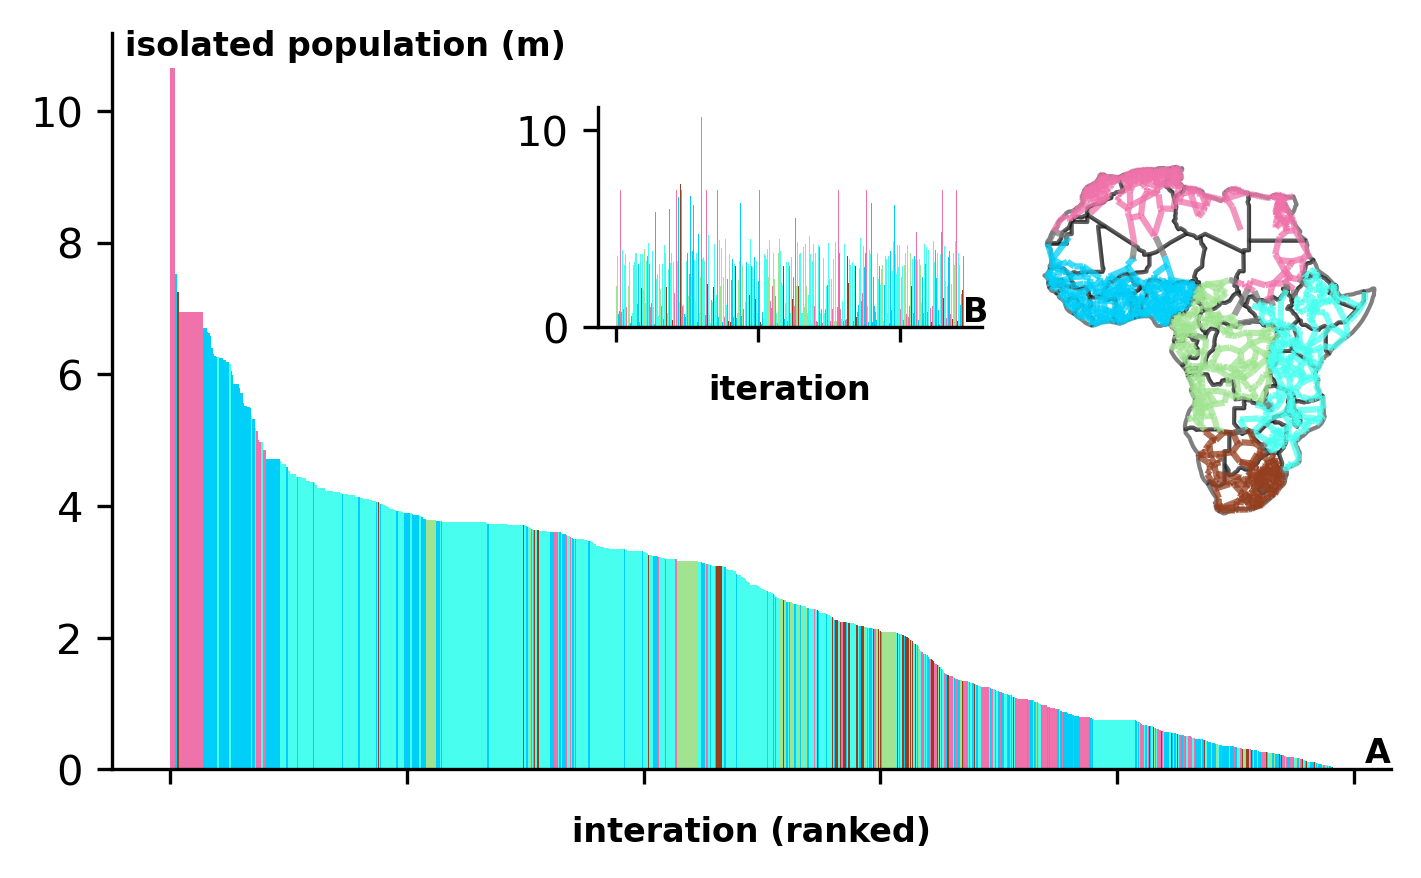
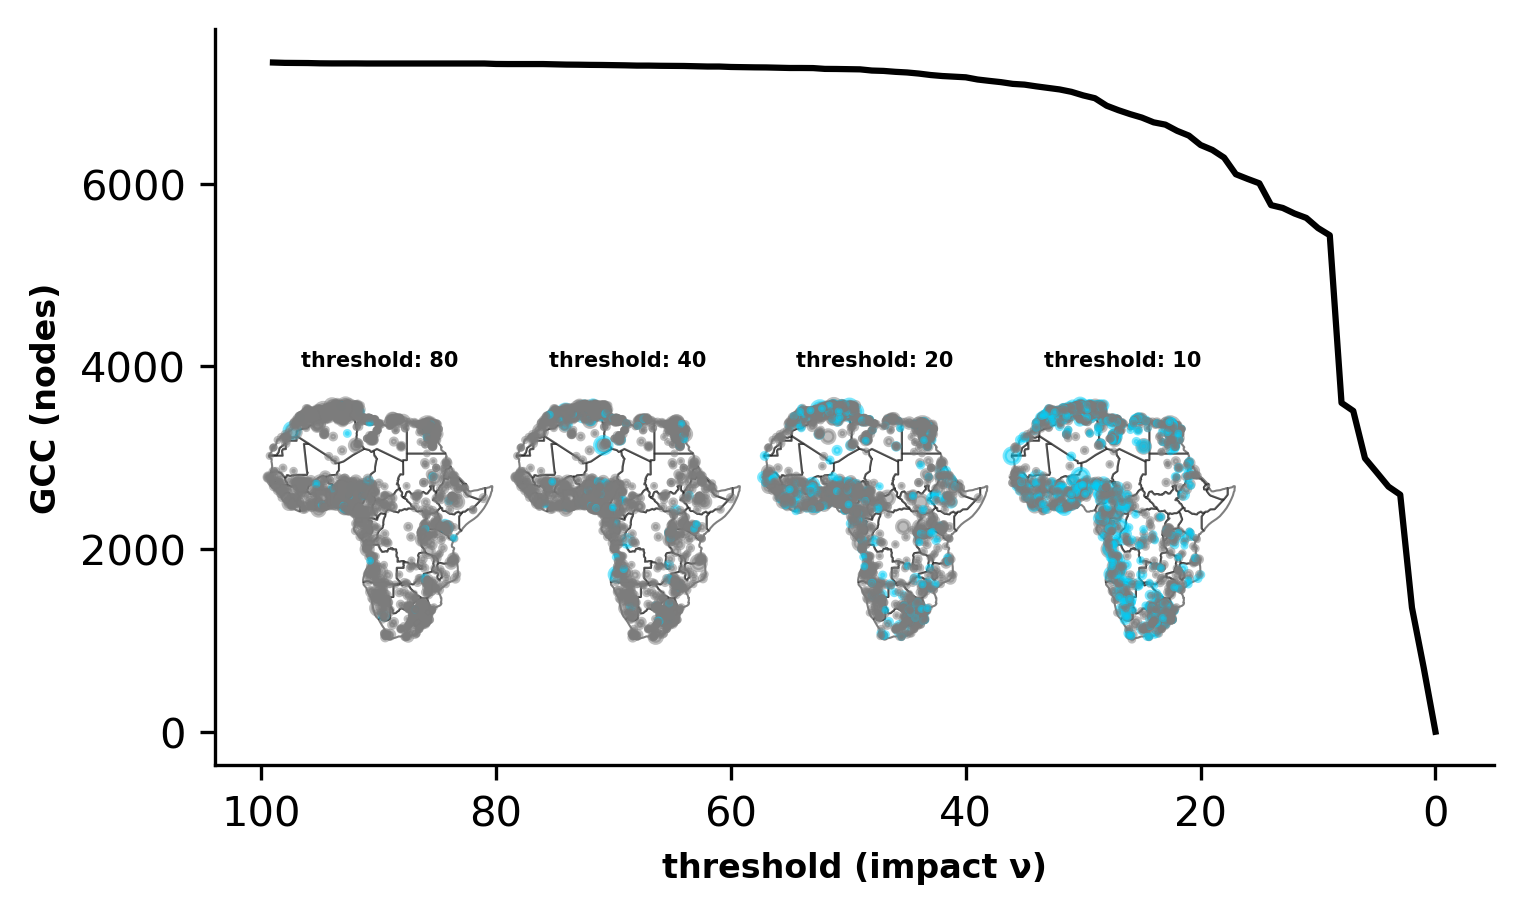
Results of a cumulative percolation simulating prolonged conflict, cutting edges with probability proportionate to conflict intensity, shows that in some scenarios, it only takes a few hundred events to strand millions of residents, disrupt a quarter or more of interurban traffic and fragment the network (Figure 6). Although there is little risk of correlated violence across the continent, the threat of it could disrupt trade and discourage integration. As Figures 2 and 9 show, conflict is becoming more growing in some areas and persisting in others, leading to prolonged threats that could change the relationships between cities. As we shift down the risk curve in 6, we produce maps like those in Figure 7. We remove all links above a given threshold and observe the size of the largest component as we do so, finding that the continent fragments even a high values of risk, indicating that we could see effects from violence if it escalates on the continent.
5 Conclusions
Road transportation is the most dominant mode of motorised transport in Africa, accounting for 80% of goods traffic and 90% of passenger traffic. However, in 2005, only 22.7% of the African road network was paved, highlighting the need for infrastructure development in some regions UNTransportAfrica09 . Even though there is some regional variation in the road density and quality, the road transport network in Africa is sparse and frequently characterised by relatively long delays at borders, high transit tariffs, market access barriers and transport restrictions. These shortcomings are especially prevalent in some of Africa’s least developed regions, hindering their economic development efforts AfricaEUCoop-Transport and creating a cyclic relationship between poverty and the state of the road network. Furthermore, terrorist groups operating in some regions take advantage of the fragility of the road network to increase their control in an area. Through their attacks, they may seek to create additional disruption in the roads prieto2020uncovering , hence exacerbating the already existing issues. It is estimated that between 2001 and 2021, the number of casualties attributed to violence against civilians in Africa increased 260% raleigh2010introducing .
In this work, we have quantified the impact that disruptions in the road network would have at different locations. The impact measure is based on the magnitude of the traffic flow at a given location, so the impact would be higher for disrupted at locations with more traffic. We have also quantified the risk or intensity at which a location experiences disruption due to violent conflict at a given point in time. Combining these two measures, we observe that low-risk but high-impact locations are mostly concentrated in North African cities. Importantly, our analysis suggests that high-risk and high-impact cities are concentrated in West Africa and Ethiopia, leading to higher vulnerability in this region. High-risk, low-impact areas are in Somalia and other isolated parts of the network.
Specifically, we find that as a result of road disruption caused by violent attacks, a larger population is more likely to become isolated from the rest of the road network in West Africa and Ethiopia. In addition, if all journeys were to go ahead despite the disruption, the fragmentation of the road network would force a relatively higher percentage of traffic flows to be rerouted in West Africa. This could result in longer travel times, subject to additional delays and congestion as well as an increase in vehicle emissions.
The network analysis approach that we take here offers several benefits over traditional Geographic Information Systems (GIS) for the study of the vulnerability of certain locations within the African road system. The most obvious advantage is the ability of spatial networks to capture the interactions between different places, allowing us to better understand the complexity of the system and ask questions such as ‘if there is a violent event in a certain location, how does this affect the road transport system as a whole?’. Therefore, our work constitutes a step forward in the direction of understanding the resilience of the road transport network against occurrences of violent conflict in the African continent. Our work also highlights the need to increase the quality, and more specifically, the connectivity of the road network in Africa, with the West African region being a priority area.
6 Supplementary information
6.1 The network of all African highways
Primary roads, highways and trunks were obtained from OpenStreetMap OpenStreetMap , and data from Africapolis Africapolis was used to obtain the location and size of all urban agglomerations with more than 100,000 inhabitants and also smaller cities near major roads to construct a connected network of all cities. A connected and simplified network of African cities is constructed. Unlike other infrastructure networks (for example, a railway network), the road network is not clearly defined. For example, considering train stations and the railways between them is a natural way to determine the nodes and the edges of the railway network. Road networks need transport nodes representing road crossings.
Cities and road data were spatially aligned and integrated into a single network. Then, disconnected components of the network were joined based on the proximity of the roads prieto2022constructing ; prieto2022detecting . Then, the network is simplified by dissolving nodes with a degree of two that connect the same type of road at both ends. The node is replaced by a “longer” edge, where the length corresponds to the sum of the two edges. The urban network comprises 9,159 edges and 7,361 nodes. The labelled network represents 2,162 cities in the continent and 5,199 transport nodes. The edges correspond to an existing highway between any two nodes. The type of road is used to estimate the speed and travel time to cross it. Any edge with its extremes on different countries is a border crossing, so 120 minutes are added for crossing it. Similarly, extra time for travelling through an urban agglomeration is added, proportional to the population of that city. For each edge, it is identified its road length, whether it crosses an international border and a city in any of its two extremes, resulting in a proxy of the estimated minutes to travel through that edge.
6.2 The Hawkes process and its parameters
We use a Hawkes point process to model the intensity of events in city . The rate for city at some time is calculated by
| (3) |
where indicates the time in which event happened, is the impact of event , and is the model parameter that captures memory decay. With small values of the model keeps the impact for many days, but with high values, the has almost no memory of past events. The sum is only for the time after the event (so ), so the values inside the exponential drop to zero as time passes.
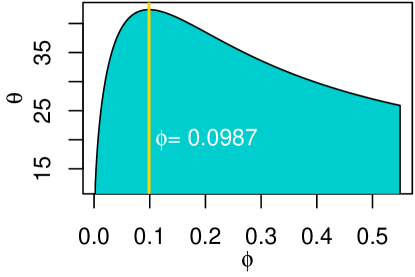
We take to be the number of event fatalities. We estimate the values of , so the Hawkes process provides the most future information as follows. For some test value of , we compute the corresponding Hawkes process for city and compute the lagged correlation between the and the events in city for the next days. Thus, the objective is that should inform as close as possible what will happen in the city two weeks after its value is computed. We compute the correlation between and , where is the average daily impact experienced in city between and . A high correlation indicates that informs the intensity of future (unknown) events. We add the correlation obtained for all cities into the value . Then, we vary the parameter and follow the same procedure, obtaining different values of . We keep the value of since it maximises (Figure 8).
Competing interests
The authors declare that they have no competing interests.
Funding
The research was funded by the Austrian Federal Ministry for Climate Action, Environment, Energy, Mobility, Innovation and Technology (2021-0.664.668) and the Austrian Federal Ministry of the Interior (2022-0.392.231).
References
- (1) Ganin, A.A., Kitsak, M., Marchese, D., Keisler, J.M., Seager, T., Linkov, I.: Resilience and efficiency in transportation networks. Science Advances 3(12), 1701079 (2017)
- (2) Maureira, V.M., Karimi, K.: The everyday and the post-disaster urban systems as one thing: A configurational approach to enhance the recovery and resilience of cities affected by tsunamis. In: Proceedings-11th International Space Syntax Symposium, SSS 2017, vol. 11, pp. 91–1 (2017). Instituto Superior Técnico, Portugal
- (3) Raleigh, C., Linke, A., Hegre, H., Karlsen, J.: Introducing ACLED: an Armed Conflict Location and Event Dataset: special data feature. Journal of Peace Research 47(5), 651–660 (2010)
- (4) Burke, M., Hsiang, S.M., Miguel, E.: Climate and conflict. Annu. Rev. Econ. 7(1), 577–617 (2015)
- (5) Harari, M., Ferrara, E.L.: Conflict, climate, and cells: a disaggregated analysis. Review of Economics and Statistics 100(4), 594–608 (2018)
- (6) OECD/SWAC: Africapolis (database). Organisation for Economic Co-operation and Development. Accessed: September 2019 (2018)
- (7) OpenStreetMap contributors: Planet dump retrieved from https://planet.osm.org . https://www.openstreetmap.org (2021)
- (8) Prieto-Curiel, R., Schumann, A., Heo, I., Heinrigs, P.: Detecting cities with high intermediacy in the African urban network. Computers, Environment and Urban Systems 98, 101869 (2022)
- (9) Prieto-Curiel, R., Heo, I., Schumann, A., Heinrigs, P.: Constructing a simplified interurban road network based on crowdsourced geodata. MethodsX 9, 101845 (2022)
- (10) Clauset, A., Young, M., Gleditsch, K.S.: On the frequency of severe terrorist events. Journal of Conflict Resolution 51(1), 58–87 (2007)
- (11) Guo, W.: Common statistical patterns in urban terrorism. Royal Society Open Science 6 (2019)
- (12) Radil, S., Walther, O., Dorward, N., Pflaum, M.: Urban-rural geographies of political violence in North and West Africa. Available at SSRN (2022)
- (13) Skillicorn, D.B., Walther, O., Leuprecht, C., Zheng, Q.: The diffusion and permeability of political violence in North and West Africa. Terrorism and Political Violence 0(0), 1–23 (2019). doi:10.1080/09546553.2019.1598388. https://doi.org/10.1080/09546553.2019.1598388
- (14) Buhaug, H., Gleditsch, K.S.: Contagion or confusion? why conflicts cluster in space. International Studies Quarterly 52(2), 215–233 (2008)
- (15) Weisburd, D.: The law of crime concentration and the criminology of place. Criminology 53(2), 133–157 (2015). doi:10.1111/1745-9125.12070
- (16) Hipp, J.R., Kim, Y.-A.: Measuring crime concentration across cities of varying sizes: Complications based on the spatial and temporal scale employed. Journal of Quantitative Criminology, 1–38 (2016). doi:10.1007/s10940-016-9328-3
- (17) Hawkes, A.G.: Spectra of some self-exciting and mutually exciting point processes. Biometrika 58(1), 83–90 (1971)
- (18) Chuang, Y.-l., D’Orsogna, M.R.: Mathematical models of radicalization and terrorism. ArXiv preprint arXiv:1903.08485 (2019)
- (19) Mohler, G.O., Short, M.B., Brantingham, P.J., Schoenberg, F.P., Tita, G.E.: Self-exciting point process modeling of crime. Journal of the American Statistical Association (2012)
- (20) Laub, P.J., Taimre, T., Pollett, P.K.: Hawkes processes. arXiv preprint arXiv:1507.02822 (2015)
- (21) Porter, M.D., White, G.: Self-exciting hurdle models for terrorist activity. The Annals of Applied Statistics, 106–124 (2012)
- (22) Yuan, B., Schoenberg, F.P., Bertozzi, A.L.: Fast estimation of multivariate spatiotemporal Hawkes processes and network reconstruction. . (2019)
- (23) Telesca, L., Lovallo, M.: Are global terrorist attacks time-correlated? Physica A: Statistical Mechanics and its Applications 362(2), 480–484 (2006)
- (24) Clauset, A., Woodard, R., et al.: Estimating the historical and future probabilities of large terrorist events. Annals of Applied Statistics 7(4), 1838–1865 (2013)
- (25) Meijers, E.J., Burger, M.J., Hoogerbrugge, M.M.: Borrowing size in networks of cities: City size, network connectivity and metropolitan functions in Europe. Papers in Regional Science 95(1), 181–198 (2016)
- (26) Ozuduru, B.H., Webster, C.J., Chiaradia, A.J.F., Yucesoy, E.: Associating street-network centrality with spontaneous and planned subcentres. Urban Studies 58(10), 2059–2078 (2021). doi:10.1177/0042098020931302
- (27) Barbosa, H., Barthelemy, M., Ghoshal, G., James, C.R., Lenormand, M., Louail, T., Menezes, R., Ramasco, J.J., Simini, F., Tomasini, M.: Human mobility: Models and applications. Physics Reports 734, 1–74 (2018)
- (28) Buechel, B., Buskens, V.: The dynamics of closeness and betweenness. The Journal of Mathematical Sociology 37(3), 159–191 (2013)
- (29) Singh, A., Singh, R.R., Iyengar, S.: Node-weighted centrality: a new way of centrality hybridization. Computational Social Networks 7(1), 1–33 (2020)
- (30) Freeman, L.C.: Centrality in social networks conceptual clarification. Social Networks 1(3), 215–239 (1978)
- (31) Anderson, J.E.: The gravity model. Technical report, National Bureau of Economic Research (2010)
- (32) Arcaute, E., Molinero, C., Hatna, E., Murcio, R., Vargas-Ruiz, C., Masucci, A.P., Batty, M.: Cities and regions in Britain through hierarchical percolation. Royal Society Open Science 3(4), 150691 (2016). doi:10.1098/rsos.150691. https://royalsocietypublishing.org/doi/pdf/10.1098/rsos.150691
- (33) OECD, Sahel, Club, W.A.: Cross-border Co-operation and Policy Networks in West Africa, p. 224 (2017). doi:10.1787/9789264265875-en. https://www.oecd-ilibrary.org/content/publication/9789264265875-en
- (34) Mantel, N.: The detection of disease clustering and a generalized regression approach. Cancer research 27(2_Part_1), 209–220 (1967)
- (35) Knox, E.G.: The Detection of Space‐Time Interactions. Journal of the Royal Statistical Society Series C 13(1), 25–29 (1964). doi:10.2307/2985220
- (36) Economic, U.N.-, for Africa, S.C.-E.C.: Africa review report on transport. Technical report, Addis Ababa, Ethiopia (2009)
- (37) for Mobility, E.C.-D.-G., Transport: Towards an enhanced africa-eu cooperation on transport and connectivity. Technical report (2020)
- (38) Prieto-Curiel, R., Walther, O., O’Clery, N.: Uncovering the internal structure of Boko Haram through its mobility patterns. Applied Network Science 5(1), 1–23 (2020)