Astrometric Calibration and Performance of the Dark Energy Spectroscopic Instrument Focal Plane
Abstract
The Dark Energy Spectroscopic Instrument, consisting of 5020 robotic fiber positioners and associated systems on the Mayall telescope at Kitt Peak, Arizona, is carrying out a survey to measure the spectra of 40 million galaxies and quasars and produce the largest 3D map of the universe to date. The primary science goal is to use baryon acoustic oscillations to measure the expansion history of the universe and the time evolution of dark energy. A key function of the online control system is to position each fiber on a particular target in the focal plane with an accuracy of 11m rms 2-D. This paper describes the set of software programs used to perform this function along with the methods used to validate their performance.
1 Introduction
The Dark Energy Spectroscopic Instrument (DESI) is conducting an optical/near-infrared survey of 40 million galaxies and quasars in order to answer cosmological questions about the nature of dark energy in the universe, with the goal of performing the most precise measurement of the expansion history of the universe ever obtained (Levi et al., 2013; DESI Collaboration et al., 2016a, b). DESI will use the Baryon Acoustic Oscillation (BAO) scale to determine the distance-redshift relationship from the recent universe to approximately redshift 3.5. In addition to the expansion history and dark energy, DESI will also measure the growth of cosmic structure, provide new information on the sum of the neutrino masses, study the scale dependence of primordial density fluctuations from inflation, test potential modifications to the general theory of relativity, and map the stellar halo of the Milky Way. The survey began on 2021 May 14 and is expected to run for 5 years.
The DESI instrument (DESI Collaboration et al., 2022) is mounted at the prime focus of the Mayall 4-meter telescope located on Kitt Peak in Arizona. A 6-element optical corrector provides a 3.2 degree diameter field of view (Miller et al., 2023). An integrated atmospheric dispersion compensator (ADC) provides correction for atmospheric chromatic effects up to an airmass of about 2.2 (zenith distance of 63 deg). The DESI focal plane comprises an array of 5020 optical fibers, each mounted to a 2-axis robotic positioner, along with ten "guide/focus assembly" (GFA) charge-coupled device (CCD) sensors used for guiding or wavefront sensing. (Silber et al., 2023). Each fiber feeds light from an astronomical target to one of ten three-channel spectrographs that cover the wavelength range 0.36m – 0.98m (DESI Collaboration et al., 2022). Light-emitting diode (LED) light sources in each spectrograph can be used to back-illuminate the fiber tips. Additionally, 120 “fiducials” (fixed light sources) are distributed about the focal plane to act as positional references. A “fiber view camera” (FVC) (Baltay et al., 2019) is mounted near the vertex of the primary mirror and takes images of the fiducials and back-illuminated fiber tips of the focal plane through the corrector. These images are used to measure the location of the positioner fibers relative to the fiducials and determine the necessary corrections needed to position the fibers at the locations of targets in a given field on the sky. Spectrograph integration times on a field are typically 10-15 minutes. For efficiency, short setup times (no more than 2 minutes, including telescope slew time, for fields nearby on the sky) are desirable.
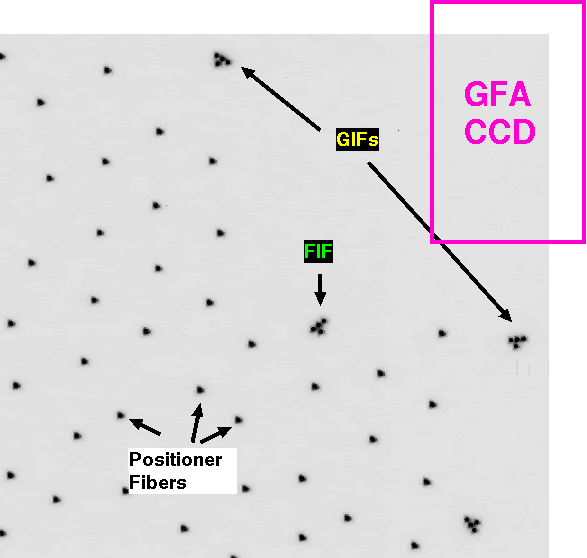
Accurate fiber positioning requires that the focal plane be calibrated astrometrically. In a nutshell, this calibration occurs in two steps (Fig. 1). First, the GFA guide CCDs obtain images of stars from the Gaia DR2 catalog (Brown et al., 2018), which have high-accuracy astrometric coordinates. Two nearby co-mounted “guider fiducials” (GIFs), are calibrated astrometrically, making use of previously obtained laboratory metrology that ties CCD pixels to the GIFs. Second, an FVC image of the fiducials and back-illuminated positioner fibers is obtained. Using the GIFs as surrogate astrometric standards, the FVC CCD image is calibrated astrometrically, giving the sky position of each pixel. The positioners are commanded to move as appropriate to place the image of each back-illuminated positioner fiber on the desired pixel position of a target.

The main software program used to accomplish this calibration and positioning of target fibers is called “PlateMaker” (PM; the name is a throwback to previous multi-object focal plane systems that used plug-plates to position fibers - e.g., Limmongkol et al. (1993)). FVC CCD images are analyzed with a separate program called “spotmatch,” which derives the pixel coordinates of the fiducials and positioner fibers. A third program, the “turbulence correction” code (part of the “desimeter” package) is used to measure and derive corrections to FVC images due to the effects of turbulence in the air column between the FVC and the focal plane. A fourth program, the “dither analysis” code, is used offline to refine the optical model used in PM by analyzing a special set of “dither” exposures of a field of bright astrometric standard stars. The functioning of these programs was described briefly in DESI Collaboration et al. (2022), and their integration with the instrument control system was described in Silber et al. (2023). Modeling of the telescope optics is done using another offline program “trace”.
The purpose of this paper is discuss the operation and performance of these programs, particularly PlateMaker, in much greater depth. The organization is as follows. Section 2 describes the hardware systems that are involved and the nominal procedures by which they are used. Section 3 gives certain details of the optical model of the telescope and wide-field corrector. Section 4 describes the astrometric calibration of the guide CCDs used for field acquisition. Section 5 describes the astrometric calibration of the FVC images and how they are used to provide corrections to the fiber positioners. Sections 6 to 8 present numerous measures of the performance of the calibration procedures, including both on-sky and off-sky tests. Conclusions are presented in section 9 along with thoughts on improvements that can be made in a future wide-field spectroscopic instrument.
2 Hardware
Figure 2 shows the basic hardware layout. More information on each major component follows.

2.1 Corrector
The basic parameters of the corrector (Miller et al., 2023) are give in Table LABEL:tab:corrector.
| Plate Scale | 14.2 | arcsec mm-1 |
|---|---|---|
| Field Diameter | 3.2 | deg |
| Focal Plane Diameter | 812 | mm |
| Zenith angle limits | deg | |
| Wavelength range | micron |
The corrector acts as a focal expander, increasing the f/# from 2.8 of the primary mirror to 3.9. The focal plane is chief-ray normal but not flat - the shape is aspheric and convex towards the corrector. A side effect of producing these optical properties is that there is large amount of radial distortion (6 mm), requiring at least a 5th order polynomial to model. The difference between the radial and tangential plate scales can be as large as 10% towards the edge of the field, which means that the exit pupil is distorted as well. Additionally, the atmospheric dispersion compensator ("ADC") introduces non-axisymmetric distortions; these will be discussed in section 3.2.
The corrector is attached to the telescope via a hexapod system, which provides focus, translation, and rotational motions. Only small rotations are needed, and they are used to compensate for apparent field rotation as a function of position in the sky.
2.2 Fiber View Camera
The FVC is described in more detail in Baltay et al. (2019), so only the salient points will be mentioned here. The camera consists of a lens, a narrow band filter centered on 470 nm, a quartz window, and a Kodak KAF-50100 6132 x 8176 CCD with 6m pixels. The demagnification from the DESI focal plane is a factor of 24. Multiple lenses have been used over time; the current lens is a BK7 singlet 25 mm in diameter and focal length 600 mm, producing an f/24 beam. The FVC is mounted in the central hole in the primary mirror and is about 12 m from the DESI focal plane. Given its location near the vertex of the primary mirror, the FVC images what is essentially the chief ray of a back-illuminated fiber after the beam exits the corrector.
2.3 Focal Plane
The focal plane (Silber et al., 2023) is assembled from 10 “petals”, each being a wedged-shaped sector of angular width 36. Each petal has mounting holes for 502 motorized positioners, and each positioner holds a single optical fiber of diameter 107m (1.52 arcsec). Additionally, 10 FIFs (“focal plane fiducials") are mounted at select locations between the field center and edge. The fiducials have a mask that allows them to project a pattern of 4 “pinholes" when illuminated; these pinholes are used to aid in absolute position calibration of FVC images, tying FVC CCD pixels to physical locations on the DESI focal plane. Also mounted on each petal is a single GFA assembly, consisting of a back-illuminated e2v Model 230-42 2048 x 2064 CCD with 15m pixels plus two GIFs mounted to the GFA body (Fig. 3). Six of these GFAs (distributed around the rim of the focal plane) are dedicated to guiding and field acquisition, while the remaining four are dedicated to wavefront sensing for focus and collimation. The GIFs are used to tie the astrometric calibration as determined by the guide CCDs to the physical location in the focal plane.
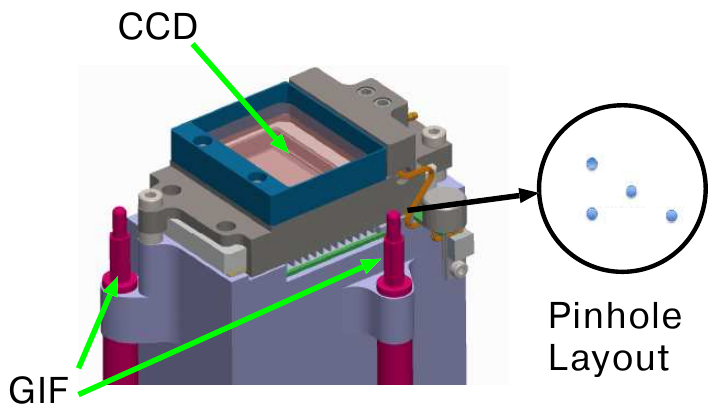
Both the fiducials and the positioner fibers can be illuminated either individually or in combination. The LED illuminators have a wavelength of 470 nm.
Since the telescope has an equatorial mount, the focal plane has a nominally fixed orientation relative to the apparent sky. A global Cartesian coordinate system (called “CS5” within the DESI project) is defined such that the -axis points in the sky W direction and the -axis points in the sky N direction.
2.4 Metrology
Metrology (accurate 2-D or 3-D measurements of particular components) of two subsystems – the GFAs and the petals – was performed in a laboratory setting before the subsystems were installed at the telescope (Silber et al., 2023).
-
1.
GFAs: Using a spot projector mounted on an X-Y stage, metrology of each GFA was obtained, consisting of:
-
(a)
Linear measurements of the 4 pinholes of each GIF and of spots projected onto six locations on the CCD distributed in a grid pattern.
-
(b)
For each spot location on the CCD, the CCD was read out, producing pixel coordinates at the same time. Spot sizes were about 50m (3.4 pixels) FWHM. In this way, it was possible to extend the astrometric calibration of the CCD pixel coordinates to the GIFs. The rms error in this measurement was of order 27m 1-D.
-
(a)
-
2.
Petals: After the GFAs were attached to the petals, the fiducials (including the GIFs) were illuminated and the position of each pinhole was measured relative to reference balls on each petal using a coordinate measuring machine (CMM) with both optical and touch probes. The rms error in this process was of order 17m rms 1-D.
Originally it was intended to assemble the entire focal plane and perform metrology of all petals simultaneously, but this proved to be too difficult and risky, so the relative petal positions were left to be determined using the FVC.
3 Optical Model
The optical design of the corrector plus primary mirror is given in Miller et al. (2023). This design has been analyzed using a raytrace program111The program is home-grown, written using custom code. It provides many features found in commercial codes such as Zemax or Oslo but has several enhancements that make it easier to interface to the PM code. to determine a number of properties that are relevant to PM. A somewhat unique feature of the optical design is that the ADC is formed from two adjacent spherical surfaces that are wedged relative to the optical axis and counter-rotated with respect to one another in order to create lateral chromatic aberration that compensates that due to the atmosphere. The advantage of this design is that it is compact and straightforward to fabricate. A collateral impact, however, is that numerous side effects, described below, must be accounted for and compensated. None of these effects is serious, and they simply add a few extra steps to DESI operations.
3.1 Field Center
The precise operational definition of the center of the focal plane will be described in section 7.2; for the purpose here, it is the place where the noses of all petals meet (Fig. 2). The telescope is pointed so that a “field center” on the sky is positioned at this point. The ADCs introduce pointing offsets between the sky and the focal plane center by an amount that depends on the ADC rotation settings and hence zenith angle; at air mass 2, e.g., this offset is about .
3.2 Distortion
The dominant distortion in mapping the sky to the focal plane is 3rd and 5th order radial distortion with amplitude of order 6 mm. (Note that this value is the maximum amplitude relative to a linear mapping between the center and edge of the focal plane.) In addition, there is significant 2nd and 4th order non-axisymmetric distortion that has a peak amplitude of order 100m at the edge of the field. Both types of distortion have static components, while the non-axisymmetric components depend additionally on the the ADC settings.
A naive mapping of the sky to the focal plane, in which the distortion and at coordinates in the focal plane are each expressed as a two dimensional polynomial of those coordinates, requires 20 terms total at 3rd order (e.g, Anderson and King 2003) and 42 terms total at 5th order. Such transformations are poorly constrained when solving for the coefficients using data from, say, only 120 fiducials total. A much more efficient mapping technique was presented in Kent (2018) using spin-weighted Zernike polynomials.222These polynomials turn out to be the same as the orthogonal vector polynomials of Zhao and Burge (Zhao & Burge, 2007, 2008)(ZB) but expressed in a more easily generalized fashion. These polynomials are linear combinations of the terms in the naive expansions but have certain properties that make it easier to eliminate terms that are unimportant. In practice, only 13 terms are needed here. Kent (2018) gives a table of these terms along with their maximum amplitude and meaning.
Most of the terms are type “E” mode while three are type “B” mode.333ZB S and T polynomials respectively Two of these terms are non-axisymmetric modes (one E and one B) that are generated by the ADC when the telescope is away from zenith and the wedged lens surfaces are not parallel to one another. The amplitudes of these terms vary sinusoidally with the ADC angles, reaching a maximum of 112m when the ADCs are at their maximum correction. Each type of pattern is shown in Fig. 4.

When measuring distortion in the DESI focal plane using the FVC, there is an additional non-axisymmetric static E mode component that is well in excess of what is predicted by the optical model and whose origin is unclear. A possible origin is a small misalignment of the FVC CCD or lens with respect to the corrector optical axis. In any case, its effect is incorporated in the FVC to DESI distortion model.
In the vicinity of each GFA, a simplified, local version of the distortion model is used that covers just the GFA CCD and the adjacent GIFs. This model utilizes the as-designed optical model but also accounts for the fact that the GFAs are tilted and rotated due to the focal plane not being flat and that the surface of best focus is curved across the GFA. This local model omits the non-axisymmetric E mode static term, but this omission is largely rectified later in the definitions of various calibration constants for the GFA CCDs and GIFs. The local model is parametrized as a function of the ADC settings.
While the corrector plus atmosphere is largely achromatic, it is not entirely so - there is a dependence of spot centroid on wavelength. This dependence is captured in a simple model consisting of offsets plus a radial polynomial, where the coefficients are a function of both wavelength and ADC settings. The maximum offset between the monochomatic and polychromatic centroids is about m at the GFA filter wavelength and m at the FVC filter wavelength.
The FVC images only the chief ray from a fiber, whereas the fiber itself images all rays falling on the primary mirror. For off-axis images, aberrations introduce an offset between the chief ray and the image centroid. A simple model that is comparable to that used for the differential chromatic aberration is used to account for this offset. The maximum offset between the chief ray and centroid is about m at the FVC filter wavelength.
4 GFA Astrometric Calibration
The GFA astrometric calibration process produces a mapping from GFA CCD pixels to sky coordinates relative to the field center. The inputs to this PM process, as provided by the “Instrument Control System" (ICS), include the following:
-
1.
Sky coordinates of a field of 5000 astronomical targets plus 20 blank sky positions used for monitoring system throughput (Schlafly et al., 2023).
-
2.
A list of stars from the Gaia DR2 catalog that fall in the vicinity of each GFA CCD to serve as astrometric standards.
-
3.
State information (hexapod settings, etc).
-
4.
System time synchronized to UTC.
-
5.
An image of the sky made using the GFA CCDs with the telescope pointed at the selected field center, with a typical exposure time of 10 sec.
4.1 Image Processing
The GFA images are processed to produce a list of all stellar objects in the images. The GFA CCDs are operated in a mode slightly different from that of most science CCDs and thus require a somewhat nonstandard processing algorithm. The CCDs are operated in frame transfer mode, which allows integration and readout without the need for a shutter. They are not actively cooled and thus have significant dark current and hot pixels. When the CCDs are first turned on, they are in a very noisy state. By running through a series of resets the noise levels can be reduced, however, sometimes this process does not work. Some of the CCDs have hot columns or warm edges.
Fortunately the hot pixel pattern has stayed nearly constant with time such that a template dark current frame constructed at the beginning of the survey still suffices. After scaling for exposure time, it is subtracted from a GFA image. There are often gradients in the background remaining, so the image is divided into regions of size 172x128 pixels and each is median averaged and subtracted. No flatfielding is needed. A simple cosmic ray filter is run to clean out obvious single-pixel artifacts. A smoothing filter is run once to reduce noise. At this point a simple peak-finder is run to find local peaks greater than a given threshold above sky noise and less than a saturation value. This process generally finds all bright stars, but it can also find a number of artifacts such as bad columns that need to be filtered out. A series of filtering steps is run to weed these out. First, objects falling on bad columns are identified and eliminated. Annular profiles are computed for each remaining object and a profile (essentially a Moffat function with beta = 3.5) is fitted. A fixed radius of 12 pixels is used regardless of the seeing to avoid potential changes in profile shape during times of poor seeing. Cuts are imposed on the quality of the fit, image width, flux within the profile, and shifts in centroid. This process handles just about any artifacts found in the images and returns a clean list of stars.
4.2 Global Astrometric Solution
The six GFA CCDs are treated as a single rigid focal plane - each list of stars is projected onto the sky based on the known location and orientation of each CCD (Fig. 5) and then combined into a single list.
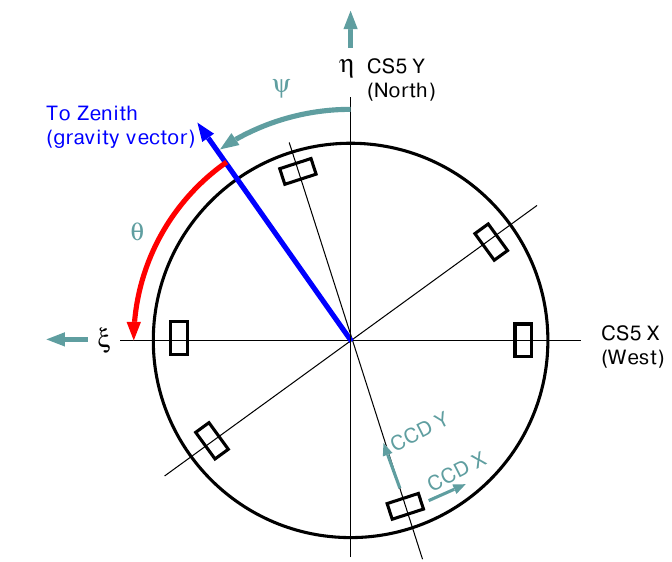
The Gaia astrometric standard coordinates are converted to apparent tangent plane coordinates () centered on the target field center by applying standard corrections for precession, nutation, aberration, and refraction. An important additional correction involves field rotation due to misalignments within the telescope structure. Since the Mayall telescope is an equatorial mount, apparent north is nominally fixed in the focal plane, but due to misalignments (e.g., polar axis misalignment), the actual direction of N can vary by several arcmin, being largest at high declinations. An empirical model was developed to calculate rotation as a function of hour angle and declination, and this model works with an rms error of 10 arcsec and peak errors of order 1 arcmin at high declination. (These errors are not entirely repeatable, indicating that there may be hysteresis of some sort in the telecope drive or support system.)
Transformation from the instrumental coordinates to sky coordinates requires a minimum of 4 parameters: and sky center offsets, rotation angle, and scale factor. The rotation angle and scale factor are known well enough that the dominant unknowns are the sky center offsets. These offsets are determined by performing a 2-dimensional cross-correlation between the combined star list and the list of astrometric standards. Once an initial guess at the offsets is known, the observed and standard star lists are matched up in detail, and improved values of the 4 parameters are computed via least squares. This process is repeated once in case the initial match missed one or more stars or mismatched standard stars with a particular detection. A limiting magnitude of 18 is imposed to prevent confusion in fields with high stellar density. Note that even if only 1 star is detected on a GFA, it can be included in the astrometric solution.
Once the 4 parameters are determined, the following quantites are computed:
-
•
Coordinates and residuals for all matched stars
-
•
A list rank ordered by magnitude of candidate guide stars for each GFA with both sky and pixel coordinates
-
•
Pointing corrections and the hexapod rotation setting. Note that for an equatorial telescope, for any field off the celestial equator, a motion in right ascension induces additional field rotation that varies as ; this extra rotation is included in the hexapod setting.
-
•
Sky coordinates for each GIF. These are computed based on laboratory metrology of the location of each GIF relative to GFA CCD pixels along with optical distortion predictions from the as-built DESI optical model (Section 3).
For fields near zenith, typical rms residuals under good conditions are 30 milliarcsec 1-D with little if any dependence on position in the focal plane. This performance is close to that achieved with the Dark Energy Camera using exposures that are 3 times longer (Bernstein et al., 2017). For fields away from the zenith, the accuracy declines, likely due to deformation of the focal plane under gravity loading. Deformation will be discussed in section 4.5.
The total elapsed time, including overhead for communicating with the ICS, is typically 4 seconds.
4.3 Local Astrometric Calibration
PlateMaker offers an alternative mode in which each GFA CCD is astrometrically calibrated individually. Although this mode is not used in normal operations, it allows astrometric solutions to be obtained when either the telescope has large pointing errors or the field rotation is not known ab initio. It is most commonly used when constructing a new telescope pointing model.
4.4 Updates to GFA metrology
Initially the location and orientation of each GFA was taken from the as-designed focal plane. In practice, the as-built focal plane location of each GFA is offset and rotated relative to its design value. By using a series of exposures taken near zenith, the astrometric solutions were used to improve the locations and orientations of each GFA CCD relative to the others. Note that the absolute locations, rotation angle relative to the focal plane, and an overall scale factor giving the absolute separations of the CCDs was uncontrained because the astrometric solution includes parameters that are degenerate with these terms and will compensate for any adjustment to them. The absolute location, size, and orientation of the GFA array relative to the focal plane was done using the FVC as described in section 5.3
4.5 Focal Plane Deformation
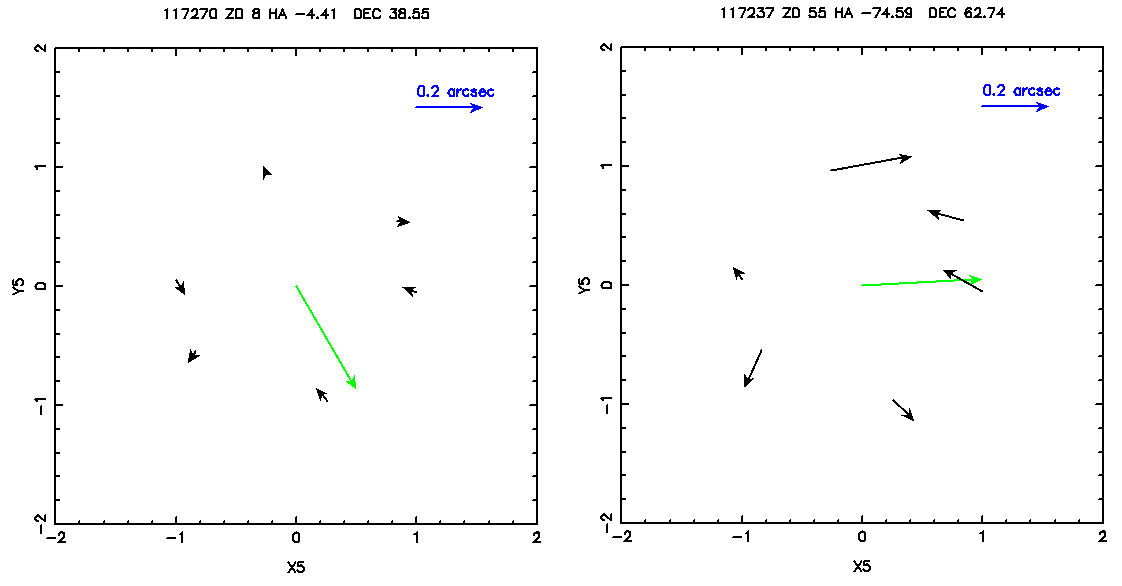
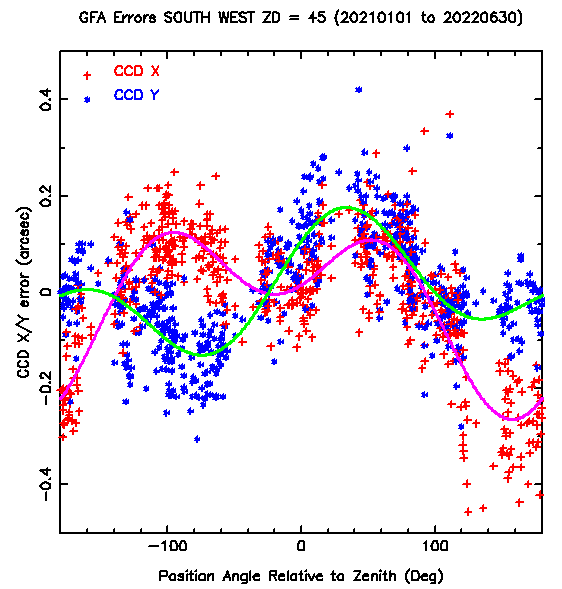
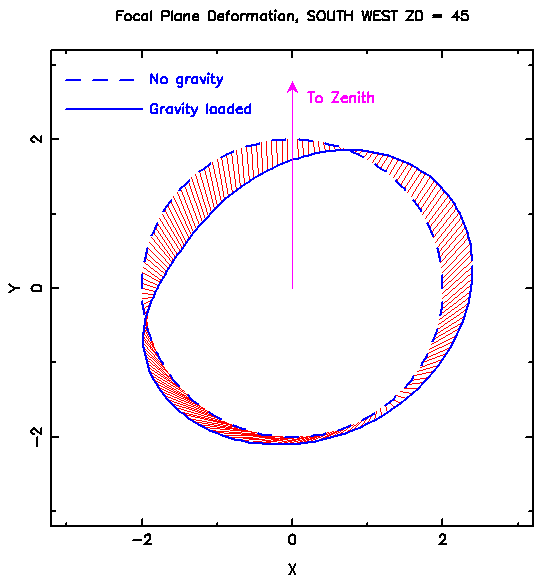
Finite element analysis models predict that the focal plane will deform due to gravity as the telescope moves away from the zenith (Miller et al., 2023). Analysis of astrometric solutions for a large number of fields at different locations in the sky does, indeed, show such an effect. Figure 6 shows the astrometric residuals averaged over each GFA for two fields: one near the zenith, showing essentially no systematic offsets, and the other at a zenith distance of 55 degrees, where the residuals are large and systematic. Figure 7 shows the astrometric residuals as a function of position angle with respect to zenith for a set fields in the SW part of the sky at a zenith distance of 45 degrees. The large systematic trends are obvious, with a peak amplitude of up to 0.3 arcsec. A sinusoidal model has been fit to each of the CCD X and Y directions with terms that are a function of both and . The coefficients of these terms were then fitted as a function of zenith angle, with four different sets used for the NW, NE, SW, and SE quadrants of the sky. Figure 8 illustrates the distortion pattern for one particular field.
Corrections for deformation are applied to the GFA locations before performing the astrometric solutions. The model manages to reduce the impact of deformation by about a factor of two, although not eliminating it completely.
5 FVC Astrometric Calibration
Targets in a particular field are selected and assigned to specific positioners in advance. The layout assumes that the direction of ICRS North has a particular position angle with respect to the focal plane CS5 Y direction (this value being chosen to account for precession at an epoch near the midpoint of the survey). The target list is input to PM, which then converts the target positions to apparent tangent plane coordinates using the same steps as were used for the astrometric standards. These coordinates are then converted to focal plane locations using the as-built optical model, and the positioners are commanded to go to these locations in an open-loop fashion. The petal controllers then report back the estimated location of the positioner, accounting for any disabled or otherwise malfunctioning positioners.
The FVC takes images of the DESI focal plane with fiducials and/or positioner fibers back-illuminated (Fig. 9) and analyzes them using a software program spotmatch (SM). In order for SM to function it needs to be provided with a list of approximate guesses at the locations in the image of each “spot” or array of spots from each device, at which point it is able to identify the complete pattern and return the original list augmented with the precise pixel location of each spot. PlateMaker runs a separate procedure to prepare this list. It first receives as input from the ICS a list of all fiducials that are operational and the list of positioners with their actual locations. It then converts them to pixel coordinates, making use of the optical model of the telescope and an optical model of the FVC camera. The predictions account for demagnification from the DESI focal plane to the FVC CCD and rotation due to the hexapod; SM itself can account for any overall translation of the field. The predicted positions are generally accurate to 1-2 pixels.
Once PM receives back the list of fiducials and positioners with pixel coordinates, it uses the GIF coordinates, which have known astrometric positions from the GFA astrometric calibration, to solve for an astrometric calibration of the FVC CCD. Because the FVC singlet lens acts essentially as a perfect pinhole camera, the mapping of the sky to the CCD is a gnomonic projection, and the calibration consists of determining a field center, scale factor, and rotation. At this point PM can now calculate the actual sky position of each positioner fiber, compare it with the desired position, and derive offsets and corrections in focal plane coordinates needed to fine-tune each positioner fiber location. These correction moves are sent back to the ICS and applied. A final FVC image is taken to assess the final set of offsets, which are recorded but not used in another iteration.
The total elapsed time for each iteration of this process is typically 9 seconds and is the dominant contribution to the overall elapsed time for the combined PM processes; however, the overall setup time (including image acquisition times) is still within the 2 minute requirement on setup time for moving among fields closely spaced on the sky (DESI Collaboration et al., 2022).
It should be noted that, as far as PM is concerned, absolute focal plane locations of positioner fibers are not needed. However, they are needed for bookkeeping purposes and for the anti-collision code (which ensures that positioners do not collide when moved) to work. For this purpose, the fiducials are used to determine a mapping from FVC pixels to DESI focal plane coordinates using the optical model, solving each time for the coefficients in the distortion model.
5.1 Turbulence
An effect that turned out to be larger than expected was the impact of air turbulence (a.k.a. “dome seeing”) in the 12 meter column between the FVC and the DESI focal plane, which introduces time-dependent distortion in the spot position locations. While the distortion was expected to be of order 3m (Wang et al., 2014; Silber et al., 2023), at times it can amount to 10m or more. In fact, it is the dominant error in positioning fibers on targets, to the extent that in the worst case the mispositioning causes a spectroscopic exposure to be rendered useless. Example images are presented in Silber et al. (2023).
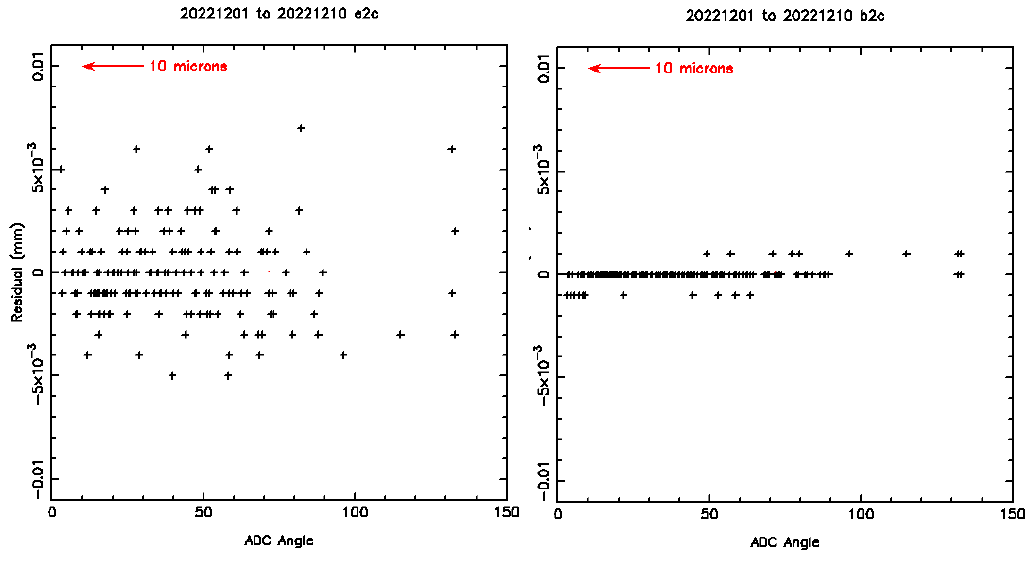
Low-order modes in the turbulence pattern affect the distortion model solutions. In the limit that abolute variations in refractive index are small (), the displacement of a particular spot as recorded on the FVC CCD is given by the gradient of the integral of air density fluctuations along the sight line from the DESI focal plane to the FVC. Thus, the turbulence pattern should affect the curl-free E modes but not the gradient-free B modes of the distortion model. This property is demonstrated in Fig. 10, where the coefficients for a pair of E-mode and B-mode terms from a set of exposures are compared, showing that turbulence does, indeed, impact only the E-modes. A comparable effect was seen in the impact of atmospheric turbulence on the astrometric calibration of the Dark Enery Camera focal plane (Bernstein et al., 2017).
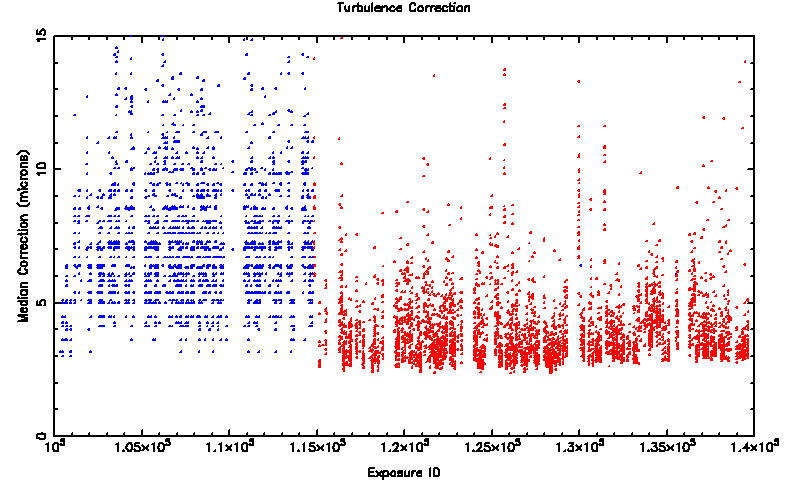
One way to mitigate turbulence would be to take repeated FVC exposures to average out the effect. However, it was discovered that one can use the fiducials and functional fibers in disabled positioners (together, positional references) to calibrate and greatly reduce the impact of turbulence. To do this, one first needs to determine the steady-state undistorted locations of all the references relative to one another. These locations turn out to depend on hour angle and declination and are impacted by the focal plane deformation due to gravity as was described above for the GFA CCD locations.444For reasons that are not entirely understood, a model for focal plane deformation constructed using the positional references and the model constructed from the astrometric calibration residuals differ by up to 7m, implying that the GFA assemblies somehow move relative to the petals on which they are mounted due to gravity. Therefore, an independent model for each positional reference was constructed by taking a series of FVC images with the telescope driven to a selected set of hour angle and declination settings. For these images, the conversion from FVC CCD pixels to focal plane coordinates was performed using the as-designed optical model since the normal transformation derived by PM, which updates the model coefficents, removes some of the turbulence pattern that one is trying to calibrate. Given these steady-state locations, the first FVC image obtained in normal operations (after the open loop positioner moves) is analyzed to determine the turbulence pattern, which is then removed before computing the correction moves. The process is then repeated for the second FVC image after the correction moves are applied. The residual errors in positioner locations after the correction move are considerably reduced by this turbulence correction, and median 2-D values are typically of order 4m (Fig. 11).
5.2 Lens Polishing and Homogeneity Errors
The FVC images only a small portion of the beam from a back-illuminated fiber, centered on the chief ray. While the astrometric calibration procedure accounts for any offsets of the chief ray from the centroid of the imaged beam due to the as-designed corrector, it does not account for any offsets introduced by imperfections in the corrector optics, and in particular those due to polishing errors on the lens surfaces and inhomogeneities in the glass refractive indices. It can be noted that Wang et al. (2014) found it necessary to outfit the Subaru telescope metrology camera with a 110 mm aperture lens in order to reduce the impact of high spatial frequency polishing errors in the Subaru prime focus corrector.
Detailed requirements on polishing errors, divided into low, medium and high spatial frequency ranges, were specified for each surface of each lens at the time of fabrication (Miller et al., 2023). The values actually achieved were roughly a factor 2 better than the requirements. A detailed analysis suggests that these errors will introduce offsets in the chief ray relative to the centroid of order 3m rms 1-D. A related analysis based on measurements of the glass inhomogeneities suggests an additional contribution from this cause of about 2m for lenses C1-C4 and the ADCs.
One feature that has proven to be more problematic is a “divot" introduced by a machining error on the aspheric surface of lens C3. This feature has a diameter of approximately 50 mm and a depth of about 1m. Since the FVC beam size is only 1.8 mm at this surface (compared to the overall beam size of 256 mm), the FVC positions of about 35-40 fibers are impacted, introducing larger positioning errors and reduced throughput. So far the errors introduced by this feature remain uncorrected.
5.3 Updates to GFA Metrology - II.
It was mentioned in section 4.4 that the positions of the GFAs relative to one another can be measured quite accurately, but that there is still an ambiguity in overall scale factor, rotation angle, and offset relative to focal plane coordinates because these cannot be determined from astrometry alone. However, the GIFs, which are calibrated both astrometrically and via laboratory metrology, provide an absolute tie to focal plane coordinates, and the FVC images are used to provide these missing calibration constants.
5.4 Updates to GIF Metrology
The GIFs are used to transfer the astrometric calibration from the GFA CCDs to the FVC CCD. Due to errors in the GIF metrology, there are still systematic residuals in the GIF positions relative to one another as is seen in their residuals from the FVC CCD astrometric calibration. The GIF metrology was revised so that the relative GIF positions are placed on a self-consistent system while the overall astrometric calibration was unchanged. It can be noted that the corrections to the relative GIF positions, when transformed astrometrically to the focal plane, were also measured by the FVC images; these latter measurements were left to provide a cross-check on the first set of revisions.
The internally consistent GIF metrology could still have an overall external systematic offset in location relative to the GFA CCDs that would not be captured by either the astrometric calibrations or the FVC images. Any such offset will be dealt with in the next section.
5.5 Split Exposures
For fields requiring long exposures, changes in differential refraction due to changes in parallactic angle and/or zenith distance can cause targets to become misaligned with their fibers, by up to half an arcsecond in the worst cases. Rather than conduct a complete new field acquisition, a mode has been implemented that predicts the changes in fiber positions due to changes in refraction and to any new ADC setting that is required and determines the relative adjustments needed to each fiber positioner and to the guide stars. These adjustments are applied open loop. The largest uncorrected effect turns out to be that of field rotation. At present it is simply monitored after that fact using the guide star measurements, although active feedback is planned for the future.
6 On-Sky Dither Tests
While the stellar astrometric calibrations are quite accurate internally (rms errors much smaller than a fiber diameter), the tie of the focal plane to the sky still has an unknown uncertainty due to the indirect manner in which the tie was established. The tie could not be verified directly due to the lack of any positioners with coherent imaging capability. Thus, it was found necessary to conduct additional tests to better measure any residual errors in the transformations and, if necessary, apply corrections.
The technique that was found to work best (DESI Collaboration et al., 2022) was to observe a field of bright stars and take a set of 13 exposures, first with the fibers placed at the nominal positions of the stars, and then with random offsets (“dithers”) applied in each of and , with each offset drawn from a Gaussian distribution of 1-. The throughput of each star was determined from spectroscopic exposures in each of the B, R, and Z channels. The telescope was actively guided during each exposure. In essence, what the dithering accomplished was to measure the throughput of a star at a grid of locations offset from the nominal target position, allowing the determination of the offset that gave the maximum throughput. In practice such a test performed on a single star would suffer from the effects of misguiding, seeing variation, and transparency variation. By observing a large number of stars with positions that were dithered independently of one another, these effects could be disentangled from each other and from those due to individual positioner offsets.
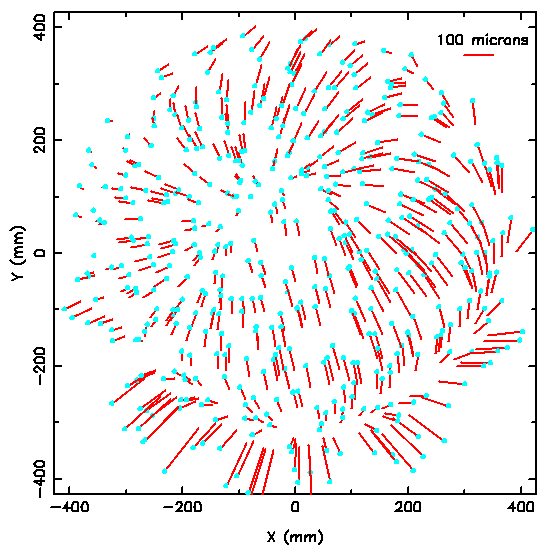
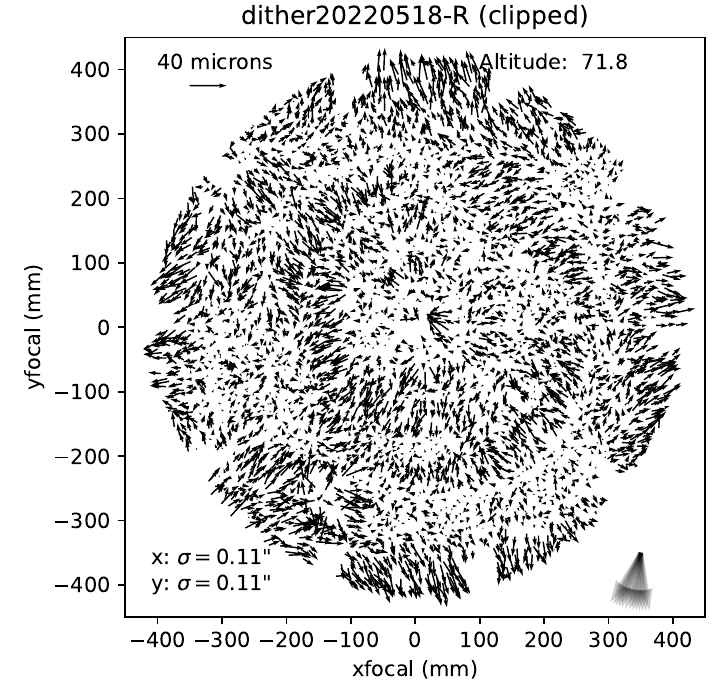
Having measured the residual distortion in the PM optical model, the “quiver” pattern (Fig. 12) was fit with the same type of model as is used to map the FVC CCD to the focal plane. The largest term is an E mode with amplitude 56m; there is also a B mode term with amplitude of 14m. While the origin of these terms is not known for sure, it is equivalent to a tilt of the FVC CCD with respect to the DESI focal plane of about 25 arcminutes.
The pattern made with the R channel data is applied as a correction to the predicted target position by PM. Subsequent dither tests show that the residual rms 1-D positioning error is of order 8m (Fig. 13). The known contributions from lens imperfections (3 m from polishing errors, 2m from glass inhomogeneities), and uncorrected dome turbulence plus spot centroiding errors (4m) account for perhaps 5m or 6m of this error. (For reference, the original allocation to overall fiber lateral positioning error was 7.8m 1-D or 11m 2D, which means that this requirement is, indeed, being met.)
The quiver pattern exhibits some high order behavior that is not included in the model and has the rough appearance of what might be expected from polishing errors and/or glass inhomogeneities in the corrector optics, although this conjecture has not been verified. Overall, the pattern and the overall centering possibly show some dependencies on time and zenith angle, but these dependences are at the threshold of detection and are not yet well quantified.
A byproduct of the dither tests is that it is possible to detect any asymmetry in the geometry of the FVC CCD, particularly a difference in scale factor in the row and column directions. In the event, no such asymmetry is seen at the level of a few ppm.
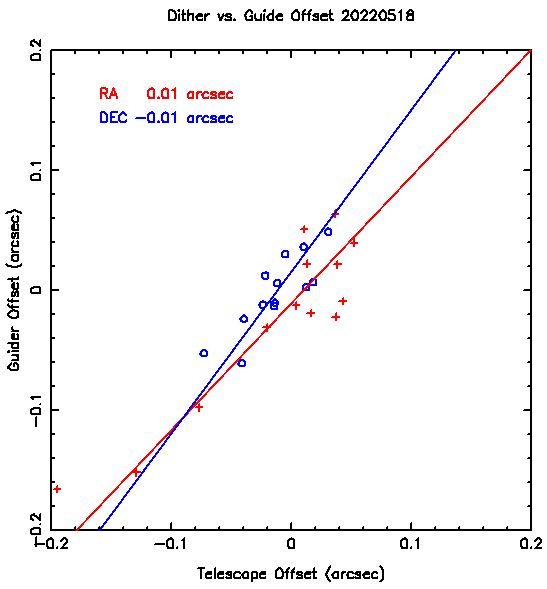
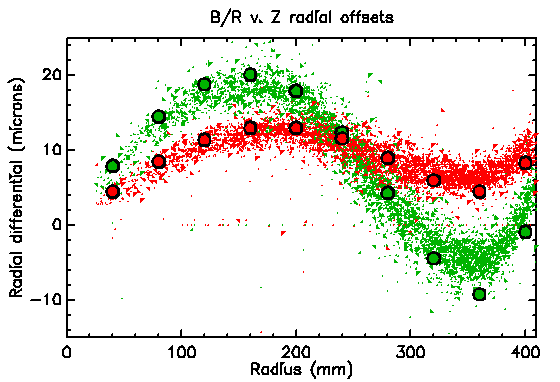
A couple of cross-checks can be done to demonstrate that the dither tests are functioning properly. First, the dither analysis determines, among other things, the offset in the field center from one exposure to the next. These offsets should be reflected in the guide star offsets measured using the guide CCDs at the same time. Figure 14 shows such a comparison, demonstrating that the mean field offset does, indeed, match the guide star offset. Additionally, there is no systematic offset between the two measures, meaning that the field is properly centered on the fibers if the guider error is zero. (This result also demonstrates that there is no remaining systematic offset in the GIF metrology system.) Second, the corrector is not perfectly achromatic, so the radial variation in positioner offsets among the three channels should match that predicted by the optical model. Figure 15 shows this comparison as well.
7 Off-Sky Operation
The FVC is used frequently to image the focal plane without being on-sky, most commonly to study positioner performance. PM is used to analyze these images and, depending on what tests are being done, supports multiple modes of operation.
7.1 Initial calibration
PM normally relies on spotmatch to identify and measure the locations of fiducials, but doing so relies on having an approximate mapping of FVC pixels to the focal plane, which is not known initially. Thus, PM has its own code to identify the spot patterns of fiducials. A single FVC image of the back-illuminated fiducials is obtained. 5 of the 12 fiducials on each petal are located along an arc near the edge of the focal plane, and these can be distinguished from the others. One petal has an extra fiducial along this arc for symmetry breaking. This extra fiducial is identified with an automated algorithm, and once done, the initial mapping to the focal plane can be determined in a straightforward fashion.
7.2 Petal Offsets
The focal plane is assembled from 10 individual petals, and, when these are assembled, there are small offsets that are not known in advance. A set of 10 FVC images of the backlit fiducials is obtained, and a solution is obtained for the focal plane distortion with three additional calibration coefficients enabled for each petal - two for offsets and one for rotation about the nose of the petal. A global constraint is imposed that the average of all offsets and rotation be zero. This process is operationally how the CS5 system is defined. Once these extra coefficients are determined for each petal, they are kept frozen so as to reduce the number of degrees of freedom in the measurement of distortions during normal operations.
The rms residuals after fitting a distortion model to fiducials measured in a typical FVC image are about 16m rms 1-D. These errors are presumably due to errors in the laboratory metrology of the fiducial prior to petals being delivered to the telescope. One could average together many measurements and improve the internal consistency of the petal metrology, although this process has not been found to be essential yet.
7.3 SPOTS for turbulence calibration
The turbulence calibration relies on knowing the relative positions of each fiducial or non-operational positioner, but their absolute location in the focal plane is not needed (nor is it known a priori for the positioners). Instead, a series of FVC images are averaged to get the coordinates empirically. In practice, the coordinates will also depend on the ADC settings and thus telescope position on the sky. Further, there may be focal plane deformation due to gravity. Therefore, a program termed “SPOTS" was created in which a large number of FVC images is obtained over a range of hour angles and declinations. The pixel coordinates of each fiducial and positioner fiber are transformed to the focal plane using the as-built optical model, and each coordinate is modeled as a constant plus a polynomial dependence on hour angle and declination; the data are used to constrain the coefficients of this model.
7.4 Laboratory Tests
Two spare petals were set up for conducting tests at LBL in a clean room. A separate FVC was provided for these tests. Several modifications were needed to PM to map FVC images to each petal.
-
•
There is no optical corrector, so a set of files to define an optical model with no power was created.
-
•
The focal surface of the petals is an asphere and is viewed at a finite distance, which means that there is quite a bit of “distortion” in mapping FVC pixels to the focal surface.
-
•
The petals and FVC could be moved about, so procedures were developed to redetermine basic calibration constants (position angle and demagnification) more easily.
8 Focal Plane Stability
PM generates a large amount of diagnostic information that can be used to look for trends or uncover problems in the hardware. The following are a few examples.
-
1.
The relative astrometric locations of the GFAs are measured for each acquisition image, and long-term trends are monitored. A simple diagnostic involves monitoring the rms errors in astrometric solutions for fields near zenith for degradation over time. No such degradation has been seen thus far.
-
2.
The rms errors in astrometric calibration of the FVC images are measured at the same time. No significant trends have been noticed.
-
3.
The rms errors in FVC to focal plane mapping are tracked. These have been stable over time.
-
4.
The rms errors in the GIF to focal plane calibration are tracked. These have been stable over time.
-
5.
The dependence of various calibration coefficients vs. telescope temperature are tracked. As an example, Fig. 16 shows the dependence of the FVC scale factor on telescope temperature. The slope is about K-1. This value is several times greater than the temperature coefficient of either silicon or BK7 glass (both in physical dimension and refractive index) and likely arises from thermal expansion of the aluminum structure holding the FVC and lens (without refocusing). By contrast, the GFA astrometric scale factor shows no particular dependence on telescope temperature, which is consistent with the focal plane being thermally controlled (and kept in focus).
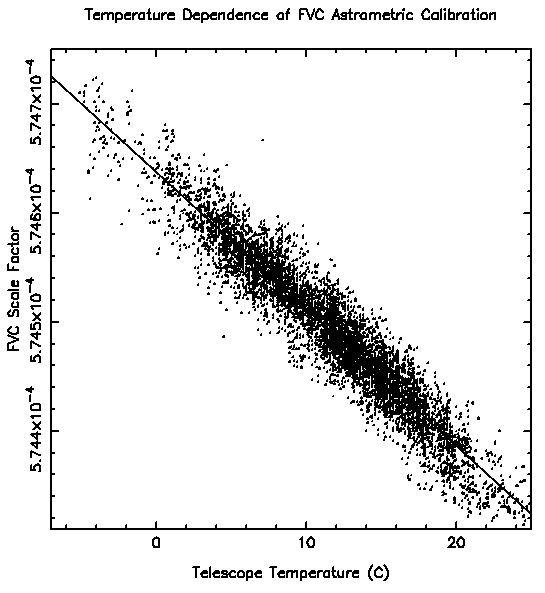
Figure 16: Temperature dependence of the FVC astrometric scale factor. Scale factor is in units of angular degrees per FVC pixel.
9 Conclusions and Lessons Learned
The DESI astrometric calibration systems and processes have demonstrated that fiber positioning can be achieved repeatably and reliably with an accuracy of 8m 1-D (11m 2-D), which meets the DESI requirement for lateral positioning error.
Future large spectroscopic surveys currently being discussed may possibly make use of a fiber view camera system of some sort, and the DESI experience may provide some guidance as to their design and implementation. In case it might help, the following are some lessons learned from the DESI experience:
-
•
Ensure that the end-to-end astrometric calibration process is fully defined at an early stage. In DESI, initial planning focused on mapping distortion in the corrector optics using the FVC along with the fiducials, but not enough attention was paid to mapping from the focal plane to the sky or the FVC to the sky. The initial error budget omitted several contributions that were important while including other contributions that were unimportant. Requirements on the performance of the optical corrector did not account for the fact that the FVC images only the chief ray from a back-illumnated fiber, which is affected most by high frequency components of the polishing error budget.
-
•
Provide a direct mechanism to connect the focal plane to the sky. In the case of the Sloan Digital Sky Survey (Owen et al., 1998), this connection was accomplished by using coherent fiber bundles that were positioned in holes drilled in a plug plate identical to the holes used for positioning target fibers. These bundles were distributed throughout the focal plane. In the case of the 2dF instrument at the Australian Astronomical Telescope (Lewis et al., 2002), a focal plane imaging system is used, including a type of coherent imager that utilizes a cluster of fibers, but only 4 are available and are normally placed at the edge of the field. Coherent imagers require different routing for their fibers than for the target fibers, which would have been difficult for DESI and accounts for why they were not used.
-
•
Include a sufficient number of fiducials in the focal plane to allow for monitoring and correction of turbulence. DESI started with only 113 such fiducials, whereas of order 300 or more are needed.
10 Acknowledgements
The authors would like to thank Michael Lampton, Tim Miller, and Charlie Baltay for many useful discussions. The DESI collaboration and the authors in particular are indebted to the late Michael Lampton for his many contributions to the success of this project and mourn his passing.
This work was produced, in part, by Fermi Research Alliance, LLC under Contract No. DE-AC02-07CH11359 with the U.S. Department of Energy.
This material is based upon work supported by the U.S. Department of Energy (DOE), Office of Science, Office of High-Energy Physics, under Contract No. DE-AC02-05CH11231, and by the National Energy Research Scientific Computing Center, a DOE Office of Science User Facility under the same contract. Additional support for DESI was provided by the U.S. National Science Foundation (NSF), Division of Astronomical Sciences under Contract No. AST-0950945 to the NSF’s National Optical-Infrared Astronomy Research Laboratory; the Science and Technology Facilities Council of the United Kingdom; the Gordon and Betty Moore Foundation; the Heising-Simons Foundation; the French Alternative Energies and Atomic Energy Commission (CEA); the National Council of Science and Technology of Mexico (CONACYT); the Ministry of Science and Innovation of Spain (MICINN), and by the DESI Member Institutions: https://www.desi.lbl.gov/collaborating-institutions. Any opinions, findings, and conclusions or recommendations expressed in this material are those of the author(s) and do not necessarily reflect the views of the U. S. National Science Foundation, the U. S. Department of Energy, or any of the listed funding agencies.
The authors are honored to be permitted to conduct scientific research on Iolkam Du’ag (Kitt Peak), a mountain with particular significance to the Tohono O’odham Nation.
For more information, visit https://www.desi.lbl.gov/.
This work has made use of data from the European Space Agency (ESA) mission Gaia (https://www.cosmos.esa.int/gaia), processed by the Gaia Data Processing and Analysis Consortium (DPAC, https://www.cosmos.esa.int/web/gaia/dpac/consortium). Funding for the DPAC has been provided by national institutions, in particular the institutions participating in the Gaia Multilateral Agreement.
11 DATA AVAILABILITY
All data points shown in the published graphs are available in a machine-readable form at https://doi.org/10.5281/zenodo.8302266.
References
- Baltay et al. (2019) Baltay, C. et al. 2019, PASP, 131, 5001.
- Bernstein et al. (2017) Bernstein, G. B. et al. 2017, PASP, 129, 4503.
- Brown et al. (2018) Brown, A. G. A., Vallenari, A., Prusti, T. et al., 2018, A&A, 616, A1
- DESI Collaboration et al. (2016a) DESI Collaboration, Aghamousa, A., Aguilar, J., et al., 2016a, arXiv:1611.00036
- DESI Collaboration et al. (2016b) DESI Collaboration, Aghamousa, A., Aguilar, J., et al. 2016b, arXiv:1611.00037
- DESI Collaboration et al. (2022) DESI Collaboration, Abareshi, B. Aguilar, J., et al. 2022, AJ, 64, 207.
- Kent (2018) Kent, S. M. 2018, PASP, 130, 4501
- Levi et al. (2013) Levi, M., Bebek, C., Beers, T., et al. 2013, arXiv:1308.0847
- Lewis et al. (2002) Lewis, I. et al. 2002, MNRAS, 333, 279
- Limmongkol et al. (1993) Limmongkol, S., Owen, R. E., Siegmund, W. A. & Hull, C. L., 1993, ASP Conf. Series, 37, 127
- Miller et al. (2023) Miller, T. et al. 2023, arXiv:2306.06310, submitted to AJ
- Owen et al. (1998) Owen, R. et al. 1998, ASP Conf. Series, 152, 98
- Schlafly et al. (2023) Schlafly, E. et al. 2023, arXiv:2306.06309, submitted to ApJ
- Silber et al. (2023) Silber, J. H. et al. 2023, AJ, 165, 9
- Wang et al. (2014) Wang, S-Y et al. 2014, Proc. SPIE, 9147.
- Zhao & Burge (2007) Zhao, C., & Burge, J. H. 2008, Opt. Expr., 16, 6586
- Zhao & Burge (2008) Zhao, C., & Burge, J. H. 2008, Opt. Expr., 21, 31430