[ auid=000, bioid=001, degree=PhD, orcid=0000-0001-5193-6560] \cortext[c]Corresponding author \creditConceptualization, Methodology, Software, Validation, Formal analysis, Investigation, Project administration, Data Curation, Writing - Original Draft, Writing - Review & Editing, Visualization, Supervision
Software, Validation, Investigation, Data Curation
[orcid=0000-0001-5629-6275] \creditMethodology, Formal analysis,Writing - Review & Editing, Visualization
[orcid=0000-0002-1249-4760] \creditProject administration, Data Curation
[orcid=0000-0003-0768-6386,degree=PhD] \creditMethodology, Writing - Review & Editing, Supervision
[orcid=0000-0002-7143-1823, degree=PhD] \creditConceptualization, Writing - Review & Editing, Supervision
eee]organization=School of Electrical and Electronic Engineering, Nanyang Technological University,addressline=50 Nanyang Avenue, city=Singapore 639798, country=Singapore
[1] \tnotetext[1]The research protocols used in this research were approved by the institutional review board of Nanyang Technological University, Singapore [IRB-2021-386].
Anti-noise window: subjective perception of active noise reduction and effect of informational masking
Abstract
Reviving natural ventilation (NV) for urban sustainability presents challenges for indoor acoustic comfort. Active control and interference-based noise mitigation strategies, such as the use of loudspeakers, offer potential solutions to achieve acoustic comfort while maintaining NV. However, these approaches are not commonly integrated or evaluated from a perceptual standpoint. This study examines the perceptual and objective aspects of an active-noise-control (ANC)-based "anti-noise" window (ANW) and its integration with informational masking (IM) in a model bedroom. Forty participants assessed the ANW in a three-way interaction involving noise types (traffic, train, and aircraft), maskers (bird, water), and ANC (on, off). The evaluation focused on perceived annoyance (PAY; ISO/TS 15666), perceived affective quality (ISO/TS 12913-2), loudness (PLN), and included an open-ended qualitative assessment. Despite minimal objective reduction in decibel-based indicators and a slight increase in psychoacoustic sharpness, the ANW alone demonstrated significant reductions in PAY and PLN, as well as an improvement in ISO pleasantness across all noise types. The addition of maskers generally enhanced overall acoustic comfort, although water masking led to increased PLN. Furthermore, the combination of ANC with maskers showed interaction effects, with both maskers significantly reducing PAY compared to ANC alone.
keywords:
active noise control \sepnatural sounds \sepindoor soundscape \sepauditory masking \sepsubjective listening \sepsoundscape augmentation1 Introduction
1.1 Background and Motivation
The emergence of increased public health risks and burden of disease from environmental noise exposure have led to the recent reduction in recommended noise limits by the World Health Organisation (World Health Organization Regional Office for Europe, 2018). This pervasiveness of noise, especially in urban areas, and its myriad of associated severe health risks is akin to being exposed to a "new secondhand smoke" (Fink, 2019). Noise exposure is the most severe in urbanised areas (Basu et al., 2021; Mir et al., 2023) , especially in high-density, high-rise topographies (Yuan et al., 2019). The continued adoption of remote work post-pandemic has brought about renewed impetus and urgency for noise abatement in now dual-function dwellings (i.e. for work and rest).
Environmental noise mitigation is trifold by nature and is most effective at the source, followed by along the propagation path, and finally at the receivers’ end (Lam et al., 2021; European Environment Agency, 2020). Land-scarce, high-density and high-rise urban areas, however, reduce the feasibility and efficacy of traditional noise management measures along the propagation path (e.g. low high-rise efficacy of noise barriers, unavailable land for building setback guidelines) and at the source (e.g. limited airspace) (Lam et al., 2021; Bin et al., 2019). Hence, despite the reduced efficacy, mitigation at the receivers’ end (e.g., windows) plays an increasingly important role in the overall noise management strategy.
[comment=R0.1]However, the path towards sustainable urban development, as outlined in the United Nations General Assembly’s 2015 United National Sustainable Development Goals (United Nations General Assembly, 2015), has brought forth additional challenges in effectively mitigating noise in residential dwellings. One prominent solution is natural ventilation (NV), which has the potential to decrease building energy consumption by up to (Tong et al., 2016; Cao et al., 2016; Spandagos and Ng, 2017; Zhong et al., 2023). The COVID-19 pandemic has further highlighted the importance of NV for infection control and safeguarding public health (Nathalie, 2011; Morawska et al., 2020; Amirzadeh et al., 2023). Nonetheless, the increased emphasis on NV necessitates a trade-off between NV and noise insulation, particularly concerning the openings in the building facade, such as windows. Additionally, research suggests that access to outside sounds as a result of natural ventilation increases the overall sense of contentment content (Torresin et al., 2020). This perception of contentment aligns with the concepts of arousal and eventfulness in the circumplex models of affect (Russell, 1980), and perceived affective quality (International Organization for Standardization, 2019), respectively. The combination of increased contentment and comfort in the presence of outdoor natural sounds creates an engaging environment suitable for both work-from-home scenarios and relaxation (Torresin et al., 2022b). Therefore, it is crucial to implement noise mitigation strategies that preserve NV, thus addressing the inherent trade-off of increased noise when opening windows for NV.
[comment=R2.1]
1.2 Active and passive control strategies for naturally-ventilated façade openings
Of the NV-preserving noise control measures for façade openings (Tang, 2017; Torresin et al., 2019), active noise control (ANC) strategies have demonstrated significant noise reduction performance with minimal impact on airflow (Lam et al., 2021). In contrast to passive control strategies, wherein physical elements (e.g. metastructures (Fusaro et al., 2019, 2020; Pan and Martellotta, 2020), plenum windows (Du et al., 2020; Li et al., 2020)) are used to disrupt the sound waves, ANC utilises active elements (e.g. microphones, processing units) that drive actuator(s) (e.g. loudspeaker) to generate an “anti-noise” wave that destructively interferes with the impinging noise to attenuate it. Recently, proof-of-principle “anti-noise” window systems demonstrated substantial noise mitigation potential on open façade apertures for NV (Lam et al., 2020b, a). The anti-noise window (ANW) employs sensors (e.g. microphones) outside the window to obtain time-advanced information of the impinging noise, and subsequently computes an equal and opposing anti-noise wave that is reproduced from an array of spatially-optimised loudspeakers, resulting in destructive interference (i.e. acoustic attenuation).
[comment=R2.1,
R2.2]While the distinction between active and passive noise control strategies is elucidated in Lam et al. (2021), it is important to recognize their complementary nature, particularly in terms of their efficacy within specific frequency ranges. This relationship is exemplified in ANC headphones, where the sealed earcup provides passive insulation to high frequencies () and ANC effectively attenuates residual low-frequencies (). However, in a recent evaluation of passive metawindows for noise control, it is plausible that the attenuation of high frequencies could potentially heighten perceptual annoyance due to the innate human affinity and sensitivity to sounds within this range (Fusaro et al., 2022; Haapakangas et al., 2020). Therefore, the ANW is aptly suited to mitigate low-frequency urban transportation noise while allowing crucial high-frequency sounds to pass through, such as the melodies of birds and the resonance of human voices. Moreover, active components offer the added benefit of flexibility in control, allowing for selective mitigation of specific noises or programming to enable the passage of important sounds, such as alarms (Shi et al., 2020, 2022, 2023).
1.3 Informational Masking
Noise control measures for façade openings that preserve NV, with active or passive techniques, are still technically challenging and are effective for a limited range of acoustic frequencies (Lam et al., 2021). Hence, active interference techniques – an active sound source that projects audio material to “mask” the noise source – that have been widely employed in office spaces to provide speech privacy could potentially be extended to dwellings (Lenne et al., 2020). Similar to ANC, active interference employs an active sound source to project the masking sounds (“maskers”) and would also allow for NV.
When these maskers overlap spectrotemporally such that the target sound (“noise”) can no longer be audible, “energetic masking” occurs (Brungart et al., 2001; Culling and Stone, 2017). This is akin to the principles in the psychoacoustic masking models employed in audio compression standards (International Organization for Standardization and International Electrotechnical Commission, 1993; Kidd et al., 2008), where only audible sounds are encoded. In contrast, “informational masking” (IM) is a broad categorization of phenomena that result in the reduced audibility of noise even in the absence of spectrotemporal overlap with the maskers (Kidd and Colburn, 2017). With the adoption of the soundscape ISO standard (International Organization for Standardization, 2014, 2018; International Organization for Standardization, 2019), there is increasing evidence showing that IM or augmentation of outdoor urban noise with biophilic maskers positively impacts affect and health outcomes (Buxton et al., 2021; Hong et al., 2020c; Leung et al., 2017; Coensel et al., 2011a; Van Renterghem et al., 2020; Jeon et al., 2010; Li et al., 2022).
Owing to the dependency of the soundscape perception on context (International Organization for Standardization, 2014), however, biophilic maskers that were effective in outdoor urban environments may not be perceived equally in indoor spaces (Torresin et al., 2019, 2020). With limited research on biophilic maskers for indoor soundscapes, the suitability and efficacy of IM as an NV-preserving noise mitigation method in indoor spaces still remain an open question (Hasegawa and Lau, 2021).
1.4 Human perception in noise control
Since both ANC and active interference techniques require similar active elements, they have been integrated to form a class of perceptually-driven ANC techniques. However, perceptual ANC systems are usually based on energetic masking principles to shape the residual audio after ANC to achieve desired perceptual objectives (Kajikawa et al., 2012; Jiang and Li, 2018; Lam et al., 2021). For instance, most of the perceptually-driven ANC systems were designed to meet industrial demand for automobile cabin sound quality (Rees and Elliott, 2006; Patel et al., 2017; Jiang and Li, 2018), and music playback quality in ANC headphones (Belyi and Gan, 2019). With only a single reported instance of integration of ANC with stream sounds to mitigate snoring noise (Liu et al., 2019), the combination of biophilic maskers with ANC remains underexplored, at least for NV indoor spaces.
Due to the widespread adoption of A-weighted SPL [i.e. ] in noise regulations and WHO guidelines, the effectiveness of noise abatement measures is almost always evaluated with -based measures such as insertion loss (IL) and reduction in A-weighted equivalent sound pressure levels (SPL). However, there is growing evidence pointing to the shortcomings of A-weighted SPL in its lack of association with annoyance (Kang, 2017; Lercher et al., 2017), and its underestimation of low-frequency noise and its potential health effects (Araújo Alves et al., 2020; Baliatsas et al., 2016). It is worth highlighting that suppression of low-frequencies in -based metrics also potentially undermines the perceptual benefit of ANC, which is predominantly effective at mitigating low-frequency noise (Cheer and Elliott, 2016). Moreover, the overall annoyance perceived in dwellings is modulated by different noise types (e.g. aircraft, traffic, train) and their interactions that are difficult to be captured in -based metrics (Munzel et al., 2014; Miedema, 2004; Lercher et al., 2017). With the introduction of maskers, an increase in SPL is to be expected, and thus alternative evaluation methodologies that evaluate the overall perception of the acoustic environment, such as the triangulation method in ISO 12913-3, should be adopted (International Organization for Standardization, 2019; Fusaro et al., 2022).
1.5 Research questions
To address the dearth of research regarding the perception of ANC and its interaction with biophilic maskers in indoor soundscapes, this study evaluates the perceptual effects of an ANC-based ANW in mitigating typical urban noise and its interaction with a proposed introduction of biophilic maskers. In particular, the following research questions would be addressed:
-
RQ1.
Does the active reduction of low-frequencies in typical urban noise types by an ANW translate to increased comfort (i.e. perceived annoyance, perceived loudness, perceived affective quality, sentiment) in the context of dwellings?
-
RQ2.
In terms of objective performance and comfort perception, what is the effect of IM with representative biophilic maskers on the ANW in mitigating typical urban noise?
-
RQ3.
In the context of evaluating novel acoustic solutions to improve indoor soundscape, can perceived acoustic comfort be reliably estimated with only objective parameters?
2 Method
2.1 Study site and administration
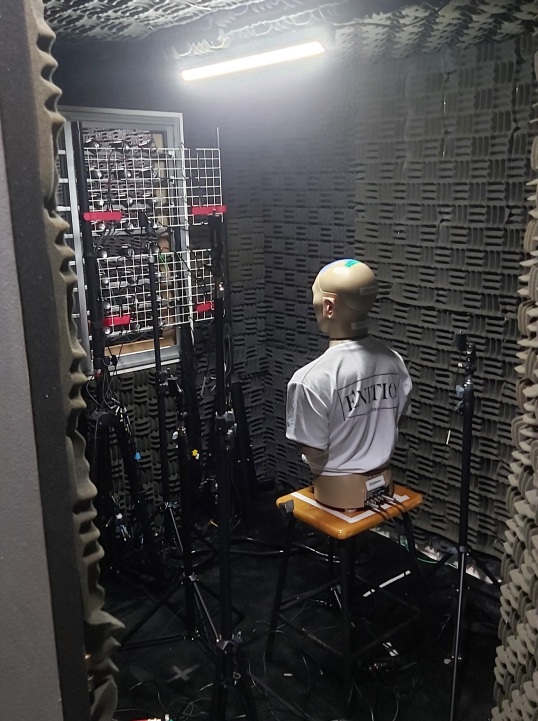
The experiment was conducted in a model bedroom with a fully-opened two-pane sliding window that is housed in a recording studio. The full-sized sliding window was mounted with a security grille, to which the active noise control system was secured. A detailed description of the construction of the model bedroom and the active noise control system can be found in the referenced PhD thesis and prior work (Lam et al., 2020b; Lam, 2019).
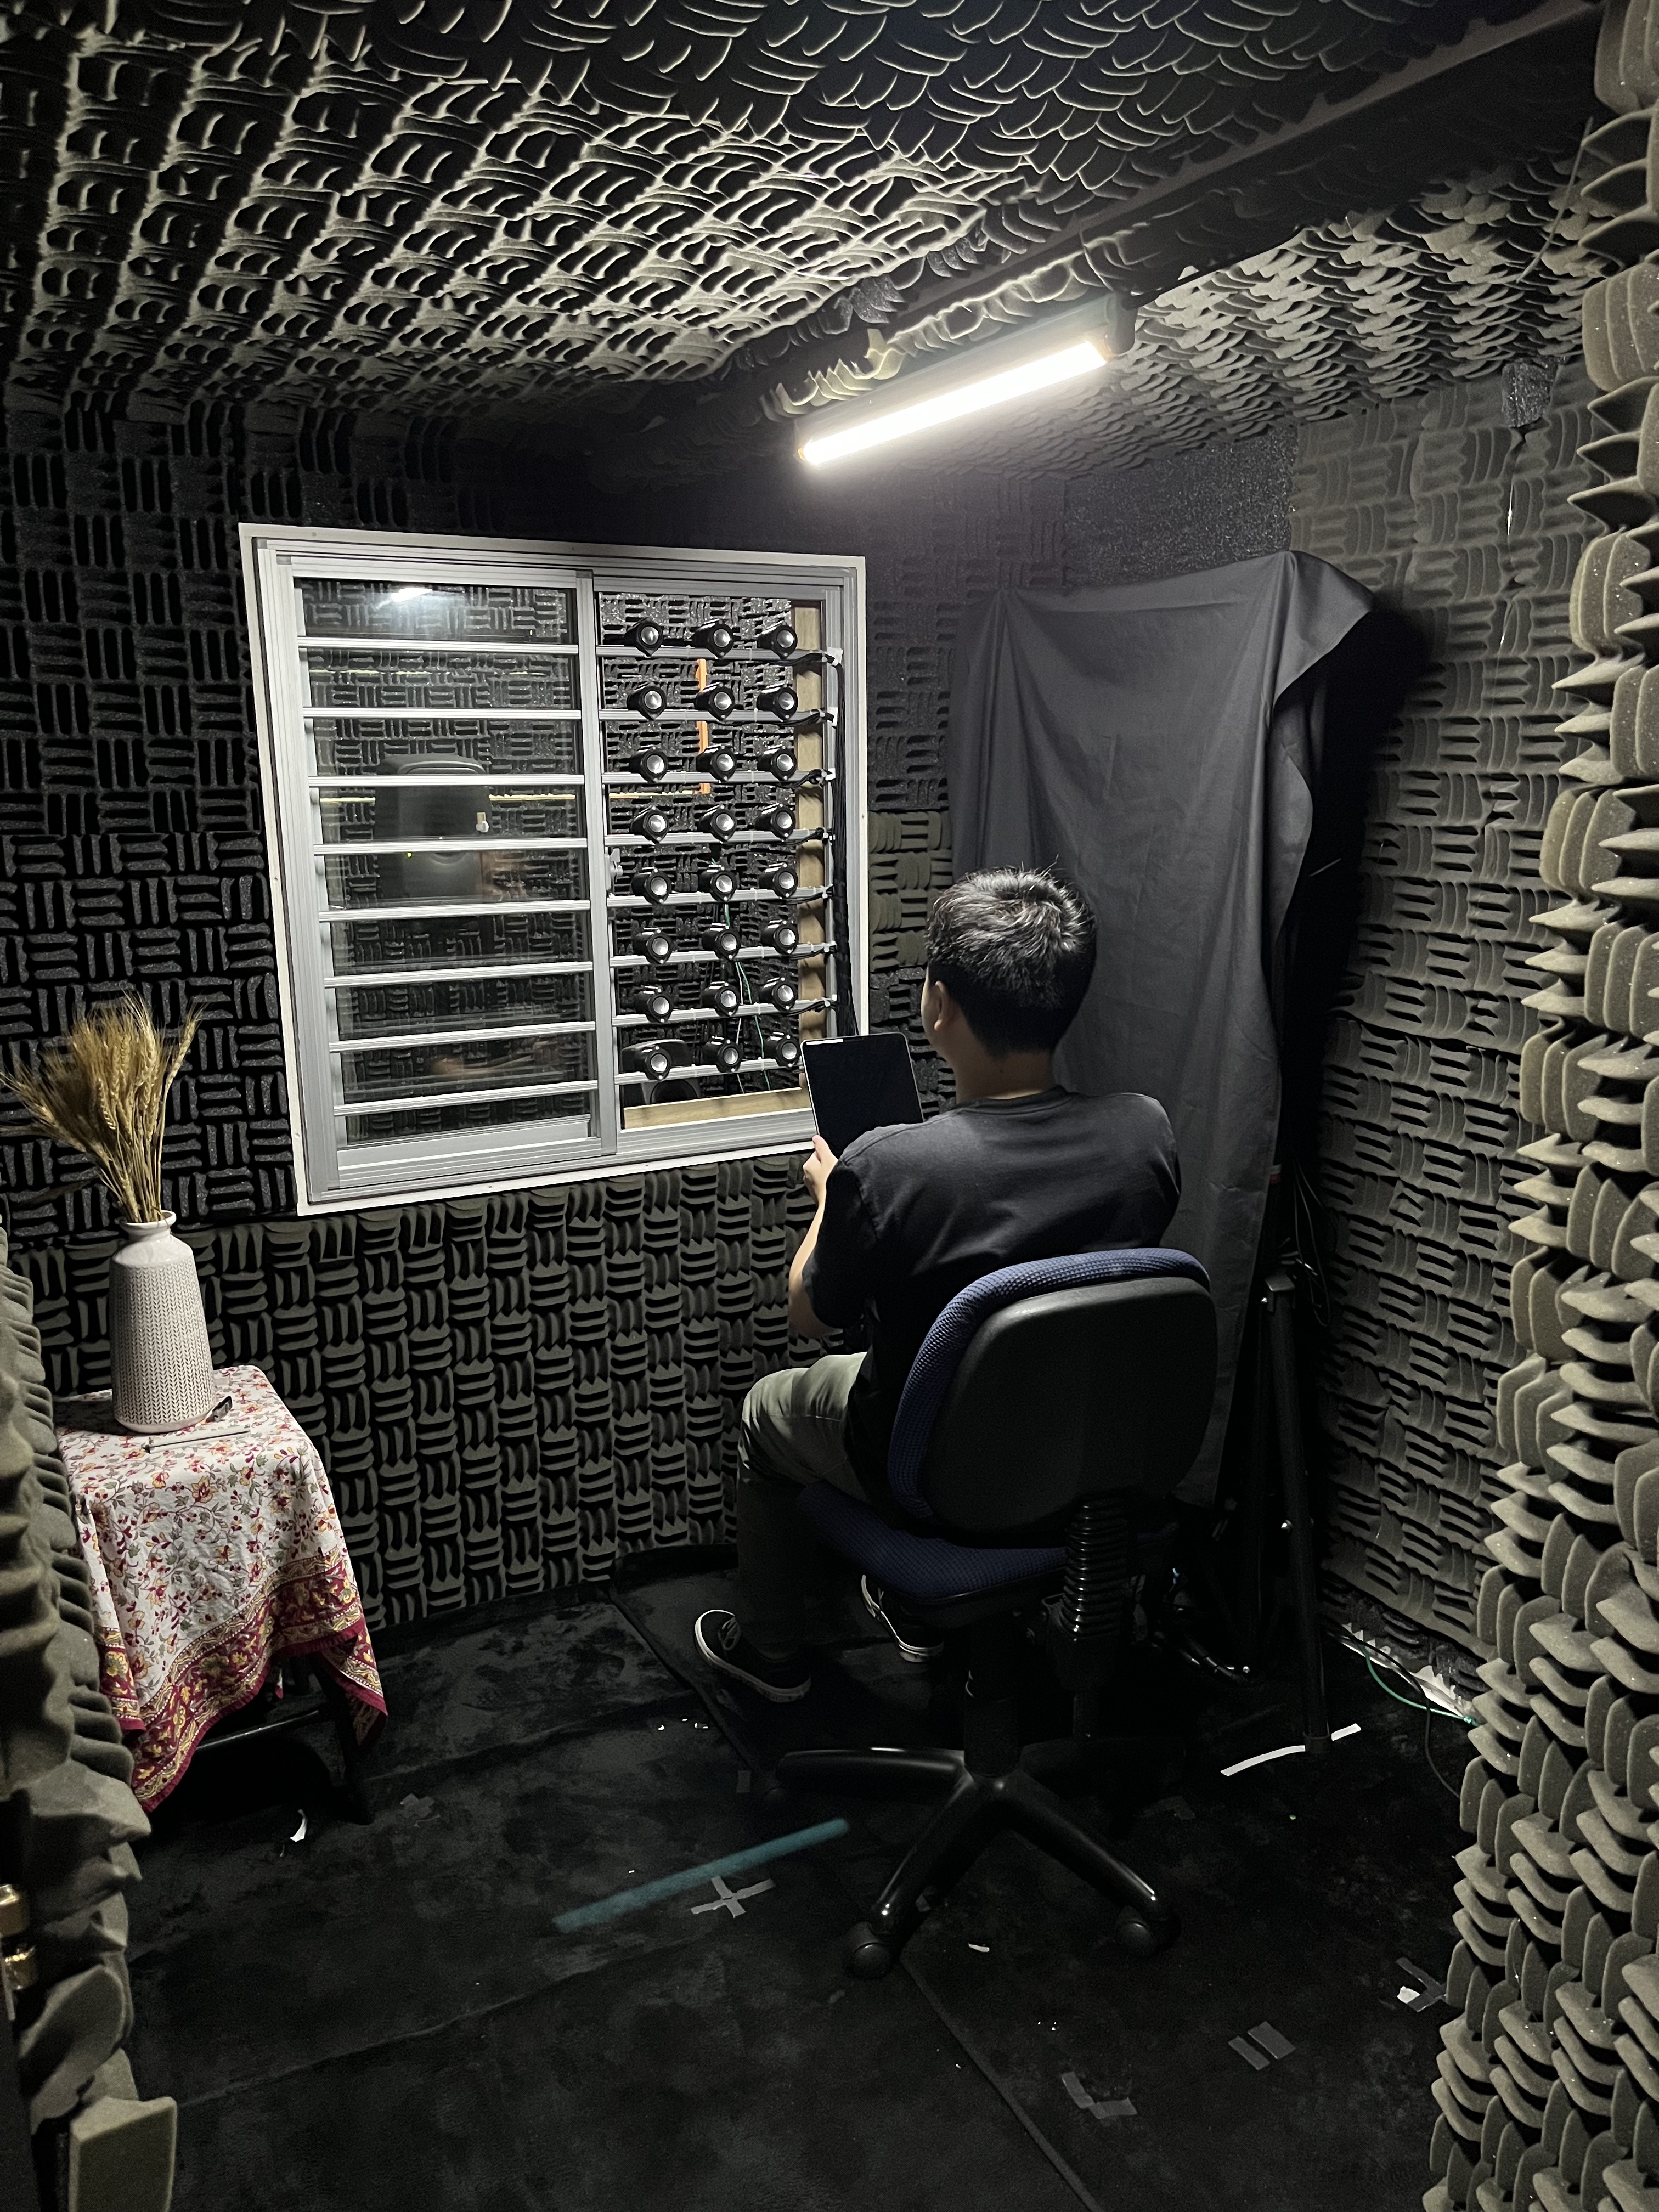
The recording studio was temperature controlled at approximately and significantly isolated from outside noise, with a noise floor of . \chadded[comment=R2.11]To facilitate interaction with the ANW, a custom web-based graphical user interface (GUI; G Web Development Software 2021, National Instruments Corporation, TX, USA) was implemented for the questionnaire. The GUI was presented on an electronic tablet, and an accompanying stylus was provided for more accurate interaction with the input elements, such as moving sliders and handwriting recognition for open-ended input.
Formal ethical approval was obtained from the Institutional Review Board of Nanyang Technological University (IRB 2021-386) before participant recruitment and the conduct of experiments.
2.2 Stimuli
Taking reference from the WHO noise guidelines (European Environment Agency, 2020), three of the most prevalent transportation noise sources (i.e. aircraft, train and traffic) were examined in the local context. For comparability, three stimuli used to evaluate the proof-of-principle anti-noise window prototype was employed in this study (Lam et al., 2020b). The aircraft noise (AIR) was jet-powered and recorded from an apartment window under the landing flight path. Traffic noise (TRA) was recorded from an apartment with direct line of sight (LoS) to a 6-lane expressway in central Singapore. The train noise was from the Mass Rapid Transit (MRT) system and was also recorded from an apartment with LoS to the overground tracks.
[comment=R2.4]Due to recent upgrades to MRT trains and railways, it is worth noting that at the time of recording, the MRT train was traversing an overground stretch of the East–West railway supported by wooden sleepers. The MRT train consisted of electrical multiple unit rolling stock capable of reaching top speeds of , with an average speed of (Lee et al., 2009). The acoustic signature of the MRT train is characterised by a strong tonal component at 700 Hz (see Figure 3 in Lam et al. (2020b)) and typically registers sound pressure levels of around at nearby residential units (Lee et al., 2009).
The ANC was based on the same fixed-filter implementation as in Lam et al. (2020b), where the control filters were pre-trained with the respectively bandlimited (0.1 to ) noise tracks. Unlike the referenced prior study and most ANC studies, unfiltered full frequency bandwidth noise stimuli were evaluated in this study to provide a better approximation of real-world perception. Therefore, the pre-trained filters were subsequently used to control the full bandwidth noise with the anti-noise window prototype (i.e. active control only occurs from 0.1 to in the full-band noise).
To investigate the informational masking effects of natural sounds, two representative biophilic masker types were employed: birdsong and water sound. Both maskers were among the most pleasant birdsong and water sounds as recommended by a masker recommendation system to improve the pleasantness [i.e. formula A.1 in International Organization for Standardization (2019)] of traffic noise (Ooi et al., 2023a). The artificial-intelligence-based autonomous masker selection system was trained on subjective responses to unique soundscapes, which included 56 unique maskers (i.e. birdsongs, traffic, construction, water, wind). The birdsong used in this study was originally retrieved from xeno-canto: “Orchard Oriole (Icterus spurius)” by Matt Wistrand (https://xeno-canto.org/482053) licensed under CC BY-NC-SA 4.0, while the water sound was from freesound: "small fountain" by roman_cgr (https://freesound.org/s/415027/) licensed under CC0 1.0.
A total of 2 ANC conditions (i.e. on, off), 3 noise types (i.e. TRA, MRT and AIR), and 3 masking conditions (i.e. none, water, bird) resulted in stimulus combinations at a noise SPL level of . Additionally, the noise-only conditions across the 3 noise types were evaluated with both ANC conditions at , resulting in an additional combinations. Lastly, a TRA stimulus was introduced as a control and test-retest reliability check. In total, there were 25 unique stimuli generated for this study.
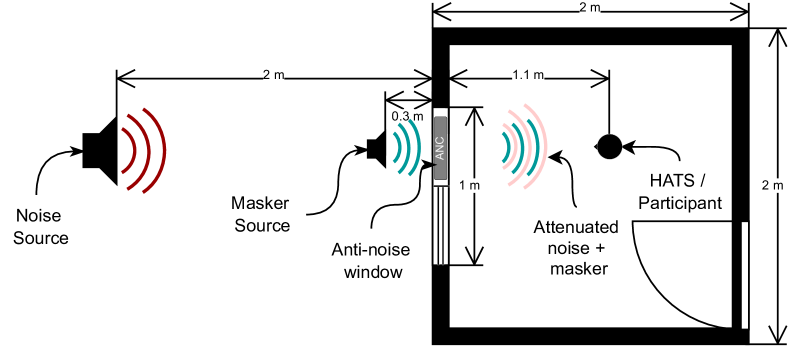
Maskers were set to below the noise levels in the both ANC conditions, as masker-to-noise ratio of was previously found to invoke the greatest positive effect (Galbrun and Ali, 2013; Rådsten Ekman et al., 2015; Hong et al., 2019, 2020c). All stimuli were excerpted or concatenated to , as was chosen for perceptual consistency and to minimize participant fatigue (Zacharov, 2018). All 30-s stimuli were calibrated to the target continuous equivalent A-weighted sound pressure levels, , measured with a calibrated head and torso simulator (HATS) based on energetic average between both ears. The HATS (45BB-5 KEMAR Head and Torso, G.R.A.S. Sound & Vibration A/S, Holte, Denmark) was positioned from the window at the ear height of from the ground, where the listening test participants would be seated, as shown in Figure 1. The calibration was accurate to within via an automated calibration system (Ooi et al., 2021).
For the ease of referencing and for brevity, all decibel, , values shall herein refer to the values unless otherwise specified, wherein frequency weightings are indicated in parentheses, i.e. . Stimuli combinations are also henceforth coded as , where is the noise type (i.e. AIR, MRT, TRA), is the masker type (i.e. B, W, None), is the level of the noise in , and the presence and absence of {∗} reflects whether ANC is present or not, respectively. Hence, the traffic noise stimuli at with ANC and with the bird masker would read: .
[comment=R2.5
R2.6]The noise samples, including traffic, train, and aircraft sounds, were faithfully reproduced using a three-way monitor loudspeaker (8341A, Genelec Oy, Iisalmi, Finland), as shown in Figure 1. This particular loudspeaker boasts exceptional features, including a large wavefront, higher dynamic range, and wider flat frequency response range, effectively emulating the planar waves emitted by environmental noise sources in the far-field, such as those generated by traffic, trains, and aircraft. These planar waves cannot be faithfully reproduced by the commonly employed omnidirectional loudspeakers used in room acoustic measurements. The suitability of the emitted planar acoustic wavefront was previously validated by Lam (2019) using an acoustic camera (Type 9712-W-FEN, Brüel Kjær, Nærum, Denmark).
[comment=R2.5] To mitigate the potential impact of reduced audio fidelity from the small loudspeakers on the ANW, the water and bird maskers were reproduced using two-way monitors (8320A, Genelec Oy, Iisalmi, Finland). The loudspeakers were placed outside the window to emulate sound emitting from the vicinity of the window opening, as illustrated in Figure 1.
2.3 Objective acoustic and psychoacoustic analysis
Objective observation measurements of all stimuli, including those with active noise control activated, were made using the HATS in the same physical orientation as the calibration. Additionally, six microphones (40PH, G.R.A.S. Sound & Vibration A/S, Holte, Denmark) arranged according to ISO 16283-3 for energy-average SPL measurements (International Organization for Standardization, 2016a). hese six microphones correspond to the physical locations of microphones used in a previous study (i.e. microphones 5, 13, 14, 15, 17, and 18 in Lam et al. (2020b)). A total of 8 channels of acoustic data from the HATS and microphones were recorded with two 4-channel data recorders (SQobold, HEAD acoustics GmbH, Herzogenrath, Germany).
To account for sound pressure, temporal and spectral characteristics of the auditory sensation, both acoustic and psychoacoustic parameters were computed from the binaural HATS channels (International Organization for Standardization, 2018). All parameters were calculated as the mean of both binaural channels for consistency with the calibration. The continuous equivalent A- and C-weighted acoustic indicators (i.e. , ) represent the time-averaged sound pressure levels based on the 40-phon Fletcher-Munson “equal loudness” contour, and the approximated 100-phon equal loudness contour, respectively (International Electrotechnical Commission, 2013). Psychacoustic parameters such as loudness (N; International Organization for Standardization (2017)), sharpness (S; German Institute for Standardisation (2009) (Deutsches Institut für Normung)), roughness (R; Ecma International (2020)), tonality based on Sottek’s hearing model (Ecma International, 2019), fluctuation strength (FS; Zwicker and Fastl (2013)), and perceived annoyance (PA; Zwicker and Fastl (2013)) as well as acoustic derivatives (, ) were included to account for temporal and spectral influences on perception. Common summary statistics such as percentage exceedance levels at {5, 10, 50, 90, and 95}, as well as maximum levels were also included (International Organization for Standardization, 2016b, 2018), as summarised in Table 1.
| Indicator | Symbol | Unit | Summary statistics |
| Sharpness | acum | common | |
| Loudness | sone | common - mean | |
| Fluctuation strength | FS | vacil | common - mean |
| Roughness | asper | common | |
| Tonality | tuHMS | common - mean | |
| dB | common | ||
| dB | – | ||
| dB | common | ||
| dB | – | ||
| Psychoacoustic Annoyance | PA | – | – |
2.4 Subjective experimental design
The participants were first required to provide basic demographic information (gender, race, nationality, age range) along with a pre-test assessment of (1) individual noise sensitivity (INS) \chadded[comment=R2.7]via the Weinstein noise sensitivity scale (WNSS; Weinstein (1978)), (2) a baseline noise annoyance (BNA) \chadded[]guided by ISO/TS 15666 (International Organization for Standardization, 2021), (3) Perceived Stress Scale (PSS; Cohen et al. (1983)), and (4) the WHO-Five Well-being Index (WHO-5; World Health Organization Regional Office for Europe (1998)). The pretest questionnaires were selected to assess potential confounding factors such as stress and mood on soundscape perception (Mitchell et al., 2020; Ooi et al., 2023a). The demographic and pre-test assessments took about to complete and their exact wordings are detailed in Section Appendix A in Appendix A.
Since the short-form 5-item WNSS (WNSS-5) (Aletta et al., 2018; Benfield et al., 2014; Zhong et al., 2018) was deemed unreliable for the local Asian context (Lam et al., 2022a), the original 21-item WNSS was adopted \chadded[comment=R2.7]to evaluate the INS in this study (Weinstein, 1978).
The BNA was assessed based on guidelines in ISO/TS 15666. Both the five-point categorical scales (from “not at all” to “extremely”) and the 101-point numeric scale were employed to assess the baseline annoyance of 6 noise typical noise types, namely road traffic, aircraft, mass rapid transit (MRT), construction work (work site), construction work (renovations), any other noises (International Organization for Standardization, 2021).
A shortened 10-item version of the PSS scale (PSS-10) was employed to assess the baseline stress levels of the participants before the listening experiment (Cohen et al., 1983). In addition, the WHO-5 questionnaire assessed the baseline mental wellbeing of the participants (World Health Organization Regional Office for Europe, 1998).
Upon completion of the demographic information and pre-test assessment, a short training session was provided to familiarise the participants with the environment within the chamber [Figure 1], and with the graphical user interface (GUI) and the stylus operation. The GUI is a web application (G Web Development Software, NI, Texas, United States) that interfaces with the LabVIEW-based anti-noise window system in Lam et al. (2020b), along with hosting the listening test questionnaire.
For test-retest reliability, the traffic noise track was evaluated as the first and last stimuli for every participant, whereas the rest of the 24 stimuli combinations were presented in random order to all the participants. The stimuli playback is controlled via the GUI, wherein questionnaire items were hidden from the participants throughout the 30-s stimuli duration. Thereafter, participants were able to repeat the stimuli as many times as required to complete the questionnaire.
Each stimulus was evaluated on its (1) perceived annoyance (PAY), (2) perceived affective quality (PAQ), (3) perceived loudness (PLN), and (4) an open-ended description, as detailed in Section Appendix A. In contrast to the pre-test assessment of annoyance in the absence of acoustic stimuli, the assessment of PAY is directed to the noise in the presented stimulus. Both the 5-point verbal categorical scale and 101-point numerical scale were used for the stimuli evaluation, whereby the question now reads:
\chaddedThinking about the noise you just heard, how much does the noise bother, disturb or annoy you?
[comment=R.10]The usage of both scales follows the recommendations of ISO/TS 15666 for increased reliability (Brink et al., 2016; International Organization for Standardization, 2021). The adoption of the 101-point scale, as opposed to the 11-point scale, was chosen to capture subtle differences. Additionally, a visual analog scale with marked regular intervals was employed for the 101-point scale to increase response precision (Liu and Chen, 2016).
The PAQ attributes proposed in ISO/TS 12913-2 were adopted for a structured evaluation of the affective responses to the indoor soundscape in its entirety, as modified by the stimuli. The PAQ consists of 8 attributes (i.e. eventful, vibrant, pleasant, calm, uneventful, monotonous, annoying, chaotic), which form an octant circumplex model (International Organization for Standardization, 2019). On a 0-to-100 opinion scale, where 0 indicates “strongly disagree” and 100 represents “strongly agree”, the 8 attributes were evaluated through:
For each of the 8 scales below, to what extent do you agree or disagree that the present surrounding sound environment is […]?
where […] is one of the 8 PAQ attributes. \chadded[comment=R.10]The utilization of the 101-point scale in assessing the PAQ attributes aimed to ensure consistency during analysis.
To judge the PLN, a relative magnitude estimation method was adopted (International Organization for Standardization, 2017; Zwicker and Fastl, 2013; Park and Lee, 2017; Torija and Flindell, 2015; Hong et al., 2020b). Participants were instructed to compare PLN of the stimulus under test (SUT) to a reference track. A numerical score is assigned to the stimulus in linear relativity to the reference, which has a modulus score of 100. For instance, if the PLN of the SUT is exactly half as loud as the reference, then the stimulus should be assigned a score of 50. No limits were set on the magnitude estimation scores, and the participants were allowed to repeat the tracks as many times as required. For comparability, the reference tracks were fixed at but were set to the respective noise type of the SUT. The question reads:
This task compares the test track you just heard to a reference track. If the perceived loudness of the reference track is assigned a value of 100, rate the perceived loudness of the test track in comparison with the reference track. For example, if the test track is twice as loud, it should be rated as 200. And if it is half as loud, it should be rated as 50. You are free to listen to the tracks as many times as required
Lastly, an open-ended question was included to capture free-form qualitative assessments of the SUT relative to the reference track, i.e.
Describe the test track in comparison to the reference track in a few descriptive words.
2.5 Participants
A total of 45 participants were recruited through advertisements on online messaging platforms. Before the commencement of the experiment, all participants underwent an audiometric test (Interacoustics AD629). With the exception of one participant, all others had normal hearing for all the frequencies tested (mean threshold of hearing < 15 dB at 0.125, 0.5, 1, 2, 3, 4, 6, and 8 kHz)).
Of the 44 participants who participated in the listening experiment, four participants did not meet the recommended within-subject test-retest reliability score of 0.7. (Wood et al., 2017). Therefore, the analysis included test results from 40 participants. The majority of the participants were between 21 to 30 years old (), while the remaining participants were distributed among age ranges: less than 21 years old (), between 31 and 40 years old (), between 41 and 50 years old (), and more than 60 years old (). The gender distribution was even, with 20 male participants and 20 female participants. More than half of the participants were either Singapore citizens () or permanent residents (), and the rest were foreigners ().
2.6 Data analysis
The acoustic and psychoacoustic indicators were computed with a commercial software package (ArtemiS suite, HEAD acoustics GmbH, Herzogenrath, Germany).
The reliability of the pre-test WNSS, PSS, and WHO-5 questionnaires were evaluated with both the Cronbach’s Alpha () and Mcdonald’s Omega () (Peters, 2014; Dunn et al., 2014), based on polychoric correlations due to the ordinal nature of the Likert scales (Fox, 2019; O’Connor, 2021).
Since both the baseline ISO/TS 15666 annoyance and the stimuli-based PAY was assessed with both a 5-point verbal, as well as a 101-point numerical scale (International Organization for Standardization, 2021), Bland-Altman statistics and plots were employed to determine the agreement, and thus reliability of the annoyance ratings (Martin Bland and Altman, 1986; Brink et al., 2016; Lam et al., 2022b). The three-way ART ANOVA (3W-ART ANOVA) was then conducted with the numerical-scale annoyance as the independent variable, and with three dependent variables (i.e noise type, masker type, ANC condition).
The circumplexity of the PAQ attributes was examined to assess the generality of the PAQ model, particularly for indoor soundscapes (Torresin et al., 2020). This examination involved the randomized test of hypothesized order relations (RTHOR) (RTHOR) (Tracey, 2000), correlation inequality criteria (Locke, 2019), and sinusoidality of the first two PCA loadings (Lam et al., 2022a). Pearson correlation was used for the circumplexity analysis due to the interval nature of the PAQ scales (Freedman et al., 2007). Since the derived Pleasantness (ISOPL) and Eventfulness (ISOEV) from the 8 PAQ attributes were found to be somewhat normally distributed via Mardia’s multivariate normality tests (Mardia, 1970, 1974), a three-way multivariate analysis of variance (3W-MANOVA) was conducted with ISOPL, and ISOEV as the two dependent variables, and masker type (B, W, None), ANC (yes, no), noise type (AIR, MRT, TRA) as the three independent variables. If significant differences were found at significance level, post-hoc univariate three-way ANOVA (3W-ANOVA) tests were conducted for each dependent variable, followed by a pairwise post-hoc Tukey’s honest significant differences (HSD) test with Bonferonni correction.
Loudness estimation was investigated independently for each noise type since the reference track for loudness varied depending on the noise type. Non-normality was detected using Shapiro-Wilk’s test (Shapiro and Wilk, 1965), and a two-way Aligned Rank Transform Analysis of Variance (2W-ART ANOVA) was perfomed with PLN as the independent variable (Wobbrock et al., 2011). The two dependent variables were masker type (B, W, None) and ANC conditions (i.e. yes, no) as the two dependent variables. Posthoc pairwise ART contrast tests with Bonferroni correction for were conducted at significance level (Elkin et al., 2021).
Descriptive comparisons with noise-type dependent reference tracks were examined using sentence-level sentiment analysis (Rinker, 2021). Non-normality was addressed using the 2W-ART ANOVA to examine differences in sentiment scores between masker types and ANC conditions. Posthoc ART contrast tests with Bonferroni correction were performed, similar to the loudness analysis.
All data analyses were conducted with the R programming language (R Core Team, 2021) on a 64-bit ARM environment. Specifically, the analyses were performed with the following packages: 3WANOVA, Tukey’s HSD, and SWT with stats (R Core Team, 2021); Mardia’s multivariate normality tests with MVN (Korkmaz et al., 2014); ART ANOVA and ART contrast with ARTool (Kay et al., 2021); and sentiment analysis with sentimentr (Rinker, 2021).
3 Results
3.1 Pre-test assessment
Surprisingly, the WNSS, WNSS-5, and PSS-10 items showed low inter-relatedness and reliability based on and scores. The full and shortened INS questionnaires had marginal reliability (; ), whereas suppressed scores (, ) signal a violation of -equivalence in both WNSS questionnaires. The WHO-5 scores were reliable without redundancy (, ) (Nunnally and Bernstein, 1994; Cho and Kim, 2015).
Participants were relatively neutral in terms of INS, perceived stress, and general well-being (, , , ; , ; , ), as summarised in Table 2. From the BNA based on ISO/TS 15666, they were most annoyed by renovation noises (, ), followed by worksite construction noises (, ), TRA noise (, ), and AIR noise (, ). MRT noise caused the least annoyance (, ), as shown in Table 2.
| Index | Mean, | SD, |
| 15666 (MRT) | 0.22 | 0.31 |
| 15666 (AIR) | 0.32 | 0.32 |
| 15666 (TRA) | 0.40 | 0.30 |
| 15666 (CON-R) | 0.45 | 0.34 |
| 15666 (CON-W) | 0.54 | 0.33 |
| WNSS-5 | 0.63 | 0.17 |
| WNSS | 0.58 | 0.09 |
| PSS-10 | 0.54 | 0.10 |
| WHO-5 | 0.53 | 0.14 |
3.2 Energy-based assessment of active control and masking
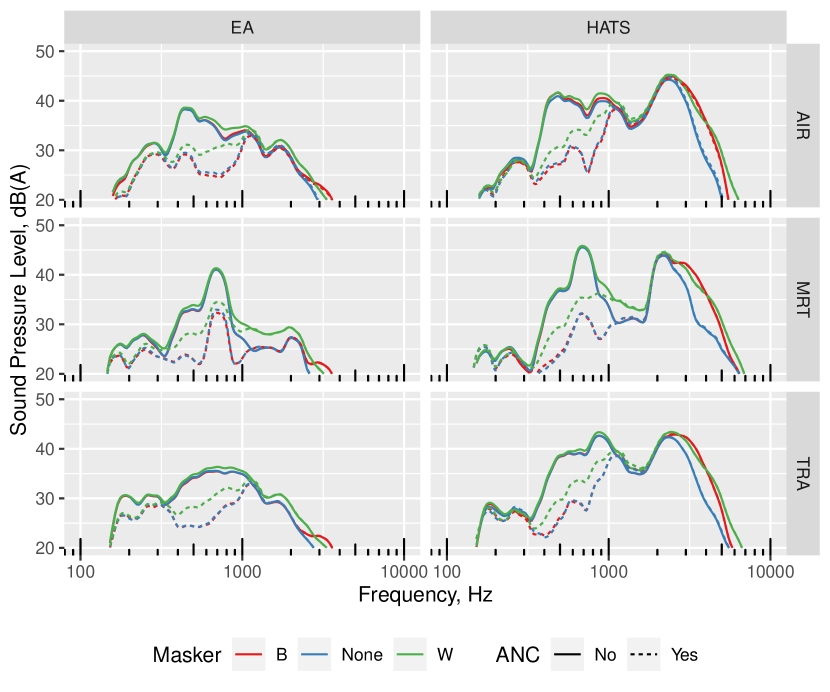
The reduction in sound pressure due to the ANW is evidenced in both the spectral plots of the A-weighted energy-average across 6 microphones, and the binaural energetic average of the HATS, as shown in Figure 2. About reduction was achieved between and across all noise types in both measurement methods. This corroborates with the results that were reported previously (Lam et al., 2020b), and further illustrates that the ANW did not amplify frequencies beyond its control range.
Without ANC, the maskers only slightly increased the sound pressure beyond . With ANC, the broadband water masker slightly increased the SPL between and , as well as beyond , whereas the bird maskers only increased the SPL beyond due to dominant high frequencies. Since the ANW had limited performance below , the C-weighted spectra exhibited similar trends.
3.2.1 Decibel-based assessment of ANC without maskers
Despite about reduction in the frequency spectra between to , decibel-based indicators showed modest attenuation across the full audio bandwidth (i.e. to ) across measurement methods, noise types, and SPL levels, as shown in Table 3. For instance, the EA reduction across all A-weighted indicators (i.e. , , , , , , ) was between , and , across AIR, MRT, and TRA noise, respectively, at and without maskers. The lack of active attenuation below is evidenced in the lower EA reduction across all C-weighted indicators in AIR, MRT, and TRA noise between , and , respectively. Similar trends were observed in the EA A- and C-weighted indicators across the stimuli in the absence of maskers. In contrast, minimal attenuation was observed in the HATS {i.e. , , } and {i.e. , , } indices, across AIR, MRT, and TRA noise types, respectively.
3.2.2 Decibel-based assessment of overall sound levels with a bird masker
The bird masker had minimal impact on EA measurements across all noise types, with maximum increments below in both and , and below across other A- and C-weighted indicators.
Although increments observed in both and HATS measurements were below , modest increments of up to and was observed in the other decibel-based indicators regardless of ANC condition. This discrepancy in the decibel-based indicators associated with temporality could be attributed to the greater emphasis of high-frequencies in the HATS measurements, which models after the increased high-frequency sensitivity of the human hearing system, and also due to the intermittent nature of bird sounds. For instance, the bird masker was 0.93 and louder at and , respectively, with AIR, indicating temporal dominance about half of the time and had the loudest peaks, but not as loud for short time periods; 5.09, 2.38 and louder at , and , respectively with MRT, indicating louder peaks and temporal dominance; and 5 and of the time with TRA, indicating prominent intermittent peaks but a lack of temporal dominance, as shown in Table 3.
3.2.3 Decibel-based assessment of overall sound levels with a water masker
Without ANC, the water masker resulted at most and increments in the EA SPL levels, across all noise types. Nonetheless, the broadband nature of the water masker resulted in up to increment in EA SPL levels at , , with AIR; up to increment in and with MRT; but less than increment with TRA due to spectrotemporal similarities, as shown in Table 3. Increments in C-weighted EA SPL levels in the other indices were at most in , which reflect lesser low-frequency content in water than in all noise types.
The increment in the same set of A-weighted indices from the HATS measurements were substantially greater in AIR [, and ]; and MRT [ and ]. Increment in HATS C-weighted indices were also observed with the water masker in AIR [, and ]; and MRT [ and ]. Similar to the EA measurements, the water masker had minimal impact on A- and C-weighted indices { , } with TRA.
| HATS | Energetic Average | |||||||||||||||||||||||||||||||||||
| Aircraft | MRT | Traffic | Aircraft | MRT | Traffic | |||||||||||||||||||||||||||||||
| ANC:NO | ANC:YES | ANC:NO | ANC:YES | ANC:NO | ANC:YES | ANC:NO | ANC:YES | ANC:NO | ANC:YES | ANC:NO | ANC:YES | |||||||||||||||||||||||||
| 65dB(A) | 70dB(A) | 65dB(A) | 70dB(A) | 65dB(A) | 70dB(A) | 65dB(A) | 70dB(A) | 65dB(A) | 70dB(A) | 65dB(A) | 70dB(A) | |||||||||||||||||||||||||
| B | W | B | W | B | W | B | W | B | W | B | W | B | W | B | W | B | W | B | W | B | W | B | W | |||||||||||||
| -1.62 | -1.73 | 0.16 | -0.86 | -1.36 | 0.65 | -1.69 | -1.87 | 1.02 | -0.92 | -1.16 | 1.09 | -1.46 | -1.68 | 0.82 | -0.89 | -1.13 | 0.80 | -0.45 | -1.29 | 2.29 | 2.41 | 0.60 | 2.68 | -0.26 | -1.62 | 4.13 | 3.74 | 1.20 | 4.32 | -0.18 | -1.11 | 2.75 | 2.44 | 0.92 | 2.74 | |
| -0.93 | -0.49 | 0.15 | -0.77 | -0.34 | 0.19 | -5.08 | -1.51 | 0.84 | -4.81 | -0.72 | 0.84 | -6.74 | -1.98 | 0.83 | -6.58 | -1.42 | 0.90 | -0.07 | -0.14 | 2.95 | 2.88 | 2.66 | 2.98 | -0.31 | -0.97 | 4.97 | 3.38 | 2.32 | 5.16 | -0.59 | -1.46 | 2.95 | 1.25 | 0.44 | 2.86 | |
| -1.47 | -0.52 | 0.40 | -0.98 | -0.13 | 0.47 | -2.38 | -1.20 | 1.00 | -1.96 | -0.47 | 0.97 | -3.50 | -1.74 | 0.86 | -3.21 | -1.22 | 0.83 | -0.17 | -0.35 | 2.31 | 2.29 | 1.79 | 2.39 | -0.20 | -1.20 | 4.22 | 3.82 | 1.96 | 4.34 | -0.20 | -1.03 | 2.89 | 2.34 | 0.98 | 2.85 | |
| -0.77 | -0.54 | 0.41 | -0.23 | -0.13 | 0.47 | -1.93 | -1.21 | 1.04 | -1.42 | -0.43 | 1.03 | -2.95 | -1.70 | 0.85 | -2.59 | -1.18 | 0.82 | -0.17 | -0.44 | 2.41 | 2.43 | 1.75 | 2.49 | -0.16 | -1.26 | 4.12 | 3.82 | 1.83 | 4.24 | -0.16 | -1.00 | 2.86 | 2.45 | 1.01 | 2.82 | |
| -4.04 | -4.53 | 0.48 | -2.37 | -4.27 | 0.93 | -1.07 | -1.62 | 1.24 | -0.13 | -0.80 | 1.27 | -0.49 | -1.65 | 0.78 | 0.30 | -1.09 | 0.76 | -1.52 | -3.80 | 1.95 | 1.47 | -2.78 | 3.06 | -0.23 | -1.51 | 4.15 | 3.85 | 1.43 | 4.29 | -0.18 | -1.13 | 2.68 | 2.43 | 0.88 | 2.68 | |
| -1.03 | -10.31 | 0.89 | 0.50 | -10.14 | 2.04 | -3.27 | -6.30 | 0.61 | -1.90 | -5.99 | 1.11 | -0.34 | -1.67 | 0.84 | 0.53 | -1.08 | 0.81 | -0.31 | -5.08 | 2.93 | 3.06 | -4.24 | 3.59 | -0.62 | -4.13 | 3.73 | 2.86 | -2.71 | 4.18 | -0.15 | -1.19 | 2.75 | 2.58 | 0.92 | 2.74 | |
| -0.12 | -11.32 | 1.17 | 1.41 | -11.16 | 1.98 | -1.45 | -7.38 | 0.80 | -0.49 | -7.06 | 1.23 | -0.28 | -1.62 | 0.85 | 0.59 | -0.97 | 0.82 | -0.05 | -5.33 | 3.07 | 3.27 | -4.54 | 3.58 | -0.17 | -4.48 | 3.68 | 3.47 | -3.25 | 3.93 | -0.10 | -1.14 | 2.78 | 2.64 | 1.01 | 2.77 | |
| -1.21 | -1.40 | 0.72 | -0.05 | -0.59 | 1.23 | -1.16 | -1.39 | 1.66 | 0.14 | -0.20 | 1.81 | -1.01 | -1.24 | 1.21 | -0.08 | -0.35 | 1.26 | 0.01 | -0.45 | 1.66 | 1.88 | 1.19 | 2.34 | 0.01 | -0.46 | 1.95 | 2.02 | 1.20 | 2.48 | -0.06 | -0.36 | 1.37 | 1.28 | 0.87 | 1.65 | |
| -0.75 | -0.44 | 0.39 | -0.39 | -0.06 | 0.44 | -2.81 | -0.11 | 2.47 | -2.26 | 1.30 | 1.87 | -3.77 | -0.10 | 0.38 | -3.62 | -0.11 | 1.50 | 0.06 | -0.61 | 2.19 | 3.22 | 3.52 | 3.79 | 0.30 | 1.15 | 2.74 | 2.66 | 2.08 | 2.42 | -0.61 | 0.84 | -0.68 | -0.50 | 0.42 | 1.54 | |
| -1.01 | -0.44 | 1.06 | -0.16 | 0.56 | 1.16 | -1.62 | -0.93 | 1.69 | -0.82 | 0.38 | 1.76 | -2.34 | -1.17 | 1.35 | -1.83 | -0.30 | 1.44 | 0.02 | -0.17 | 2.26 | 2.41 | 2.12 | 2.78 | -0.01 | -0.27 | 2.02 | 2.07 | 1.53 | 2.56 | -0.12 | -0.30 | 1.21 | 1.11 | 0.84 | 1.53 | |
| -0.75 | -0.49 | 0.98 | 0.43 | 0.45 | 1.07 | -1.30 | -0.97 | 1.70 | -0.37 | 0.38 | 1.73 | -1.97 | -1.20 | 1.32 | -1.36 | -0.32 | 1.39 | -0.04 | -0.19 | 2.13 | 2.29 | 1.90 | 2.69 | 0.00 | -0.35 | 2.02 | 2.07 | 1.48 | 2.55 | -0.10 | -0.31 | 1.27 | 1.16 | 0.84 | 1.56 | |
| -2.83 | -3.30 | 0.62 | -1.20 | -2.67 | 1.66 | -0.80 | -1.26 | 1.80 | 0.78 | 0.08 | 1.95 | -0.51 | -1.27 | 1.19 | 0.68 | -0.39 | 1.22 | 0.08 | -0.60 | 1.26 | 1.45 | 0.55 | 1.84 | 0.01 | -0.49 | 2.04 | 2.10 | 1.27 | 2.52 | -0.03 | -0.39 | 1.42 | 1.34 | 0.87 | 1.65 | |
| -0.25 | -4.62 | 0.50 | 0.36 | -4.19 | 1.61 | -1.98 | -3.92 | 0.97 | -0.40 | -3.50 | 1.56 | -0.33 | -1.29 | 1.12 | 0.88 | -0.34 | 1.20 | 0.22 | -1.02 | 0.78 | 1.08 | -0.17 | 1.36 | -0.08 | -0.92 | 1.23 | 1.33 | 0.07 | 1.85 | -0.06 | -0.47 | 1.57 | 1.48 | 0.93 | 1.80 | |
| -0.11 | -4.94 | 0.67 | 0.73 | -4.51 | 1.66 | -0.61 | -4.30 | 0.91 | 0.69 | -3.84 | 1.27 | -0.32 | -1.28 | 1.16 | 0.92 | -0.25 | 1.27 | 0.19 | -1.14 | 0.77 | 1.11 | -0.29 | 1.68 | -0.07 | -0.95 | 1.20 | 1.32 | -0.07 | 1.71 | -0.05 | -0.45 | 1.66 | 1.54 | 0.97 | 1.87 | |
| -1.60 | -1.12 | 2.38 | 0.65 | 1.16 | 3.15 | -5.00 | -3.29 | 2.35 | -2.48 | -0.76 | 3.00 | -5.81 | -3.43 | 2.71 | -3.85 | -1.87 | 3.65 | -0.50 | -0.84 | 1.93 | 1.47 | 1.28 | 2.62 | -0.93 | -1.32 | 1.79 | 0.55 | -0.11 | 2.47 | -1.06 | -1.48 | 1.54 | 0.22 | -0.36 | 2.20 | |
| -1.79 | -1.49 | 2.45 | 1.12 | 0.84 | 3.37 | -1.73 | -2.12 | 2.68 | 0.91 | -0.06 | 3.57 | -2.73 | -2.31 | 2.09 | -0.72 | -0.72 | 2.72 | -0.47 | -0.83 | 1.62 | 1.36 | 0.67 | 2.18 | -0.27 | -1.30 | 1.55 | 1.35 | 0.01 | 2.07 | -0.47 | -1.25 | 1.36 | 0.87 | -0.18 | 1.84 | |
| -1.21 | -1.52 | 2.29 | 1.55 | 0.62 | 3.21 | -1.11 | -2.08 | 2.63 | 1.56 | -0.03 | 3.54 | -1.79 | -2.27 | 2.03 | 0.18 | -0.68 | 2.64 | -0.36 | -0.89 | 1.54 | 1.40 | 0.55 | 2.11 | -0.24 | -1.30 | 1.49 | 1.33 | -0.04 | 2.01 | -0.33 | -1.20 | 1.35 | 1.01 | -0.13 | 1.81 | |
| -1.33 | -4.38 | 1.02 | 0.60 | -3.56 | 1.91 | -0.75 | -2.47 | 2.43 | 1.71 | -0.66 | 3.29 | -0.43 | -2.09 | 1.93 | 1.49 | -0.55 | 2.47 | -0.57 | -2.36 | 0.79 | 0.64 | -1.71 | 1.36 | -0.21 | -1.40 | 1.34 | 1.21 | -0.32 | 1.83 | -0.15 | -1.15 | 1.28 | 1.13 | -0.09 | 1.73 | |
| -0.08 | -5.79 | 0.76 | 0.83 | -5.19 | 1.38 | -0.72 | -4.64 | 1.27 | 0.68 | -3.80 | 2.02 | -0.25 | -1.99 | 1.80 | 1.61 | -0.47 | 2.36 | -0.03 | -2.48 | 0.67 | 0.70 | -2.00 | 1.05 | -0.18 | -2.30 | 0.89 | 0.78 | -1.67 | 1.35 | -0.07 | -1.09 | 1.22 | 1.15 | -0.04 | 1.66 | |
| 0.00 | -5.93 | 0.72 | 0.81 | -5.33 | 1.22 | -0.26 | -4.80 | 1.22 | 1.00 | -4.07 | 1.87 | -0.21 | -1.98 | 1.78 | 1.59 | -0.41 | 2.30 | 0.01 | -2.50 | 0.64 | 0.69 | -2.02 | 0.97 | -0.07 | -2.35 | 0.83 | 0.80 | -1.79 | 1.24 | -0.06 | -1.06 | 1.20 | 1.15 | -0.02 | 1.64 | |
| -0.11 | -0.08 | -0.12 | -0.22 | -0.14 | -0.12 | -0.09 | -0.03 | -0.14 | -0.25 | -0.07 | -0.14 | -0.14 | -0.03 | -0.09 | -0.27 | -0.12 | -0.06 | -0.11 | -0.31 | -0.22 | -0.24 | -0.41 | -0.14 | -0.09 | -0.22 | -0.15 | -0.26 | -0.28 | -0.13 | -0.17 | -0.18 | -0.09 | -0.29 | -0.28 | -0.10 | |
| -0.03 | -0.16 | -0.14 | -0.18 | -0.23 | -0.13 | -0.03 | -0.12 | -0.18 | -0.20 | -0.23 | -0.16 | -0.03 | -0.13 | -0.12 | -0.15 | -0.22 | -0.11 | -0.03 | -0.25 | -0.14 | -0.16 | -0.33 | -0.11 | -0.03 | -0.21 | -0.14 | -0.17 | -0.30 | -0.11 | -0.03 | -0.19 | -0.10 | -0.13 | -0.28 | -0.09 | |
| -0.07 | -0.18 | -0.19 | -0.23 | -0.25 | -0.13 | -0.08 | -0.15 | -0.17 | -0.24 | -0.22 | -0.16 | -0.14 | -0.15 | -0.13 | -0.25 | -0.25 | -0.12 | -0.05 | -0.29 | -0.17 | -0.20 | -0.36 | -0.12 | -0.07 | -0.23 | -0.16 | -0.22 | -0.31 | -0.13 | -0.09 | -0.21 | -0.11 | -0.20 | -0.31 | -0.10 | |
| -0.04 | -0.18 | -0.17 | -0.20 | -0.24 | -0.13 | -0.06 | -0.15 | -0.17 | -0.21 | -0.22 | -0.15 | -0.07 | -0.14 | -0.13 | -0.18 | -0.24 | -0.12 | -0.03 | -0.28 | -0.16 | -0.18 | -0.35 | -0.12 | -0.05 | -0.22 | -0.15 | -0.21 | -0.31 | -0.13 | -0.06 | -0.21 | -0.11 | -0.16 | -0.30 | -0.10 | |
| -0.04 | -0.17 | -0.13 | -0.19 | -0.24 | -0.12 | -0.03 | -0.13 | -0.18 | -0.19 | -0.24 | -0.16 | -0.01 | -0.13 | -0.13 | -0.14 | -0.23 | -0.11 | -0.04 | -0.24 | -0.13 | -0.16 | -0.32 | -0.10 | -0.02 | -0.21 | -0.13 | -0.16 | -0.31 | -0.11 | -0.02 | -0.19 | -0.10 | -0.12 | -0.28 | -0.09 | |
| -0.01 | -0.12 | -0.13 | -0.15 | -0.23 | -0.13 | -0.01 | -0.11 | -0.18 | -0.18 | -0.24 | -0.16 | -0.01 | -0.12 | -0.12 | -0.14 | -0.22 | -0.11 | -0.03 | -0.23 | -0.12 | -0.15 | -0.32 | -0.10 | -0.01 | -0.18 | -0.12 | -0.13 | -0.28 | -0.10 | -0.01 | -0.17 | -0.10 | -0.11 | -0.26 | -0.09 | |
| -0.02 | -0.13 | -0.14 | -0.16 | -0.24 | -0.14 | -0.01 | -0.11 | -0.18 | -0.18 | -0.24 | -0.16 | -0.01 | -0.11 | -0.12 | -0.13 | -0.21 | -0.11 | -0.03 | -0.22 | -0.12 | -0.15 | -0.32 | -0.10 | -0.01 | -0.17 | -0.12 | -0.13 | -0.27 | -0.10 | -0.01 | -0.16 | -0.09 | -0.10 | -0.25 | -0.08 | |
| 0.00 | 0.00 | 0.02 | 0.00 | 0.02 | 0.02 | -0.01 | -0.01 | 0.01 | 0.00 | 0.00 | 0.01 | 0.00 | 0.00 | 0.02 | 0.01 | 0.02 | 0.01 | 0.00 | 0.00 | 0.00 | 0.01 | 0.01 | 0.01 | 0.00 | 0.00 | 0.02 | 0.02 | 0.02 | 0.02 | 0.00 | 0.00 | 0.02 | 0.01 | 0.01 | 0.02 | |
| 0.00 | 0.00 | 0.00 | 0.00 | 0.00 | 0.01 | 0.00 | 0.00 | 0.01 | 0.01 | 0.00 | 0.01 | 0.00 | 0.00 | 0.01 | 0.01 | 0.01 | 0.01 | 0.00 | 0.00 | 0.00 | 0.00 | 0.00 | 0.00 | 0.00 | 0.00 | 0.01 | 0.01 | 0.00 | 0.01 | 0.00 | 0.00 | 0.01 | 0.01 | 0.00 | 0.01 | |
| 0.00 | 0.00 | 0.01 | 0.01 | 0.01 | 0.01 | 0.00 | 0.00 | 0.01 | 0.01 | 0.00 | 0.01 | 0.00 | 0.00 | 0.01 | 0.01 | 0.01 | 0.01 | 0.00 | 0.00 | 0.01 | 0.01 | 0.01 | 0.01 | 0.00 | 0.00 | 0.01 | 0.02 | 0.01 | 0.02 | 0.00 | 0.00 | 0.01 | 0.01 | 0.01 | 0.01 | |
| 0.00 | 0.00 | 0.01 | 0.01 | 0.00 | 0.01 | 0.00 | 0.00 | 0.01 | 0.01 | 0.00 | 0.01 | 0.00 | 0.00 | 0.01 | 0.01 | 0.01 | 0.01 | 0.00 | 0.00 | 0.01 | 0.01 | 0.00 | 0.01 | 0.00 | 0.00 | 0.01 | 0.01 | 0.01 | 0.01 | 0.00 | 0.00 | 0.01 | 0.01 | 0.01 | 0.01 | |
| 0.00 | 0.00 | 0.00 | 0.00 | 0.00 | 0.01 | 0.00 | 0.00 | 0.01 | 0.01 | 0.00 | 0.01 | 0.00 | 0.00 | 0.01 | 0.01 | 0.01 | 0.01 | 0.00 | 0.00 | 0.00 | 0.00 | 0.00 | 0.00 | 0.00 | 0.00 | 0.01 | 0.01 | 0.00 | 0.01 | 0.00 | 0.00 | 0.01 | 0.01 | 0.00 | 0.01 | |
| 0.00 | 0.00 | 0.00 | 0.00 | 0.00 | 0.00 | 0.00 | 0.00 | 0.00 | 0.00 | 0.00 | 0.01 | 0.00 | 0.00 | 0.01 | 0.01 | 0.00 | 0.01 | 0.00 | 0.00 | 0.00 | 0.00 | 0.00 | 0.00 | 0.00 | 0.00 | 0.00 | 0.00 | 0.00 | 0.01 | 0.00 | 0.00 | 0.00 | 0.00 | 0.00 | 0.00 | |
| 0.00 | 0.00 | 0.00 | 0.00 | 0.00 | 0.00 | 0.00 | 0.00 | 0.00 | 0.00 | 0.00 | 0.01 | 0.00 | 0.00 | 0.01 | 0.01 | 0.00 | 0.01 | 0.00 | 0.00 | 0.00 | 0.00 | 0.00 | 0.00 | 0.00 | 0.00 | 0.00 | 0.00 | 0.00 | 0.01 | 0.00 | 0.00 | 0.00 | 0.00 | 0.00 | 0.00 | |
| -1.09 | 0.14 | 0.25 | -1.17 | 0.31 | 0.36 | -0.98 | 0.15 | -0.07 | -1.05 | 0.06 | -0.07 | -1.38 | -0.02 | 0.01 | -1.47 | 0.03 | 0.00 | -0.14 | 0.05 | 0.16 | -0.11 | 0.27 | 0.20 | -0.14 | 0.14 | 0.08 | -0.10 | 0.29 | 0.14 | -0.28 | 0.00 | 0.02 | -0.34 | 0.05 | 0.01 | |
| -0.53 | 0.04 | -0.04 | -0.53 | 0.03 | -0.02 | -0.17 | 0.15 | -0.08 | -0.23 | 0.09 | -0.09 | -0.50 | 0.02 | 0.01 | -0.55 | 0.06 | 0.01 | -0.10 | 0.04 | 0.00 | -0.07 | 0.07 | 0.00 | -0.03 | 0.12 | 0.02 | 0.01 | 0.19 | 0.06 | -0.08 | 0.03 | 0.03 | -0.07 | 0.07 | 0.02 | |
| -0.32 | 0.03 | -0.03 | -0.32 | 0.04 | 0.00 | -0.09 | 0.14 | -0.09 | -0.16 | 0.09 | -0.09 | -0.26 | 0.01 | -0.01 | -0.29 | 0.04 | -0.01 | -0.08 | 0.04 | 0.00 | -0.06 | 0.06 | 0.00 | -0.03 | 0.11 | 0.00 | 0.00 | 0.17 | 0.04 | -0.05 | 0.03 | 0.04 | -0.03 | 0.08 | 0.03 | |
| -0.05 | 0.02 | -0.02 | -0.05 | 0.02 | -0.02 | -0.02 | 0.11 | -0.05 | -0.07 | 0.08 | -0.05 | -0.03 | 0.01 | -0.01 | -0.04 | 0.02 | -0.02 | -0.02 | 0.03 | 0.00 | -0.01 | 0.03 | 0.00 | -0.01 | 0.07 | -0.02 | -0.01 | 0.09 | -0.01 | -0.02 | 0.02 | 0.00 | -0.01 | 0.03 | 0.00 | |
| -0.01 | 0.01 | -0.01 | -0.01 | 0.01 | -0.01 | -0.02 | 0.10 | -0.03 | -0.04 | 0.09 | -0.03 | -0.01 | 0.01 | -0.01 | -0.02 | 0.01 | -0.01 | -0.01 | 0.01 | 0.00 | 0.00 | 0.01 | 0.00 | -0.02 | 0.03 | -0.01 | -0.02 | 0.03 | -0.01 | -0.01 | 0.01 | 0.00 | -0.01 | 0.01 | -0.01 | |
| 0.00 | 0.01 | -0.01 | -0.01 | 0.01 | -0.01 | -0.01 | 0.10 | -0.03 | -0.04 | 0.09 | -0.03 | -0.01 | 0.01 | -0.01 | -0.02 | 0.01 | -0.01 | -0.01 | 0.01 | 0.00 | 0.00 | 0.01 | 0.00 | -0.01 | 0.02 | -0.01 | -0.01 | 0.02 | 0.00 | 0.00 | 0.01 | 0.00 | -0.01 | 0.01 | 0.00 | |
| -0.02 | 0.01 | 0.01 | -0.02 | 0.01 | 0.00 | -0.01 | 0.00 | 0.01 | -0.01 | 0.00 | 0.01 | 0.00 | -0.01 | 0.00 | 0.00 | 0.00 | 0.01 | 0.01 | 0.00 | -0.01 | 0.00 | 0.00 | 0.00 | 0.00 | 0.00 | 0.00 | 0.01 | 0.00 | 0.00 | 0.00 | -0.01 | -0.01 | -0.01 | -0.01 | 0.01 | |
| -0.03 | 0.00 | 0.00 | -0.04 | 0.01 | 0.01 | -0.03 | 0.00 | 0.01 | -0.03 | 0.00 | 0.01 | -0.02 | 0.00 | 0.00 | -0.02 | 0.00 | 0.01 | 0.00 | 0.00 | -0.01 | 0.00 | 0.00 | 0.01 | 0.00 | 0.00 | 0.00 | 0.00 | 0.00 | 0.00 | 0.00 | 0.00 | 0.00 | 0.00 | 0.00 | 0.00 | |
| -0.03 | 0.01 | 0.01 | -0.04 | 0.02 | 0.02 | -0.04 | 0.01 | 0.00 | -0.04 | 0.00 | 0.00 | -0.04 | 0.00 | 0.00 | -0.04 | 0.00 | 0.00 | 0.00 | 0.00 | 0.00 | 0.00 | 0.01 | 0.00 | -0.01 | 0.00 | -0.01 | -0.01 | 0.00 | 0.00 | -0.01 | 0.00 | -0.01 | -0.01 | 0.00 | 0.00 | |
| -0.02 | 0.00 | 0.00 | -0.02 | 0.00 | 0.00 | -0.02 | 0.00 | 0.00 | -0.02 | 0.00 | 0.00 | -0.01 | 0.00 | 0.00 | -0.01 | 0.00 | 0.00 | 0.00 | 0.00 | 0.00 | -0.01 | 0.00 | 0.00 | -0.01 | 0.00 | 0.00 | 0.00 | 0.00 | 0.00 | 0.00 | 0.00 | 0.00 | -0.01 | 0.00 | 0.00 | |
| 0.00 | 0.00 | 0.00 | 0.00 | 0.00 | 0.00 | 0.00 | 0.00 | 0.00 | 0.00 | 0.00 | 0.00 | 0.00 | 0.00 | 0.00 | 0.00 | 0.00 | 0.00 | 0.00 | 0.00 | 0.00 | 0.00 | 0.00 | 0.00 | 0.00 | 0.00 | 0.00 | 0.00 | 0.00 | 0.00 | 0.00 | 0.00 | 0.00 | 0.00 | 0.00 | 0.00 | |
| 0.00 | 0.00 | 0.00 | 0.00 | 0.00 | 0.00 | 0.00 | 0.00 | 0.00 | 0.00 | 0.00 | 0.00 | 0.00 | 0.00 | 0.00 | 0.00 | 0.00 | 0.00 | 0.00 | 0.00 | 0.00 | 0.00 | 0.00 | 0.00 | 0.00 | 0.00 | 0.00 | 0.00 | 0.00 | 0.00 | 0.00 | 0.00 | 0.00 | 0.00 | 0.00 | 0.00 | |
| PA | -1.83 | -1.72 | 2.43 | 0.83 | 0.09 | 3.45 | -1.75 | -2.31 | 2.35 | 0.38 | -0.88 | 3.61 | -2.75 | -2.32 | 2.15 | -0.67 | -1.00 | 2.81 | -0.48 | -0.86 | 1.64 | 1.38 | 0.66 | 2.22 | -0.28 | -1.31 | 1.60 | 1.40 | 0.03 | 2.15 | -0.48 | -1.26 | 1.40 | 0.90 | -0.16 | 1.89 |
| 0.25 | 9.78 | -0.47 | -0.73 | 10.01 | -1.57 | 1.35 | 5.09 | 0.43 | 0.48 | 5.56 | -0.08 | -2.60 | -0.03 | 0.01 | -3.13 | -0.11 | 0.01 | 0.14 | 4.63 | -0.52 | -0.63 | 5.99 | -1.10 | 0.46 | 2.88 | 0.39 | 0.96 | 4.54 | 0.06 | -0.02 | 0.19 | 0.11 | -0.13 | 0.10 | 0.08 | |
| 0.86 | 1.24 | 0.82 | 1.29 | 1.81 | 0.42 | 0.39 | 0.90 | 0.68 | 0.55 | 1.55 | 0.64 | -0.50 | 0.47 | 0.49 | -0.47 | 0.80 | 0.59 | 0.41 | 1.11 | -0.17 | -0.12 | 1.30 | 0.01 | 0.26 | 1.27 | -2.11 | -1.67 | 0.28 | -1.77 | 0.08 | 0.81 | -1.47 | -1.28 | -0.08 | -1.18 | |
3.3 Single-value psychoacoustic indicators
Although there is an increasing availability and accessibility of psychoacoustic indices for analysis, there is a lack of consensus on which indicator or its combinations could best represent perceptual effects such as perceived loudness and annoyance. A comprehensive list of traditional as well as suggested acoustic and psychoacoustic indices as described in Table 1 were computed, as shown in Table 4. Since psychoacoustic parameters closely models the human perception, only the indices computed using the HATS measurements were shown in Table 4, while psychoacoustic indices for EA measurements were shown in Table 3 only for completeness.
| Masker:None | Masker:B | Masker:W | |||||||||||||||||||||||
| ANC:NO | ANC:YES | ANC:NO | ANC:YES | ANC:NO | ANC:YES | ||||||||||||||||||||
| 60dB(A) | 65dB(A) | 70dB(A) | 65dB(A) | 70dB(A) | 65dB(A) | ||||||||||||||||||||
| TRA | AIR | MRT | TRA | AIR | MRT | TRA | AIR | MRT | TRA | AIR | MRT | TRA | AIR | MRT | TRA | AIR | MRT | TRA | AIR | MRT | TRA | AIR | MRT | TRA | |
| 60.08 | 66.02 | 65.24 | 65.25 | 70.90 | 70.25 | 70.00 | 65.85 | 64.22 | 64.43 | 70.26 | 69.16 | 69.21 | 67.63 | 66.94 | 66.72 | 66.88 | 66.17 | 66.14 | 67.75 | 67.11 | 66.93 | 67.38 | 66.41 | 66.38 | |
| 61.08 | 74.17 | 68.25 | 66.26 | 78.75 | 73.24 | 71.01 | 74.02 | 67.40 | 65.43 | 78.56 | 72.41 | 70.11 | 75.10 | 73.33 | 73.00 | 74.94 | 73.06 | 72.84 | 74.66 | 69.76 | 68.25 | 74.51 | 68.97 | 67.68 | |
| 60.70 | 71.17 | 67.64 | 65.88 | 75.75 | 72.62 | 70.63 | 70.77 | 66.65 | 65.01 | 75.28 | 71.65 | 69.80 | 72.64 | 70.03 | 69.37 | 72.15 | 69.61 | 69.09 | 71.68 | 68.84 | 67.61 | 71.30 | 68.11 | 67.09 | |
| 60.60 | 70.81 | 67.40 | 65.77 | 75.40 | 72.39 | 70.53 | 70.40 | 66.36 | 64.92 | 74.93 | 71.36 | 69.71 | 71.58 | 69.33 | 68.72 | 71.04 | 68.83 | 68.37 | 71.35 | 68.61 | 67.47 | 70.94 | 67.83 | 66.96 | |
| 60.14 | 60.08 | 65.61 | 65.31 | 65.07 | 70.56 | 70.06 | 59.61 | 64.37 | 64.53 | 64.14 | 69.29 | 69.31 | 64.12 | 66.67 | 65.80 | 62.46 | 65.73 | 65.01 | 64.62 | 67.22 | 66.96 | 64.35 | 66.41 | 66.40 | |
| 59.41 | 52.27 | 58.03 | 64.57 | 56.85 | 63.19 | 69.32 | 51.38 | 57.42 | 63.74 | 54.81 | 62.09 | 68.51 | 53.30 | 61.31 | 64.92 | 51.77 | 59.94 | 64.04 | 62.58 | 64.33 | 66.24 | 62.41 | 64.02 | 65.65 | |
| 59.24 | 50.99 | 56.38 | 64.40 | 55.12 | 61.39 | 69.14 | 49.82 | 55.58 | 63.55 | 53.14 | 60.16 | 68.32 | 51.11 | 57.83 | 64.68 | 49.58 | 56.87 | 63.81 | 62.30 | 63.76 | 66.02 | 62.15 | 63.44 | 65.37 | |
| 61.02 | 65.88 | 65.43 | 65.47 | 70.52 | 70.16 | 69.97 | 65.16 | 63.76 | 64.26 | 69.28 | 68.35 | 68.71 | 67.09 | 66.59 | 66.48 | 65.93 | 65.28 | 65.55 | 67.28 | 66.82 | 66.71 | 66.47 | 65.63 | 65.82 | |
| 63.41 | 73.13 | 69.23 | 67.89 | 77.67 | 73.09 | 71.12 | 72.74 | 66.76 | 67.51 | 77.23 | 71.22 | 69.62 | 73.88 | 72.04 | 71.66 | 73.52 | 71.49 | 71.51 | 73.57 | 69.34 | 67.99 | 73.19 | 67.93 | 68.00 | |
| 61.97 | 70.69 | 67.52 | 66.17 | 75.22 | 72.34 | 70.67 | 69.63 | 65.83 | 64.83 | 74.06 | 70.58 | 69.23 | 71.70 | 69.14 | 68.52 | 70.85 | 68.34 | 68.00 | 71.14 | 68.45 | 67.35 | 70.13 | 67.14 | 66.47 | |
| 61.71 | 70.23 | 67.26 | 66.02 | 74.76 | 72.07 | 70.53 | 69.25 | 65.56 | 64.70 | 73.69 | 70.34 | 69.14 | 70.98 | 68.57 | 67.98 | 69.80 | 67.64 | 67.38 | 70.72 | 68.23 | 67.22 | 69.78 | 66.88 | 66.34 | |
| 60.94 | 61.25 | 65.73 | 65.44 | 65.65 | 70.47 | 69.96 | 60.63 | 63.93 | 64.24 | 63.98 | 68.52 | 68.74 | 64.08 | 66.53 | 65.94 | 62.45 | 64.95 | 64.76 | 64.55 | 66.98 | 66.71 | 63.92 | 65.65 | 65.83 | |
| 60.30 | 57.97 | 60.11 | 64.84 | 61.30 | 64.18 | 69.40 | 57.47 | 59.14 | 63.72 | 59.69 | 62.62 | 68.19 | 58.22 | 62.08 | 65.17 | 57.61 | 60.51 | 63.96 | 62.58 | 64.03 | 66.13 | 62.16 | 63.61 | 65.18 | |
| 60.15 | 57.37 | 59.25 | 64.68 | 60.65 | 63.14 | 69.18 | 56.70 | 58.34 | 63.53 | 58.99 | 61.87 | 67.92 | 57.48 | 59.86 | 65.00 | 56.64 | 58.56 | 63.77 | 62.31 | 63.55 | 65.97 | 61.87 | 63.08 | 64.94 | |
| 13.89 | 28.36 | 20.26 | 19.24 | 37.60 | 27.67 | 25.94 | 25.98 | 17.91 | 16.53 | 34.45 | 24.67 | 22.29 | 29.96 | 25.26 | 25.05 | 27.71 | 22.74 | 23.09 | 29.48 | 23.55 | 22.67 | 27.20 | 21.02 | 21.11 | |
| 12.86 | 22.46 | 18.53 | 17.83 | 29.86 | 25.40 | 24.02 | 20.01 | 15.85 | 15.74 | 26.49 | 21.83 | 21.30 | 24.25 | 20.26 | 20.56 | 21.34 | 17.62 | 18.55 | 23.95 | 20.65 | 20.14 | 21.62 | 18.59 | 18.55 | |
| 12.70 | 21.42 | 18.12 | 17.57 | 28.51 | 24.84 | 23.67 | 19.13 | 15.49 | 15.54 | 25.30 | 21.30 | 21.03 | 22.63 | 19.23 | 19.36 | 19.87 | 16.56 | 17.39 | 22.94 | 20.20 | 19.84 | 20.80 | 18.15 | 18.25 | |
| 12.07 | 11.70 | 15.80 | 16.71 | 15.85 | 21.62 | 22.49 | 10.68 | 13.37 | 14.78 | 13.94 | 18.33 | 20.02 | 13.03 | 16.55 | 17.14 | 11.10 | 14.09 | 15.22 | 16.08 | 18.27 | 18.80 | 15.26 | 16.46 | 17.26 | |
| 11.50 | 7.96 | 10.63 | 15.89 | 10.39 | 14.68 | 21.39 | 7.20 | 9.36 | 14.09 | 9.01 | 12.66 | 19.03 | 8.04 | 11.35 | 16.14 | 7.14 | 9.95 | 14.28 | 13.75 | 15.27 | 17.88 | 13.15 | 14.43 | 16.36 | |
| 11.33 | 7.50 | 9.82 | 15.68 | 9.69 | 13.46 | 21.11 | 6.78 | 8.59 | 13.90 | 8.47 | 11.59 | 18.81 | 7.50 | 10.07 | 15.89 | 6.69 | 8.82 | 14.09 | 13.43 | 14.62 | 17.66 | 12.83 | 13.89 | 16.09 | |
| 2.00 | 1.98 | 2.00 | 1.82 | 1.80 | 1.83 | 1.70 | 2.10 | 2.14 | 1.92 | 1.93 | 1.97 | 1.76 | 2.09 | 2.09 | 1.96 | 2.21 | 2.25 | 2.10 | 2.06 | 2.03 | 1.85 | 2.12 | 2.07 | 1.94 | |
| 1.69 | 1.63 | 1.67 | 1.60 | 1.54 | 1.61 | 1.55 | 1.77 | 1.85 | 1.72 | 1.66 | 1.77 | 1.66 | 1.67 | 1.70 | 1.62 | 1.81 | 1.87 | 1.75 | 1.79 | 1.79 | 1.72 | 1.87 | 1.90 | 1.82 | |
| 1.73 | 1.77 | 1.79 | 1.63 | 1.64 | 1.72 | 1.58 | 1.95 | 1.96 | 1.76 | 1.77 | 1.87 | 1.71 | 1.84 | 1.87 | 1.77 | 2.00 | 2.03 | 1.88 | 1.95 | 1.93 | 1.78 | 2.01 | 2.01 | 1.88 | |
| 1.71 | 1.74 | 1.76 | 1.62 | 1.63 | 1.69 | 1.58 | 1.91 | 1.93 | 1.75 | 1.75 | 1.84 | 1.70 | 1.78 | 1.82 | 1.69 | 1.95 | 1.97 | 1.81 | 1.93 | 1.90 | 1.77 | 1.98 | 1.98 | 1.86 | |
| 1.69 | 1.63 | 1.66 | 1.60 | 1.54 | 1.61 | 1.55 | 1.76 | 1.84 | 1.72 | 1.66 | 1.77 | 1.66 | 1.67 | 1.69 | 1.61 | 1.82 | 1.85 | 1.73 | 1.80 | 1.78 | 1.73 | 1.87 | 1.90 | 1.82 | |
| 1.65 | 1.52 | 1.60 | 1.56 | 1.45 | 1.55 | 1.51 | 1.65 | 1.77 | 1.69 | 1.59 | 1.71 | 1.62 | 1.54 | 1.61 | 1.58 | 1.68 | 1.78 | 1.70 | 1.65 | 1.71 | 1.68 | 1.76 | 1.84 | 1.78 | |
| 1.65 | 1.50 | 1.58 | 1.56 | 1.42 | 1.54 | 1.50 | 1.64 | 1.76 | 1.68 | 1.57 | 1.70 | 1.61 | 1.52 | 1.59 | 1.56 | 1.66 | 1.76 | 1.69 | 1.63 | 1.69 | 1.67 | 1.74 | 1.82 | 1.77 | |
| 0.04 | 0.06 | 0.05 | 0.06 | 0.07 | 0.06 | 0.08 | 0.04 | 0.04 | 0.04 | 0.05 | 0.05 | 0.06 | 0.06 | 0.05 | 0.06 | 0.07 | 0.05 | 0.05 | 0.06 | 0.05 | 0.06 | 0.04 | 0.05 | 0.04 | |
| 0.02 | 0.02 | 0.03 | 0.03 | 0.03 | 0.03 | 0.03 | 0.02 | 0.02 | 0.02 | 0.02 | 0.02 | 0.03 | 0.02 | 0.03 | 0.03 | 0.02 | 0.02 | 0.02 | 0.03 | 0.03 | 0.03 | 0.02 | 0.02 | 0.02 | |
| 0.03 | 0.04 | 0.04 | 0.04 | 0.04 | 0.04 | 0.05 | 0.03 | 0.03 | 0.03 | 0.03 | 0.03 | 0.04 | 0.04 | 0.04 | 0.04 | 0.03 | 0.03 | 0.03 | 0.04 | 0.04 | 0.04 | 0.03 | 0.03 | 0.03 | |
| 0.03 | 0.03 | 0.03 | 0.04 | 0.04 | 0.04 | 0.04 | 0.03 | 0.02 | 0.03 | 0.03 | 0.03 | 0.03 | 0.03 | 0.03 | 0.04 | 0.03 | 0.03 | 0.03 | 0.03 | 0.03 | 0.04 | 0.03 | 0.03 | 0.03 | |
| 0.02 | 0.02 | 0.02 | 0.03 | 0.03 | 0.03 | 0.03 | 0.02 | 0.02 | 0.02 | 0.02 | 0.02 | 0.02 | 0.02 | 0.02 | 0.03 | 0.02 | 0.02 | 0.02 | 0.02 | 0.03 | 0.03 | 0.02 | 0.02 | 0.02 | |
| 0.02 | 0.01 | 0.02 | 0.02 | 0.02 | 0.02 | 0.02 | 0.01 | 0.01 | 0.02 | 0.01 | 0.01 | 0.02 | 0.01 | 0.02 | 0.02 | 0.01 | 0.01 | 0.01 | 0.02 | 0.02 | 0.02 | 0.02 | 0.02 | 0.02 | |
| 0.02 | 0.01 | 0.02 | 0.02 | 0.02 | 0.02 | 0.02 | 0.01 | 0.01 | 0.01 | 0.01 | 0.01 | 0.02 | 0.01 | 0.02 | 0.02 | 0.01 | 0.01 | 0.01 | 0.02 | 0.02 | 0.02 | 0.02 | 0.02 | 0.02 | |
| 0.08 | 0.09 | 0.07 | 0.08 | 0.09 | 0.08 | 0.09 | 0.09 | 0.07 | 0.08 | 0.09 | 0.08 | 0.08 | 0.11 | 0.08 | 0.08 | 0.11 | 0.08 | 0.08 | 0.09 | 0.08 | 0.09 | 0.08 | 0.08 | 0.08 | |
| 0.05 | 0.05 | 0.04 | 0.05 | 0.06 | 0.05 | 0.05 | 0.05 | 0.04 | 0.05 | 0.05 | 0.04 | 0.05 | 0.08 | 0.07 | 0.07 | 0.09 | 0.07 | 0.07 | 0.05 | 0.05 | 0.05 | 0.05 | 0.04 | 0.05 | |
| 0.03 | 0.05 | 0.02 | 0.01 | 0.05 | 0.02 | 0.01 | 0.03 | 0.02 | 0.02 | 0.03 | 0.02 | 0.01 | 0.08 | 0.06 | 0.05 | 0.08 | 0.07 | 0.05 | 0.04 | 0.02 | 0.01 | 0.02 | 0.02 | 0.01 | |
| 0.01 | 0.02 | 0.01 | 0.01 | 0.02 | 0.01 | 0.01 | 0.02 | 0.01 | 0.01 | 0.02 | 0.01 | 0.01 | 0.04 | 0.03 | 0.02 | 0.03 | 0.03 | 0.02 | 0.01 | 0.01 | 0.01 | 0.01 | 0.01 | 0.01 | |
| 0.00 | 0.01 | 0.01 | 0.00 | 0.01 | 0.01 | 0.00 | 0.01 | 0.01 | 0.00 | 0.01 | 0.01 | 0.00 | 0.01 | 0.01 | 0.01 | 0.01 | 0.01 | 0.01 | 0.01 | 0.01 | 0.00 | 0.01 | 0.01 | 0.00 | |
| 0.00 | 0.01 | 0.01 | 0.00 | 0.00 | 0.01 | 0.00 | 0.01 | 0.00 | 0.00 | 0.01 | 0.01 | 0.00 | 0.01 | 0.01 | 0.00 | 0.01 | 0.01 | 0.00 | 0.01 | 0.01 | 0.00 | 0.01 | 0.00 | 0.00 | |
| 0.36 | 0.97 | 1.09 | 0.43 | 1.17 | 1.31 | 0.52 | 0.72 | 1.16 | 0.42 | 0.81 | 1.39 | 0.52 | 2.06 | 2.06 | 1.81 | 2.14 | 2.14 | 1.90 | 0.83 | 0.94 | 0.45 | 0.66 | 1.03 | 0.40 | |
| 0.24 | 0.37 | 0.80 | 0.28 | 0.46 | 0.96 | 0.33 | 0.41 | 0.88 | 0.27 | 0.48 | 1.05 | 0.32 | 0.89 | 0.97 | 0.78 | 0.90 | 1.03 | 0.83 | 0.33 | 0.64 | 0.26 | 0.34 | 0.70 | 0.22 | |
| 0.19 | 0.29 | 0.70 | 0.23 | 0.36 | 0.85 | 0.27 | 0.32 | 0.79 | 0.24 | 0.36 | 0.94 | 0.28 | 0.61 | 0.80 | 0.49 | 0.61 | 0.87 | 0.52 | 0.26 | 0.57 | 0.22 | 0.25 | 0.62 | 0.19 | |
| 0.10 | 0.12 | 0.43 | 0.12 | 0.15 | 0.52 | 0.14 | 0.14 | 0.49 | 0.13 | 0.17 | 0.57 | 0.16 | 0.16 | 0.45 | 0.15 | 0.17 | 0.50 | 0.16 | 0.10 | 0.33 | 0.11 | 0.10 | 0.35 | 0.10 | |
| 0.05 | 0.05 | 0.22 | 0.06 | 0.06 | 0.26 | 0.07 | 0.06 | 0.25 | 0.07 | 0.07 | 0.29 | 0.08 | 0.06 | 0.23 | 0.07 | 0.06 | 0.26 | 0.08 | 0.04 | 0.12 | 0.05 | 0.04 | 0.13 | 0.05 | |
| 0.04 | 0.04 | 0.17 | 0.05 | 0.05 | 0.21 | 0.06 | 0.05 | 0.20 | 0.06 | 0.06 | 0.24 | 0.07 | 0.04 | 0.18 | 0.06 | 0.05 | 0.21 | 0.06 | 0.03 | 0.07 | 0.04 | 0.03 | 0.08 | 0.04 | |
| PA | 13.01 | 22.68 | 18.76 | 18.06 | 30.17 | 25.72 | 24.33 | 20.25 | 16.41 | 15.90 | 26.72 | 22.11 | 21.53 | 24.52 | 20.51 | 20.80 | 21.86 | 18.38 | 18.73 | 24.40 | 21.07 | 20.38 | 22.60 | 19.64 | 19.05 |
3.3.1 Psychoacoustic loudness
Since psychoacoustic loudness is a relative linear scale (i.e. doubling of loudness in Sones is equivalent to the doubling of the loudness sensation), and closely represents the human perception of loudness (International Organization for Standardization, 2017), the psychoacoustic loudness is assessed in terms of the index in percentages. For instance, the percentage change in for AIR noise after ANC is given by {} . In contrast to negligible attenuation in , a notable decrease in loudness was observed in all noise types noise types at and after ANC, in the absence of maskers (: ; : ; : ; : ; : ; : ).
Upon the addition of the bird masker the effect of ANC was diminished by more than half in AIR, and MRT noise types; and even increased the TRA loudness (: ; : ; : ).
Similarly, water masker further diminished the effect of ANC in AIR noise; and resulted in loudness increment in MRT, and TRA noise types (: ; : ; : ).
3.3.2 Psychoacoustic sharpness
Psychoacoustic sharpness is an objective representation of the amount of high-frequency content, without level dependence (i.e. sharpness doubles with an increase in sound level from to ), and is negatively correlated to the pleasantness sensation Zwicker and Fastl (2013). Percentage change in sharpness indices were computed similar to loudness in Section 3.3.1.
Across all sharpness indices, ANC resulted in between 7.10 to increase in average sharpness across all noise types at both and (: ; : ; : ; : ; : ; : ).
With predominantly high frequencies in the bird masker, its addition further increased the average sharpness of the residual noise after ANC, across all noise types (: ; : ; : ). Moreover, due to greater high-frequency content in the water masker, the average sharpness was also notably increased when the water masker was added after ANC (: ; : ; : )
3.3.3 Psychoacoustic roughness and fluctuation strength
Psychoacoustic roughness R and fluctuation strength FS indices quantitatively describe the perception due to temporal variations. Slow variations in the sound are characterized by the sensation of FS, which gradually transitions to a sensation of R that describes quickly varying sounds. Since both FS and R scores were marginal across all conditions (), they are not examined here for brevity. It is worth noting that experiments have shown that it is perceptually ‘no longer rough’ at , and a similar assumption can be made for FS given close similarities in the underlying computational model with R (Zwicker and Fastl, 2013).
3.3.4 Psychoacoustic tonality
Psychoacoustic tonality is the quantification of the amount of tonal components in the sound based on psychoacoustic loudness computation of tonal and non-tonal components. Similar to psychoacoustic loudness, percentage reduction in is computed for .
An increment in tonality was observed in the residual noise after ANC in AIR and MRT noise types at both and , whereas a slight reduction in tonality was observed in the residual TRA noise at both levels (: ; : ; : ; : ; : ; : ).
The strong tonal components in the bird masker resulted in about 1.5 fold increase in tonality in the residual AIR noise after ANC when the bird masker was added; only increase in MRT residual due to greater tonality components in MRT noise; and almost 2 fold increase in tonality in the residual TRA noise (: ; : ; : ).
In contrast, the broadband nature and energetic masking properties of the water masker reduced overall tonality of the residual noise between and across the noise types. (: ; : ; : ).
3.4 Annoyance
3.4.1 Degree of agreement on annoyance between verbal and numerical scale
To examine the degree of agreement between the verbal and numerical annoyance scales with Bland-Altman statistics and plots, as shown in Figure B.1 in Appendix B, the 5-point verbal category scale was first upscaled to between 0 and 100 to match the 101-point numerical scale, i.e. {0, 25, 50, 75, 100} (Brink et al., 2016). From the assessing the mean of the differences in the stimuli annoyance scores, a slight negative bias was observed only in for AIR noise; in , , , and for MRT noise; as well as in and for TRA noise, wherein the bias occurs if the equivalence line falls beyond the mean confidence intervals.
Aside from several outliers beyond the narrow confidence intervals of the upper and lower limits of agreement (LoA), most scores are within the LoA, and thus both scales largely agree. Hence, the 101-point numerical scale was chosen for statistical purposes (International Organization for Standardization, 2021), and summarised in Section Appendix C in Appendix C.
3.4.2 Difference in annoyance
The 3W-ART ANOVA analysis showed significant difference in annoyance between noise types (), masker types (), and ANC conditions (), as shown in Section Appendix C. Interaction effects were only observed in the two-way interaction between masker type and ANC conditions ().
Posthoc ART contrast tests with Bonferroni correction for multiple pairs revealed that annoyance was significantly lowered with ANC with a large effect size (). Between masker types, the bird and water were each significantly less annoying than without masker, and both to a large effect (). No significant differences were found between B and W maskers.
In contrast tests of the masker-ANC interaction, bird masker with ANC () was significantly less annoying than (1) bird masker without ANC () with a large effect size (, ); (2) no masker without ANC () with a small effect (, ); and (3) no masker with ANC () with a large effect (, ). Water masker with ANC () was also significantly less annoying than (1) with a large effect (, ); (2) with a small effect (, ); and (3) with a large effect (, ). No significant differences were found in the remaining pairs.
3.5 Perceived affective quality
3.5.1 Circumplexity analysis
Based on the high correspondence index (CI) of 0.861 ( violations; ) via the RTHOR method, the PAQ scores reflected a good adherence to the underlying circumplexity of the PAQ model. Visual inspection of the PCA loadings also exhibited sinusoidal tendencies, and thus further affirms the validity of the circumplexity assumption PAQ model in assessing the indoor environment in the context of environmental noise. This deviates from previous findings in an acute care setting, where the PAQ model was found to violate the circumplexity assumption (Lam et al., 2022a). For conciseness, the circumplexity analysis is described in detail in Appendix D.
3.5.2 Effect on derived pleasantness and eventfulness
With adherence to circumplexity, the derived pleasantness and eventfulness scores were computed from the 8 PAQ attributes according ISO 12913-3, denoted by ISOPL and ISOEV, respectively, to give
| (1) |
and
| (2) |
respectively.
Despite the independence assumption of the ISOPL and ISOEV axes in the circumplex model, a multivariate analysis approach was adopted due to the lack of evidence in the applicability of the PAQ circumplex model in indoor environments. Since multivariate kurtosis is normal (), and manageably skewed (; Knief and Forstmeier (2021)), the 3W-MANOVA test was employed to examine the effect of noise types, maskers, and ANC on the combined ISOPL and ISOEV. Results of the 3W-MANOVA analysis revealed significant differences in the combined ISOPL and ISOEV between the noise types (, ) and maskers (, ) both with moderate effects. Significant difference was also observed in ANC conditions, but with a small effect (, ). Interaction effects were only significant between noise types and maskers with a small effect (, ).
Post-hoc univariate 3W-ANOVA for ISOPL revealed significant differences between masker types with a moderate effect (, ) and ANC conditions with a small effect (, ). No significant differences in ISOPL between noise types were found. Pairwise comparison with Tukey’s HSD between masker types showed that ISOPL significantly increased on the addition of bird (, ) and water (, ) maskers, both with a moderate effect, regardless of noise type or ANC conditions. The ISOPL was also significantly increased on the activation of ANC regardless of noise types and maskers, albeit to a small effect (, ).
In terms of interaction between noise types and maskers without considering ANC condition, Tukey’s HSD showed that the addition of water maskers regardless of ANC significantly increased the ISOPL when added to AIR noise with a moderate effect (, ), whereas the addition of bird maskers did not affect the ISOPL. On the other hand, ISOPL significantly increased with a large effect when either bird (, ) or water (, ) maskers were added to TRA noise regardless of ANC condition. In contrast, there was insufficient evidence to conclude that either maskers improved the ISOPL of MRT noise. On the whole, MRT noise was also found to be significantly more pleasant than TRA with a moderate effect (, ), but no difference in ISOPL between AIR and either MRT or TRA was observed, regardless of ANC condition. Within each noise type, no significant differences were found between bird and water maskers in terms of ISOPL.
Post-hoc univariate 3W-ANOVA for ISOEV revealed significant differences between noise types (, ) and maskers (, ), but no differences for ANC conditions. Post-hoc pairwise Tukey’s HSD showed that TRA noise regardless of masker and ANC conditions, had significantly lower ISOEV than AIR (, ) and TRA (, ), both with a large effect. Between maskers regardless of other conditions, the addition of bird (, ) and water (, ) maskers significantly increased the ISOEV, both with a moderate effect.
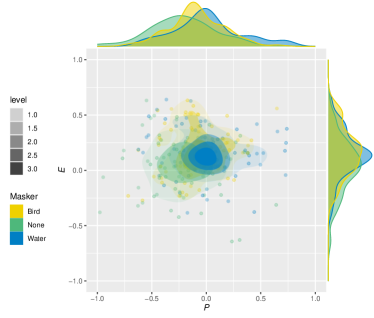
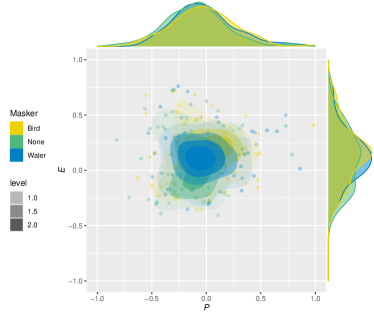
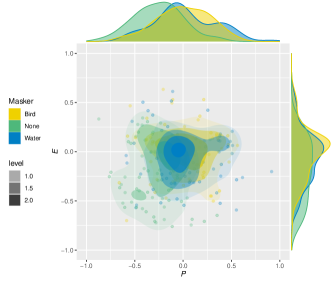
3.5.3 Analysis of distribution of individual scores
To further analyse the interaction effect of noise types and maskers on ISOPL and ISOEV, the distribution of the ISOPL and ISOEV scores of individual participants were examined (Mitchell et al., 2022). Since ISOPL and ISOEV is not influenced by ANC conditions, the distributions were aggregated over the ANC conditions, as shown in Figure 3. Based on the compactness of the 2D density heat map and unimodality of the individual ISOPL and ISOEV density distributions, the participants tend to agree on both ISOPL and ISOEV for all conditions of AIR, albeit with some outliers, as shown in Figure 3. The centrality of the 2D density heat maps indicates an overall neutrality of the ISOPL and ISOEV scores regardless of masker interventions for MRT noise, as shown in Figure 3. It is worth noting that the neutrality of the ISOEV scores in MRT without maskers could be attributed to the bimodal tendencies of the distribution around the centroid, as shown in Figure 3. On the other hand, there is a larger spread in the 2D density plots across masker conditions for TRA, as a result of the bimodality of the ISOPL due to water maskers and the ISOEV responses without maskers. The increment in ISOPL upon the addition of water masker to AIR is evident in the shift in ISOPL density distribution. Similarly, the significant increase in ISOPL in TRA is exhibited in the shift of densities upon the addition of either bird or water maskers.
3.6 Perceived loudness
Due to the non-normality of the loudness attribute across all noise types with the SWT (), the non-parametric 2W-ART ANOVA procedure was employed to investigate the differences and interactions between the masker types and ANC conditions, as shown in Section Appendix C. For each noise type, significant differences in PLN were found between the masker types (AIR: ; MRT: ; TRA: ) and also between the ANC conditions (AIR: ; MRT: , TRA: ). However, there was an absence of interaction effects between masker types and ANC conditions in all noise types.
Posthoc ART contrast tests with Bonferroni correction for multiple pairs revealed that PLN was significantly lower with than without ANC, across all noise types (AIR: ; MRT: ; TRA: ). A large effect size was observed in the PLN differences across AIR and TRA (), and a moderate effect was observed for MRT ().
Between masker types, PLN was only significantly increased when bird masker was added MRT without maskers with a moderate effect (, ). However, PLN was significantly increased with a large effect when water was added to AIR (, ), MRT (, ), and TRA (, ) without maskers. Moreover, water maskers were also perceived to be significantly louder than bird maskers, with a large effect, across each noise type (AIR: , ; MRT: , ; TRA: , ).
3.7 Prediction of perceived annoyance and loudness
Pearson’s correlation across all the objective indicators and perceptual attributes (i.e. PAY, PLN, ISOPL, ISOEV) were tabulated in Section Appendix C. Owing to the generality of PAY, ISOPL and ISOEV assessments, they are not directly relatable to the noise-type dependent PLN assessment, and thus PLN is assumed to be uncorrelated with PAY, ISOPL and ISOEV.
The PAY was correlated (, ) with ; ; , , , ; , , , and ; all indicators; PA; and ISOPL. Besides PAY, ISOPL is also correlated with ; ; all indicators; and all indicators except and . On the other hand, ISOEV is correlated to all , , , and indicators; , , and ; , , , and ; PA; as well as level derivatives , , and .
The PLN of the AIR noise stimuli was correlated to all indicators; , , , and ; , , , and ; ; and ; ; and PA. The MRT noise stimuli PLN was correlated to all the and indicators except their maximum; all the indicators; ; PA; and ISOEV. Lastly, the PLN of the TRA noise stimuli was correlated to all all the and indicators except their maximum; all indicators; all indicators; ; as well as PA.
Due to inherent differences in assessment of PAY and PLN, step-wise linear regression (SWLR) models were constructed independently to predict PAY and PLN. Only correlated predictors were included in the SWLR process. In the prediction of PAY, SWLR was conducted with and without subjective parameters (i.e. ISOPL and ISOEV). Through sequential replacement up to 6 predictors with a 5-fold cross validation strategy, the final model
| (3) |
with mixed objective and subjective indicators (, RMSE=2.285) seems to better predict PAY over the final model
| (4) |
with only objective indicators ( and RMSE=2.997).
As PLN was noise-type dependent, SWLR models were computed for stimuli in each of the noise types. To mitigate rank deficiencies the PLN models for AIR and MRT noise were determined based on sequential replacement up to 3 predictors via a 2-fold cross validation (8 stimuli per noise type) to yield
| (5) |
and
| (6) |
with or without subjective indicators ( and ; and ). The PLN model for TRA noise was similarly determined via sequential replacement up to 3 predictors but with a 3-fold cross validation (9 stimuli) to yield
| (7) |
with or without subjective indicators ( and )
3.8 Sentiment analysis of descriptive comparison
To examine the qualitative effect of the stimuli as compared to the reference stimuli, a sentiment analysis was employed. A positive sentiment is graded with a positive score, whereas a negative sentiment is given a negative score. To account for negators, amplifiers or valence shifters that modify the sentiment, e.g. not annoying, a lexicon based analysis was conducted at sentence level. The descriptive comparisons were analyzed at sentence level based on comparisons with a dictionary of polarized words to yield a sentiment score (Rinker, 2021). When more than one sentence was used to describe a stimuli, the sentiment score was taken as the mean across all the sentence sentiments.
Following non-normality of the sentiment scores for each noise type with SWT (), the main effects in sentiment polarity due to masker types and ANC condition was examined with the 2W-ART ANOVA. Significant differences were found only in masker types for MRT noise (). No significant differences in sentiment was observed in all other cases. Post-hoc ART contrast tests with Bonferroni correction for multiple pairs revealed that the addition of the bird masker resulted in a significantly positive sentiment over the addition of the water masker (, ) or with no masker (, ), regardless of ANC condition, as shown in Section Appendix C and Section Appendix C in Appendix C.
4 Discussion
[comment=R1.3]The following discussion seeks to address the research questions established in Section 1.5. Section 4.1 examines the impact of active reduction of low-frequencies in typical urban noise types by the ANW on comfort perception (RQ1). Section 4.2 analyzes the objective performance and comfort perception of the ANW when combined with representative biophilic maskers in mitigating typical urban noise (RQ3). Section 4.3 assesses the reliability of estimating perceived acoustic comfort in the evaluation of novel acoustic solutions using only objective parameters (RQ3). Finally, Section 4.4 addresses the limitations of this study and and provide avenues for future research.
4.1 Effect of active noise control
Objectively, the effect of ANC was evident in the spectral-based analysis of sound pressure measurements using both the HATS and EA microphones. A substantial reduction of approximately was observed within the effective operating bandwidth of ANC ( to ). Although single-value decibel-based indicators showed minimal reductions on the full audio bandwidth ( to ), which is within the just noticeable difference of equivalent SPL (JNDSPL) range of 1– (White, 2018), there was notable decrease in psychoacoustic loudness based on the HATS measurements across all noise types. This objective reduction in psychoacoustic loudness was reflected in the significant reduction in the subjective perception of perceived loudness within each noise type, which is much greater than the JNDN of 0.5 to (Fusaro et al., 2022), regardless of masker intervention.
Despite some general increases in other psychoacoustic parameters, such as sharpness and tonality, the subjective perception of perceived annoyance was consistently reduced with ANC, regardless of noise type and masker intervention. It is important to note that the increase in exceeded the JNDS of (Fusaro et al., 2022; Pedrielli et al., 2008). The assessment of PAY according to ISO/TS 15666 aligns with the assessment of derived ISOPL based on ISO/TS 12913-3, showing a significant increase in ISOPL with ANC, regardless of noise type and masker intervention. The interaction effects with ANC were only observed in PAY, where the addition of bird or water maskers after ANC resulted in a significant reduction in PAY compared to when either maskers were added without ANC, with ANC alone, or no interventions. Therefore, the integration of ANC with IM using biophilic maskers has proven effective in reducing PAY in domestic settings. Qualitatively assessing the effect of ANC against the reference without intervention within each noise type, the presence of ANC did not alter the sentiment.
The reduction in PAY and increased ISOPL, despite the increment in psychoacoustic sharpness, deviate from previous findings on construction machinery (Hong et al., 2022) and typical urban sound sources (Orga et al., 2021), where higher was associated with greater annoyance. Additionally, has been an indicator of unpleasantness, particularly for aircraft noise (Torija et al., 2019). These findings provide further evidence of the context-dependency when evaluating the acoustic environment and highlight the prominent role of low-frequency sounds in the overall perception of annoyance (Kang, 2017).
4.2 Effect of informational masking on ANC
The addition of maskers at below urban noise levels would technically result in a barely perceptible increase based on the borderline objective increment in levels (<) similar to the JNDSPL, in both EA and HATS measurements, with or without ANC. In some instances both with and without ANC, however, the associated decibel-based indicators related to the temporality of the sound exhibited increments above the JNDSPL. For instance, the intermittent, high-frequency bird masker increased associated A-weighted parameters (i.e. , ) in the HATS measurements only in predominantly lower frequency urban noise (i.e., MRT, TRA), whereas the broadband, low-frequency water masker resulted in increased associated A- and C-weighted parameters (i.e. , , , ) only in non-stationary urban noise types (i.e. AIR, MRT).
In terms of psychoacoustic loudness (i.e. ), the addition of the bird masker with ANC perceptibly halved the attenuation effect of ANC (> JNDN) in non-stationary urban noise types (i.e. AIR, MRT) and resulted in perceptible increment in TRA. Subjectively, however, the increase in PLN was only found to be significant when the bird masker was added to MRT. In terms of the water masker, its introduction perceptibly diminished the attenuation effect of ANC on to a third in AIR, resulted in perceptible increment in TRA, but did not affect the in MRT. Nevertheless, the subjective PLN was significantly increased regardless of noise type and ANC when water masker was introduced. The discrepancies between the psychoacoustic loudness, decibel-based metrics, and subjective PLN suggests that complex urban acoustic environments cannot be represented solely by energy-based acoustic indicators.
The addition of either masker further increased the psychoacoustic sharpness after ANC beyond the JNDS, except when the bird masker was added to MRT and TRA. The significant reduction in PAY as described in Section 4.1, despite further increment in upon the addition of either masker, is in further contrary to the previously reported positive correlation between and PAY.
Owing to the tonal nature of the bird masker, was further increased significantly when bird maskers were added after ANC, whereas the addition of the broadband water masker after ANC substantially reduced the . At least for AIR, the addition of the bird masker significantly decreased the PAY and did not affect the ISOPL, deviating from the literature wherein increased tonality was associated with increased annoyance (Torija et al., 2019).
4.2.1 Subjective effects on aircraft noise
Subjectively, addition of either masker to AIR after ANC significantly decreased the PAY, increased ISOEV, but did not impact sentiment scores. Water maskers also significantly increased the ISOPL and PLN, whereas bird maskers did not affect ISOPL and PLN.
Even though PAY reduction occurred to a large effect regardless of masker type when combined with ANC, its congruence with ISOPL increment appears to provide stronger evidence for preference of water over bird sounds for masking AIR after ANC. However, it is important to note that introduction of water sounds resulted in confusion and increased disturbance in about of the qualitative responses as compared to about for bird, when added to AIR. This aligns with previous findings that appropriateness was dependent on the visibility of the sound source for water maskers in outdoor urban environments (Lugten et al., 2018; Hong et al., 2020a, b; Li and Lau, 2020), and thus water maskers should be cautiously employed over bird maskers. Moreover, the effect of masking was previously found to be dependent on the SPL of the target urban noise (Hong et al., 2020c, 2021), and thus limits the applicability of the findings to AIR at . The dearth of research on the perception of maskers in indoor environments exposed to AIR also warrants further investigation. All in all, With the evidence presented, it becomes apparent that adding bird maskers after ANC of AIR to further reduce the PAY is more appropriate when an increase in PLN is not desired.
4.2.2 Subjective effects on MRT noise
When either maskers were added to MRT after ANC, there was a significant decrease in PAY and increase in ISOEV, but no change in ISOPL. In contrast to AIR, both maskers increased the PLN with MRT. Bird maskers also resulted in significantly positive shift in sentiments, whereas water maskers had no impact.
Despite their ability to further reduce the PAY after ANC of MRT, none of the maskers could reduce or at the least not impact the PLN. The positive shift in sentiments as a result of the bird masker, however, merits further investigation, especially due to the lack of literature on MRT noise exposure indoors at wider range of SPL levels.
4.2.3 Subjective effects on traffic noise
Either masker seems to the most effective when added to TRA after ANC, whereby PAY was significantly decreased, both ISOPL and ISOEV were significantly increased, but both had no effect on the sentiment. Similar to all the other noise types, the water masker significantly increased the PLN, whereas the bird masker did not affect the PLN.
Although the increase in ISOPL corroborates with previous work on the augmentation of traffic noise with bird or water maskers (Hong et al., 2020c; Hao et al., 2016), the resultant increase in PLN upon the addition of water maskers to TRA deviate from previous findings (Coensel et al., 2011b; Hong et al., 2020b), albeit for outdoor urban acoustic environments. Likewise with AIR, only bird maskers appear to further reduce the PAY without increasing the PLN of MRT after ANC.
4.3 Role of objective and subjective metrics in evaluating perceived acoustic comfort
Since perceived annoyance carries associated health risks (World Health Organization Regional Office for Europe, 2018), and perceived loudness influences PAY (Rådsten Ekman et al., 2015), both PAY and PLN could be used to evaluate the overall indoor acoustic comfort. Thus, it is worthwhile to examine the extent to which PAY and PLN can be solely predicted by objective indicators.
Overall, PAY appears to best predicted by a linear combination of a single objective () and a subjective (ISOPL) parameter with a fit, which is better than the SWLR model with only objective parameters (, , ). The inclusion of C-weighted parameters in both linear regression models imply that PAY is notably influenced by low-frequency perception, further exposing the limitations of A-weighted indicators.
On the other hand, the best perceived loudness SWLR prediction models for each noise type did not include any subjective parameters. Notably, the goodness of fit for and prediction models were and , respectively, whereas the was only , which could be attributed to the difficulty in judging the PLN of the non-stationary aircraft noise. Interestingly, could be predicted by a combination of and , but could be fully predicted with .
Based on the PAY and PLN prediction models, it appears that almost all the psychoacoustic indicators were not useful for measuring the overall PAY, and the PLN of MRT and TRA. It is worth noting that the ISOPL derived from the PAQ in ISO/TS 12913-3 still proves to be useful in determining PAY in indoor soundscapes, in spite of recent concern regarding the validity of the PAQ circumplex model for indoor soundscapes (Torresin et al., 2020, 2019). Recent developments in the prediction of ISOPL with large subjective datasets could also pave the way for reliable prediction of PAQ without requiring subjective input (Ooi et al., 2023b, a; Watcharasupat et al., 2022; Ooi et al., 2022).
4.4 Limitations and future work
[comment=R2.8]This study acknowledges several limitations that warrant consideration, along with directions for future research. Firstly, it is important to note that the majority of participants were university students between the ages of 21 and 30 due to the remote location of the university campus. As a result, the generalizability of the findings is limited to the younger demographic, and follow-up studies should employ stratified sampling to ensure broader representation. \chadded[comment=R2.3]Furthermore, while temperature was effectively controlled to minimize its potential confounding effects, further investigation is needed to explore potential interaction effects that may arise under warmer temperature conditions (Nitidara et al., 2022; Yin et al., 2022). Recent evidence has underscored the significance of the acoustic environment in warmer conditions (Guan et al., 2020), thus emphasizing the potential of the ANC-IM approach to enhance overall indoor comfort. \chadded[comment=R2.6]Additionally, despite efforts to ensure accurate reproduction of the audio stimuli, real-world acoustic conditions could be substantially influenced by factors such as building orientation and elevation (Sheikh and Lee, 2014a, b).
In light of the perceptual differences observed with the ANW and its proposed integration with biophilic maskers, it is essential to acknowledge several limitations. Firstly, the PAY and PLN prediction models are valid for comparison to urban noise experienced at , with the exception of TRA, which was also evaluated at , i.e. . Secondly, the level at which the biophilic maskers were reproduced (i.e. ) may not be optimal for indoor soundscapes due to the shift in context (Torresin et al., 2020), which together with the choice of masker is an important topic for future exploration. Thirdly, the spatial orientation of the maskers may also not be optimal although it is logical for biophilic sounds to impinge through the window (Torresin et al., 2022a; Hong et al., 2020b), which should be verified in in the future.
5 Conclusion
Active control and interference are noise mitigation strategies that preserve natural ventilation and affords greater user control and flexibility over passive control methods. However, their perceptual effect on indoor acoustic comfort and potential for integration are not commonly investigated. Moreover, it is also worthwhile to determine the extent to which objective parameters could translate to perception such as perceived annoyance (PAY) and perceived loudness (PLN). This study evaluated an active-noise-control (ANC)-based “anti-noise” window (ANW) integrated with informational masking (IM) to enhance indoor acoustic comfort in a model bedroom.
On the first research question to determine the effect of ANC alone, despite minimal objective reduction in decibel-based indicators, the ANW significantly reduced PAY and PLN across all noise types, while increasing the derived pleasantness (ISO 12913-3). Moreover, the reduction of low-frequency content in urban noise through the ANW, and resultant increase acoustic comfort but also psychoacoustic sharpness, underscores the importance of low-frequency noise perception which is lost in traditional “A-weighting” parameters and exposes the limitations of objective psychoacoustic indicators in accessing complex urban noises.
Interaction discovered between the masker and the ANC effect of the ANW suggests that the proposed integration further increases the overall indoor acoustic comfort than with just the ANW or biophilic masking alone. Hence, there is great potential to further develop the ANC-IM approach and its associated human-centered evaluation for sustainable urban sound management in the built environment.
Declaration of competing interest
The authors declare that they have no known competing financial interests or personal relationships that could have appeared to influence the work reported in this paper.
Acknowledgements
This research is supported by the Singapore Ministry of National Development and the National Research Foundation, Prime Minister’s Office under the Cities of Tomorrow Research Programme (Award No. COT-V4-2019-1 and COT-V4-2020-1). Any opinions, findings and conclusions or recommendations expressed in this material are those of the authors and do not reflect the view of National Research Foundation, Singapore, and Ministry of National Development, Singapore.
Data Availability
The data that support the findings of this study are openly available in NTU research data repository DR-NTU (Data) at https://doi.org/10.21979/N9/SEGEFM. The replication code used in this study is available on GitHub at the following repository: https://github.com/ntudsp/SPANR. The code includes all the necessary scripts, functions, and instructions to reproduce the results reported in the study.
Appendix A Questionnaires
Table A.1
Pre-test assessment participant information questionnaire
| Question Category | Instructions | Specific Questions | Rating Scale |
|---|---|---|---|
| Individual Noise Sensitivity (INS) | To what extent you disagree/agree with the following sentences? | ‘I wouldn’t mind living on a noisy street if the apartment I had was nice.’ | Strongly Disagree–Strongly Agree (5-point categorical) |
| ‘No one should mind much if someone turns up his or her stereo full blast once in awhile.’ | |||
| ‘I get used to most noises without much difficulty.’ | |||
| ‘It would matter to me if an apartment I was interested in renting were located across from a fire station.’ | |||
| ‘It wouldn’t bother me to hear the sounds of everyday living from neighbors (footsteps, running water, etc.).’ | |||
| ‘I’m good at concentrating no matter what is going on around me.’ | |||
| ‘In a library, I don’t mind if people carry on a conversation if they do it quietly.’ | |||
| ‘I get mad at people who make noise that keeps me from falling asleep or getting work done.’ | |||
| ‘I wouldn’t mind living in an apartment with thin walls.’ | |||
| ‘I am more aware of noise than I used to be.’ | Strongly Agree–Strongly Disagree (5-point categorical) | ||
| ‘At movies, whispering and crinkling candy wrappers disturb me.’ | |||
| ‘I am easily awakened by noise.’ | |||
| ‘If it’s noisy where I’m studying, I try to close the door or window or move someplace else.’ | |||
| ‘I get annoyed when my neighbors are noisy.’ | |||
| ‘Sometimes noises get on my nerves and get me irritated.’ | |||
| ‘Even music I normally like will bother me if I’m trying to concentrate.’ | |||
| ‘When I want to be alone, it disturbs me to hear outside noises.’ | |||
| ‘There are often times when I want complete silence.’ | |||
| ‘Motorcycles ought to be required to have bigger mufflers.’ | |||
| ‘I find it hard to relax in a place that’s noisy.’ | |||
| ‘I am sensitive to noise.’ | |||
| Baseline Noise Annoyance (BNA) | Thinking about the last (12 months or so), when you are here at home, how much does noise from (noise source) bother, disturb or annoy you? | Road traffic | Not at all–Extremely (5-point categorical) |
| Aircraft | |||
| MRT | |||
| Construction Work (Work Site) | |||
| Construction Work (Renovations) | |||
| Any other noises (specify) | |||
| Road traffic | Not at all–Extremely (0-to-100 numerical scale) | ||
| Aircraft | |||
| MRT | |||
| Construction Work (Work Site) | |||
| Construction Work (Renovations) | |||
| Any other noises (specify) | |||
| 10-item Perceived Stress Scale (PSS-10) | The questions in this scale ask you about your feelings and thoughts during the last month. In each case, you will be asked to indicate how often you felt or thought a certain way. Although some of the questions are similar, there are differences between them and you should treat each one as a separate question. The best approach is to answer each question fairly quickly. That is, don’t try to count up the number of times you felt a particular way, but rather indicate the alternative that seems like a reasonable estimate. In the last month, how often have you… * | been upset because of something that happened unexpectedly? | Never–Very Often (5-point categorical) |
| felt that you were unable to control the important things in your life | |||
| felt nervous and "stressed"? | |||
| felt confident about your ability to handle your personal problems? | |||
| felt that things were going your way? | |||
| found that you could not cope with all the things that you had to do? | |||
| been able to control irritations in your life? | |||
| felt that you were on top of things? | |||
| been angered because of things that were outside of your control? | |||
| felt difficulties were piling up so high that you could not overcome them? | |||
| WHO-Five Well-being Index (WHO-5) | For each of the statements below, which is the closest to how you have been feeling over the last two weeks? | I have felt cheerful and in good spirits. | At no time–All of the time (6-point categorical) |
| I have felt calm and relaxed | |||
| I have felt active and vigorous | |||
| I woke up feeling fresh and rested. | |||
| My daily life has been filled with things that interest me. |
Table A.2
Questionnaire to assess each stimuli. Each stimuli could be repeated as many times as required to answer the questions.
| Question Category | Instructions | Specific Questions | Rating Scale |
| Perceived Annoyance (PAY) | Thinking about the noise you just heard, how much does the noise bother, disturb or annoy you? | Not at all–Extremely (5-point categorical) | |
| This uses a 0-to-100 opinion scale for how much the noise you heard bothers, disturbs or annoys. If you are not at all annoyed choose 0; if you are extremely annoyed choose 10; if you are somewhere in between, choose a number between 0 and 100. Thinking about the noise you just heard what number from 0 to 100 best shows how much you are bothered, disturbed or annoyed by the noise? | Not at all–Extremely (0-to-100 numerical scale) | ||
| Perceived Affective Quality (PAQ) | For each of the 8 scales below, to what extent do you agree or disagree that the surrounding sound environment you heard is | Eventful | Strongly Disagree–Strongly Agree (0-to-100 numerical scale) |
| Vibrant | |||
| Pleasant | |||
| Calm | |||
| Uneventful | |||
| Monotonous | |||
| Annoying | |||
| Chaotic | |||
| Perceived Loudness (PLN) | This task compares the test track you just heard to a reference track. If the perceived loudness of the reference track is assigned a value of 100, rate the perceived loudness of the test track in comparison with the reference track. For example, if the test track is twice as loud, it should be rated as 200. And if it is half as loud, it should be rated as 50. | Unbounded numerical rating | |
| Open-ended Description | Describe the test track in comparison to the reference track in a few descriptive words. | Text input | |
Appendix B Bland-Altman statistics between 5-point categorical and 101-point numerical scale on perceived annoyance
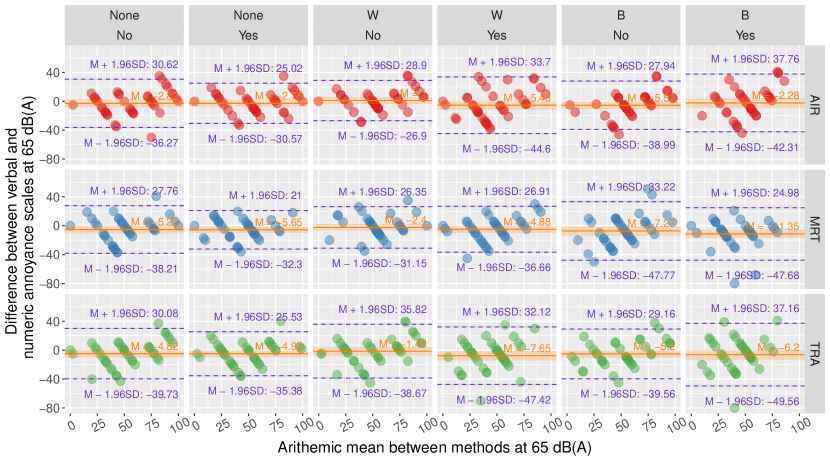
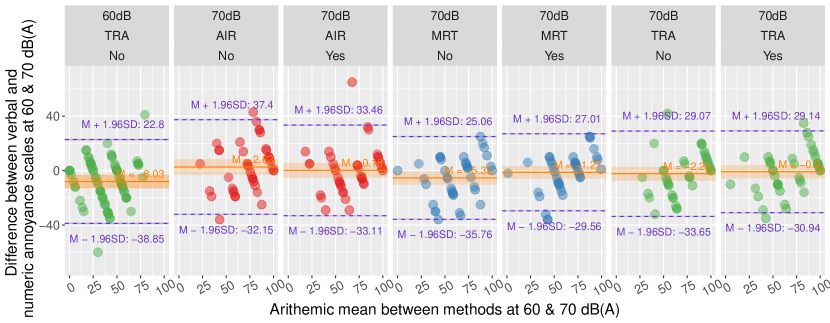
Appendix C Statistical results
Table C.1
Summary of questionnaire scores on perceived annoyance (PAY), perceived affective quality (PAQ), and perceived loudness (PLN)
| PAY | PAQ | PLN | |||||||||||||||||||||
| e | v | p | ca | u | m | a | ch | ||||||||||||||||
| Noise Type | Masker | SPL, dB(A) | ANC | ||||||||||||||||||||
| No | 57.00 | 25.40 | 46.77 | 22.82 | 39.05 | 23.09 | 29.26 | 19.67 | 27.36 | 23.11 | 41.03 | 24.39 | 49.49 | 22.88 | 60.18 | 23.67 | 50.82 | 24.89 | 98.69 | 16.07 | |||
| 65 | Yes | 56.95 | 26.44 | 46.92 | 21.91 | 36.31 | 23.99 | 33.51 | 20.72 | 28.36 | 21.14 | 47.31 | 21.94 | 52.97 | 22.05 | 55.46 | 26.64 | 47.03 | 25.38 | 93.31 | 28.33 | ||
| No | 70.85 | 20.38 | 54.23 | 24.33 | 38.36 | 26.52 | 21.92 | 14.95 | 23.59 | 20.22 | 39.41 | 22.88 | 44.15 | 26.83 | 71.23 | 20.22 | 60.77 | 24.25 | 127.85 | 36.09 | |||
| None | 70 | Yes | 65.64 | 23.15 | 54.44 | 25.94 | 40.08 | 27.74 | 25.64 | 19.07 | 25.72 | 21.53 | 38.00 | 25.44 | 46.23 | 24.71 | 66.90 | 25.07 | 54.64 | 26.83 | 123.15 | 36.16 | |
| No | 61.05 | 18.73 | 56.92 | 19.26 | 52.33 | 23.33 | 37.49 | 20.05 | 33.56 | 20.58 | 38.79 | 22.00 | 37.51 | 20.47 | 55.69 | 20.25 | 55.85 | 18.45 | 100.38 | 28.41 | |||
| Bird | 65 | Yes | 52.74 | 16.84 | 54.08 | 17.24 | 51.23 | 22.96 | 37.13 | 17.23 | 33.00 | 20.01 | 38.87 | 21.88 | 35.79 | 20.80 | 53.21 | 18.50 | 51.67 | 19.13 | 91.00 | 26.24 | |
| No | 54.62 | 22.78 | 58.15 | 20.20 | 54.82 | 22.11 | 42.21 | 22.41 | 38.95 | 20.68 | 37.92 | 22.43 | 37.38 | 22.51 | 55.49 | 22.95 | 51.59 | 24.12 | 121.59 | 44.16 | |||
| Aircraft | Water | 65 | Yes | 48.08 | 22.19 | 56.08 | 17.73 | 53.23 | 22.32 | 48.33 | 23.11 | 46.69 | 24.81 | 34.77 | 20.91 | 34.36 | 20.29 | 46.54 | 23.68 | 43.56 | 21.21 | 104.69 | 40.64 |
| 60 | No | 41.95 | 21.68 | 32.26 | 19.34 | 29.46 | 22.35 | 33.58 | 22.95 | 40.94 | 23.65 | 59.67 | 24.49 | 70.94 | 21.23 | 44.81 | 23.98 | 39.05 | 25.39 | 64.68 | 22.34 | ||
| No | 54.62 | 23.06 | 36.08 | 24.38 | 30.23 | 20.87 | 25.97 | 17.79 | 34.08 | 23.85 | 61.05 | 27.39 | 69.79 | 21.24 | 55.79 | 24.84 | 46.51 | 25.19 | 99.92 | 15.37 | |||
| 65 | Yes | 49.03 | 23.33 | 33.49 | 22.29 | 29.44 | 21.04 | 27.41 | 16.42 | 33.87 | 20.51 | 63.10 | 26.17 | 70.85 | 20.21 | 50.51 | 24.78 | 39.85 | 24.84 | 79.67 | 21.35 | ||
| No | 71.64 | 19.64 | 38.49 | 27.92 | 28.46 | 21.09 | 19.31 | 16.05 | 22.00 | 18.43 | 55.05 | 29.10 | 72.03 | 23.94 | 71.77 | 21.07 | 55.54 | 26.05 | 152.79 | 34.35 | |||
| None | 70 | Yes | 67.85 | 22.93 | 37.26 | 27.93 | 29.74 | 23.17 | 21.08 | 18.01 | 27.54 | 23.03 | 59.79 | 28.35 | 69.74 | 24.45 | 66.10 | 22.54 | 49.49 | 28.55 | 138.41 | 35.12 | |
| No | 53.74 | 23.04 | 47.08 | 22.90 | 44.28 | 20.98 | 38.26 | 20.13 | 36.15 | 20.72 | 48.51 | 22.68 | 48.38 | 24.86 | 51.95 | 22.19 | 42.51 | 25.89 | 96.51 | 24.16 | |||
| Bird | 65 | Yes | 45.87 | 19.00 | 45.49 | 20.63 | 51.82 | 21.98 | 48.59 | 20.54 | 46.36 | 22.96 | 48.15 | 17.52 | 43.28 | 20.61 | 41.05 | 18.35 | 35.85 | 20.40 | 81.36 | 18.71 | |
| No | 51.82 | 24.41 | 44.46 | 20.25 | 45.67 | 22.57 | 42.31 | 23.86 | 41.36 | 23.30 | 53.49 | 23.50 | 55.59 | 22.28 | 53.08 | 24.08 | 43.82 | 23.64 | 131.74 | 38.64 | |||
| Traffic | Water | 65 | Yes | 46.95 | 19.71 | 45.72 | 20.74 | 51.92 | 22.80 | 53.41 | 20.60 | 55.79 | 20.63 | 50.56 | 23.49 | 47.79 | 23.85 | 39.69 | 20.47 | 34.97 | 22.45 | 107.67 | 38.92 |
| No | 53.21 | 22.35 | 56.79 | 21.64 | 47.51 | 22.19 | 36.95 | 19.97 | 32.62 | 21.36 | 42.56 | 23.61 | 42.87 | 22.64 | 54.56 | 22.39 | 51.10 | 22.48 | 101.49 | 20.91 | |||
| 65 | Yes | 45.90 | 21.91 | 53.85 | 20.26 | 46.26 | 19.84 | 37.41 | 17.77 | 38.26 | 18.39 | 43.59 | 25.61 | 43.97 | 22.87 | 50.77 | 21.18 | 47.26 | 21.22 | 89.18 | 23.88 | ||
| No | 63.82 | 21.92 | 60.69 | 19.51 | 46.05 | 22.68 | 29.41 | 16.58 | 25.21 | 16.09 | 37.41 | 22.30 | 42.31 | 23.43 | 63.82 | 22.25 | 60.72 | 20.64 | 133.90 | 39.97 | |||
| None | 70 | Yes | 62.18 | 19.04 | 56.28 | 20.94 | 46.33 | 22.90 | 28.79 | 15.60 | 24.31 | 16.13 | 38.28 | 22.74 | 35.38 | 23.44 | 63.38 | 20.45 | 57.08 | 20.64 | 126.38 | 39.57 | |
| No | 55.36 | 17.89 | 58.18 | 21.37 | 52.13 | 22.08 | 40.85 | 21.07 | 36.51 | 21.73 | 37.44 | 21.18 | 36.33 | 16.89 | 53.92 | 21.61 | 50.41 | 19.64 | 103.74 | 27.85 | |||
| Bird | 65 | Yes | 46.56 | 21.91 | 58.03 | 19.06 | 53.82 | 20.86 | 44.21 | 21.31 | 40.97 | 20.32 | 37.79 | 20.99 | 38.72 | 19.75 | 48.23 | 23.58 | 45.10 | 22.16 | 98.36 | 25.03 | |
| No | 55.92 | 20.15 | 57.92 | 19.41 | 52.85 | 22.65 | 39.33 | 20.46 | 39.64 | 19.37 | 38.46 | 20.93 | 35.79 | 22.11 | 56.36 | 20.79 | 49.08 | 22.53 | 121.87 | 35.52 | |||
| Train | Water | 65 | Yes | 47.44 | 20.57 | 53.44 | 19.89 | 49.51 | 21.83 | 45.82 | 20.95 | 43.15 | 21.87 | 39.10 | 20.89 | 37.54 | 21.36 | 45.46 | 23.32 | 47.00 | 22.58 | 116.08 | 38.72 |
Table C.2
Summary of ART ANOVA and relevant post-hoc contrast tests for annoyance analysis. Interaction and pairwise comparisons are denoted by the colon and en-dash terms, respectively. Combination of variables is denoted by a comma.
| Term | Test | -value | d |
| Noise Type | 3W-ART ANOVA | 0.0003*** | |
| AIR–TRA | ART Contrast | 0.0006*** | 3.4071 |
| AIR–MRT | ART Contrast | 0.0044** | 2.9624 |
| TRA–MRT | ART Contrast | 1.0000 | -0.4447 |
| Masker | 3W-ART ANOVA | 0.0000 | |
| Bird–None | ART Contrast | 0.0005*** | -3.2629 |
| Bird–Water | ART Contrast | 1.0000 | 0.7757 |
| None–Water | ART Contrast | 0.0000**** | 4.0386 |
| ANC | 3W-ART ANOVA | 0.0094** | |
| No–Yes | ART Contrast | 0.0094** | 1.9551 |
| Noise Type:Masker | 3W-ART ANOVA | 0.2329 | |
| Noise Type:ANC | 3W-ART ANOVA | 0.2886 | |
| Masker:ANC | 3W-ART ANOVA | 0.0011** | |
| Bird,No–Bird,Yes | ART Contrast | 0.0052** | 3.4071 |
| Bird,No–None,No | ART Contrast | 1.0000 | 2.9624 |
| Bird,No–None,Yes | ART Contrast | 1.0000 | -0.4447 |
| Bird,No–Water,No | ART Contrast | 1.0000 | 3.4071 |
| Bird,No–Water,Yes | ART Contrast | 0.0029** | 2.9624 |
| Bird,Yes–None,No | ART Contrast | 0.0001*** | -0.4447 |
| Bird,Yes–None,Yes | ART Contrast | 0.0000**** | 3.4071 |
| Bird,Yes–Water,No | ART Contrast | 0.1328 | 2.9624 |
| Bird,Yes–Water,Yes | ART Contrast | 1.0000 | -0.4447 |
| None,No–None,Yes | ART Contrast | 1.0000 | 3.4071 |
| None,No–Water,No | ART Contrast | 1.0000 | 2.9624 |
| None,No–Water,Yes | ART Contrast | 0.0000**** | -0.4447 |
| None,Yes–Water,No | ART Contrast | 0.6988 | 3.4071 |
| None,Yes–Water,Yes | ART Contrast | 0.0000**** | 2.9624 |
| Water,No–Water,Yes | ART Contrast | 0.0839 | -0.4447 |
| Noise Type:Masker:ANC | 3W-ART ANOVA | 0.4323 | |
| *:p<0.05, **:p<0.01, ***:p<0.001, ****:p<0.0001 | |||
Table C.3
Summary of 3WMANOVA, post-hoc univariate 3WANOVA, and relevant post-hoc Tukey HSD tests for ISOPL and ISOEV. Interaction and pairwise comparisons are denoted by the colon and en-dash terms, respectively. Combination of variables is denoted by a comma. Effect size for 3WMANOVA and 3WANOVA are based on , while the effect size for Tukey’s HSD is based on Cohen’s .
| Variable | Term | Test | p-value | Effect |
|---|---|---|---|---|
| Noise Type | 3WMANOVA | 0.0000**** | 0.0739 | |
| Masker | 3WMANOVA | 0.0000**** | 0.0615 | |
| ANC | 3WMANOVA | 0.0001*** | 0.0272 | |
| Noise Type:Masker | 3WMANOVA | 0.0086** | 0.0148 | |
| Noise Type:ANC | 3WMANOVA | 0.4501 | 0.0027 | |
| Masker:ANC | 3WMANOVA | 0.4680 | 0.0026 | |
| ISOPL:ISOEV | Noise Type:Masker:ANC | 3WMANOVA | 0.9792 | 0.0015 |
| Noise Type | 3WANOVA | 0.1203 | 0.0062 | |
| Masker | 3WANOVA | 0.0000**** | 0.0818 | |
| Bird–None | Tukey HSD | 0.0000**** | 0.5336 | |
| Bird–Water | Tukey HSD | 0.2191 | -0.1540 | |
| None–Water | Tukey HSD | 0.0000**** | -0.6876 | |
| ANC | 3WANOVA | 0.0001*** | 0.0225 | |
| No–Yes | Tukey HSD | 0.0001*** | -0.2996 | |
| Noise Type:Masker | 3WANOVA | 0.0088** | 0.0196 | |
| Aircraft,Bird–Aircraft,None | Tukey HSD | 0.1434 | 0.4352 | |
| Aircraft,Bird–Aircraft,Water | Tukey HSD | 0.3847 | -0.3577 | |
| Aircraft,Bird–Traffic,Bird | Tukey HSD | 0.6193 | -0.3030 | |
| Aircraft,Bird–Traffic,None | Tukey HSD | 0.0075** | 0.5903 | |
| Aircraft,Bird–Traffic,Water | Tukey HSD | 0.2682 | -0.3895 | |
| Aircraft,Bird–Train,Bird | Tukey HSD | 0.8395 | -0.2455 | |
| Aircraft,Bird–Train,None | Tukey HSD | 1.0000 | 0.0266 | |
| Aircraft,Bird–Train,Water | Tukey HSD | 0.7793 | -0.2634 | |
| Aircraft,None–Aircraft,Water | Tukey HSD | 0.0000**** | -0.7929 | |
| Aircraft,None–Traffic,Bird | Tukey HSD | 0.0002*** | 0.7382 | |
| Aircraft,None–Traffic,None | Tukey HSD | 0.9885 | 0.1551 | |
| Aircraft,None–Traffic,Water | Tukey HSD | 0.0000**** | -0.8247 | |
| Aircraft,None–Train,Bird | Tukey HSD | 0.0008*** | 0.6808 | |
| Aircraft,None–Train,None | Tukey HSD | 0.2095 | -0.4086 | |
| Aircraft,None–Train,Water | Tukey HSD | 0.0005*** | -0.6987 | |
| Aircraft,Water–Traffic,Bird | Tukey HSD | 1.0000 | -0.0547 | |
| Aircraft,Water–Traffic,None | Tukey HSD | 0.0000**** | -0.9480 | |
| Aircraft,Water–Traffic,Water | Tukey HSD | 1.0000 | -0.0317 | |
| Aircraft,Water–Train,Bird | Tukey HSD | 0.9988 | -0.1122 | |
| Aircraft,Water–Train,None | Tukey HSD | 0.2853 | -0.3844 | |
| Aircraft,Water–Train,Water | Tukey HSD | 0.9997 | 0.0943 | |
| Traffic,Bird–Traffic,None | Tukey HSD | 0.0000**** | 0.8933 | |
| Traffic,Bird–Traffic,Water | Tukey HSD | 0.9998 | -0.0864 | |
| Traffic,Bird–Train,Bird | Tukey HSD | 1.0000 | 0.0575 | |
| Traffic,Bird–Train,None | Tukey HSD | 0.5027 | 0.3297 | |
| Traffic,Bird–Train,Water | Tukey HSD | 1.0000 | 0.0396 | |
| Traffic,None–Traffic,Water | Tukey HSD | 0.0000**** | -0.9797 | |
| Traffic,None–Train,Bird | Tukey HSD | 0.0000**** | 0.8358 | |
| Traffic,None–Train,None | Tukey HSD | 0.0136* | -0.5636 | |
| Traffic,None–Train,Water | Tukey HSD | 0.0000**** | -0.8537 | |
| Traffic,Water–Train,Bird | Tukey HSD | 0.9930 | -0.1439 | |
| Traffic,Water–Train,None | Tukey HSD | 0.1890 | -0.4161 | |
| Traffic,Water–Train,Water | Tukey HSD | 0.9972 | 0.1260 | |
| Train,Bird–Train,None | Tukey HSD | 0.7466 | 0.2722 | |
| Train,Bird–Train,Water | Tukey HSD | 1.0000 | -0.0179 | |
| Train,None–Train,Water | Tukey HSD | 0.6745 | -0.2901 | |
| Noise Type:ANC | 3WANOVA | 0.1780 | 0.0050 | |
| Masker:ANC | 3WANOVA | 0.2001 | 0.0047 | |
| ISOPL | Noise Type:Masker:ANC | 3WANOVA | 0.7487 | 0.0028 |
| Noise Type | 3WANOVA | 0.0000**** | 0.1416 | |
| Aircraft–Traffic | Tukey HSD | 0.0000**** | 0.8302 | |
| Aircraft–Train | Tukey HSD | 0.9059 | -0.0392 | |
| Traffic–Train | Tukey HSD | 0.0000**** | -0.8693 | |
| Masker | 3WANOVA | 0.0000**** | 0.0461 | |
| Bird–None | Tukey HSD | 0.0000**** | 0.5116 | |
| Bird–Water | Tukey HSD | 0.3303 | 0.1314 | |
| None–Water | Tukey HSD | 0.0001*** | -0.3802 | |
| ANC | 3WANOVA | 0.0630 | 0.0050 | |
| Noise Type:Masker | 3WANOVA | 0.1353 | 0.0102 | |
| Noise Type:ANC | 3WANOVA | 0.8937 | 0.0003 | |
| Masker:ANC | 3WANOVA | 0.8445 | 0.0005 | |
| ISOEV | Noise Type:Masker:ANC | 3WANOVA | 0.9981 | 0.0002 |
| *:p<0.05, **:p<0.01, ***:p<0.001, ****:p<0.0001 | ||||
Table C.4
Summary of 2W-ART ANOVA, and relevant post-hoc ART contrast tests for PLN.
| Variable | Term | Test | -value | |
| Masker | 2W-ART ANOVA | 0.0009*** | ||
| Bird–None | ART Contrast | 1.0000 | -0.1377 | |
| Bird–Water | ART Contrast | 0.0016** | -1.0288 | |
| None–Water | ART Contrast | 0.0080** | -0.8911 | |
| ANC | 2W-ART ANOVA | 0.0000**** | ||
| No–Yes | ART Contrast | 0.0000**** | 1.0035 | |
| AIR | Masker:ANC | 2W-ART ANOVA | 0.5642 | |
| Masker | 2W-ART ANOVA | 0.0000**** | ||
| Bird–None | ART Contrast | 0.0286* | 0.7693 | |
| Bird–Water | ART Contrast | 0.0004*** | -1.1468 | |
| None–Water | ART Contrast | 0.0000**** | -1.916 | |
| ANC | 2W-ART ANOVA | 0.0066** | ||
| No–Yes | ART Contrast | 0.0066** | 0.6972 | |
| MRT | Masker:ANC | 2W-ART ANOVA | 0.5939 | |
| Masker | 2W-ART ANOVA | 0.0000**** | ||
| Bird–None | ART Contrast | 1.0000 | 0.08 | |
| Bird–Water | ART Contrast | 0.0000**** | -2.3868 | |
| None–Water | ART Contrast | 0.0000**** | -2.4668 | |
| ANC | 2W-ART ANOVA | 0.0000**** | ||
| No–Yes | ART Contrast | 0.0000**** | 2.2363 | |
| TRA | Masker:ANC | 2W-ART ANOVA | 0.1177 | |
| *:p<0.05, **:p<0.01, ***:p<0.001, ****:p<0.0001 | ||||
Table C.5
Summary statistics of sentiment scores.
| Variable | Masker | ANC | Mean, | SD, |
| No | -0.13 | 0.36 | ||
| Bird | Yes | 0.11 | 0.42 | |
| No | -0.07 | 0.33 | ||
| None | Yes | 0.03 | 0.31 | |
| No | 0.00 | 0.43 | ||
| AIR | Water | Yes | -0.05 | 0.46 |
| No | -0.07 | 0.31 | ||
| Bird | Yes | 0.11 | 0.27 | |
| No | -0.02 | 0.29 | ||
| None | Yes | -0.04 | 0.41 | |
| No | -0.19 | 0.47 | ||
| MRT | Water | Yes | -0.10 | 0.46 |
| No | 0.05 | 0.49 | ||
| Bird | Yes | -0.03 | 0.31 | |
| No | -0.02 | 0.35 | ||
| None | Yes | -0.05 | 0.31 | |
| No | -0.21 | 0.37 | ||
| TRA | Water | Yes | -0.02 | 0.43 |
Table C.6
Summary of ART ANOVA and relevant post-hoc contrast tests for sentiment analysis. Interaction and pairwise comparisons are denoted by the colon and en-dash terms, respectively.
| Variable | Test | Term | -value | Effect size, |
| Masker | 2W-ART ANOVA | 0.5025 | ||
| ANC | 2W-ART ANOVA | 0.0648 | ||
| AIR | Masker:ANC | 2W-ART ANOVA | 0.2964 | |
| Masker | 2W-ART ANOVA | 0.0008*** | ||
| Bird–None | ART Contrast | 0.0216* | 80.58 | |
| Bird–Water | ART Contrast | 0.0006*** | 129.11 | |
| None–Water | ART Contrast | 0.3126 | 48.53 | |
| ANC | 2W-ART ANOVA | 0.0934 | ||
| MRT | Masker:ANC | 2W-ART ANOVA | 0.2297 | |
| Masker | 2W-ART ANOVA | 0.1082 | ||
| ANC | 2W-ART ANOVA | 0.3741 | ||
| TRA | Masker:ANC | 2W-ART ANOVA | 0.1334 | |
| *:, **:, ***:, ****: | ||||
Table C.7
Pearson’s correlation across all objective and subjective indices. Values smaller than 0.28 have been removed for conciseness.
| PAY | PLN | |||||||||||||||||
| PAY | 1.00 | 0.32 | 0.28 | 0.29 | 0.30 | 0.30 | ||||||||||||
| PLN | 1.00 | 0.51 | 0.37 | 0.39 | 0.45 | 0.32 | 0.29 | 0.49 | 0.35 | 0.37 | 0.44 | 0.31 | 0.41 | |||||
| 0.32 | 0.51 | 1.00 | 0.76 | 0.88 | 0.90 | 0.71 | 0.37 | 0.33 | 0.99 | 0.73 | 0.85 | 0.88 | 0.68 | 0.13 | 0.79 | 0.92 | ||
| 0.76 | 1.00 | 0.96 | 0.95 | 0.80 | 0.98 | 0.96 | 0.96 | 0.13 | -0.36 | -0.40 | 0.97 | 0.90 | ||||||
| 0.28 | 0.37 | 0.88 | 0.96 | 1.00 | 1.00 | 0.33 | 0.90 | 0.95 | 0.99 | 0.99 | 0.30 | -0.30 | 0.97 | 0.97 | ||||
| 0.29 | 0.39 | 0.90 | 0.95 | 1.00 | 1.00 | 0.36 | 0.92 | 0.93 | 0.98 | 0.99 | 0.33 | 0.96 | 0.98 | |||||
| 0.45 | 0.71 | 0.33 | 0.36 | 1.00 | 0.76 | 0.69 | 0.66 | 0.31 | 0.34 | 0.99 | 0.70 | 0.62 | 0.40 | |||||
| 0.32 | 0.37 | 0.76 | 1.00 | 0.99 | 0.32 | 0.75 | 0.96 | 0.95 | ||||||||||
| 0.29 | 0.33 | 0.69 | 0.99 | 1.00 | 0.68 | 0.95 | 0.96 | |||||||||||
| 0.30 | 0.49 | 0.99 | 0.80 | 0.90 | 0.92 | 0.66 | 0.32 | 1.00 | 0.79 | 0.90 | 0.92 | 0.65 | 0.82 | 0.91 | ||||
| 0.73 | 0.98 | 0.95 | 0.93 | 0.79 | 1.00 | 0.97 | 0.96 | -0.35 | -0.39 | 0.95 | 0.86 | |||||||
| 0.35 | 0.85 | 0.96 | 0.99 | 0.98 | 0.31 | 0.90 | 0.97 | 1.00 | 1.00 | 0.30 | -0.32 | 0.95 | 0.93 | |||||
| 0.37 | 0.88 | 0.96 | 0.99 | 0.99 | 0.34 | 0.92 | 0.96 | 1.00 | 1.00 | 0.32 | -0.28 | 0.95 | 0.95 | |||||
| 0.44 | 0.68 | 0.13 | 0.30 | 0.33 | 0.99 | 0.75 | 0.68 | 0.65 | 0.30 | 0.32 | 1.00 | 0.71 | 0.63 | 0.36 | ||||
| -0.36 | 0.70 | 0.96 | 0.95 | -0.35 | 0.71 | 1.00 | 0.99 | -0.33 | ||||||||||
| 0.13 | -0.40 | -0.30 | 0.62 | 0.95 | 0.96 | -0.39 | -0.32 | -0.28 | 0.63 | 0.99 | 1.00 | -0.36 | ||||||
| 0.31 | 0.79 | 0.97 | 0.97 | 0.96 | 0.82 | 0.95 | 0.95 | 0.95 | -0.33 | -0.36 | 1.00 | 0.95 | ||||||
| 0.30 | 0.41 | 0.92 | 0.90 | 0.97 | 0.98 | 0.40 | 0.91 | 0.86 | 0.93 | 0.95 | 0.36 | 0.95 | 1.00 | |||||
| 0.31 | 0.44 | 0.94 | 0.86 | 0.95 | 0.96 | 0.46 | 0.92 | 0.82 | 0.91 | 0.93 | 0.41 | 0.92 | 1.00 | |||||
| 0.45 | 0.63 | 0.96 | 0.88 | 0.84 | 0.57 | 0.93 | 0.82 | 0.77 | 0.33 | |||||||||
| 0.29 | 0.28 | -0.30 | 0.70 | 0.99 | 0.99 | -0.30 | 0.69 | 0.96 | 0.97 | |||||||||
| -0.32 | 0.64 | 0.98 | 0.99 | -0.32 | 0.63 | 0.95 | 0.97 | |||||||||||
| -0.31 | -0.48 | -0.54 | -0.67 | -0.69 | -0.36 | -0.46 | -0.50 | -0.53 | -0.32 | |||||||||
| -0.37 | -0.38 | |||||||||||||||||
| -0.28 | -0.40 | -0.43 | -0.29 | |||||||||||||||
| -0.29 | -0.39 | -0.41 | ||||||||||||||||
| -0.36 | -0.37 | |||||||||||||||||
| -0.45 | -0.44 | -0.47 | -0.47 | -0.34 | -0.33 | -0.36 | -0.37 | -0.49 | -0.56 | |||||||||
| -0.47 | -0.48 | -0.50 | -0.51 | -0.36 | -0.36 | -0.40 | -0.41 | -0.52 | -0.59 | |||||||||
| 0.33 | 0.63 | 0.45 | 0.56 | 0.56 | 0.43 | 0.29 | 0.57 | 0.41 | 0.49 | 0.49 | 0.37 | 0.54 | 0.64 | |||||
| 0.33 | 0.50 | 0.65 | 0.68 | 0.66 | 0.38 | 0.13 | 0.56 | 0.58 | 0.57 | 0.39 | ||||||||
| 0.35 | 0.61 | 0.31 | 0.43 | 0.45 | 0.54 | 0.46 | 0.44 | 0.49 | 0.32 | 0.35 | 0.44 | 0.31 | 0.29 | 0.43 | 0.58 | |||
| 0.34 | 0.59 | 0.39 | 0.41 | 0.54 | 0.50 | 0.49 | 0.47 | 0.28 | 0.31 | 0.44 | 0.35 | 0.34 | 0.38 | 0.56 | ||||
| 0.33 | 0.48 | 0.67 | 0.71 | 0.70 | 0.36 | 0.59 | 0.62 | 0.61 | 0.13 | 0.35 | ||||||||
| 0.28 | 0.33 | 0.64 | 0.79 | 0.79 | 0.58 | 0.75 | 0.75 | |||||||||||
| 0.31 | 0.62 | 0.80 | 0.80 | 0.56 | 0.76 | 0.76 | 0.13 | |||||||||||
| 0.46 | 0.37 | 0.32 | -0.33 | -0.41 | 0.53 | 0.44 | 0.38 | -0.33 | -0.41 | 0.35 | ||||||||
| 0.29 | 0.28 | -0.35 | 0.37 | 0.35 | 0.31 | 0.30 | -0.32 | |||||||||||
| 0.35 | -0.32 | 0.29 | 0.38 | |||||||||||||||
| 0.43 | 0.13 | 0.46 | ||||||||||||||||
| 0.13 | 0.44 | 0.46 | ||||||||||||||||
| 0.13 | 0.43 | 0.46 | ||||||||||||||||
| 0.50 | 0.46 | 0.43 | -0.34 | -0.34 | 0.46 | 0.43 | 0.40 | -0.50 | -0.50 | 0.54 | 0.45 | |||||||
| 0.43 | 0.30 | -0.34 | -0.38 | 0.46 | 0.33 | -0.40 | -0.44 | 0.37 | ||||||||||
| 0.53 | 0.38 | 0.32 | -0.32 | -0.55 | -0.59 | 0.56 | 0.41 | 0.35 | -0.31 | -0.58 | -0.62 | 0.46 | ||||||
| 0.51 | 0.36 | 0.30 | -0.53 | -0.60 | 0.55 | 0.41 | 0.34 | -0.55 | -0.61 | 0.43 | ||||||||
| 0.46 | 0.41 | 0.37 | -0.57 | -0.62 | 0.48 | 0.43 | 0.39 | -0.56 | -0.61 | 0.41 | 0.30 | |||||||
| 0.45 | 0.41 | 0.38 | -0.50 | -0.55 | 0.47 | 0.44 | 0.40 | -0.48 | -0.54 | 0.40 | 0.31 | |||||||
| PA | 0.29 | 0.41 | 0.92 | 0.90 | 0.97 | 0.98 | 0.40 | 0.92 | 0.87 | 0.94 | 0.95 | 0.37 | 0.96 | 1.00 | ||||
| ISOPL | -0.60 | |||||||||||||||||
| ISOEV | 0.36 | 0.33 | 0.34 | 0.33 | 0.28 | 0.35 | 0.36 | 0.35 | 0.32 | 0.29 | ||||||||
| -0.49 | -0.64 | -0.62 | -0.60 | -0.63 | -0.73 | -0.72 | -0.70 | -0.57 | -0.48 | |||||||||
| 0.13 | 0.31 | 0.76 | 0.70 | 0.67 | -0.35 | -0.75 | -0.76 | 0.37 | 0.75 | 0.71 | 0.69 | -0.36 | -0.87 | -0.88 | 0.73 | 0.58 | ||
| 0.36 | 0.79 | 0.74 | 0.71 | -0.28 | -0.73 | -0.75 | 0.41 | 0.78 | 0.74 | 0.72 | -0.30 | -0.82 | -0.85 | 0.77 | 0.63 | |||
| PAY | 0.31 | |||||||||||||||||
| PLN | 0.44 | 0.45 | 0.29 | -0.31 | 0.33 | 0.33 | 0.35 | 0.34 | 0.33 | 0.28 | ||||||||
| 0.94 | 0.63 | 0.28 | -0.48 | -0.37 | -0.36 | -0.45 | -0.47 | 0.63 | 0.50 | 0.61 | 0.59 | 0.48 | 0.33 | 0.31 | ||||
| 0.86 | -0.30 | -0.32 | -0.44 | -0.48 | 0.45 | 0.31 | ||||||||||||
| 0.95 | -0.47 | -0.50 | 0.56 | 0.43 | 0.39 | |||||||||||||
| 0.96 | -0.47 | -0.51 | 0.56 | 0.45 | 0.41 | |||||||||||||
| 0.46 | 0.96 | 0.70 | 0.64 | -0.54 | -0.28 | -0.29 | 0.43 | 0.65 | 0.54 | 0.54 | 0.67 | 0.64 | 0.62 | |||||
| 0.88 | 0.99 | 0.98 | -0.67 | -0.40 | -0.39 | 0.29 | 0.68 | 0.46 | 0.50 | 0.71 | 0.79 | 0.80 | ||||||
| 0.84 | 0.99 | 0.99 | -0.69 | -0.43 | -0.41 | 0.66 | 0.44 | 0.49 | 0.70 | 0.79 | 0.80 | |||||||
| 0.92 | 0.57 | -0.36 | -0.34 | -0.36 | 0.57 | 0.38 | 0.49 | 0.47 | 0.36 | |||||||||
| 0.82 | -0.30 | -0.32 | -0.33 | -0.36 | 0.41 | |||||||||||||
| 0.91 | -0.36 | -0.40 | 0.49 | 0.32 | 0.28 | |||||||||||||
| 0.93 | -0.37 | -0.41 | 0.49 | 0.13 | 0.35 | 0.31 | ||||||||||||
| 0.41 | 0.93 | 0.69 | 0.63 | -0.46 | 0.37 | 0.56 | 0.44 | 0.44 | 0.59 | 0.58 | 0.56 | |||||||
| 0.82 | 0.96 | 0.95 | -0.50 | 0.58 | 0.31 | 0.35 | 0.62 | 0.75 | 0.76 | |||||||||
| 0.77 | 0.97 | 0.97 | -0.53 | -0.29 | 0.57 | 0.29 | 0.34 | 0.61 | 0.75 | 0.76 | ||||||||
| 0.92 | -0.49 | -0.52 | 0.54 | 0.43 | 0.38 | 0.13 | ||||||||||||
| 1.00 | 0.33 | -0.32 | -0.38 | -0.37 | -0.56 | -0.59 | 0.64 | 0.39 | 0.58 | 0.56 | 0.35 | 0.13 | ||||||
| 1.00 | 0.40 | -0.39 | -0.40 | -0.39 | -0.56 | -0.59 | 0.64 | 0.44 | 0.61 | 0.59 | 0.40 | |||||||
| 0.40 | 1.00 | 0.85 | 0.81 | -0.66 | -0.28 | -0.37 | -0.36 | -0.28 | 0.40 | 0.76 | 0.60 | 0.63 | 0.79 | 0.80 | 0.79 | |||
| 0.85 | 1.00 | 1.00 | -0.65 | -0.40 | -0.37 | 0.68 | 0.44 | 0.49 | 0.71 | 0.82 | 0.83 | |||||||
| 0.81 | 1.00 | 1.00 | -0.65 | -0.40 | -0.38 | 0.66 | 0.42 | 0.47 | 0.69 | 0.80 | 0.82 | |||||||
| -0.39 | -0.66 | -0.65 | -0.65 | 1.00 | 0.75 | 0.88 | 0.84 | 0.73 | 0.57 | 0.55 | -0.44 | -0.75 | -0.68 | -0.72 | -0.75 | -0.71 | -0.71 | |
| -0.40 | -0.28 | 0.75 | 1.00 | 0.93 | 0.95 | 1.00 | 0.94 | 0.92 | -0.56 | -0.68 | -0.77 | -0.77 | -0.65 | -0.52 | -0.51 | |||
| -0.37 | -0.40 | -0.40 | 0.88 | 0.93 | 1.00 | 0.99 | 0.92 | 0.76 | 0.74 | -0.43 | -0.68 | -0.68 | -0.71 | -0.67 | -0.61 | -0.60 | ||
| -0.36 | -0.37 | -0.38 | 0.84 | 0.95 | 0.99 | 1.00 | 0.95 | 0.79 | 0.77 | -0.45 | -0.68 | -0.69 | -0.71 | -0.67 | -0.59 | -0.59 | ||
| -0.39 | -0.28 | 0.73 | 1.00 | 0.92 | 0.95 | 1.00 | 0.93 | 0.92 | -0.54 | -0.67 | -0.76 | -0.76 | -0.64 | -0.51 | -0.49 | |||
| -0.56 | 0.57 | 0.94 | 0.76 | 0.79 | 0.93 | 1.00 | 1.00 | -0.66 | -0.59 | -0.77 | -0.76 | -0.55 | -0.37 | -0.35 | ||||
| -0.59 | 0.55 | 0.92 | 0.74 | 0.77 | 0.92 | 1.00 | 1.00 | -0.66 | -0.58 | -0.76 | -0.76 | -0.54 | -0.35 | -0.33 | ||||
| 0.64 | 0.40 | -0.44 | -0.56 | -0.43 | -0.45 | -0.54 | -0.66 | -0.66 | 1.00 | 0.63 | 0.77 | 0.74 | 0.58 | 0.44 | 0.43 | |||
| 0.44 | 0.76 | 0.68 | 0.66 | -0.75 | -0.68 | -0.68 | -0.68 | -0.67 | -0.59 | -0.58 | 0.63 | 1.00 | 0.94 | 0.96 | 1.00 | 0.95 | 0.94 | |
| 0.61 | 0.60 | 0.44 | 0.42 | -0.68 | -0.77 | -0.68 | -0.69 | -0.76 | -0.77 | -0.76 | 0.77 | 0.94 | 1.00 | 0.99 | 0.91 | 0.79 | 0.77 | |
| 0.59 | 0.63 | 0.49 | 0.47 | -0.72 | -0.77 | -0.71 | -0.71 | -0.76 | -0.76 | -0.76 | 0.74 | 0.96 | 0.99 | 1.00 | 0.94 | 0.83 | 0.82 | |
| 0.40 | 0.79 | 0.71 | 0.69 | -0.75 | -0.65 | -0.67 | -0.67 | -0.64 | -0.55 | -0.54 | 0.58 | 1.00 | 0.91 | 0.94 | 1.00 | 0.97 | 0.96 | |
| 0.80 | 0.82 | 0.80 | -0.71 | -0.52 | -0.61 | -0.59 | -0.51 | -0.37 | -0.35 | 0.44 | 0.95 | 0.79 | 0.83 | 0.97 | 1.00 | 1.00 | ||
| 0.79 | 0.83 | 0.82 | -0.71 | -0.51 | -0.60 | -0.59 | -0.49 | -0.35 | -0.33 | 0.43 | 0.94 | 0.77 | 0.82 | 0.96 | 1.00 | 1.00 | ||
| -0.41 | -0.45 | 0.56 | 0.40 | 0.29 | -0.34 | -0.37 | ||||||||||||
| -0.34 | -0.40 | 0.49 | 0.41 | 0.32 | -0.29 | -0.32 | ||||||||||||
| -0.29 | -0.36 | 0.42 | 0.40 | 0.33 | -0.28 | |||||||||||||
| 0.30 | 0.28 | |||||||||||||||||
| 0.40 | -0.29 | -0.36 | -0.34 | -0.28 | -0.48 | -0.49 | 0.58 | 0.28 | ||||||||||
| 0.13 | -0.34 | -0.39 | -0.38 | 0.43 | 0.38 | -0.29 | -0.30 | |||||||||||
| -0.48 | -0.61 | -0.61 | 0.56 | 0.30 | -0.30 | -0.34 | -0.46 | -0.48 | ||||||||||
| -0.43 | -0.59 | -0.61 | 0.60 | 0.37 | 0.28 | -0.31 | -0.43 | -0.45 | ||||||||||
| -0.28 | -0.58 | -0.60 | 0.56 | 0.46 | 0.41 | -0.30 | -0.32 | |||||||||||
| -0.51 | -0.54 | 0.52 | 0.45 | 0.41 | ||||||||||||||
| PA | 0.99 | 0.33 | -0.29 | -0.33 | -0.33 | -0.52 | -0.55 | 0.63 | 0.37 | 0.57 | 0.54 | 0.33 | ||||||
| ISOPL | 0.32 | 0.34 | 0.34 | 0.33 | 0.33 | 0.31 | 0.31 | |||||||||||
| ISOEV | 0.28 | |||||||||||||||||
| -0.44 | -0.36 | -0.50 | -0.62 | -0.59 | -0.49 | -0.33 | -0.30 | 0.39 | 0.28 | 0.32 | 0.40 | 0.46 | 0.46 | |||||
| 0.53 | -0.50 | -0.80 | -0.80 | 0.33 | -0.33 | -0.37 | -0.36 | -0.41 | -0.61 | -0.62 | ||||||||
| 0.57 | -0.44 | -0.78 | -0.79 | 0.34 | -0.32 | -0.36 | -0.31 | -0.36 | -0.56 | -0.58 | ||||||||
| PA | ISOPL | ISOEV | - | - | - | |||||||||||||
| PAY | 0.29 | -0.60 | 0.36 | 0.13 | ||||||||||||||
| PLN | 0.41 | |||||||||||||||||
| 0.13 | 0.13 | 0.92 | -0.49 | 0.31 | 0.36 | |||||||||||||
| 0.46 | 0.29 | 0.50 | 0.43 | 0.53 | 0.51 | 0.46 | 0.45 | 0.90 | 0.33 | -0.64 | 0.76 | 0.79 | ||||||
| 0.37 | 0.28 | 0.46 | 0.30 | 0.38 | 0.36 | 0.41 | 0.41 | 0.97 | 0.34 | -0.62 | 0.70 | 0.74 | ||||||
| 0.32 | 0.43 | 0.32 | 0.30 | 0.37 | 0.38 | 0.98 | 0.33 | -0.60 | 0.67 | 0.71 | ||||||||
| 0.35 | 0.43 | 0.44 | 0.43 | -0.32 | 0.40 | -0.35 | -0.28 | |||||||||||
| -0.33 | -0.34 | -0.34 | -0.55 | -0.53 | -0.57 | -0.50 | -0.75 | -0.73 | ||||||||||
| -0.41 | -0.35 | -0.32 | -0.34 | -0.38 | -0.59 | -0.60 | -0.62 | -0.55 | -0.76 | -0.75 | ||||||||
| 0.92 | 0.28 | -0.63 | 0.37 | 0.41 | ||||||||||||||
| 0.53 | 0.37 | 0.46 | 0.46 | 0.56 | 0.55 | 0.48 | 0.47 | 0.87 | 0.35 | -0.73 | 0.75 | 0.78 | ||||||
| 0.44 | 0.35 | 0.29 | 0.43 | 0.33 | 0.41 | 0.41 | 0.43 | 0.44 | 0.94 | 0.36 | -0.72 | 0.71 | 0.74 | |||||
| 0.38 | 0.31 | 0.13 | 0.40 | 0.35 | 0.34 | 0.39 | 0.40 | 0.95 | 0.35 | -0.70 | 0.69 | 0.72 | ||||||
| 0.30 | 0.38 | 0.46 | 0.46 | 0.46 | -0.31 | 0.37 | -0.36 | -0.30 | ||||||||||
| -0.33 | -0.50 | -0.40 | -0.58 | -0.55 | -0.56 | -0.48 | -0.87 | -0.82 | ||||||||||
| -0.41 | -0.32 | -0.50 | -0.44 | -0.62 | -0.61 | -0.61 | -0.54 | -0.88 | -0.85 | |||||||||
| 0.35 | 0.54 | 0.37 | 0.46 | 0.43 | 0.41 | 0.40 | 0.96 | 0.32 | -0.57 | 0.73 | 0.77 | |||||||
| 0.45 | 0.30 | 0.31 | 1.00 | 0.29 | -0.48 | 0.58 | 0.63 | |||||||||||
| 0.40 | 0.13 | 0.99 | 0.28 | -0.44 | 0.53 | 0.57 | ||||||||||||
| -0.29 | -0.34 | -0.48 | -0.43 | -0.28 | 0.33 | -0.50 | -0.44 | |||||||||||
| -0.41 | -0.34 | -0.29 | -0.36 | -0.39 | -0.61 | -0.59 | -0.58 | -0.51 | -0.80 | -0.78 | ||||||||
| -0.45 | -0.40 | -0.36 | -0.34 | -0.38 | -0.61 | -0.61 | -0.60 | -0.54 | -0.80 | -0.79 | ||||||||
| 0.56 | 0.49 | 0.42 | 0.43 | 0.56 | 0.60 | 0.56 | 0.52 | -0.29 | 0.32 | -0.36 | 0.33 | 0.34 | ||||||
| -0.28 | -0.33 | 0.34 | -0.50 | |||||||||||||||
| 0.40 | 0.41 | 0.40 | 0.30 | 0.30 | 0.37 | 0.46 | 0.45 | 0.34 | -0.62 | |||||||||
| 0.29 | 0.32 | 0.33 | 0.28 | 0.28 | 0.41 | 0.41 | 0.33 | -0.59 | ||||||||||
| -0.33 | 0.33 | -0.49 | ||||||||||||||||
| -0.48 | -0.52 | 0.31 | -0.33 | -0.33 | -0.32 | |||||||||||||
| -0.49 | -0.55 | 0.31 | -0.30 | -0.37 | -0.36 | |||||||||||||
| 0.58 | 0.38 | 0.63 | ||||||||||||||||
| -0.30 | 0.37 | 0.39 | -0.36 | -0.31 | ||||||||||||||
| 0.28 | 0.57 | 0.28 | ||||||||||||||||
| 0.54 | 0.32 | |||||||||||||||||
| -0.34 | -0.31 | 0.33 | 0.40 | -0.41 | -0.36 | |||||||||||||
| -0.34 | -0.29 | -0.29 | -0.46 | -0.43 | -0.30 | 0.46 | -0.61 | -0.56 | ||||||||||
| -0.37 | -0.32 | -0.28 | -0.30 | -0.48 | -0.45 | -0.32 | 0.46 | -0.62 | -0.58 | |||||||||
| 1.00 | 0.88 | 0.75 | 0.47 | 0.44 | 0.43 | 0.37 | 0.77 | 0.84 | 0.85 | 0.61 | 0.56 | 0.31 | -0.45 | 0.44 | 0.45 | |||
| 0.88 | 1.00 | 0.97 | 0.80 | 0.77 | 0.75 | 0.43 | 0.53 | 0.58 | 0.54 | 0.54 | 0.33 | -0.40 | 0.32 | 0.36 | ||||
| 0.75 | 0.97 | 1.00 | 0.93 | 0.89 | 0.87 | 0.35 | 0.42 | 0.47 | 0.51 | 0.33 | -0.35 | 0.30 | ||||||
| 0.47 | 0.80 | 0.93 | 1.00 | 0.99 | 0.97 | -0.35 | 0.35 | 0.13 | ||||||||||
| 0.44 | 0.77 | 0.89 | 0.99 | 1.00 | 1.00 | -0.38 | 0.29 | |||||||||||
| 0.43 | 0.75 | 0.87 | 0.97 | 1.00 | 1.00 | -0.38 | ||||||||||||
| 0.37 | -0.35 | -0.38 | -0.38 | 1.00 | 0.78 | 0.67 | 0.62 | 0.47 | 0.35 | 0.44 | 0.58 | 0.53 | ||||||
| 0.77 | 0.43 | 0.78 | 1.00 | 0.93 | 0.91 | 0.55 | 0.44 | 0.44 | 0.40 | |||||||||
| 0.84 | 0.53 | 0.35 | 0.67 | 0.93 | 1.00 | 0.96 | 0.61 | 0.51 | -0.32 | 0.61 | 0.60 | |||||||
| 0.85 | 0.58 | 0.42 | 0.62 | 0.91 | 0.96 | 1.00 | 0.75 | 0.67 | -0.35 | 0.59 | 0.58 | |||||||
| 0.61 | 0.54 | 0.47 | 0.47 | 0.55 | 0.61 | 0.75 | 1.00 | 0.98 | 0.31 | 0.34 | -0.30 | 0.62 | 0.65 | |||||
| 0.56 | 0.54 | 0.51 | 0.35 | 0.29 | 0.35 | 0.44 | 0.51 | 0.67 | 0.98 | 1.00 | 0.33 | 0.13 | 0.35 | -0.30 | 0.56 | 0.61 | ||
| PA | 0.44 | 0.31 | 0.33 | 1.00 | 0.30 | -0.51 | 0.58 | 0.63 | ||||||||||
| ISOPL | 0.13 | 1.00 | ||||||||||||||||
| ISOEV | 0.31 | 0.33 | 0.33 | 0.34 | 0.35 | 0.30 | 1.00 | -0.30 | 0.30 | 0.34 | ||||||||
| -0.45 | -0.40 | -0.35 | -0.32 | -0.35 | -0.30 | -0.30 | -0.51 | -0.30 | 1.00 | -0.47 | -0.48 | |||||||
| 0.44 | 0.32 | 0.58 | 0.44 | 0.61 | 0.59 | 0.62 | 0.56 | 0.58 | 0.30 | -0.47 | 1.00 | 0.99 | ||||||
| 0.45 | 0.36 | 0.30 | 0.13 | 0.53 | 0.40 | 0.60 | 0.58 | 0.65 | 0.61 | 0.63 | 0.34 | -0.48 | 0.99 | 1.00 |
Appendix D Circumplexity analysis
Circumplexity tests are based on inherent characteristics of a circumplex model (Tracey, 2000; Locke, 2019). In a circumplex model, intercorrelation should conform to the inequality requirement of , where correlations of adjacent variables () must be greater than orthogonal variable correlations (), and itself must be greater than correlations of variables apart (), and in turn must be greater than the correlations of opposing variables on each axis (). An 8-attribute model consists of a total of 28 correlation pairs. All PAQ correlation pairs were computed via the Pearson’s method and examined for compliance to the correlation inequality (Lam et al., 2022a), as shown in Section Appendix D.
The circumplex inequality criteria is further examined through the RTHOR correspondence index (CI), wherein –1 indicates complete violation, 0 indicates chance, and 1.0 indicates a perfect fit (Tracey, 2000). A score of 0.5 indicates that of the predictions satisfied the inequality criteria. A total of 288 predictions were tested for violation (Zeigler-Hill and Highfill, 2010; Locke, 2019), where 20 of the 288 predictions violated the inequality criteria, yielding a CI of 0.861 (). This reflects a low rate of inequality violation ( violation) and signifies a good adherence to the underlying circumplexity of the PAQ model.
Principal components analysis of the 8-attribute responses yield two components corresponding to the p-a and p-a axes, respectively, which together explains of the total variance (p-a:; e-u: ). On the p-a axis, the loadings exhibited expected behaviour, i.e. positive loadings for v, p, and ca; and negative loadings for m, a, and ch. Similarly for the e-u axis, loadings for ch, e and v were positive, while loadings for ca, u, and m were negative. The sinusoidality of the loadings lends further evidence to the circumplexity of the PAQ model (Locke, 2019).
Table D.1
Pearson’s correlation and principal component analysis loadings of PAQ attributes.
| Pearson’s Correlation | Loadings | |||||||||
| e | v | p | ca | u | m | a | ch | p-a | e-u | |
| e | 1.00 | 0.54 | 0.71 | |||||||
| v | 0.59 | 1 | 0.71 | 0.38 | ||||||
| p | 0.15 | 0.48 | 1 | 0.81 | -0.36 | |||||
| ca | 0.04 | 0.31 | 0.76 | 1 | 0.68 | -0.48 | ||||
| u | -0.69 | -0.45 | -0.12 | 0.01 | 1 | -0.54 | -0.61 | |||
| m | -0.40 | -0.32 | -0.23 | -0.08 | 0.49 | 1 | -0.56 | -0.31 | ||
| a | 0.18 | -0.03 | -0.54 | -0.52 | 0 | 0.17 | 1 | -0.53 | 0.67 | |
| ch | 0.34 | 0.16 | -0.33 | -0.34 | -0.2 | 0.01 | 0.67 | 1 | -0.25 | 0.76 |
References
- Aletta et al. (2018) Aletta, F., Vander Mynsbrugge, T., Van de Velde, D., De Vriendt, P., Thomas, P., Filipan, K., Botteldooren, D., Devos, P., 2018. Awareness of ‘sound’ in nursing homes: A large-scale soundscape survey in Flanders (Belgium). Building Acoustics 25, 43–59. URL: http://journals.sagepub.com/doi/10.1177/1351010X17748113, doi:10.1177/1351010X17748113.
- Amirzadeh et al. (2023) Amirzadeh, M., Sobhaninia, S., Buckman, S.T., Sharifi, A., 2023. Towards building resilient cities to pandemics: A review of COVID-19 literature. Sustainable Cities and Society 89, 104326. doi:10.1016/j.scs.2022.104326.
- Araújo Alves et al. (2020) Araújo Alves, J., Neto Paiva, F., Torres Silva, L., Remoaldo, P., 2020. Low-Frequency Noise and Its Main Effects on Human Health—A Review of the Literature between 2016 and 2019. Applied Sciences 10, 5205. doi:10.3390/app10155205.
- Baliatsas et al. (2016) Baliatsas, C., van Kamp, I., van Poll, R., Yzermans, J., 2016. Health effects from low-frequency noise and infrasound in the general population: Is it time to listen? A systematic review of observational studies. Science of The Total Environment 557-558, 163–169. doi:10.1016/j.scitotenv.2016.03.065.
- Basu et al. (2021) Basu, B., Murphy, E., Molter, A., Sarkar Basu, A., Sannigrahi, S., Belmonte, M., Pilla, F., 2021. Investigating changes in noise pollution due to the COVID-19 lockdown: The case of Dublin, Ireland. Sustainable Cities and Society 65, 102597. doi:10.1016/j.scs.2020.102597.
- Belyi and Gan (2019) Belyi, V., Gan, W.S., 2019. Integrated psychoacoustic active noise control and masking. Applied Acoustics 145, 339–348. doi:10.1016/j.apacoust.2018.10.027.
- Benfield et al. (2014) Benfield, J.A., Nurse, G.A., Jakubowski, R., Gibson, A.W., Taff, B.D., Newman, P., Bell, P.A., 2014. Testing Noise in the Field. Environment and Behavior 46, 353–372. URL: https://journals.sagepub.com/doi/10.1177/0013916512454430http://journals.sagepub.com/doi/10.1177/0013916512454430, doi:10.1177/0013916512454430.
- Bin et al. (2019) Bin, C.K.C., Lee, C.K., Teh, S.K., Chan, H.Z., Sim, M.T., 2019. Land Traffic Noise Management at Recipient’s End in Singapore, in: INTER-NOISE and NOISE-CON Congress and Conference Proceedings, InterNoise19, Institute of Noise Control Engineering, Madrid, Spain. pp. 1465–1473. URL: https://www.ingentaconnect.com/content/ince/incecp/2019/00000259/00000008/art00053.
- Brink et al. (2016) Brink, M., Schreckenberg, D., Vienneau, D., Cajochen, C., Wunderli, J.M., Probst-Hensch, N., Röösli, M., 2016. Effects of Scale, Question Location, Order of Response Alternatives, and Season on Self-Reported Noise Annoyance Using ICBEN Scales: A Field Experiment. International Journal of Environmental Research and Public Health 13. URL: /pmc/articles/PMC5129373//pmc/articles/PMC5129373/?report=abstracthttps://www.ncbi.nlm.nih.gov/pmc/articles/PMC5129373/, doi:10.3390/IJERPH13111163.
- Brungart et al. (2001) Brungart, D.S., Simpson, B.D., Ericson, M.A., Scott, K.R., 2001. Informational and energetic masking effects in the perception of multiple simultaneous talkers. The Journal of the Acoustical Society of America 110, 2527–2538. doi:10.1121/1.1408946.
- Buxton et al. (2021) Buxton, R.T., Pearson, A.L., Allou, C., Fristrup, K., Wittemyer, G., 2021. A synthesis of health benefits of natural sounds and their distribution in national parks. Proceedings of the National Academy of Sciences 118, e2013097118. URL: https://www.pnas.org/content/118/14/e2013097118https://www.pnas.org/content/118/14/e2013097118.abstracthttps://www.pnas.org/lookup/suppl/http://www.pnas.org/lookup/doi/10.1073/pnas.2013097118, doi:10.1073/pnas.2013097118.
- Cao et al. (2016) Cao, X., Dai, X., Liu, J., 2016. Building energy-consumption status worldwide and the state-of-the-art technologies for zero-energy buildings during the past decade. Energy and Buildings 128, 198–213. doi:10.1016/j.enbuild.2016.06.089.
- Cheer and Elliott (2016) Cheer, J., Elliott, S.J., 2016. Active noise control of a diesel generator in a luxury yacht. Applied Acoustics 105, 209–214. URL: http://dx.doi.org/10.1016/j.apacoust.2015.12.007, doi:10.1016/j.apacoust.2015.12.007.
- Cho and Kim (2015) Cho, E., Kim, S., 2015. Cronbach’s Coefficient Alpha. Organizational Research Methods 18, 207–230. doi:10.1177/1094428114555994.
- Coensel et al. (2011a) Coensel, B.D., Vanwetswinkel, S., Botteldooren, D., 2011a. Effects of natural sounds on the perception of road traffic noise. The Journal of the Acoustical Society of America 129, EL148–EL153. doi:10.1121/1.3567073.
- Coensel et al. (2011b) Coensel, B.D., Vanwetswinkel, S., Botteldooren, D., 2011b. Effects of natural sounds on the perception of road traffic noise. The Journal of the Acoustical Society of America 129, EL148–EL153. URL: NS-http://asa.scitation.org/doi/10.1121/1.3567073, doi:10.1121/1.3567073.
- Cohen et al. (1983) Cohen, S., Kamarck, T., Mermelstein, R., 1983. A Global Measure of Perceived Stress. Journal of Health and Social Behavior 24, 385. doi:10.2307/2136404.
- Culling and Stone (2017) Culling, J.F., Stone, M.A., 2017. Energetic Masking and Masking Release, in: Middlebrooks, J.C., Simon, J.Z., Popper, A.N., Fay, R.R. (Eds.), The Auditory System at the Cocktail Party. 1 ed.. Springer Cham. chapter 3, pp. 41–73. doi:10.1007/978-3-319-51662-2_3.
- Du et al. (2020) Du, L., Lau, S.K., Lee, S.E., Danzer, M.K., 2020. Experimental study on noise reduction and ventilation performances of sound-proofed ventilation window. Building and Environment 181, 107105. URL: https://doi.org/10.1016/j.buildenv.2020.107105https://linkinghub.elsevier.com/retrieve/pii/S0360132320304807, doi:10.1016/j.buildenv.2020.107105.
- Dunn et al. (2014) Dunn, T.J., Baguley, T., Brunsden, V., 2014. From alpha to omega: A practical solution to the pervasive problem of internal consistency estimation. British Journal of Psychology 105, 399–412. URL: https://onlinelibrary.wiley.com/doi/10.1111/bjop.12046, doi:10.1111/bjop.12046.
- Ecma International (2019) Ecma International, 2019. ECMA-74 Measurement of Airborne Noise emitted by Information Technology and Telecommunications Equipment. 17th ed., Geneva, Switzerland.
- Ecma International (2020) Ecma International, 2020. ECMA 418-2 — Psychoacoustic metrics for ITT equipment — Part 2 (models based on human perception). 1st ed., ECMA, Geneva, Switzerland.
- Elkin et al. (2021) Elkin, L.A., Kay, M., Higgins, J.J., Wobbrock, J.O., 2021. An Aligned Rank Transform Procedure for Multifactor Contrast Tests, in: The 34th Annual ACM Symposium on User Interface Software and Technology, ACM, New York, NY, USA. pp. 754–768. URL: https://dl.acm.org/doi/10.1145/3472749.3474784, doi:10.1145/3472749.3474784.
- European Environment Agency (2020) European Environment Agency, 2020. Environmental noise in Europe — 2020. 22/2019, Publications Office of the European Union, Luxembourg. doi:10.2800/686249.
- Fink (2019) Fink, D., 2019. Ambient Noise Is “ The New Secondhand Smoke ”. Acoustics Today 15, 41–47. doi:10.1121/AT.2019.15.3.38.
- Fox (2019) Fox, J., 2019. polycor: Polychoric and Polyserial Correlations. URL: https://cran.r-project.org/package=polycor.
- Freedman et al. (2007) Freedman, D., Pisani, R., Purves, R., 2007. Statistics. 4th ed., W. W. Norton & Company, New York.
- Fusaro et al. (2022) Fusaro, G., Kang, J., Asdrubali, F., Chang, W.S., 2022. Assessment of acoustic metawindow unit through psychoacoustic analysis and human perception. Applied Acoustics 196, 108885. doi:10.1016/j.apacoust.2022.108885.
- Fusaro et al. (2019) Fusaro, G., Yu, X., Cui, F., Kang, J., 2019. Development of a metamaterial for acoustic and architectonical improvement of window design. Proceedings of the International Congress on Acoustics 2019-Septe, 1977–1983. doi:10.18154/RWTH-CONV-239567.
- Fusaro et al. (2020) Fusaro, G., Yu, X., Kang, J., Cui, F., 2020. Development of metacage for noise control and natural ventilation in a window system. Applied Acoustics 170, 107510. doi:10.1016/j.apacoust.2020.107510.
- Galbrun and Ali (2013) Galbrun, L., Ali, T.T., 2013. Acoustical and perceptual assessment of water sounds and their use over road traffic noise. The Journal of the Acoustical Society of America 133, 227–237. doi:10.1121/1.4770242.
- German Institute for Standardisation (2009) (Deutsches Institut für Normung) German Institute for Standardisation (Deutsches Institut für Normung), 2009. DIN 45692 - Measurement technique for the simulation of the auditory sensation of sharpness (In German). August, German Institute for Standardisation (Deutsches Institut für Normung), Berlin, Germany. doi:10.31030/1521326.
- Guan et al. (2020) Guan, H., Hu, S., Liu, G., Zhang, L., 2020. The combined effects of temperature and noise on the comfort perceptions of young people with a normal Body Mass Index. Sustainable Cities and Society 54, 101993. doi:10.1016/j.scs.2019.101993.
- Haapakangas et al. (2020) Haapakangas, A., Hongisto, V., Liebl, A., 2020. The relation between the intelligibility of irrelevant speech and cognitive performance—A revised model based on laboratory studies. Indoor Air 30, 1130–1146. doi:10.1111/ina.12726.
- Hao et al. (2016) Hao, Y., Kang, J., Wörtche, H., 2016. Assessment of the masking effects of birdsong on the road traffic noise environment. The Journal of the Acoustical Society of America 140, 978–987. doi:10.1121/1.4960570.
- Hasegawa and Lau (2021) Hasegawa, Y., Lau, S.K., 2021. Audiovisual Bimodal and Interactive Effects for Soundscape Design of the Indoor Environments: A Systematic Review. Sustainability 2021, Vol. 13, Page 339 13, 339. URL: https://www.mdpi.com/2071-1050/13/1/339/htmhttps://www.mdpi.com/2071-1050/13/1/339, doi:10.3390/SU13010339.
- Hong et al. (2019) Hong, J.Y., Lam, B., Ong, Z.T., Gan, W.S., Feng, J., Tan, S.T., 2019. Effect of spatial separation between traffic noise and water sound on soundscape assessment, in: INTER-NOISE and NOISE-CON Congress and Conference Proceedings, InterNoise19, Institute of Noise Control Engineering. pp. 5250–5255. URL: https://www.ingentaconnect.com/content/ince/incecp/2019/00000259/00000004/art00028.
- Hong et al. (2020a) Hong, J.Y., Lam, B., Ong, Z.T., Ooi, K., Gan, W.S., Kang, J., Yeong, S., Lee, I., Tan, S.T., 2020a. Effects of contexts in urban residential areas on the pleasantness and appropriateness of natural sounds. Sustainable Cities and Society 63, 102475. doi:10.1016/j.scs.2020.102475.
- Hong et al. (2021) Hong, J.Y., Lam, B., Ong, Z.T., Ooi, K., Gan, W.S., Kang, J., Yeong, S., Lee, I., Tan, S.T., 2021. A mixed-reality approach to soundscape assessment of outdoor urban environments augmented with natural sounds. Building and Environment 194, 107688. URL: https://linkinghub.elsevier.com/retrieve/pii/S0360132321000998, doi:10.1016/j.buildenv.2021.107688.
- Hong et al. (2020b) Hong, J.Y., Lam, B., Ong, Z.T., Ooi, K., Gan, W.S., Kang, J., Yeong, S., Lee, I., Tan, S.T.T., 2020b. The effects of spatial separations between water sound and traffic noise sources on soundscape assessment. Building and Environment 167, 106423. doi:10.1016/j.buildenv.2019.106423.
- Hong et al. (2022) Hong, J.Y., Lam, B., Ong, Z.T., Ooi, K., Gan, W.S., Lee, S., 2022. A multidimensional assessment of construction machinery noises based on perceptual attributes and psychoacoustic parameters. Automation in Construction 140, 104295. doi:10.1016/j.autcon.2022.104295.
- Hong et al. (2020c) Hong, J.Y., Ong, Z.T., Lam, B., Ooi, K., Gan, W.S., Kang, J., Feng, J., Tan, S.T., 2020c. Effects of adding natural sounds to urban noises on the perceived loudness of noise and soundscape quality. Science of The Total Environment 711, 134571. doi:10.1016/j.scitotenv.2019.134571.
- International Electrotechnical Commission (2013) International Electrotechnical Commission, 2013. IEC 61672-1: Electroacoustics — Sound level meters - Part 1: Specifications. International Electrotechnical Commission, Brussels, Belgium.
- International Organization for Standardization (2014) International Organization for Standardization, 2014. ISO 12913-1:2014 - Acoustics - Soundscape - Definition and conceptual framework. International Organization for Standardization, Geneva.
- International Organization for Standardization (2016a) International Organization for Standardization, 2016a. ISO 16283-3: Acoustics — Field measurement of sound insulation in buildings and of building elements — Part 3: Façade sound insulation. ISO 16283-3:2016 (ICS 91.060.10; 91.120.20). 1 ed., International Organization for Standardization.
- International Organization for Standardization (2016b) International Organization for Standardization, 2016b. ISO 1996-1 Acoustics — Description, measurement and assessment of environmental noise — Part 1: Basic quantities and assessment procedures. International Organization for Standardization, Geneva, Switzerland.
- International Organization for Standardization (2017) International Organization for Standardization, 2017. ISO 532-1:2017 - Acoustics — Method for calculating loudness — Part 1: Zwicker method. volume 7. International Organization for Standardization, Geneva.
- International Organization for Standardization (2018) International Organization for Standardization, 2018. ISO/TS 12913-2: Acoustics — Soundscape — Part 2: Data collection and reporting requirements. International Organization for Standardization, Geneva, Switzerland.
- International Organization for Standardization (2019) International Organization for Standardization, 2019. ISO/TS 12913-3:2019 - Acoustics — Soundscape - Part 3: Data analysis. International Organization for Standardization.
- International Organization for Standardization (2021) International Organization for Standardization, 2021. ISO/TS 15666 Acoustics — Assessment of noise annoyance by means of social and socio-acoustic surveys. 2nd ed., International Organization for Standardization, Geneva, Switzerland.
- International Organization for Standardization and International Electrotechnical Commission (1993) International Organization for Standardization, International Electrotechnical Commission, 1993. ISO/IEC 11172-3: Information technology — Coding of moving pictures and associated audio for digital storage media at up to about 1,5 Mbit/s — Part 3: Audio. International Organization for Standardization, Geneva, Switzerland. URL: http://scholar.google.com/scholar?hl=en&btnG=Search&q=intitle:Information+technology+-+Coding+of+moving+pictures+and+associated+audio+for+digital+storage+media+at+up+to+about+1,5+Mbit/s#2.
- Jeon et al. (2010) Jeon, J.Y., Lee, P.J., You, J., Kang, J., 2010. Perceptual assessment of quality of urban soundscapes with combined noise sources and water sounds. The Journal of the Acoustical Society of America 127, 1357–1366.
- Jiang and Li (2018) Jiang, J., Li, Y., 2018. Review of active noise control techniques with emphasis on sound quality enhancement. Applied Acoustics 136, 139–148. URL: https://doi.org/10.1016/j.apacoust.2018.02.021https://linkinghub.elsevier.com/retrieve/pii/S0003682X17307351, doi:10.1016/j.apacoust.2018.02.021.
- Kajikawa et al. (2012) Kajikawa, Y., Gan, W.S., Kuo, S.M., 2012. Recent advances on active noise control: open issues and innovative applications. APSIPA Transactions on Signal and Information Processing 1, e3. URL: http://dx.doi.org/10.1017/ATSIP.2012.4http://journals.cambridge.org/download.php?file=%2F2332_25BD18D482C0D6EA9EDD74F49690E0D7_journals__SIP_SIP1_S2048770312000042a.pdf&cover=Y&code=190b586956a63cc767d2aaa56a4c8e16http://www.journals.cambridge.org/abstr, doi:10.1017/ATSIP.2012.4.
- Kang (2017) Kang, J., 2017. From dBA to soundscape indices: Managing our sound environment. Frontiers of Engineering Management 4, 184–194. URL: http://engineering.cae.cn/fem/EN/10.15302/J-FEM-2017026, doi:10.15302/J-FEM-2017026.
- Kay et al. (2021) Kay, M., Elkin, L.A., Higgins, J.J., Wobbrock, J.O., 2021. {ARTool}: Aligned Rank Transform for Nonparametric Factorial ANOVAs. URL: https://github.com/mjskay/ARTool, doi:10.5281/zenodo.594511.
- Kidd and Colburn (2017) Kidd, G., Colburn, H.S., 2017. Informational Masking in Speech Recognition, in: Middlebrooks, J.C., Simon, J.Z., Popper, A.N., Fay, R.R. (Eds.), The Auditory System at the Cocktail Party. 1 ed.. Springer Cham. chapter 4, pp. 75–109. doi:10.1007/978-3-319-51662-2_4.
- Kidd et al. (2008) Kidd, G.J., Mason, C.R., Richards, V.M., Gallun, F.J., Durlach, N.I., 2008. Auditory Perception of Sound Sources. volume 29 of Springer Handbook of Auditory Research. Springer US, Boston, MA. URL: http://link.springer.com/10.1007/978-0-387-71305-2, doi:10.1007/978-0-387-71305-2.
- Knief and Forstmeier (2021) Knief, U., Forstmeier, W., 2021. Violating the normality assumption may be the lesser of two evils. Behavior Research Methods 53, 2576. URL: /pmc/articles/PMC8613103//pmc/articles/PMC8613103/?report=abstracthttps://www.ncbi.nlm.nih.gov/pmc/articles/PMC8613103/, doi:10.3758/S13428-021-01587-5.
- Korkmaz et al. (2014) Korkmaz, S., Goksuluk, D., Zararsiz, G., 2014. MVN: An R Package for Assessing Multivariate Normality. The R Journal 6, 151–162. URL: http://www.biosoft.hacettepe.edu.tr/MVN/.
- Lam (2019) Lam, B., 2019. Active control of noise through open windows. Ph.D. thesis. Nanyang Technological University. URL: http://hdl.handle.net/10220/48090, doi:10.32657/10220/48090.
- Lam et al. (2022a) Lam, B., Fan, E.M.P., Ooi, K., Ong, Z.T., Hong, J.Y., Gan, W.S., Ang, S.Y., 2022a. Assessing the perceived indoor acoustic environment quality across building occupants in a tertiary-care public hospital in Singapore. Building and Environment 222, 109403. doi:10.1016/j.buildenv.2022.109403.
- Lam et al. (2021) Lam, B., Gan, W.S., Shi, D., Nishimura, M., Elliott, S., 2021. Ten questions concerning active noise control in the built environment. Building and Environment 200, 107928. doi:10.1016/j.buildenv.2021.107928.
- Lam et al. (2022b) Lam, B., Ooi, K., Ong, Z.T., Watcharasupat, N.K., Wong, T., Gan, W.S., 2022b. Assessment of a cost-effective headphone calibration procedure for soundscape evaluations, in: Proceedings of the 24th International Congress on Acoustics, International Commission for Acoustics (ICA), Gyeongju, South Korea. pp. 1–8.
- Lam et al. (2020a) Lam, B., Shi, D., Belyi, V., Wen, S., Gan, W.S., Li, K., Lee, I., 2020a. Active Control of Low-Frequency Noise through a Single Top-Hung Window in a Full-Sized Room. Applied Sciences 10, 6817. doi:10.3390/app10196817.
- Lam et al. (2020b) Lam, B., Shi, D., Gan, W.S., Elliott, S.J., Nishimura, M., 2020b. Active control of broadband sound through the open aperture of a full-sized domestic window. Scientific Reports 10, 10021. URL: http://www.nature.com/articles/s41598-020-66563-z, doi:10.1038/s41598-020-66563-z.
- Lee et al. (2009) Lee, S.E., Sheikh, M.A., Wong, L.H.J., 2009. Vertical profile of train noise and indoor noise in high-rise residential environment, in: INTER-NOISE and NOISE-CON Congress and Conference Proceedings, Institute of Noise Control Engineering, Ottawa, Canada.
- Lenne et al. (2020) Lenne, L., Chevret, P., Marchand, J., 2020. Long-term effects of the use of a sound masking system in open-plan offices: A field study. Applied Acoustics 158, 107049. doi:10.1016/j.apacoust.2019.107049.
- Lercher et al. (2017) Lercher, P., De Coensel, B., Dekonink, L., Botteldooren, D., 2017. Community Response to Multiple Sound Sources: Integrating Acoustic and Contextual Approaches in the Analysis. International Journal of Environmental Research and Public Health 14, 663. doi:10.3390/ijerph14060663.
- Leung et al. (2017) Leung, T., Chau, C., Tang, S., Xu, J., 2017. Developing a multivariate model for predicting the noise annoyance responses due to combined water sound and road traffic noise exposure. Applied Acoustics 127, 284–291. doi:10.1016/j.apacoust.2017.06.020.
- Li and Lau (2020) Li, H., Lau, S.K., 2020. A review of audio-visual interaction on soundscape assessment in urban built environments. Applied Acoustics 166, 107372. URL: https://doi.org/10.1016/j.apacoust.2020.107372, doi:10.1016/j.apacoust.2020.107372.
- Li et al. (2022) Li, W., Zhai, J., Zhu, M., 2022. Characteristics and perception evaluation of the soundscapes of public spaces on both sides of the elevated road: A case study in Suzhou, China. Sustainable Cities and Society 84, 103996. doi:10.1016/j.scs.2022.103996.
- Li et al. (2020) Li, X., Tang, S.K., Yim, S.Y., Lee, R.Y., Hung, T., 2020. Noise reduction of plenum windows on the façade of a high-rise residential building next to heavy road traffic. Building and Environment 186, 107353. doi:10.1016/j.buildenv.2020.107353.
- Liu and Chen (2016) Liu, J., Chen, X., 2016. Adaptive Compensation of Misequalization in Narrowband Active Noise Equalizer Systems. IEEE/ACM Transactions on Audio, Speech, and Language Processing 24, 2390–2399. URL: http://ieeexplore.ieee.org/document/7556401/, doi:10.1109/TASLP.2016.2604212.
- Liu et al. (2019) Liu, L., Pottim, K.R., Kuo, S.M., 2019. Ear field adaptive noise control for snoring: an real-time experimental approach. IEEE/CAA Journal of Automatica Sinica 6, 158–166. doi:10.1109/JAS.2019.1911339.
- Locke (2019) Locke, K.D., 2019. Development and validation of a circumplex measure of the interpersonal culture in work teams and organizations. Frontiers in Psychology 10. URL: /pmc/articles/PMC6504781//pmc/articles/PMC6504781/?report=abstracthttps://www.ncbi.nlm.nih.gov/pmc/articles/PMC6504781/, doi:10.3389/FPSYG.2019.00850/PDF.
- Lugten et al. (2018) Lugten, M., Karacaoglu, M., White, K., Kang, J., Steemers, K., 2018. Improving the soundscape quality of urban areas exposed to aircraft noise by adding moving water and vegetation. The Journal of the Acoustical Society of America 144, 2906–2917. URL: http://asa.scitation.org/doi/10.1121/1.5079310, doi:10.1121/1.5079310.
- Mardia (1970) Mardia, K.V., 1970. Measures of multivariate skewness and kurtosis with applications. Biometrika 57, 519–530. URL: https://academic.oup.com/biomet/article/57/3/519/253220https://academic.oup.com/biomet/article-lookup/doi/10.1093/biomet/57.3.519, doi:10.1093/biomet/57.3.519.
- Mardia (1974) Mardia, K.V., 1974. Applications of Some Measures of Multivariate Skewness and Kurtosis in Testing Normality and Robustness Studies. Sankhyā: The Indian Journal of Statistics, Series B (1960-2002) 36, 115–128. URL: http://www.jstor.org/stable/25051892.
- Martin Bland and Altman (1986) Martin Bland, J., Altman, D., 1986. Statistical methods for assessing agreement between two methods of clinical measurement. The Lancet 327, 307–310. URL: https://linkinghub.elsevier.com/retrieve/pii/S0140673686908378, doi:10.1016/S0140-6736(86)90837-8.
- Miedema (2004) Miedema, H.M.E., 2004. Relationship between exposure to multiple noise sources and noise annoyance. The Journal of the Acoustical Society of America 116, 949–957. doi:10.1121/1.1766305.
- Mir et al. (2023) Mir, M., Nasirzadeh, F., Bereznicki, H., Enticott, P., Lee, S.H., Mills, A., 2023. Construction noise effects on human health: Evidence from physiological measures. Sustainable Cities and Society 91, 104470. URL: https://doi.org/10.1016/j.scs.2023.104470, doi:10.1016/j.scs.2023.104470.
- Mitchell et al. (2022) Mitchell, A., Aletta, F., Kang, J., 2022. How to analyse and represent quantitative soundscape data. JASA Express Letters 2, 037201. URL: https://asa.scitation.org/doi/abs/10.1121/10.0009794, doi:10.1121/10.0009794.
- Mitchell et al. (2020) Mitchell, A., Oberman, T., Aletta, F., Erfanian, M., Kachlicka, M., Lionello, M., Kang, J., 2020. The Soundscape Indices (SSID) Protocol: A Method for Urban Soundscape Surveys—Questionnaires with Acoustical and Contextual Information. Applied Sciences 10, 2397. doi:10.3390/app10072397.
- Morawska et al. (2020) Morawska, L., Tang, J.W., Bahnfleth, W., Bluyssen, P.M., Boerstra, A., Buonanno, G., Cao, J., Dancer, S., Floto, A., Franchimon, F., Haworth, C., Hogeling, J., Isaxon, C., Jimenez, J.L., Kurnitski, J., Li, Y., Loomans, M., Marks, G., Marr, L.C., Mazzarella, L., Melikov, A.K., Miller, S., Milton, D.K., Nazaroff, W., Nielsen, P.V., Noakes, C., Peccia, J., Querol, X., Sekhar, C., Seppänen, O., Tanabe, S.i., Tellier, R., Tham, K.W., Wargocki, P., Wierzbicka, A., Yao, M., 2020. How can airborne transmission of COVID-19 indoors be minimised? doi:10.1016/j.envint.2020.105832.
- Munzel et al. (2014) Munzel, T., Gori, T., Babisch, W., Basner, M., 2014. Cardiovascular effects of environmental noise exposure. European Heart Journal 35, 829–836. URL: https://academic.oup.com/eurheartj/article-lookup/doi/10.1093/eurheartj/ehu030, doi:10.1093/eurheartj/ehu030.
- Nathalie (2011) Nathalie, R., 2011. Health co-benefits of climate change mitigation: Housing sector. WHO Press, World Health Organization, Geneva, Switzerland.
- Nitidara et al. (2022) Nitidara, N.P.A., Sarwono, J., Suprijanto, S., Soelami, F.X., 2022. The multisensory interaction between auditory, visual, and thermal to the overall comfort in public open space: A study in a tropical climate. Sustainable Cities and Society 78, 103622. URL: https://doi.org/10.1016/j.scs.2021.103622, doi:10.1016/j.scs.2021.103622.
- Nunnally and Bernstein (1994) Nunnally, J.C., Bernstein, I.H., 1994. Psychometric Theory. 3rd ed., McGraw-Hill, New York, USA.
- O’Connor (2021) O’Connor, B.P., 2021. EFA.dimensions: Exploratory Factor Analysis Functions for Assessing Dimensionality. URL: https://cran.r-project.org/package=EFA.dimensions.
- Ooi et al. (2023a) Ooi, K., Ong, Z.T., Watcharasupat, K.N., Lam, B., Hong, J.Y., Gan, W.S., 2023a. ARAUS: A Large-Scale Dataset and Baseline Models of Affective Responses to Augmented Urban Soundscapes. IEEE Transactions on Affective Computing , 1–17doi:10.1109/TAFFC.2023.3247914.
- Ooi et al. (2022) Ooi, K., Watcharasupat, K.N., Lam, B., Ong, Z.T., Gan, W.S., 2022. Probably Pleasant? A Neural-Probabilistic Approach to Automatic Masker Selection for Urban Soundscape Augmentation, in: ICASSP 2022 - 2022 IEEE International Conference on Acoustics, Speech and Signal Processing (ICASSP), IEEE, Singapore. pp. 8887–8891. doi:10.1109/ICASSP43922.2022.9746897.
- Ooi et al. (2023b) Ooi, K., Watcharasupat, K.N., Lam, B., Ong, Z.T., Gan, W.S., 2023b. Autonomous Soundscape Augmentation with Multimodal Fusion of Visual and Participant-Linked Inputs, in: ICASSP 2023 - 2023 IEEE International Conference on Acoustics, Speech and Signal Processing (ICASSP), IEEE, Rhodes Island, Greece. pp. 1–5. URL: https://ieeexplore.ieee.org/document/10094866/, doi:10.1109/ICASSP49357.2023.10094866.
- Ooi et al. (2021) Ooi, K., Xie, Y., Lam, B., Gan, W.S., 2021. Automation of binaural headphone audio calibration on an artificial head. MethodsX 8, 101288. doi:10.1016/j.mex.2021.101288.
- Orga et al. (2021) Orga, F., Mitchell, A., Freixes, M., Aletta, F., Alsina-Pagès, R.M., Foraster, M., 2021. Multilevel Annoyance Modelling of Short Environmental Sound Recordings. Sustainability 2021, Vol. 13, Page 5779 13, 5779. URL: https://www.mdpi.com/2071-1050/13/11/5779/htmhttps://www.mdpi.com/2071-1050/13/11/5779, doi:10.3390/SU13115779.
- Pan and Martellotta (2020) Pan, L., Martellotta, F., 2020. A Parametric Study of the Acoustic Performance of Resonant Absorbers Made of Micro-perforated Membranes and Perforated Panels. Applied Sciences 10, 1581. doi:10.3390/app10051581.
- Park and Lee (2017) Park, S.H., Lee, P.J., 2017. Effects of floor impact noise on psychophysiological responses. Building and Environment 116, 173–181. URL: http://dx.doi.org/10.1016/j.buildenv.2017.02.005, doi:10.1016/j.buildenv.2017.02.005.
- Patel et al. (2017) Patel, V., Cheer, J., George, N.V., 2017. Modified Phase-Scheduled-Command FxLMS Algorithm for Active Sound Profiling. IEEE/ACM Transactions on Audio Speech and Language Processing 25, 1799–1808. doi:10.1109/TASLP.2017.2717499.
- Pedrielli et al. (2008) Pedrielli, F., Carletti, E., Casazza, C., 2008. Just noticeable differences of loudness and sharpness for earth moving machines, in: Proceedings of the European Conference on Noise Control (euronoise), Acoustics’08, Paris, France. pp. 2205–2210. doi:10.1121/1.2933219.
- Peters (2014) Peters, G., 2014. The alpha and the omega of scale reliability and validity: why and how to abandon Cronbach’s alpha and the route towards more comprehensive assessment of scale quality. The European health psychologist 16, 56–69. doi:10.31234/osf.io/h47fv.
- R Core Team (2021) R Core Team, 2021. R: A language and environment for statistical computing. R Foundation for Statistical Computing. URL: https://www.r-project.org/.
- Rådsten Ekman et al. (2015) Rådsten Ekman, M., Lundén, P., Nilsson, M.E., 2015. Similarity and pleasantness assessments of water-fountain sounds recorded in urban public spaces. The Journal of the Acoustical Society of America 138, 3043–3052. doi:10.1121/1.4934956.
- Rees and Elliott (2006) Rees, L.E., Elliott, S.J., 2006. Adaptive algorithms for active sound-profiling. IEEE Transactions on Audio, Speech and Language Processing 14, 711–719. doi:10.1109/TSA.2005.855828.
- Rinker (2021) Rinker, T.W., 2021. {sentimentr}: Calculate Text Polarity Sentiment. URL: https://github.com/trinker/sentimentr.
- Russell (1980) Russell, J.A., 1980. A circumplex model of affect. Journal of Personality and Social Psychology 39, 1161–1178. doi:10.1037/h0077714.
- Shapiro and Wilk (1965) Shapiro, S.S., Wilk, M.B., 1965. An Analysis of Variance Test for Normality (Complete Samples). Biometrika 52, 591. doi:10.2307/2333709.
- Sheikh and Lee (2014a) Sheikh, M.A., Lee, S.E., 2014a. A psychoacoustic assessment of road traffic noise for indoor aural comfort in high-rise built environment, in: INTER-NOISE and NOISE-CON Congress and Conference Proceedings, Institute of Noise Control Engineering, Melbourne, Australia. pp. 1001–1010.
- Sheikh and Lee (2014b) Sheikh, M.A., Lee, S.E., 2014b. Train noise - A psychoacoustic investigation for indoor aural comfort in high-rise urban environment in the tropics, in: INTER-NOISE and NOISE-CON Congress and Conference Proceedings, Institute of Noise Control Engineering, Melbourne, Australia. pp. 6337–6346.
- Shi et al. (2023) Shi, D., Gan, W.S., Lam, B., Luo, Z., Shen, X., 2023. Transferable Latent of CNN-based Selective Fixed-filter Active Noise Control. IEEE/ACM Transactions on Audio Speech and Language Processing doi:10.1109/TASLP.2023.3261757.
- Shi et al. (2020) Shi, D., Gan, W.S., Lam, B., Wen, S., 2020. Feedforward Selective Fixed-filter Active Noise Control: Algorithm and Implementation. IEEE/ACM Transactions on Audio, Speech, and Language Processing 28, 1–1. URL: https://ieeexplore.ieee.org/document/9086868/, doi:10.1109/TASLP.2020.2989582.
- Shi et al. (2022) Shi, D., Lam, B., Ooi, K., Shen, X., Gan, W.S., 2022. Selective fixed-filter active noise control based on convolutional neural network. Signal Processing 190, 108317. doi:10.1016/j.sigpro.2021.108317.
- Spandagos and Ng (2017) Spandagos, C., Ng, T.L., 2017. Equivalent full-load hours for assessing climate change impact on building cooling and heating energy consumption in large Asian cities. Applied Energy 189, 352–368. doi:10.1016/j.apenergy.2016.12.039.
- Tang (2017) Tang, S.K., 2017. A Review on Natural Ventilation-enabling Façade Noise Control Devices for Congested High-Rise Cities. Applied Sciences 7, 175. URL: http://www.mdpi.com/2076-3417/7/2/175, doi:10.3390/app7020175.
- Tong et al. (2016) Tong, Z., Chen, Y., Malkawi, A., Liu, Z., Freeman, R.B., 2016. Energy saving potential of natural ventilation in China: The impact of ambient air pollution. Applied Energy 179, 660–668. URL: https://linkinghub.elsevier.com/retrieve/pii/S0306261916309606, doi:10.1016/j.apenergy.2016.07.019.
- Torija and Flindell (2015) Torija, A.J., Flindell, I.H., 2015. The subjective effect of low frequency content in road traffic noise. The Journal of the Acoustical Society of America 137, 189–198. doi:10.1121/1.4904542.
- Torija et al. (2019) Torija, A.J., Roberts, S., Woodward, R., Flindell, I.H., McKenzie, A.R., Self, R.H., 2019. On the assessment of subjective response to tonal content of contemporary aircraft noise. Applied Acoustics 146, 190–203. URL: https://linkinghub.elsevier.com/retrieve/pii/S0003682X1830611X, doi:10.1016/j.apacoust.2018.11.015.
- Torresin et al. (2019) Torresin, Albatici, Aletta, Babich, Kang, 2019. Assessment Methods and Factors Determining Positive Indoor Soundscapes in Residential Buildings: A Systematic Review. Sustainability 11, 5290. URL: https://www.mdpi.com/2071-1050/11/19/5290/htmhttps://www.mdpi.com/2071-1050/11/19/5290, doi:10.3390/su11195290.
- Torresin et al. (2019) Torresin, S., Albatici, R., Aletta, F., Babich, F., Oberman, T., Kang, J., 2019. Acoustic Design Criteria in Naturally Ventilated Residential Buildings: New Research Perspectives by Applying the Indoor Soundscape Approach. Applied Sciences 9, 5401. URL: https://www.mdpi.com/2076-3417/9/24/5401, doi:10.3390/app9245401.
- Torresin et al. (2022a) Torresin, S., Albatici, R., Aletta, F., Babich, F., Oberman, T., Kang, J., 2022a. Associations between indoor soundscapes, building services and window opening behaviour during the COVID-19 lockdown. Building Services Engineering Research and Technology 43, 225–240. doi:10.1177/01436244211054443/ASSET/IMAGES/LARGE/10.1177_01436244211054443-FIG2.JPEG.
- Torresin et al. (2020) Torresin, S., Albatici, R., Aletta, F., Babich, F., Oberman, T., Siboni, S., Kang, J., 2020. Indoor soundscape assessment: A principal components model of acoustic perception in residential buildings. Building and Environment 182, 107152. doi:10.1016/j.buildenv.2020.107152.
- Torresin et al. (2022b) Torresin, S., Albatici, R., Aletta, F., Babich, F., Oberman, T., Stawinoga, A.E., Kang, J., 2022b. Indoor soundscapes at home during the COVID-19 lockdown in London – Part II: A structural equation model for comfort, content, and well-being. Applied Acoustics 185, 108379. doi:10.1016/J.APACOUST.2021.108379.
- Tracey (2000) Tracey, T.J., 2000. Analysis of Circumplex Models, in: Handbook of Applied Multivariate Statistics and Mathematical Modeling. Elsevier, pp. 641–664. URL: https://linkinghub.elsevier.com/retrieve/pii/B9780126913606500239, doi:10.1016/B978-012691360-6/50023-9.
- United Nations General Assembly (2015) United Nations General Assembly, 2015. Transforming our world: the 2030 Agenda for Sustainable development, A/RES/70/1. United Nations, New York, New York, USA. URL: www.un.org/en/development/desa/population/migration/generalassembly/docs/globalcompact/A_RES_70_1_E.pdf.
- Van Renterghem et al. (2020) Van Renterghem, T., Vanhecke, K., Filipan, K., Sun, K., De Pessemier, T., De Coensel, B., Joseph, W., Botteldooren, D., 2020. Interactive soundscape augmentation by natural sounds in a noise polluted urban park. Landscape and Urban Planning 194, 103705. URL: https://linkinghub.elsevier.com/retrieve/pii/S016920461931093X, doi:10.1016/j.landurbplan.2019.103705.
- Watcharasupat et al. (2022) Watcharasupat, K.N., Ooi, K., Lam, B., Wong, T., Ong, Z.T., Gan, W.S., 2022. Autonomous In-Situ Soundscape Augmentation via Joint Selection of Masker and Gain. IEEE Signal Processing Letters 29, 1749–1753. URL: https://ieeexplore.ieee.org/document/9841611/, doi:10.1109/LSP.2022.3194419.
- Weinstein (1978) Weinstein, N.D., 1978. Individual differences in reactions to noise: A longitudinal study in a college dormitory. Journal of Applied Psychology 63, 458–466. URL: /record/1979-09992-001, doi:10.1037/0021-9010.63.4.458.
- White (2018) White, K., 2018. Subjective and Physiological Responses to Aircraft Noise. Ph.D. thesis. Vrije Universiteit Amsterdam. Amsterdam, the Netherlands. URL: https://research.vu.nl/en/publications/subjective-and-physiological-responses-to-aircraft-noise.
- Wobbrock et al. (2011) Wobbrock, J.O., Findlater, L., Gergle, D., Higgins, J.J., 2011. The aligned rank transform for nonparametric factorial analyses using only anova procedures, in: Proceedings of the SIGCHI Conference on Human Factors in Computing Systems, ACM, Vancouver, BC. pp. 143–146. doi:10.1145/1978942.1978963.
- Wood et al. (2017) Wood, D., Harms, P.D., Lowman, G.H., DeSimone, J.A., 2017. Response Speed and Response Consistency as Mutually Validating Indicators of Data Quality in Online Samples. Social Psychological and Personality Science 8, 454–464. URL: http://journals.sagepub.com/doi/10.1177/1948550617703168, doi:10.1177/1948550617703168.
- World Health Organization Regional Office for Europe (1998) World Health Organization Regional Office for Europe, 1998. Use of well-being measures in primary health care - the DepCare project health for all. Technical Report. World Health Organization. Geneva, Switzerland.
- World Health Organization Regional Office for Europe (2018) World Health Organization Regional Office for Europe, 2018. Environmental Noise Guidelines for the European Region. The Regional Office for Europe of the World Health Organization, Copenhagen, Denmark.
- Yin et al. (2022) Yin, Y., Zhang, D., Zhen, M., Jing, W., Luo, W., Feng, W., 2022. Combined effects of the thermal-acoustic environment on subjective evaluations in outdoor public spaces. Sustainable Cities and Society 77, 103522. doi:10.1016/j.scs.2021.103522.
- Yuan et al. (2019) Yuan, M., Yin, C., Sun, Y., Chen, W., 2019. Examining the associations between urban built environment and noise pollution in high-density high-rise urban areas: A case study in Wuhan, China. Sustainable Cities and Society 50, 101678. doi:10.1016/J.SCS.2019.101678.
- Zacharov (2018) Zacharov, N. (Ed.), 2018. Sensory Evaluation of Sound. CRC Press. doi:10.1201/9780429429422.
- Zeigler-Hill and Highfill (2010) Zeigler-Hill, V., Highfill, L., 2010. Applying the interpersonal circumplex to the behavioral styles of dogs and cats. Applied Animal Behaviour Science 124, 104–112. doi:10.1016/j.applanim.2010.02.012.
- Zhong et al. (2018) Zhong, T., Chung, P.k., Liu, J.D., 2018. Short Form of Weinstein Noise Sensitivity Scale (NSS-SF): Reliability, Validity and Gender Invariance among Chinese Individuals. Biomedical and Environmental Sciences 31, 97–105. doi:10.3967/BES2018.012.
- Zhong et al. (2023) Zhong, W., Xiao, W., Zhang, T., 2023. Numerical Investigations on Natural Ventilation in Atria of China’s Southern Yangtze Vernacular Dwellings. Sustainable Cities and Society 89, 104341. URL: https://doi.org/10.1016/j.scs.2022.104341, doi:10.1016/j.scs.2022.104341.
- Zwicker and Fastl (2013) Zwicker, E., Fastl, H., 2013. Psychoacoustics: Facts and models. volume 22. Springer Science & Business Media.