tsdownsample: high-performance time series downsampling for scalable visualization
Abstract
Interactive line chart visualizations greatly enhance the effective exploration of large time series. Although downsampling has emerged as a well-established approach to enable efficient interactive visualization of large datasets, it is not an inherent feature in most visualization tools. Furthermore, there is no library offering a convenient interface for high-performance implementations of prominent downsampling algorithms. To address these shortcomings, we present tsdownsample, an open-source Python package specifically designed for CPU-based, in-memory time series downsampling. Our library focuses on performance and convenient integration, offering optimized implementations of leading downsampling algorithms. We achieve this optimization by leveraging low-level SIMD instructions and multithreading capabilities in Rust. In particular, SIMD instructions were employed to optimize the argmin and argmax operations. This SIMD optimization, along with some algorithmic tricks, proved crucial in enhancing the performance of various downsampling algorithms. We evaluate the performance of tsdownsample and demonstrate its interoperability with an established visualization framework. Our performance benchmarks indicate that the algorithmic runtime of tsdownsample approximates the CPU’s memory bandwidth. This work marks a significant advancement in bringing high-performance time series downsampling to the Python ecosystem, enabling scalable visualization. The open-source code can be found at https://github.com/predict-idlab/tsdownsample
keywords:
time series , visualization , downsampling , Rust , Python , SIMD1 Introduction
Time series are ubiquitous in many domains, such as healthcare, finance, and manufacturing. This complex data modality can be challenging to comprehend through summary statistics alone, making visualizations a crucial tool for gaining insights, with line charts proving particularly effective for most tasks [1]. By following the “overview first, zoom and filter, then details on demand” paradigm [2], interactive line chart visualizations allow users to quickly and easily understand the data and identify patterns and trends [3].
Many real-world time series datasets are extremely large, encompassing millions or even billions of data points. As a result, there is a pressing need for scalable visualization techniques that are capable of effectively handling such datasets [4, 5]. One approach to realize scalable visualization is through utilizing data aggregation techniques such as downsampling, which reduces the number of data points in a time series while preserving its overall shape [6, 7, 1]. Downsampling enables faster rendering and more responsive interactions, allowing users to explore large datasets more effectively [8, 9]. Downsampling algorithms find wide adoption in the time series database domain, with Uber integrating a downsampling function in their M3 metrics platform [10], and TimeScaleDB offering downsampling as a server-side hyperfunction [11].
However, when dealing with very large datasets (billions of data points), the downsampling process itself can become a bottleneck [12]. This is especially the case in the context of interactive visualizations, which require fast downsampling to minimize latency when interacting with the graph, such as zooming and panning [9]. Moreover, the authors observe that, at the time of writing, there is no Python library offering high-performance implementations of multiple time series downsampling algorithms.
Recognizing this challenge, we introduce tsdownsample, an open-source Python toolkit designed for in-memory, CPU-based, time series downsampling, focusing on performance and integrability. tsdownsample provides optimized CPU implementations of the most prominent downsampling algorithms, i.e., EveryNth, MinMax, M4 [7], LTTB (Largest-Triangle-Three-Buckts) [6], and MinMaxLTTB [12]. The algorithms are implemented in Rust, a system programming language known for its performance and memory safety. The Rust code leverages SIMD (Single Instruction Multiple Data) instructions together with some algorithmic tricks and (optionally) multithreading to achieve exceptional performance and scalability. A core component of tsdownsample is our ArgMinMax Rust library, which provides SIMD accelerated argmin and argmax functionality. Optimizing these operations for various CPU architectures proved to be crucial, as they form the inner loop of most downsampling algorithms [13]. tsdownsample is distributed as a Python toolkit by publishing the cross-compiled Python bindings for the underlying Rust code for a wide range of operating systems and CPU architectures.
In summary, this paper contributes tsdownsample, a high-performance library optimized for CPU that provides downsampling for scalable time series visualization. This library’s integrability is demonstrated through its adoption as the downsampling solution in a time series visualization library, which has over 1.5 million installations at the time of writing.
2 Software description
tsdownsample is a Python package that utilizes Rust to provide CPU-optimized implementations of downsampling algorithms for time series visualization. To facilitate seamless installation and usage, Python bindings for the underlying Rust code are cross-compiled for various operating systems and CPU architectures, which are distributed as a PyPi package. Installing tsdownsample is simple and can be done via pip by running the following command: pip install tsdownsample.
The following subsections detail the performance and user-interface aspect of tsdownsample. We will first describe how optimizing argmin and argmax operations in Rust proved crucial for achieving high-performance downsampling. Then, we will discuss the convenient interface that this library provides for all implemented downsampling algorithms.
2.1 ArgMinMax
Given the significance of vertical extrema for ensuring the visual representativeness of time series downsampling [13], it was imperative to optimize the argmin and argmax operations. These operations play a vital role in the inner loop of the MinMax, M4 [7], and MinMaxLTTB [12] algorithms. As such, we developed the ArgMinMax Rust library (also referred to as a crate), which provides a highly efficient and overflow-free implementation of the argmin and argmax operations. These operations return the indices of the minimum and maximum values of an array. Note that the argmin and argmax values are extracted simultaneously within a single pass over the data, as this is mainly a memory-bound task.
The ArgMinMax crate includes SIMD-optimized implementations of argmin and argmax for SSE, AVX(2), AVX512, and NEON, and includes runtime CPU feature detection to select the optimal (supported) SIMD implementation for the current CPU. SIMD instructions allow the CPU to perform the same operation on multiple data points simultaneously, providing a significant boost in performance for certain types of operations. The library is SIMD-optimized for a wide range of CPU architectures; x86, x86_64, arm(v7), and aarch64. In addition, the ArgMinMax crate supports a wide range of data types (f16, f32, f64, i8, i16, i32, i64, u8, u16, u32, and u64). We further guarantee the library to be memory-efficient, as it operates on a memory view (i.e., a slice) of the data rather than copying it. The SIMD algorithm is also branchless, ensuring that the runtime is independent of the quality of the branch predictor, making the best-case runtime the same as the worst-case runtime.
2.1.1 argminmax SIMD algorithm
In code snippet 1, we present the inner loop of the SIMD argmin and argmax algorithm. This algorithm extracts both the argmin and argmax value in a single pass over the data. To do so, we utilize four accumulating SIMD vectors (also referred to as registers). Two of these registers maintain the lowest and highest values encountered while iterating over the data in chunks of size LANE_SIZE. At the end of the iteration, these vectors contain the maximum and minimum values at each position within all seen LANE_SIZE chunks. As a final step, after iterating over all the chunks, the algorithm extracts the minimum and maximum values along with their respective indices from the SIMD vectors (i.e., the horizontal operations).
The pseudocode in snippet 1 closely resembles the Rust code of the ArgMinMax package. It is worth noting that the SIMD instructions, such as _mm_loadu, _mm_cmplt, _mm_cmpgt, and _mm_blendv, are generic function names that need to be associated with the corresponding CPU instructions of the various architectures. To achieve this in Rust, we utilized a trait that defines these generic SIMD instructions as functions, similar to C++ templates. For each supported CPU architecture and data type combination in the ArgMinMax package, we have implemented a concrete version of this trait111Since the lane-size is also influenced by this combination, this trait includes the lane size parameter as well..
When the length of the array exceeds the maximum value that the index vector’s underlying data type can represent, an (index) overflow will occur. It is this overflow challenge that makes the argmin and argmax operations a much harder problem to SIMD-optimize compared to the min and max operations. As a result, compiling a scalar implementation to vectorized instructions is not trivial or even impossible. As such, it was necessary to manually write the algorithm using SIMD instructions, rather than relying on the compiler for optimized compilation. Notably, the polars library, an exceptionally fast DataFrame library and in-memory query engine that currently exceeds 0.7M monthly installations, adopted our ArgMinMax crate to provide more optimized argmin and argmax operations [14]. For more details on how to implement an overflow-free solution (which requires an additional outer loop), please refer to the open-source code repository available at github.com/predict-idlab/argminmax.
2.1.2 Optimized implementation for f16 and uints
In contrast to other data types, most modern CPUs (x86) do not have hardware support for the float16 (f16) data type222With float16 we refer to IEEE 754-2008 standard binary16, also known as half floating point type [15].. As a result, programming languages typically support f16 either by upcasting to f32 or by using a software implementation. Both approaches come at the cost of considerable overhead.
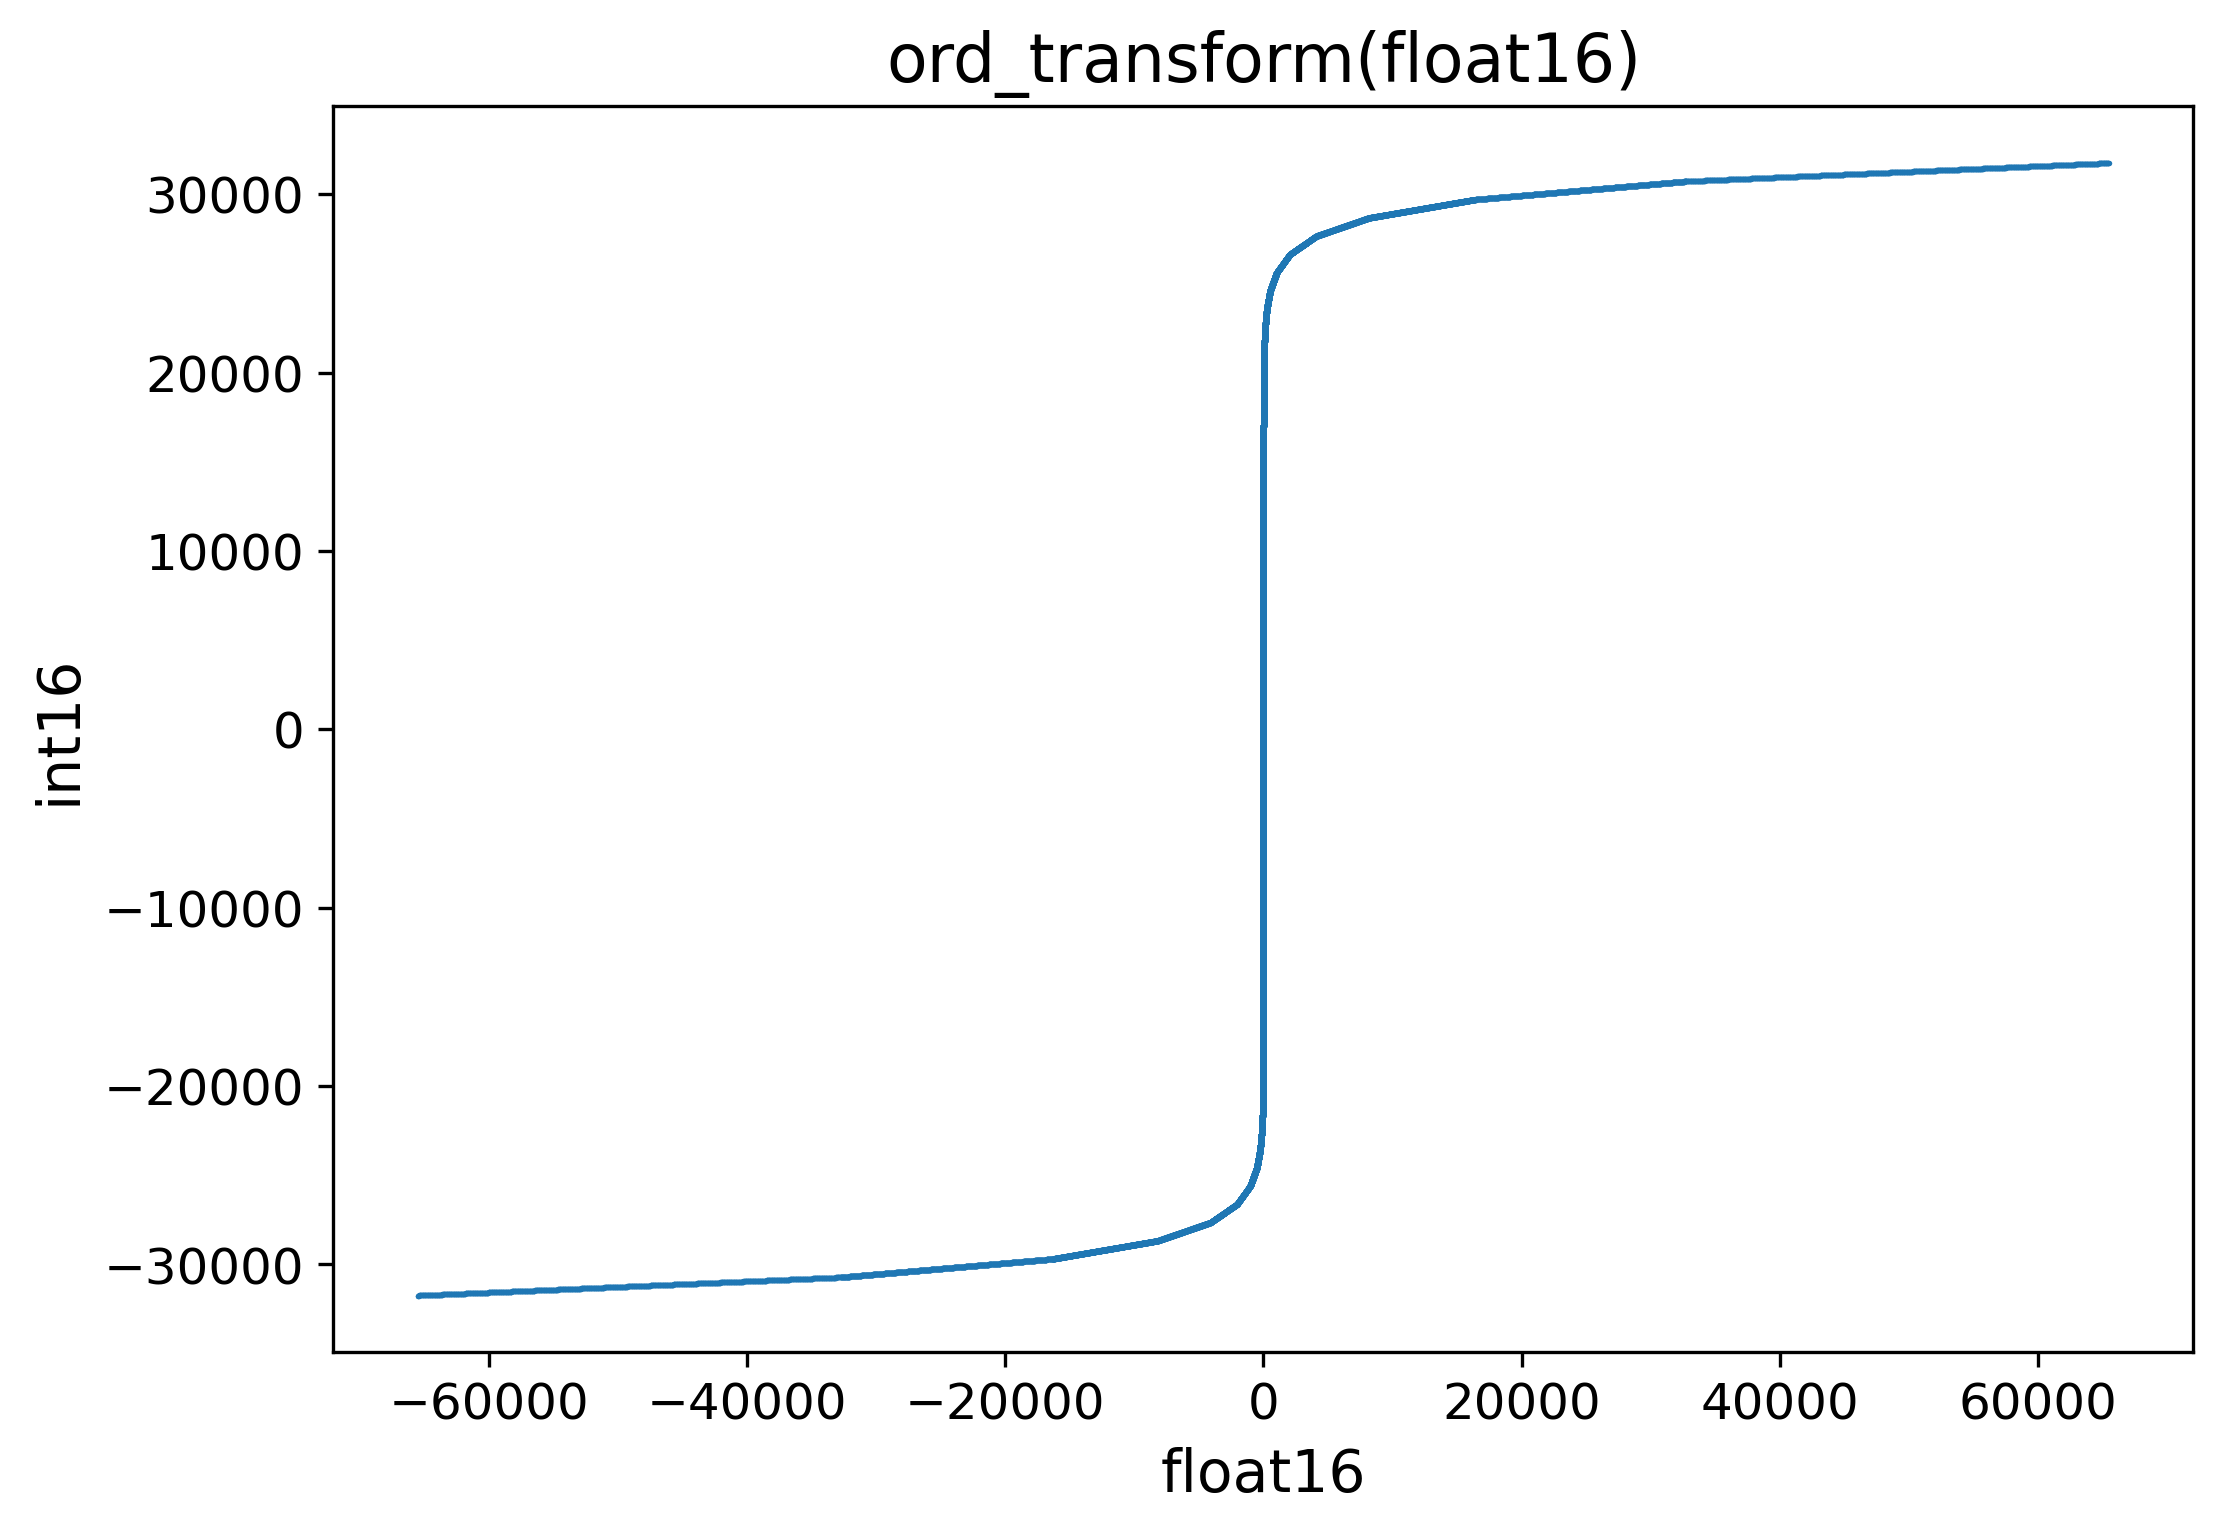
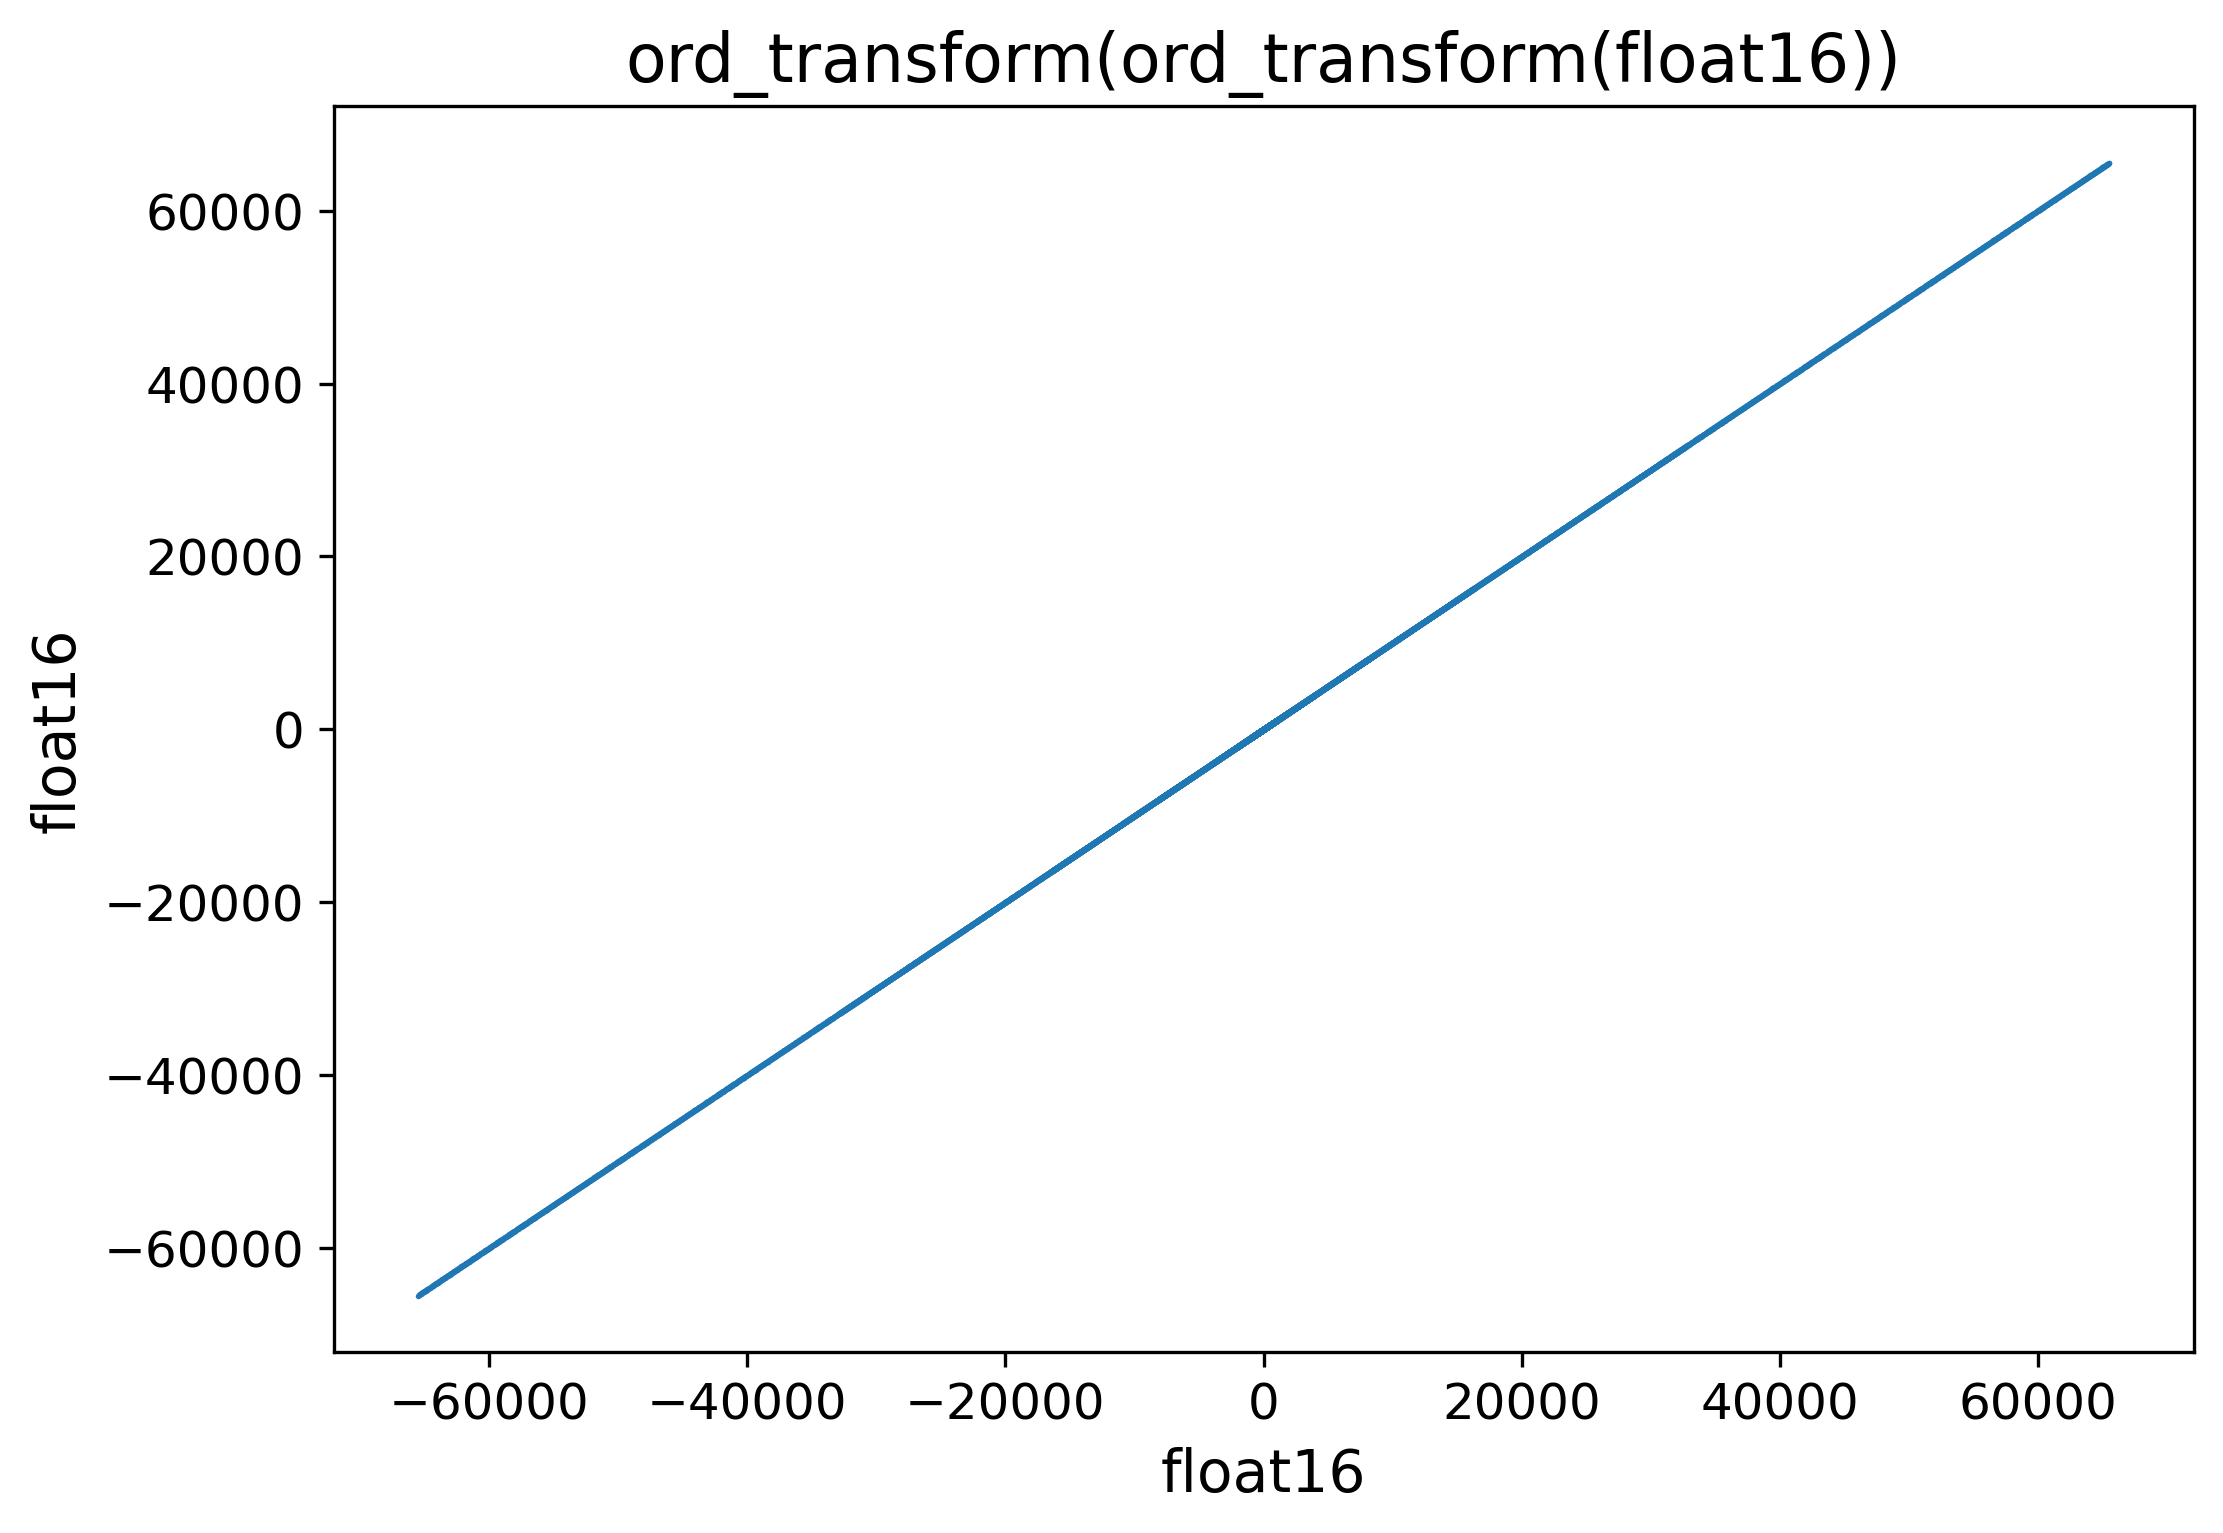
Instead of applying one of these two approaches, we convert f16 to an ordinal mapping of i16 (which we refer to as i16ord). This allows us to efficiently support f16 data types in the ArgMinMax crate and in the tsdownsample package as a whole. The mapping preserves the ordinality of the f16 data, as illustrated in Figure 3, allowing the use of fast built-in i16 (SIMD) instructions for comparison333Note that this mapping only makes sense when you are solely interested in comparing values.. Moreover, the transformation is symmetric, meaning that we can transform the outcome back to f16 (by using the same mapping function) without needing a lookup table, as illustrated in Figure 3. Furthermore, as the transformation only performs binary (bitwise) operations, the overhead is limited, thus making it convenient to implement using SIMD instructions.
The ordinal transformation is performed as follows444To apply this transformation to a f16 value, we first transmute the f16 value to i16.:
ord_transform(v: i16) = ((v >> 15) & 0x7FFF) v)
A final implementation remark is that uint data types (u8, u16, u32, u64) lack SSE, AVX(2), nor AVX512 SIMD instructions. This data type is supported by performing a similar, albeit much simpler, ordinal mapping to integer data type. This mapping leverages the two’s complement of signed integers. In particular, the transformation first transmutes the uint as int and then XORs the value with the smallest (i.e., the largest negative) int value.
2.2 tsdownsample
tsdownsample further builds upon the optimizations of the ArgMinMax crate. In particular, the MinMax, M4, and MinMaxLTTB algorithms directly rely on the argmingmax algorithm in their inner loop (i.e., for each bin). Since these algorithms operate on local heuristics within each bin, they can be easily parallelized in Rust to leverage the processing power of modern multicore CPUs [16]. To achieve this, we implemented a multithreaded bin index generator using a search sorted approach, thereby enhancing cache hits through chunked execution. Remark that multithreading is not possible in Python due to the Global Interpreter Lock (GIL) which prevents multiple threads from executing Python bytecodes simultaneously [17].
Unit testing is conducted to ensure the correctness of the supported downsampling algorithms. Specifically, we verify the consistency of the downsampled (i.e., selected) data points across various data types, downsamplers, and multithreading configurations. Additionally, we compare the Rust implementations to a reference Python implementation, which (although being considerably slower) serves as a benchmark for correctness. Furthermore, we ensure that passing an equally sampled x yields the same output as not specifying the index. Noteworthy, to capture potential performance regressions when updating the code base, we added performance monitoring to the CI/CD workflow.
2.3 Downsampling interface
tsdownsample aims to provide a convenient interface for the supported downsampling algorithms. Users can interact with these algorithms through Python classes, which act as a thin wrapper around the underlying Rust bindings. These classes abstract the dispatching of data type specific function calls, making the interface easy to use. All classes implement the downsample method, which has the following signature:
downsample([x], y, n_out, **kwargs) -> ndarray[uint64]
This signature first accepts two positional arguments that represent the input values555This signature design aligns with the convention used in the matplotlib.pyplot.plot method [18].. The first positional argument x is optional and represents the index of the time series values (y). If not provided, it is assumed that the time series values are equally sampled without any gaps. The second positional argument y is mandatory and corresponds to the input time series values. The n_out argument is a mandatory keyword argument that defines the number of output values666It is important to note that if there are gaps in the time series (index), fewer than n_out indices may be returned, as no data points can be selected for empty bins. In addition to these arguments, optional keyword arguments can be passed via **kwargs. These additional arguments provide increased flexibility, including options such as the parallel argument, a boolean that enables multi-threading when set to True. By default, the parallel option is set to False. Lastly, the downsample method returns a numpy array containing unsigned 64-bit integers, representing the indices of the downsampled (i.e., selected) values.
3 Illustrative example
Listing 4 provides an illustration of how tsdownsample can be utilized. The code snippet begins by importing the MinMaxLTTBDownsampler class from the tsdownsample package, along with the numpy library. numpy is utilized to generate a random time series dataset consisting of 10 million points. Next, an instance of the MinMaxLTTBDownsampler class is constructed, which is used to downsample the aforementioned time series data to 1000 points. This is accomplished by utilizing the downsample method, whose interface is detailed in Section 2.3. The resulting indices of the downsampled time series data are stored in the s_ds variable. Subsequently, these selected indices can be used to retrieve a representative subset of the original time series data, facilitating efficient visualization.
3.1 Integration in plotly-resampler
tsdownsample has been integrated as downsampling back end in the plotly-resampler visualization tool since version v0.9 [8]. At the time of writing, plotly-resampler has over 1.5 million installations. One longstanding challenge with the plotly-resampler library was the need for users to compile downsampling C code locally during the installation process. This requirement often led to complications, as it necessitates users to have the correct Python headers, ensure compatibility of the numpy version with the utilized C API, and have an appropriate C compiler installed. However, by adopting tsdownsample, these issues have been effectively addressed. tsdownsample has a precompiled binary available for multiple platforms, eliminating the need for users to compile the underlying code themselves, while ensuring optimal performance. This integration has not only resolved these compilation-related obstacles but has also resulted in remarkable speed improvements, ranging from 3 to 30 times faster performance.
4 Performance
We analyzed the performance of tsdownsample for a range of data types and algorithms, as presented in Table 1. To do so, we created an array of random values for the data types under consideration and measured the time required to downsample the respective array to 2,000 values (i.e., n_out=2,000) using Python’s timeit module. A reproducible notebook containing the benchmark code can be found here: https://github.com/predict-idlab/tsdownsample/blob/main/notebooks/benches.ipynb.
The benchmarks were executed on a server with an Intel Xeon E5-2650 v2 (32) @ 3.40GHz CPU and SAMSUNG M393B1G73QH0-CMA DDR3 1600MT/s RAM, running on the Ubuntu 18.04.6 LTS x86_64 operating system. Other running processes were limited to a minimum.
Table 1 displays the median time measurements for the five downsampling algorithms available in tsdownsample. These measurements are provided for all supported data types and varying numbers of data points. Among the algorithms, EveryNth exhibits a constant execution time of approximately 0.02 ms, regardless of the length of the input data. For the M4, MinMax, and MinMaxLTTB algorithms, we observe two main trends. Firstly, there is a linear or sublinear increase (approximately 10x or less) in runtime when transitioning from 10 million to 100 million and then to 1 billion data points. Secondly, these three algorithms have similar runtimes for the same data type, which is most noticeable in the 1 billion data point rows. Both these trends hold true for the sequential and parallel executions. In the case of the LTTB algorithm, we again notice a linear scaling pattern as the data length increases. It is important to note that the runtime of LTTB is significantly slower, up to two orders of magnitude, compared to MinMaxLTTB, especially when dealing with larger datasets (e.g., 1 billion uint8 data points). This slower runtime can be attributed to LTTB requiring much more computationally expensive calculations [6], which is largely mitigated in MinMaxLTTB [12].
| Algorithm | EveryNth | M4 | MinMax | MinMaxLTTB | LTTB | ||||
|---|---|---|---|---|---|---|---|---|---|
| Parallel | False | False | True | False | True | False | True | False | |
| dtype | N | ||||||||
| float16 | 1,000,000 | 0.02 | 0.47 | 0.43 | 0.43 | 0.55 | 1.12 | 0.80 | 6.60 |
| 10,000,000 | 0.01 | 2.94 | 0.59 | 2.31 | 0.56 | 4.13 | 0.89 | 59.95 | |
| 100,000,000 | 0.03 | 24.93 | 4.94 | 34.49 | 4.97 | 25.89 | 5.25 | 575.40 | |
| 1,000,000,000 | 0.01 | 255.13 | 44.61 | 250.30 | 44.92 | 262.83 | 45.06 | 5614.58 | |
| float32 | 1,000,000 | 0.01 | 0.41 | 0.27 | 0.46 | 0.23 | 1.17 | 0.56 | 2.41 |
| 10,000,000 | 0.03 | 4.02 | 0.89 | 3.56 | 0.94 | 6.29 | 1.15 | 18.39 | |
| 100,000,000 | 0.02 | 41.27 | 9.25 | 33.40 | 9.28 | 40.40 | 9.56 | 173.72 | |
| 1,000,000,000 | 0.02 | 407.50 | 88.64 | 338.46 | 88.75 | 398.32 | 89.17 | 1750.17 | |
| float64 | 1,000,000 | 0.02 | 0.73 | 0.33 | 0.75 | 0.34 | 1.52 | 0.53 | 2.33 |
| 10,000,000 | 0.02 | 8.60 | 2.04 | 8.80 | 2.18 | 10.51 | 2.30 | 18.25 | |
| 100,000,000 | 0.02 | 85.43 | 18.06 | 83.51 | 18.09 | 86.07 | 18.37 | 196.97 | |
| 1,000,000,000 | 0.01 | 832.17 | 176.74 | 663.86 | 176.82 | 828.15 | 177.26 | 1804.99 | |
| int8 | 1,000,000 | 0.03 | 0.38 | 0.43 | 0.46 | 0.45 | 0.93 | 0.74 | 3.40 |
| 10,000,000 | 0.02 | 1.98 | 0.51 | 1.50 | 0.52 | 2.64 | 0.77 | 24.39 | |
| 100,000,000 | 0.01 | 18.08 | 2.69 | 14.49 | 2.77 | 17.58 | 3.03 | 237.54 | |
| 1,000,000,000 | 0.01 | 151.21 | 22.63 | 142.52 | 22.61 | 155.97 | 22.83 | 2374.65 | |
| int16 | 1,000,000 | 0.02 | 0.38 | 0.35 | 0.41 | 0.37 | 0.86 | 0.64 | 3.34 |
| 10,000,000 | 0.01 | 3.78 | 0.46 | 2.01 | 0.50 | 3.41 | 0.74 | 28.64 | |
| 100,000,000 | 0.02 | 30.17 | 4.95 | 23.65 | 5.07 | 23.87 | 5.20 | 253.98 | |
| 1,000,000,000 | 0.02 | 230.80 | 44.80 | 229.14 | 44.80 | 232.49 | 45.00 | 2417.14 | |
| int32 | 1,000,000 | 0.03 | 0.59 | 0.38 | 0.64 | 0.40 | 1.28 | 0.63 | 3.19 |
| 10,000,000 | 0.02 | 5.36 | 0.92 | 4.25 | 1.01 | 5.05 | 1.21 | 23.79 | |
| 100,000,000 | 0.01 | 44.57 | 9.61 | 45.47 | 9.31 | 58.25 | 9.78 | 227.60 | |
| 1,000,000,000 | 0.01 | 452.85 | 88.67 | 390.95 | 88.72 | 470.03 | 89.00 | 2297.82 | |
| int64 | 1,000,000 | 0.03 | 1.52 | 0.45 | 1.55 | 0.57 | 1.86 | 0.70 | 3.25 |
| 10,000,000 | 0.01 | 13.33 | 2.20 | 11.15 | 2.28 | 11.55 | 2.50 | 24.63 | |
| 100,000,000 | 0.03 | 116.66 | 18.50 | 139.79 | 18.17 | 134.90 | 19.30 | 270.74 | |
| 1,000,000,000 | 0.03 | 1154.85 | 177.20 | 1114.58 | 177.47 | 1171.36 | 177.52 | 2408.60 | |
| uint8 | 1,000,000 | 0.02 | 0.39 | 0.44 | 0.47 | 0.48 | 0.91 | 0.74 | 3.42 |
| 10,000,000 | 0.02 | 2.08 | 0.52 | 1.61 | 0.53 | 2.65 | 0.77 | 24.52 | |
| 100,000,000 | 0.02 | 15.97 | 2.70 | 15.01 | 2.78 | 18.86 | 2.96 | 243.15 | |
| 1,000,000,000 | 0.01 | 155.68 | 22.73 | 147.67 | 22.62 | 160.77 | 22.79 | 2384.09 | |
| uint16 | 1,000,000 | 0.02 | 0.52 | 0.34 | 0.37 | 0.35 | 0.81 | 0.55 | 3.29 |
| 10,000,000 | 0.01 | 2.56 | 0.45 | 2.02 | 0.45 | 3.22 | 0.62 | 24.86 | |
| 100,000,000 | 0.01 | 24.31 | 4.88 | 20.95 | 4.82 | 24.79 | 4.89 | 317.30 | |
| 1,000,000,000 | 0.01 | 239.21 | 44.52 | 202.76 | 44.70 | 238.73 | 44.74 | 2392.48 | |
| uint32 | 1,000,000 | 0.02 | 0.58 | 0.34 | 0.62 | 0.36 | 1.15 | 0.57 | 3.30 |
| 10,000,000 | 0.02 | 5.98 | 0.92 | 4.33 | 0.93 | 8.88 | 1.16 | 25.02 | |
| 100,000,000 | 0.01 | 47.35 | 9.31 | 40.29 | 9.27 | 48.17 | 9.56 | 240.22 | |
| 1,000,000,000 | 0.01 | 468.04 | 88.72 | 399.56 | 88.91 | 475.70 | 88.91 | 2402.57 | |
| uint64 | 1,000,000 | 0.01 | 1.85 | 0.40 | 1.87 | 0.42 | 2.14 | 0.61 | 3.77 |
| 10,000,000 | 0.01 | 14.69 | 2.11 | 13.90 | 2.15 | 14.17 | 2.42 | 35.38 | |
| 100,000,000 | 0.02 | 140.70 | 18.19 | 137.31 | 18.21 | 140.87 | 18.36 | 276.40 | |
| 1,000,000,000 | 0.01 | 1403.84 | 176.99 | 1380.90 | 177.19 | 1402.95 | 177.25 | 2817.33 | |
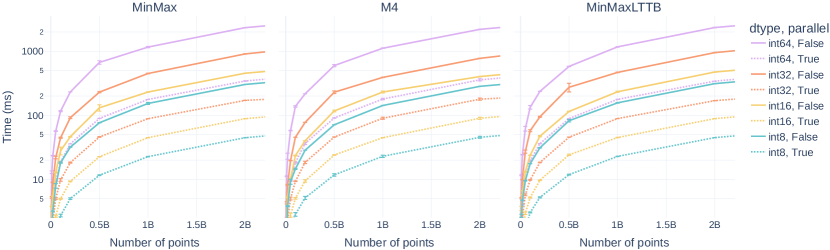
Figure 5 provides additional insights to complement the findings of Table 1. It illustrates the relationship between downsampling time (y-axis) and the number of data points (x-axis) for the three algorithms that utilize the optimizations of ArgMinMax. Given that the y-axis is logarithmic scale, the logarithmic trend that we observe for all integer data types in every subplot, confirms the earlier mentioned observation that the implementation scales linearly with the number of data points in the array.
Our primary finding is that the implementation exhibits faster performance for lower bitsize variants of the same data type. For instance, int32 demonstrates a roughly 2x speed improvement compared to int64 for the same number of data points, while int16 is 2x faster than int32. Remark that these 2x performance differences are even more pronounced (i.e., a clear 2x) for the parallel execution. This discrepancy in performance can be attributed to the fact that reducing the bit-representation by 2x (e.g., int32 vs. int64) allows for a 2x increase in the number of values that fit in the CPU’s SIMD registers. This utilization of SIMD registers is an essential part of the ArgMinMax code base and results in fewer read (memcpy) instructions, which impacts performance since ArgMinMax is primarily bound by memory access.
Our second key finding emphasizes the benefits of implementing multithreading. On average, multithreading leads to an impressive 7x performance improvement on the benchmarking computer. Notably, when extrapolating the linear trend of the int64 data type, tsdownsample demonstrates the capability to downsample data at a rate of 45 GB/s (i.e., 8 GB / 0.177 s).
5 Conclusion
Time series visualization plays a crucial role in exploratory data analysis, particularly as datasets continue to grow in size. To enable scalable line-chart visualization, downsampling has emerged as a well-established technique. However, we have observed a need for a convenient and high-performance time series downsampling solution within the Python landscape, facilitating the integration of downsampling capabilities into widely used Python visualization packages. To address this need, we introduce tsdownsample, a Python library that offers a convenient interface to leading precompiled downsampling algorithms, harnessing highly optimized underlying Rust code. A key aspect of achieving high performance in tsdownsample involved optimizing argmin and argmax operations using SIMD instructions and leveraging multithreading. The runtime feature set detection enables the selection of the most optimal implementation based on the CPU, allowing for the distribution of a single binary that can cater to multiple CPU feature sets within the same architecture. Benchmark results confirm the critical role played by both SIMD optimizations and multithreading in achieving the impressive performance of tsdownsample. We firmly believe that tsdownsample represents a significant advancement in delivering high-performance time series downsampling capabilities to the Python ecosystem. This advancement is further illustrated by the adoption of tsdownsample in the plotly-resampler tool, solidifying its position within the Python community.
Acknowledgements
The authors thank Martijn Courteaux and Tom Windels for having fruitful discussions on writing efficient low-level code.
References
- [1] W. Aigner, S. Miksch, W. Müller, H. Schumann, C. Tominski, Visualizing time-oriented data—a systematic view, Computers & Graphics 31 (3) (2007) 401–409.
- [2] B. Shneiderman, The eyes have it: A task by data type taxonomy for information visualizations, in: The craft of information visualization, Elsevier, 2003, pp. 364–371.
- [3] J. Walker, R. Borgo, M. W. Jones, Timenotes: a study on effective chart visualization and interaction techniques for time-series data, IEEE transactions on visualization and computer graphics 22 (1) (2015) 549–558.
- [4] N. Bikakis, Big data visualization tools, arXiv preprint arXiv:1801.08336 (2018).
- [5] P. Godfrey, J. Gryz, P. Lasek, N. Razavi, Interactive visualization of big data, in: Beyond Databases, Architectures and Structures. Advanced Technologies for Data Mining and Knowledge Discovery: 12th International Conference, BDAS 2016, Ustroń, Poland, May 31-June 3, 2016, Proceedings 11, Springer, 2016, pp. 3–22.
- [6] S. Steinarsson, Downsampling time series for visual representation, Ph.D. thesis (2013).
- [7] U. Jugel, Z. Jerzak, G. Hackenbroich, V. Markl, M4: a visualization-oriented time series data aggregation, Proceedings of the VLDB Endowment 7 (10) (2014) 797–808.
- [8] J. Van Der Donckt, J. Van Der Donckt, E. Deprost, S. Van Hoecke, Plotly-resampler: Effective visual analytics for large time series, in: 2022 IEEE Visualization and Visual Analytics (VIS), IEEE, 2022, pp. 21–25.
- [9] Z. Liu, J. Heer, The effects of interactive latency on exploratory visual analysis, IEEE transactions on visualization and computer graphics 20 (12) (2014) 2122–2131.
-
[10]
B. Raskin, N. Aggarwal, The
billion data point challenge: Building a query engine for high cardinality
time series data (Dec 2018).
URL uber.com/billion-data-point-challenge -
[11]
J. Davi Paganini,
Downsampling
in the database: How data locality can improve data analysis (Feb 2023).
URL timescale.com/blog/downsampling-in-the-database-how-data-locality-can-improve-data-analysis/ - [12] J. Van Der Donckt, J. Van Der Donckt, M. Rademaker, S. Van Hoecke, Minmaxlttb: Leveraging minmax-preselection to scale lttb, arXiv preprint arXiv:2305.00332 (2023).
- [13] J. Van Der Donckt, J. Van Der Donckt, M. Rademaker, S. Van Hoecke, Data point selection for line chart visualization: Methodological assessment and evidence-based guidelines, arXiv preprint arXiv:2304.00900 (2023).
-
[14]
R. Vink, S. de Gooijer, A. Beedie, J. van Zundert, G. Hulselmans, M. E.
Gorelli, C. Grinstead, M. Santamaria, D. Heres, ibENPC, J. Leitao, M. van
Heerden, C. Jermain, R. Russell, C. Pryer, A. G. Castellanos, J. Goh,
M. Wilksch, illumination k, O. Borchert, J. Peek, M. Conradt, L. Brannigan,
Y. R. Tan, elbaro, N. Stalder, Robert, S. H. Welling, A. Gregory,
pola-rs/polars: Python polars
0.17.3 (Apr. 2023).
doi:10.5281/zenodo.7832012.
URL https://doi.org/10.5281/zenodo.7832012 - [15] M. Cornea, Ieee 754-2008 decimal floating-point for intel® architecture processors, in: 2009 19th IEEE Symposium on Computer Arithmetic, IEEE, 2009, pp. 225–228.
- [16] H. Heyman, L. Brandefelt, A comparison of performance & implementation complexity of multithreaded applications in rust, java and c++ (2020).
- [17] D. Beazley, Understanding the python gil, in: PyCON Python Conference. Atlanta, Georgia, 2010.
- [18] J. D. Hunter, Matplotlib: A 2d graphics environment, Computing in science & engineering 9 (03) (2007) 90–95.
Current code version
| Nr. | Code metadata description | Please fill in this column |
|---|---|---|
| C1 | Current code version | v0.1.2 |
| C2 | Permanent link to code/repository used for this code version | https://github.com/predict-idlab/tsdownsample/releases/tag/v0.1.2 |
| C3 | Permanent link to Reproducible Capsule | Not available |
| C4 | Legal Code License | MIT |
| C5 | Code versioning system used | git |
| C6 | Software code languages, tools, and services used | Python, Rust |
| C7 | Compilation requirements, operating environments & dependencies | cargo is used to manage the Rust dependencies and compilation. PyO3/maturin is used as build backend to generate Python bindings for the Rust code. |
| C8 | If available Link to developer documentation/manual | Not available |
| C9 | Support email for questions | jeroen.vanderdonckt@ugent.be |
Current executable software version
| Nr. | (Executable) software metadata description | Please fill in this column |
|---|---|---|
| S1 | Current software version | v0.1.2 |
| S2 | Permanent link to executables of this version | https://github.com/predict-idlab/tsdownsample |
| S3 | Permanent link to Reproducible Capsule | Not available |
| S4 | Legal Software License | MIT |
| S5 | Computing platforms/Operating Systems | For example Android, BSD, iOS, Linux, OS X, Microsoft Windows, Unix-like , IBM z/OS, distributed/web based etc. |
| S6 | Installation requirements & dependencies | Python 3.7+, Rust nightly |
| S7 | If available, link to user manual - if formally published include a reference to the publication in the reference list | Not available |
| S8 | Support email for questions | jeroen.vanderdonckt@ugent.be |