A Self-Supervised Algorithm for Denoising Photoplethysmography Signals for Heart Rate Estimation from Wearables
Abstract
Smart watches and other wearable devices are equipped with photoplethysmography (PPG) sensors for monitoring heart rate and other aspects of cardiovascular health. However, PPG signals collected from such devices are susceptible to corruption from noise and motion artifacts, which cause errors in heart rate estimation. Typical denoising approaches filter or reconstruct the signal in ways that eliminate much of the morphological information, even from the clean parts of the signal that would be useful to preserve. In this work, we develop an algorithm for denoising PPG signals that reconstructs the corrupted parts of the signal, while preserving the clean parts of the PPG signal. Our novel framework relies on self-supervised training, where we leverage a large database of clean PPG signals to train a denoising autoencoder. As we show, our reconstructed signals provide better estimates of heart rate from PPG signals than the leading heart rate estimation methods. Further experiments show significant improvement in Heart Rate Variability (HRV) estimation from PPG signals using our algorithm. We conclude that our algorithm denoises PPG signals in a way that can improve downstream analysis of many different health metrics from wearable devices.
1 Introduction
Photoplethysmography (PPG) is a non-invasive optical measurement technique that provides vital information about the cardiovascular system. PPG-enabled devices consist of an optical sensor that measure volumetric variations of blood circulation as PPG signals. Modern PPG-enabled devices include a variety of technologies such as fingertip-based pulse oximeters, forehead and earlobe-based PPG sensors, and most commonly, wrist-worn smart watches [Castaneda et al.(2018)]. PPG monitoring can enable early detection of serious heart conditions that otherwise might go undetected [Allen et al.(2006), Pereira et al.(2020)]. A key application of PPG is the estimation of heart rate (HR).
PPG is limited by its susceptibility to noise artifacts, including motion artifacts (MA) caused by body movements, and artifacts arising from environmental factors like ambient light, sweat, pressure, etc. [Sañudo et al.(2019)]. In order to ensure accuracy of HR estimates and robust diagnosis of medical conditions, it is essential to mitigate such artifacts. Methods that address this limitation for prediction of HR from PPG signals can be broadly categorized into two types. The first type estimates HR directly from the signals despite the presence of artifacts [Reiss et al.(2019), Temko(2017), Biswas et al.(2019), Shyam et al.(2019), Panwar et al.(2020)]. The second type of method attempts to extract, denoise or reconstruct a clean signal from the noise-corrupted signal [Galli et al.(2018), Chang et al.(2021), Wu et al.(2017), Kasambe and Rathod(2015)]. These methods output a cleaned signal that can potentially be used for multiple downstream tasks, including HR estimation, which makes them more generally useful. However, methods of the second type tend to perform relatively poorly at the task of HR estimation as compared to the specialized HR estimation models. Furthermore, these approaches reconstruct the entire PPG signal, even if most of the signal may already be artifact-free. This may potentially distort the original signal and cause loss of morphological information even in the useful parts of the signal. Ideally, we would like to have a method that denoises only the noisy part of the signal – preserving the valuable information in the uncorrupted part – and provides a clean signal that can be used for accurate HR estimation and for other downstream tasks. That is the focus of the present work.
In this paper, we present a novel method for reconstructing clean PPG signals from noisy signals. Our method outperforms the state-of-the-art for HR estimation and generalizes across datasets better than other approaches. It preserves the useful segments of the PPG signals that are uncorrupted, and only reconstructs the corrupted sections. This is achieved by decoupling the tasks of artifact detection and removal. We apply an artifact-detection algorithm to remove artifacts from the signal, and then use a denoising autoencoder to reconstruct the signal only in the regions where artifacts were removed. The denoised signal is then used for HR estimation using band-pass filtering and peak detection. This way, our reconstructed signals are more faithful to the truth and more useful for downstream tasks.
An interesting aspect of our approach is the way it leverages publicly available data. There are two sufficiently large and complex public PPG datasets, PPG-DaLiA [Reiss et al.(2019)] and the Stanford dataset [Torres-Soto and Ashley(2020)]. PPG-DaLiA records subjects in a wide variety of settings (e.g., walking, driving, eating, cycling). It is a relatively small but high-quality dataset that contains an external means of extracting ground truth HR using electrocardiogram (ECG) signals that are simultaneously recorded and are relatively free from noise. On the other hand, the Stanford dataset is much larger, but has only PPG signals and no external way to assess ground truth HR. Deciding how to best leverage these datasets was a challenge. We chose to use PPG-DaLiA only for out-of-sample testing purposes, since it has ECG for ground truth and thus can provide an honest assessment of HR. We leverage the large collection of real-world clean PPG signals from the Stanford dataset to devise a self-supervised training methodology that is able to reconstruct realistic clean signals.

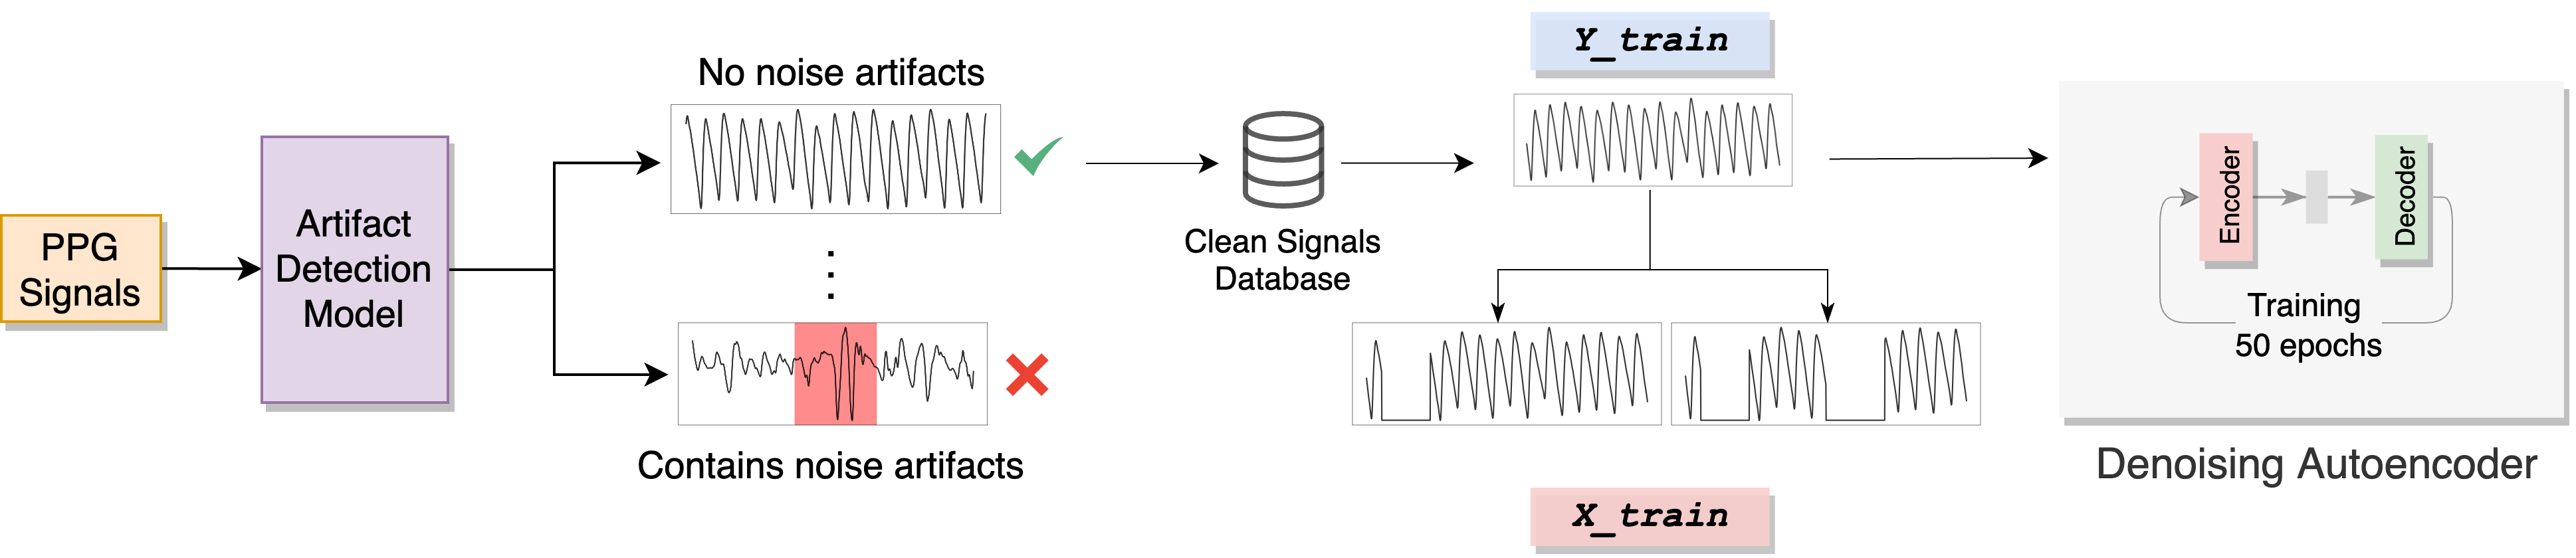
Our method is called SPEAR – Self-supervised PPG Erase Artifacts and Reconstruct – and it is a novel algorithm for denoising PPG signals. SPEAR learns to denoise PPG signals using the following novel training and evaluation paradigm, outlined in Figure 1 (1) Removal of segments with artifacts using an artifact-detection algorithm, leaving only clean signal, (2) Erasing random parts of the clean signal by setting them to zero, and (3) Training a denoising autoencoder to reconstruct these erased parts of the clean signal. The signal is reconstructed in such a way that only the locations that have been erased are reconstructed, and the rest of the signal is unchanged. In this way, given a new noisy signal for testing, our method would (1) apply the artifact-detector, (2) erase the artifacts, and (3) reconstruct the missing pieces to form a clean signal that can be used for downstream tasks. Since it has learned to reconstruct from clean PPG signals in training, it will reconstruct clean signals during testing. We estimate HR using band-pass filtering and peak detection; this type of basic method works precisely because the PPG signal is now clean.
SPEAR outperforms state-of-the-art methods at the task of heart rate estimation and generalizes well to multiple datasets. Our experiments reveal first that non-machine learning techniques based on signal processing do not tend to perform well for HR estimation in general, and that supervised deep-learning methods tend to perform well on the dataset they were trained on and not beyond that. SPEAR performs about as well on the PPG-DaLiA test set as deep learning methods trained on the same dataset, even though SPEAR is trained on the Stanford dataset. On a hold-out test set from the Stanford dataset, our method outperforms all other methods, substantially outperforming deep learning approaches trained on PPG-DaLiA. Most importantly, the fact that SPEAR produces clean PPG signals allows the results to be used for downstream tasks beyond heart rate estimation. We also investigate heart rate variability (HRV) estimation as a downstream task here, showing that HRV estimation is significantly improved using our denoised PPG signals.
2 Related Works
Artifact Reduction Techniques. Signal processing methods have been used to reduce artifacts in PPG signals. Specifically, discrete wavelet transforms [Kasambe and Rathod(2015)], adaptive filtering [Wu et al.(2017), Comtois et al.(2007), Pan et al.(2016)] and independent component analysis (ICA) [Peng et al.(2014)] have been used to perform signal denoising. Salehizadeh et al. [Salehizadeh et al.(2016)] perform sliding window-based signal reconstruction using spectral filtering. A limitation of signal processing approaches is that their performance is dependent on heuristic thresholds and parameters. Reiss et al. [Reiss et al.(2019)] demonstrate that state-of-the-art signal processing techniques perform poorly on a larger and more comprehensive dataset (PPG DaLiA [Reiss et al.(2019)]) compared to the (very small) IEEE dataset [Zhang et al.(2015)] that they have been tested on.
Recent works have also introduced deep learning based approaches for this problem. Lee et al. [Lee et al.(2019)] use a bidirectional recurrent autoencoder for PPG denoising trained on handpicked clean PPG signals. DeepHeart [Chang et al.(2021)] uses a denoising convolutional network followed by spectrum analysis-based calibration to perform HR estimation. In this approach, signal reconstruction is performed for small overlapping time windows; as a result, the reconstructed clean signals cannot easily be joined together to get a continuous long signal. The survey paper by Mishra et al. [Mishra and Nirala(2020)] provides a comprehensive review of the literature on PPG denoising techniques.
A challenge with denoising is the availability of noisy-clean signal pairs in the data, which is required for supervised learning. This is hard to obtain with PPG signals because it is not possible to record clean and noisy signals synchronously while performing certain activities. Workarounds are typically used to overcome this challenge, such as generating fake noisy signals by adding simulated noise to clean signals [Lee et al.(2019)]. We will discuss how we overcome this challenge using self-supervised learning in Section 3. In section 5, we demonstrate our method’s superior performance to the training approach of simulating PPG signals [Lee et al.(2019)].
Direct Heart Rate Estimation Without Denoising. A category of approaches focus on the task of estimating heart rate (HR) directly from noisy PPG signals, without attempting to reconstruct or denoise the signal. Signal processing techniques including Wiener Filtering [Temko(2017)], Least-Means Square Adaptive Filtering [Schäck et al.(2015)] and TROIKA [Zhang et al.(2015)] utilize accelerometer data and analyze the signals in the frequency domain. Deep learning has also been utilized for HR estimation, most commonly as a supervised learning task where ground-truth HR labels are obtained from synchronous Electrocardiogram (ECG) signals. DeepPPG [Reiss et al.(2019)] and PPGnet [Shyam et al.(2019)] use deep convolutional networks to predict heart rate from noisy PPG signals. CorNET [Biswas et al.(2019)] uses a combination of CNNs and LSTMs to predict HR from single-channel PPG in patient-specific models. PP-Net [Panwar et al.(2020)] also uses CNNs and LSTMs for HR estimation using single-channel PPG. These approaches tend to outperform the denoising approaches for HR estimation, but do not output a denoised signal that can be utilized in downstream analysis.
Heart Rate Variability (HRV) Estimation from PPG. HRV measures the fluctuation in the time intervals between adjacent heartbeats [Shaffer and Ginsberg(2017)]. HRV is used to investigate the sympathetic and parasympathetic function of the autonomic nervous system [Shaffer and Ginsberg(2017)] and has many important applications including predicting risk of stroke [Tsuji et al.(1996)], detecting arrhythmia [Tsipouras and Fotiadis(2004)] and guiding training for athletes [Singh et al.(2018)]. Studies that use PPG signals to estimate HRV focus only on clean signals obtained from subjects at rest [Lu et al.(2008)]. A recent study showed poor performance of HRV estimation from PPG signals under free-living conditions [Lam et al.(2020)]. Denoising PPG signals can improve the accuracy of HRV monitoring in real-world conditions, as we will show.
Artifact Detection Techniques. A separate body of work aims to locate the presence of noise artifacts in PPG signals [Chong et al.(2014), Goh et al.(2020), Guo et al.(2021)]. One approach [Goh et al.(2020)] divides the signal into sliding windows and uses CNNs to classify whether each window contains an artifact. Another work [Guo et al.(2021)] approaches this problem as a 1D segmentation problem and uses a convolutional network to classify each location within a 30-second signal segment as to whether it represents an artifact. This allows for detection of noise artifacts on a higher resolution. These approaches only detect the locations of noise artifacts and do not provide further steps on mitigating the artifacts for HR analysis. We utilize the Segade model [Guo et al.(2021)] as a preprocessing step in SPEAR.
Denoising Autoencoders. Autoencoders are networks that learn to reconstruct their inputs from a latent representation. An autoencoder takes as input a vector and maps it to a hidden latent representation . The resulting latent representation is then mapped back to a “reconstructed” vector . The model is trained to minimize the reconstruction error between and . A denoising autoencoder is trained to reconstruct a clean input from a corrupted or partially destroyed one [Vincent et al.(2008)]. For training, the input vector is first partially corrupted, which yields a mapping , where is the vector resulting after corrupting . After obtaining the mappings, an autoencoder network is trained to reconstruct a vector given as input, such that it minimizes the reconstruction error between and . It is not immediately clear how one would apply a denoising autoencoder to denoise PPG signals from unlabeled data; the novelty of our approach is a framework that incorporates it.
3 Method
We propose a self-supervised training approach that requires only a sufficiently large collection of clean PPG signals, and does not require synchronous ECG measurements like other approaches [Chang et al.(2021), Shyam et al.(2019), Panwar et al.(2020), Biswas et al.(2019), Reiss et al.(2019)]. Using a self-supervised training approach solves the challenge of unavailable noisy-clean training pairs required for supervised learning. This is because the model is trained to reconstruct clean signals from signals where the noise has been erased – it requires no information about the noise artifacts except for where they are located.
3.1 Training Process for SPEAR.
In this subsection, we outline the methodology of training SPEAR’s specialized denoising autoencoder. Figure 3 summarizes the training procedure. The process for denoising a new signal will be discussed afterwards and in Figure 3.
Data.
The Stanford training set was used for training the reconstruction model because it contains a large number of clean PPG signals. The Stanford test set and PPG DaLiA test sets were used for evaluating the model. The PPG DaLiA test set was used, instead of testing on the complete PPG DaLiA dataset, to ensure fair comparison with the baseline methods that were trained on the PPG DaLiA training set.
Selecting Clean PPG Signals.
The first step to prepare the training data is selecting clean PPG signals. The Segade model [Guo et al.(2021)] was used for this purpose. Given a 30-second PPG signal as input, Segade predicts the regions within the signal that are corrupted by noise artifacts. Any signal that was determined to have no corrupted regions was deemed as a clean signal.
Preparing Training Data.
In the next step, a denoising autoencoder (DAEs) [Vincent et al.(2008)] is given a partially corrupted signal as input and trained to recover the original signal. Training a DAE requires element-wise pairs of signals where is a partially corrupted or destroyed version of . To prepare the training dataset, each clean PPG signal was partially erased at one or more continuous sub-segments. More precisely, we create mask vectors of the same dimension as : has the value 1 everywhere except one or more continuous patches, where it is 0. We start with (vector of all 1’s). A starting point and a patch length were randomly selected and the values were set to 0. The patch lengths were varied between 1 and 15 seconds, and the number of patches in a mask was set to either 1 or 2. For each signal, 10 such masks were generated, each yielding a new training sample , where is the clean signal, and is the element-wise (Hadamard) product.
Model Architecture and Training Parameters.
The denoising autoencoder consists of an encoder network that maps the input signal to its latent space, and a decoder network that reconstructs the clean signal from the latent space input. The encoder network consists of 4 convolutional layers, each followed by a ReLU activation and batch normalization. The decoder network consists of 4 Transpose Convolution-ReLU-BatchNormalization blocks. The fourth block is followed by a convolutional layer with a sigmoid activation that outputs the reconstructed signal. The encoder receives input in the dimension , where is the number of 30-second signals sampled at 64Hz. Details on the exact model architecture are provided in the supplementary material.
Loss was computed as the Root Mean Square Error (RMSE) between the original clean and the reconstructed signals. The model was optimized using the Adam optimizer [Kingma and Ba(2014)], trained over 50 epochs.
3.2 Using SPEAR to Denoise PPG Signals.
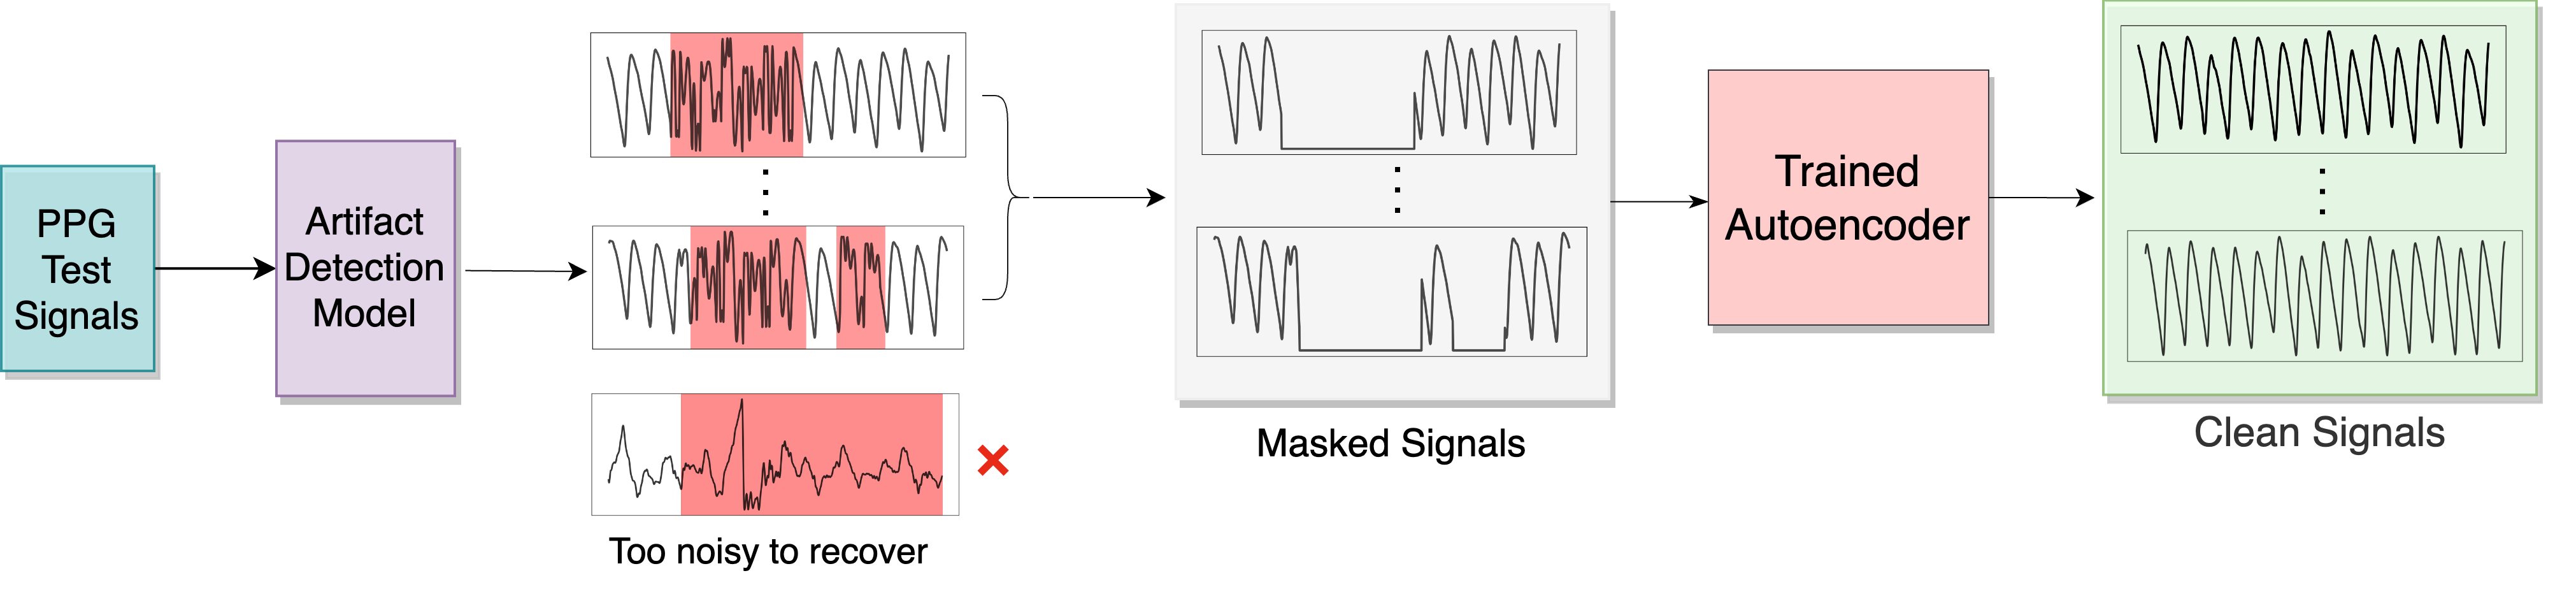
In Section 3.1, we discussed the denoising autoencoder used in our algorithm. In this section, we provide an end-to-end framework for denoising PPG signals and estimating HR using SPEAR. This process is illustrated in Figure 3.
Step 1: Artifact Detection.
The first step in the signal denoising algorithm is to locate the noise artifacts. The Segade model is again used for this purpose. Similar to the preprocessing defined in Section 3.1, first the signals are fitted to 30 second segments sampled at 64 Hz. The signals are normalized to the range using min-max normalization. The Segade model receives these signal segments as input and outputs predictions for the noise artifact locations. A threshold of 0.5 is applied to determine the binary classification labels.
Signals that are excessively corrupted beyond recovery are discarded. We consider a threshold of cumulative duration, beyond which a 30-second signal is considered unrecoverable. Intuitively, it is reasonable to assume that it may be futile to recover a 30-second signal where 27 seconds are corrupted by noise artifacts, since too much of the information is lost to noise.
Step 2: Signal Reconstruction.
The remaining signal is used as input for the denoising autoencoder model. The locations where Segade output has a classification label of 1 (indicating the presence of a noise artifact) are erased in the signal (set to 0). Let be the signals obtained after discarding the excessively corrupted signals in the previous step. Similarly define as the binary classification of noise artifacts by Segade corresponding to . Then the input to the denoising autoencoder can be obtained as:
Here, is a matrix comprising of 1 at all positions. The denoising autoencoder receives as input the matrix , and outputs which consists of clean PPG signals. Intuitively, since the denoising autoencoder was trained to recover clean signals from partially corrupted ones, consists of clean PPG signals.
Step 3: Post-Processing and Heart Rate Detection.
The final step is to post-process the clean signals in . First, the denoised signal is merged with the original signal , in that the artifact-corrupted regions of are replaced with the reconstructed regions in . This can be obtained as:
where is the binary classification by Segade and contains 1’s in the noise-corrupted regions and 0 otherwise. After this, can be utilized for downstream analysis tasks.
To perform HR estimation, a bandpass filter with low-end cutoff of 0.9 Hz and a high-end cutoff of 5 Hz is applied, and the signal is re-normalized to the range using min-max normalization. Since the resulting signal is clean, a simple peak-detection algorithm can be applied to perform HR estimation. We use the peak-detection algorithm by [Elgendi et al.(2013)] which is implemented in the HeartPy python package [van Gent et al.(2018)].
4 Experimental Setup
In this section, we describe the datasets, baselines, experimental setup and evaluation metrics for heart rate estimation.
4.1 Datasets
Two datasets were used in this study: the Stanford Dataset [Torres-Soto and Ashley(2020)] and PPG DaLiA Dataset [Reiss et al.(2019)]; both datasets consist of PPG recordings collected from a wrist-worn device sampled at 64Hz. Table 1 compares the main properties of these two datasets. The Stanford dataset was selected because it contains the largest publicly available collections of PPG signals from wrist-worn wearables. PPG DaLiA was used to train baselines because it contains synchronously recorded ECG and accelerometer data, which are required by most existing methods for HR estimation.
The Stanford dataset is divided into training, validation and test sets with no subject overlap. The training set was used for training the denoising autoencoder. The validation set was used for hyperparameter tuning. The test set was used for testing the performance of SPEAR in comparison with baselines. The PPG DaLiA dataset [Reiss et al.(2019)] was used for out-of-sample testing and comparison against baselines. PPG DaLiA was selected because it has a comprehensive data collection protocol from subjects of different ages while performing a variety of daily activities such as walking, cycling, driving and working on a laptop, among others.
| Property | PPG DaLiA | Stanford |
|---|---|---|
| PPG | Available | Available |
| ECG | Available | Unavailable |
| Accelerometer | Available | Unavailable |
| No. of subjects | 15 | 149 |
| No. of train samples (clean) | k (233) | 62k (7.4k) |
| No. of test samples | 872 | 6.7k |
4.2 Baselines
In this section, we introduce the 6 state-of-the-art baseline methods that were used for comparison. Baselines 1 and 2 use signal processing techniques and were chosen as they achieved the best performance on the IEEE Signal Processing Cup data [Zhang et al.(2015)]. Baselines 3-6 use deep learning for HR estimation without denoising; the models are based on the works of [Panwar et al.(2020), Reiss et al.(2019), Biswas et al.(2019), Shyam et al.(2019)]. Although none of these studies have publicly available code, these approaches were chosen for their performance and ease of implementation. Implementations for other baselines [Chang et al.(2021), Zhang et al.(2015), Lee et al.(2019), Peng et al.(2014), Wu et al.(2017), Comtois et al.(2007), Salehizadeh et al.(2016)] are not publicly available and not reproducible.
-
•
Baseline 1: Wiener Filtering and Phase Vocoder (WFPV). This baseline is based on [Temko(2017)]. It uses the three-axis accelerometer signals to estimate the noise signature and applies a Wiener filter to attenuate noise components in the frequency domain. A Phase Vocoder is used to estimate HR.
-
•
Baseline 2: Kalman Filtering. This baseline is based on [Galli et al.(2018)] and is a signal processing technique that produces a reconstructed PPG signal over small time windows. It performs signal decomposition over PPG and three-axis accelerometer signals and performs clean PPG reconstruction based instead on the degree of correlation of PPG with accelerometer signals. Kalman smoothing is used for HR estimation from the reconstructed signal.
-
•
Baseline 3: CNN_HR_DaLiA. This baseline model uses supervised learning to estimate HR directly from sliding time windows over a noisy PPG signal. Our version of this baseline was based on DeepPPG [Reiss et al.(2019)] and PPGNet [Shyam et al.(2019)]. The single-channel PPG signals in PPG DaLiA dataset were used for training and HR ground-truth labels were obtained from the synchronously recorded ECG.
-
•
Baseline 4: CNN+LSTM_HR_DaLiA. This baseline follows the same approach of direct HR estimation on sliding windows as Baseline 3. Our version of this baseline is based on the PP-Net [Panwar et al.(2020)] and CorNET [Biswas et al.(2019)] models. It is trained using the same procedure as Baseline 3; the only difference is in the model architecture. This model uses a combination of convolutional and Long-Short-Term-Memory (LSTM) layers.
-
•
Baseline 5: CNN_HR_Stanford. This model is architecturally identical to Baseline 3, but was trained on the Stanford training set. Since the Stanford dataset includes a significantly larger collection of signals, it was important to establish comparisons with baselines trained on similar data as SPEAR. However, since the Stanford dataset does not contain ECG signals for ground-truth labels, the technique of clean signal selection and simulated corruption to generate noisy-clean training pairs was used. Clean signals were selected using the technique defined in Section 3.1 and simulated noise artifacts were added using the RRest toolbox [Charlton(2022)]: a combination of Frequency Modulation (FM) and Baseline Wander (BW) were added to clean signals, while ensuring that no more than 75% of the signal is corrupted, to match the maximum degree of corruption expected by SPEAR. HR labels were generated on the clean PPG pairs using [Elgendi et al.(2013)]’s technique.
-
•
Baseline 6: CNN+LSTM_HR_Stanford. This model is trained on the Stanford training set using the procedure as Baseline 5. The model uses a combination of convolutional and LSTM layers and has an identical architecture to Baseline 4.
-
•
Baseline 7: DAE_SimNoise. This is a denoising model based on the training approach of [Lee et al.(2019)]. To train this model, noisy-clean pairs of PPG signals were generated by selecting clean PPG signal segments of duration 30 seconds and adding simulated noise. The noise simulation procedure was similar to Baselines 5-6, where a combination of FM and BW noise were added, while ensuring total corruption is under 75%. A training dataset was generated from the Stanford data such that the number of samples were roughly equal to SPEAR’s training set. A denoising autoencoder with an identical architecture to SPEAR was trained to denoise the signals.
| Method | Training Dataset | PPG DaLiA MAE | Stanford MAE | |
|---|---|---|---|---|
| Baseline 1 | WFPV | - | 21.07 | - |
| Baseline 2 | Kalman Filtering | - | 20.20 | - |
| Baseline 3 | CNN_HR_DaLiA | PPG DaLiA | 6.60 | 11.39 |
| Baseline 4 | CNN+LSTM_HR_DaLiA | PPG DaLiA | 4.17 | 7.24 |
| Baseline 5 | CNN_HR_Stanford | Stanford | 12.97 | 5.26 |
| Baseline 6 | CNN+LSTM_HR_Stanford | Stanford | 9.03 | 4.06 |
| Baseline 7 | DAE_SimNoise | Stanford | 8.44 | 5.93 |
| Our Algorithm | SPEAR | Stanford | 5.36 | 3.18 |
4.3 HR Estimation Experiments Setup
-
1.
PPG DaLiA Experiment: The PPG DaLiA dataset was divided into a training and test set. The test set contains signals from subjects 1, 14 and 15. The signals were first split into non-overlapping 30-second segments. Segments that were more than 75% corrupted are discarded (same as our method). The corresponding ECG as well as the three accelerometer signals were similarly segmented. The accepted signals were joined into one longer signal and used for testing the baselines. For Baselines 1 and 2, the continuous subject-wise signals were used as input. For Baselines 3-6, the signals were segmented into 8-second overlapping windows (with an overlap of 6 seconds). Heart Rate estimation was performed on the PPG signals using the ECG for ground-truth labels.
-
2.
Stanford Dataset Experiment: The Stanford test set was used for this experiment. Since this dataset does not contain ECG for ground truth measurement, we utilized the clean signals as the source of ground truth. We introduce simulated noise in the clean signals similar to the training procedure defined for Baseline 5 using the RRest package [Charlton(2022)]. This produced clean-noisy signal pairs. Ground-truth HR was computed on the clean signal using a peak detection algorithm [Elgendi et al.(2013)]. Baselines 1 and 2 could not be evaluated on this dataset since they require 3-axis accelerometer data as input, which is not available in the Stanford data.
4.4 Heart Rate Variability (HRV) Estimation
In this experiment, we estimated Heart Rate Variability (HRV) from PPG signals. The goal of this experiment was to evaluate whether denoised signals produced by SPEAR can be utilized for downstream tasks and provide improvements over existing methods. Several metrics are used to measure HRV. In our experiments, we focus on two metrics: SDNN is the standard deviation of the inter-beat intervals measured in milliseconds (ms), and RMSSD is the root mean square of the successive differences between normal heartbeats measured in ms [Shaffer and Ginsberg(2017)]. A review of HRV-capable wearable devices shows that RMSSD and SDNN are the two metrics that are most commonly available on such devices [Hinde et al.(2021)]. SDNN is generally studied in clinical settings, considered to be the ”gold standard” metric for assessing cardiac risk, and used for predicting morbidity and mortality [Shaffer and Ginsberg(2017)].
HRV requires continuous measurement over long time duration; typically, a time window of 5 minutes is used for short-duration estimation [Shaffer and Ginsberg(2017)]. The full PPG DaLiA dataset was used for evaluation. The signals were segmented into sliding windows of duration 5 minutes and an overlap of 95%. The two HRV metrics (SDNN and RMSSD) were computed from PPG signals and synchronously recorded ECG (for ground-truth). Mean absolute error was computed between HRV estimates from PPG and HRV ground truth from the corresponding ECG.
There is a dearth of literature on directly estimating HRV from PPG, and existing denoising approaches [Galli et al.(2018), Chang et al.(2021), Wu et al.(2017), Kasambe and Rathod(2015)] do not directly work for our HRV estimation task. This is because they perform denoising on short, overlapping (8-second) signal segments for heart rate estimation; they don’t offer methods on reconstructing longer signals that can be used for HRV. Consequently, the baselines used for HR estimation could not be adapted for the HRV task, except baseline 7. SPEAR, as well as baseline 7, reconstruct non-overlapping 30-second signals that can be combined into continuous long-term recordings using interpolation. Thus, existing approaches based on simple peak detection can be applied for HRV estimation. For comparison, we perform HRV estimation on four variants of the PPG signals: the original signal from the dataset, the signal after applying bandpass filtering, the denoised signal from DAE_SimNoise (baseline 7) and the denoised signal from SPEAR.
To estimate HRV from PPG, we adapt the widely used methods of [Bartels et al.(2017), Morelli et al.(2018)]. First, a peak detection algorithm [Elgendi et al.(2013)] detects the R-peaks. Then, a moving filter is applied to remove physiologically implausible peaks. The filtering criterion differs over studies [Bartels et al.(2017), Morelli et al.(2018)]; we used a filter based on Inter-Quartile Range, which rejects R-R intervals that lie outside of the IQR of measured interval durations. The HRV metrics (SDNN and RMSSD) were computed using their respective formulae based on R-R intervals. The implementation for these approaches are available in the HeartPy library [van Gent et al.(2018)].
4.5 Evaluation Metrics.
The Mean Absolute Error (MAE) is a widely used metric in HR estimation challenges. HR is estimated on signals segmented into sliding time windows of length 8 seconds and an overlap of 6 seconds. When the signals are split into overlapping windows, we let be the HR estimated from the PPG windows. For reconstruction techniques, this is estimated from the denoised signal. Similarly, let be the HR estimated from the ground-truth windows. Then the mean absolute error is:
For Heart Rate Variability, the same approach is used, but the HRV metrics are computed over a 5 minute interval, based on the recommended time interval used for HRV [Shaffer and Ginsberg(2017)]. The MAE is computed on the two HRV metrics, SDNN and RMSSD, using the ECG segments as ground-truth.
5 Experimental Results
5.1 Heart Rate Estimation Results.
Our main result is that the proposed algorithm outperforms the baselines at the task of HR estimation from PPG signals. The results are summarized in Table 2. In the Stanford experiment, SPEAR outperforms all baselines and achieves the lowest MAE. In the PPG DaLiA experiment, our algorithm has a lower MAE than every baseline except the CNN+LSTM_HR_DaLiA model (which was itself trained on PPG-DaLiA), though the difference in MAE is not big. This shows that SPEAR’s out-of-distribution performance is on par with fully supervised approaches trained on the same distribution.
The deep learning-based HR estimation models (Baselines 3-6) perform better than the signal processing approaches. Furthermore, the models using an architecture utilizing convolutional along with recurrent networks (LSTMs) outperform the purely convolutional networks. That being said, these approaches do a worse job of generalizing to different datasets. The CNN+LSTM_HR_DaLiA baseline (trained on the PPG DaLiA training data) performs very well on the PPG DaLiA test set, but does a worse job on the Stanford test data. The CNN+LSTM_HR_Stanford baseline (trained on the Stanford training data) has good performance on the Stanford test data, but significantly poorer performance on the PPG DaLiA dataset. In contrast, our approach generalizes well to multiple datasets and has superior performance on both datasets. It is also evident that approaches trained on PPG containing simulated noise (baselines 5-7) achieve poorer performance on out-of-distribution data in comparison to SPEAR. This shows that our self-supervised technique of erasing noise artifacts, instead of simulating them, generalizes better to signals that contain noise artifacts under real-world conditions.
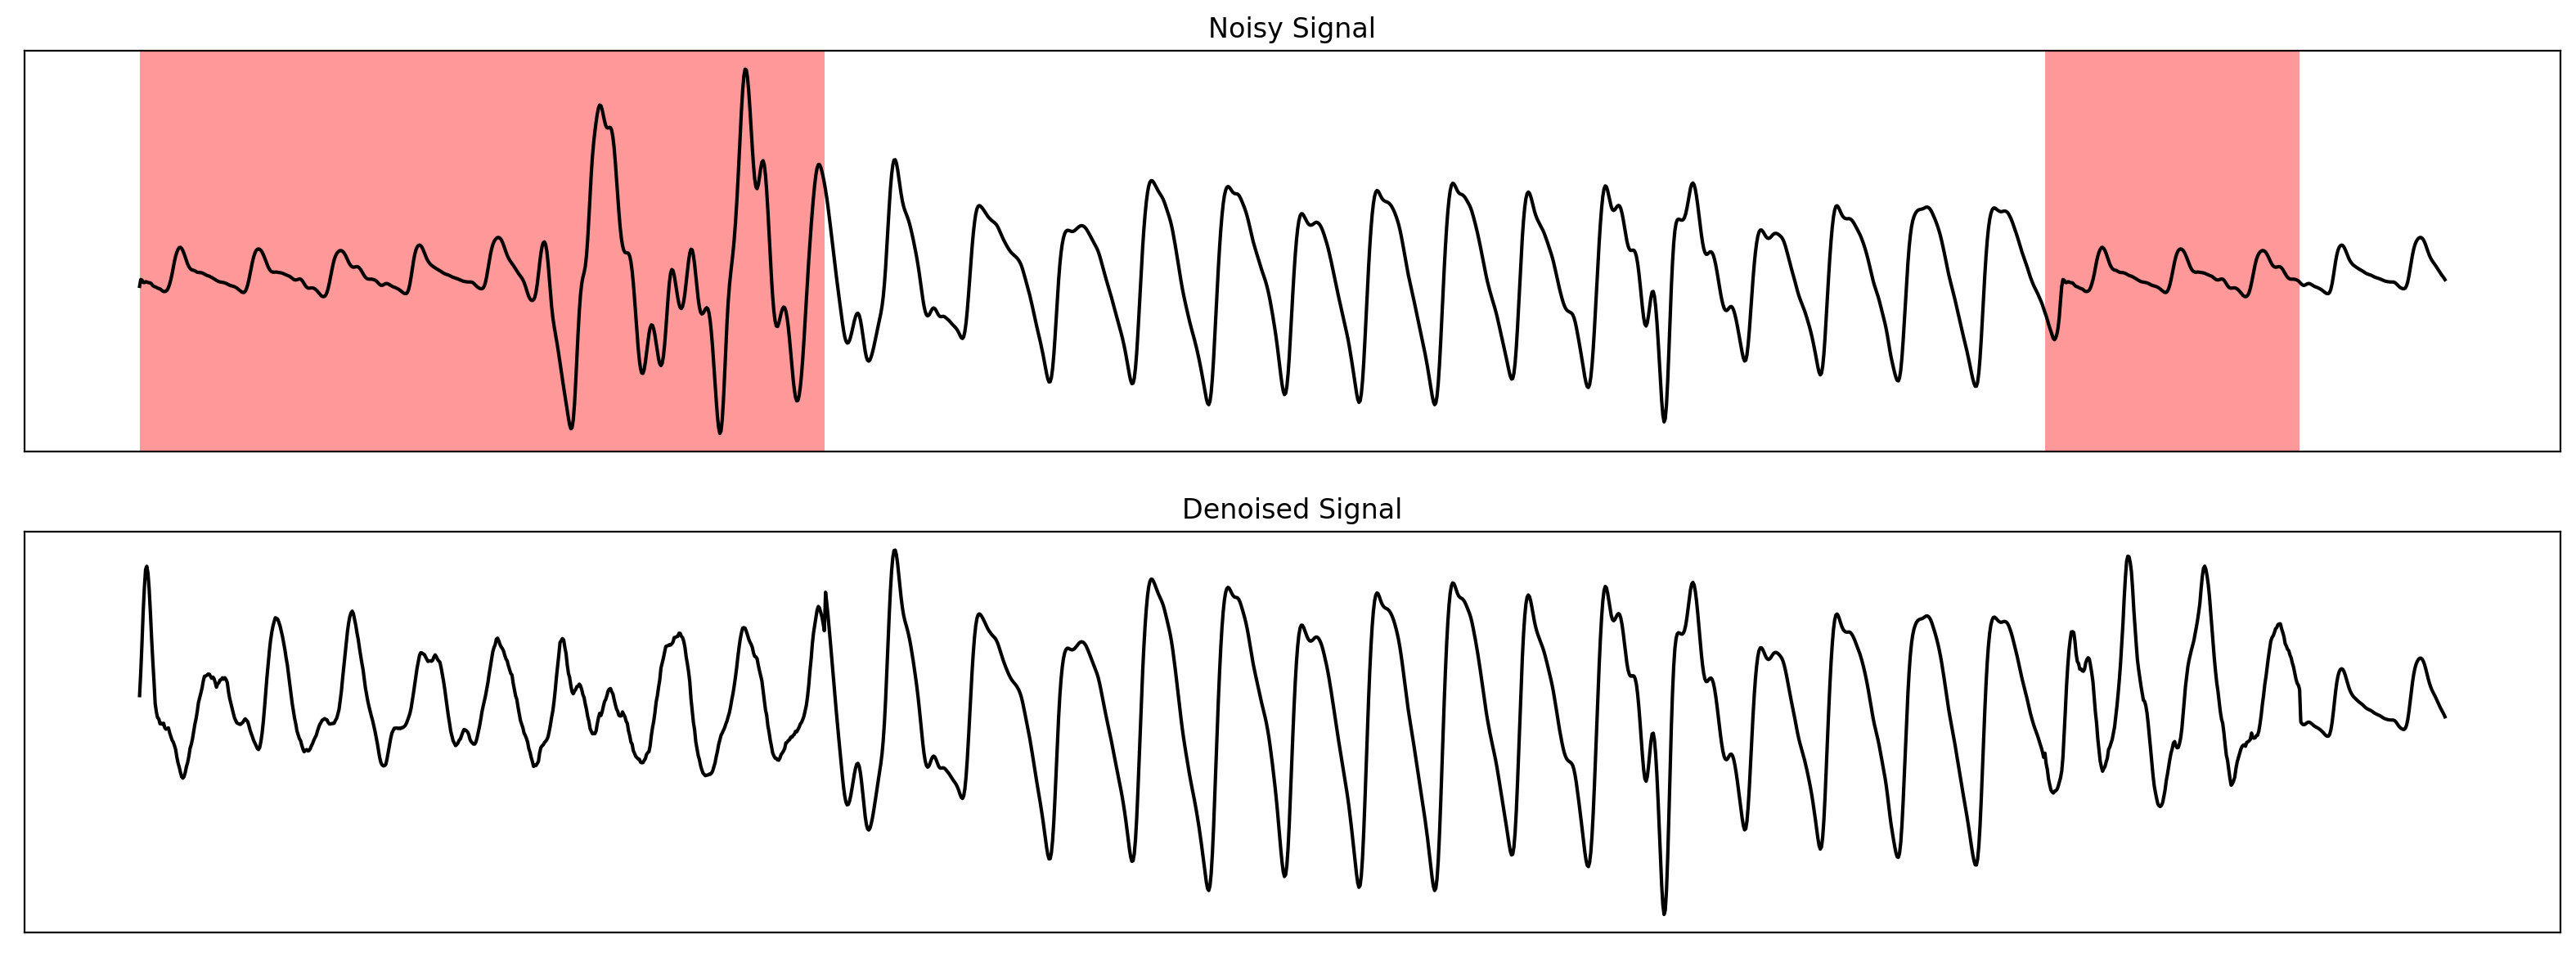
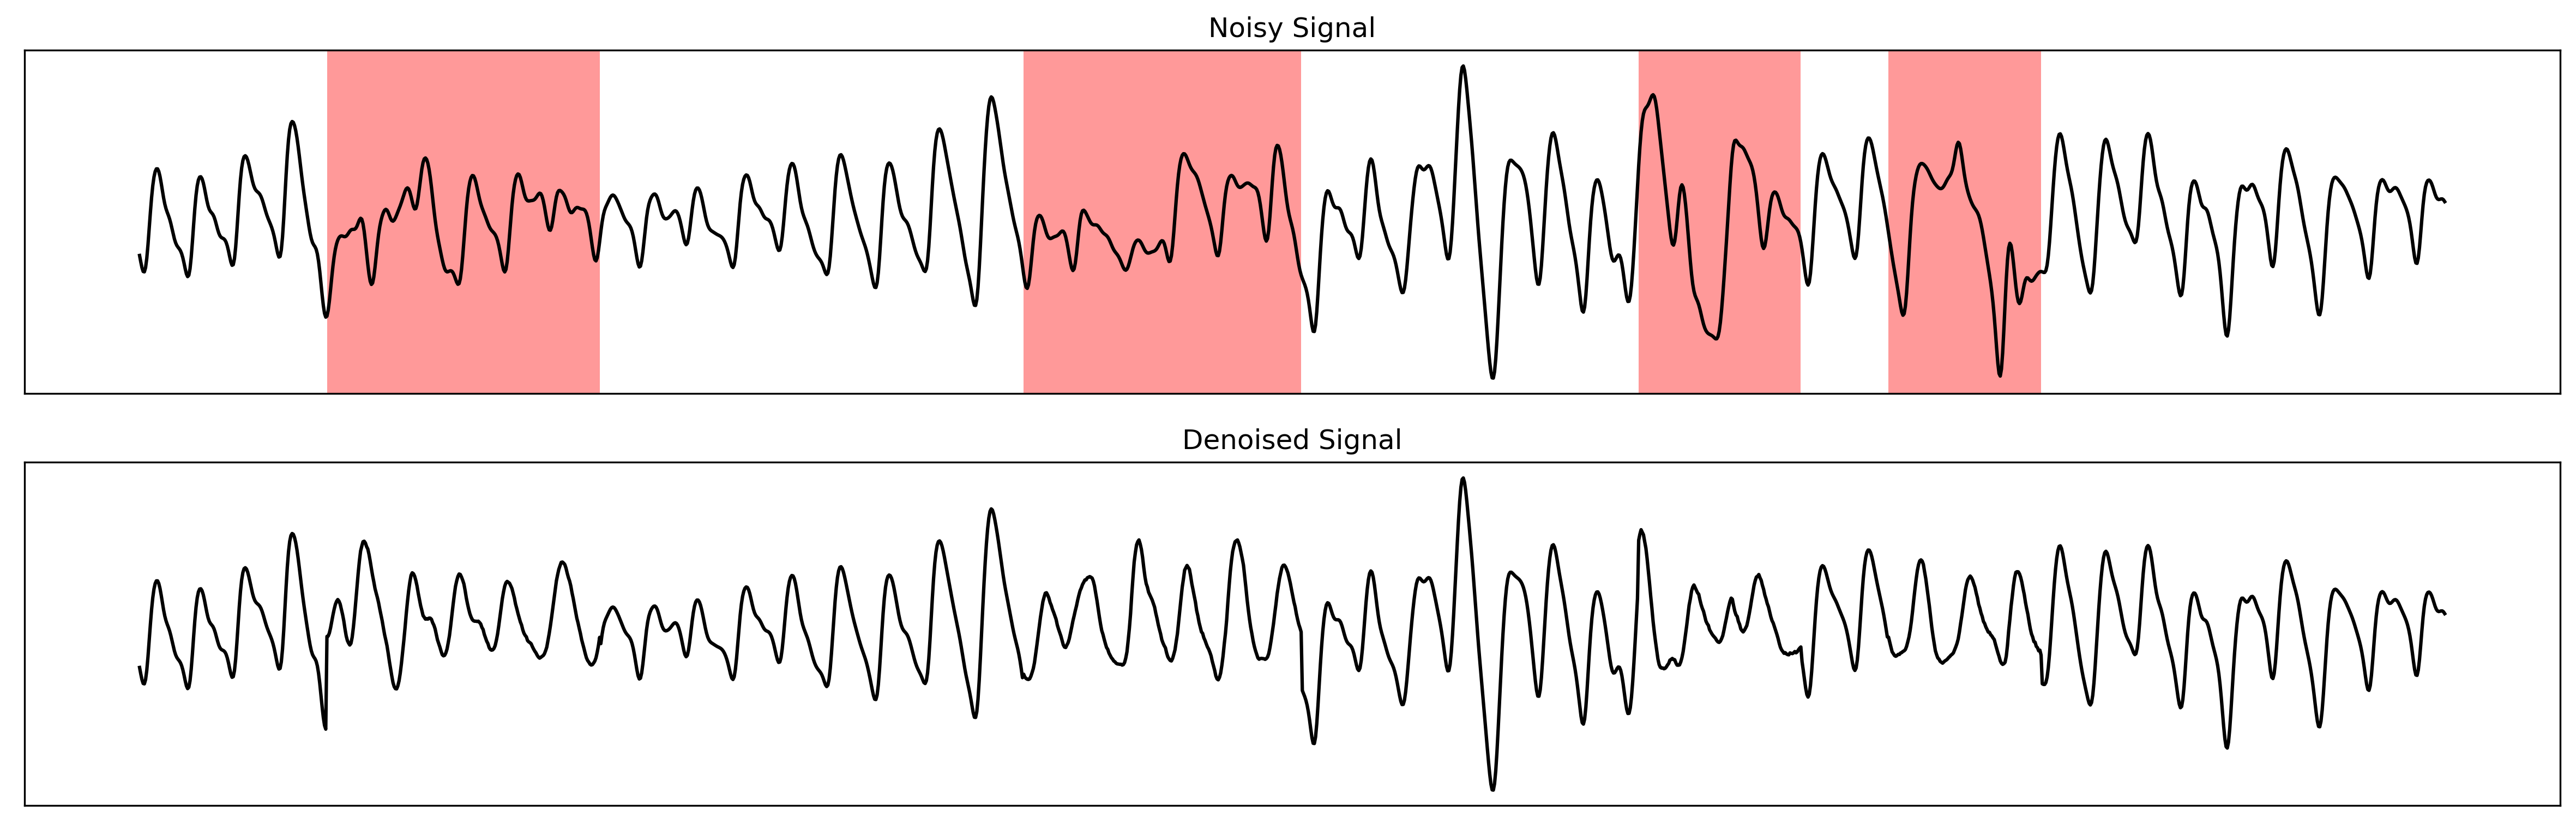
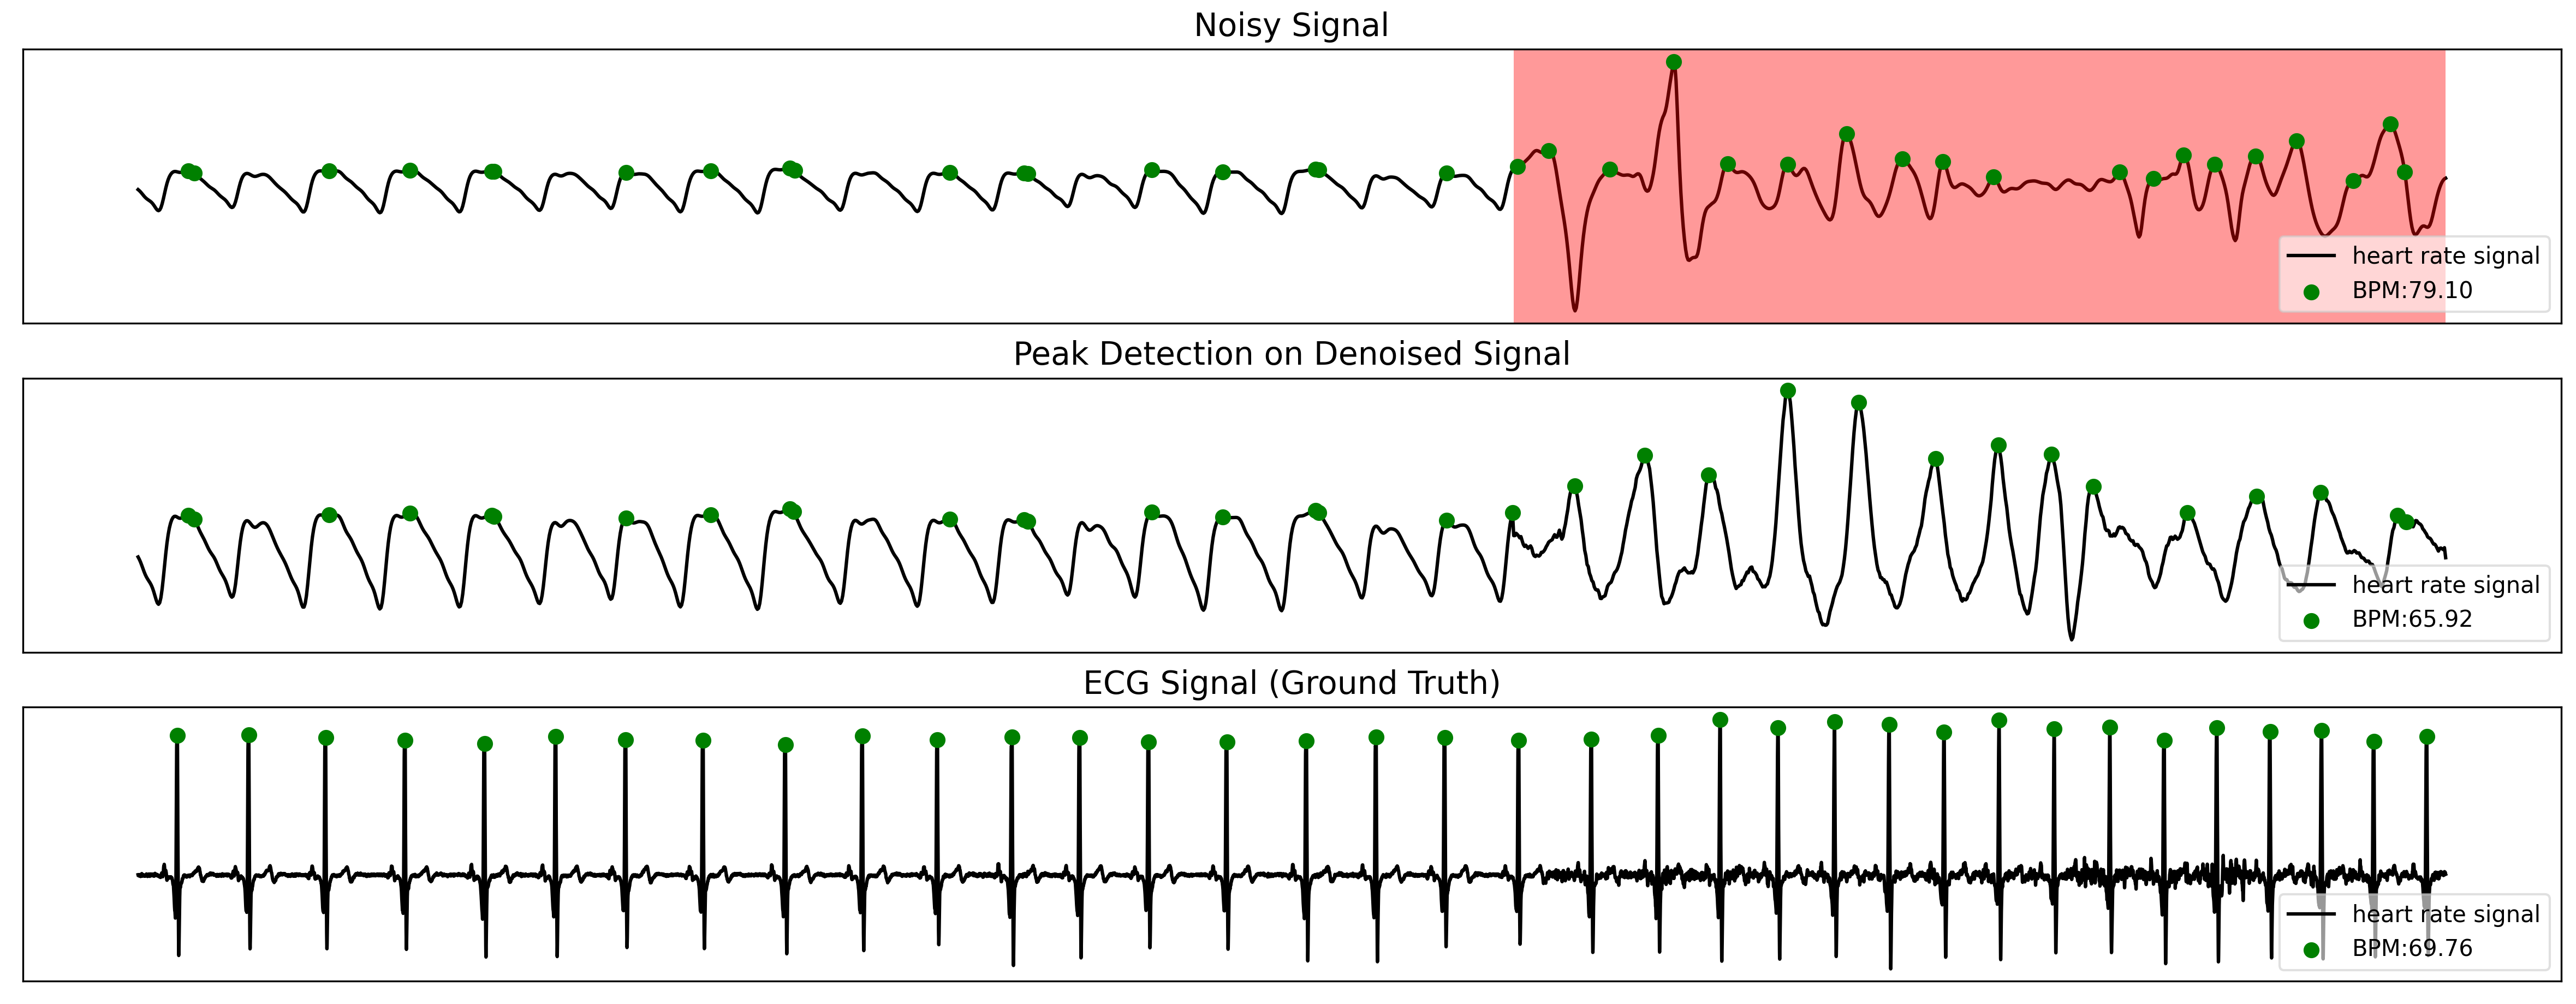
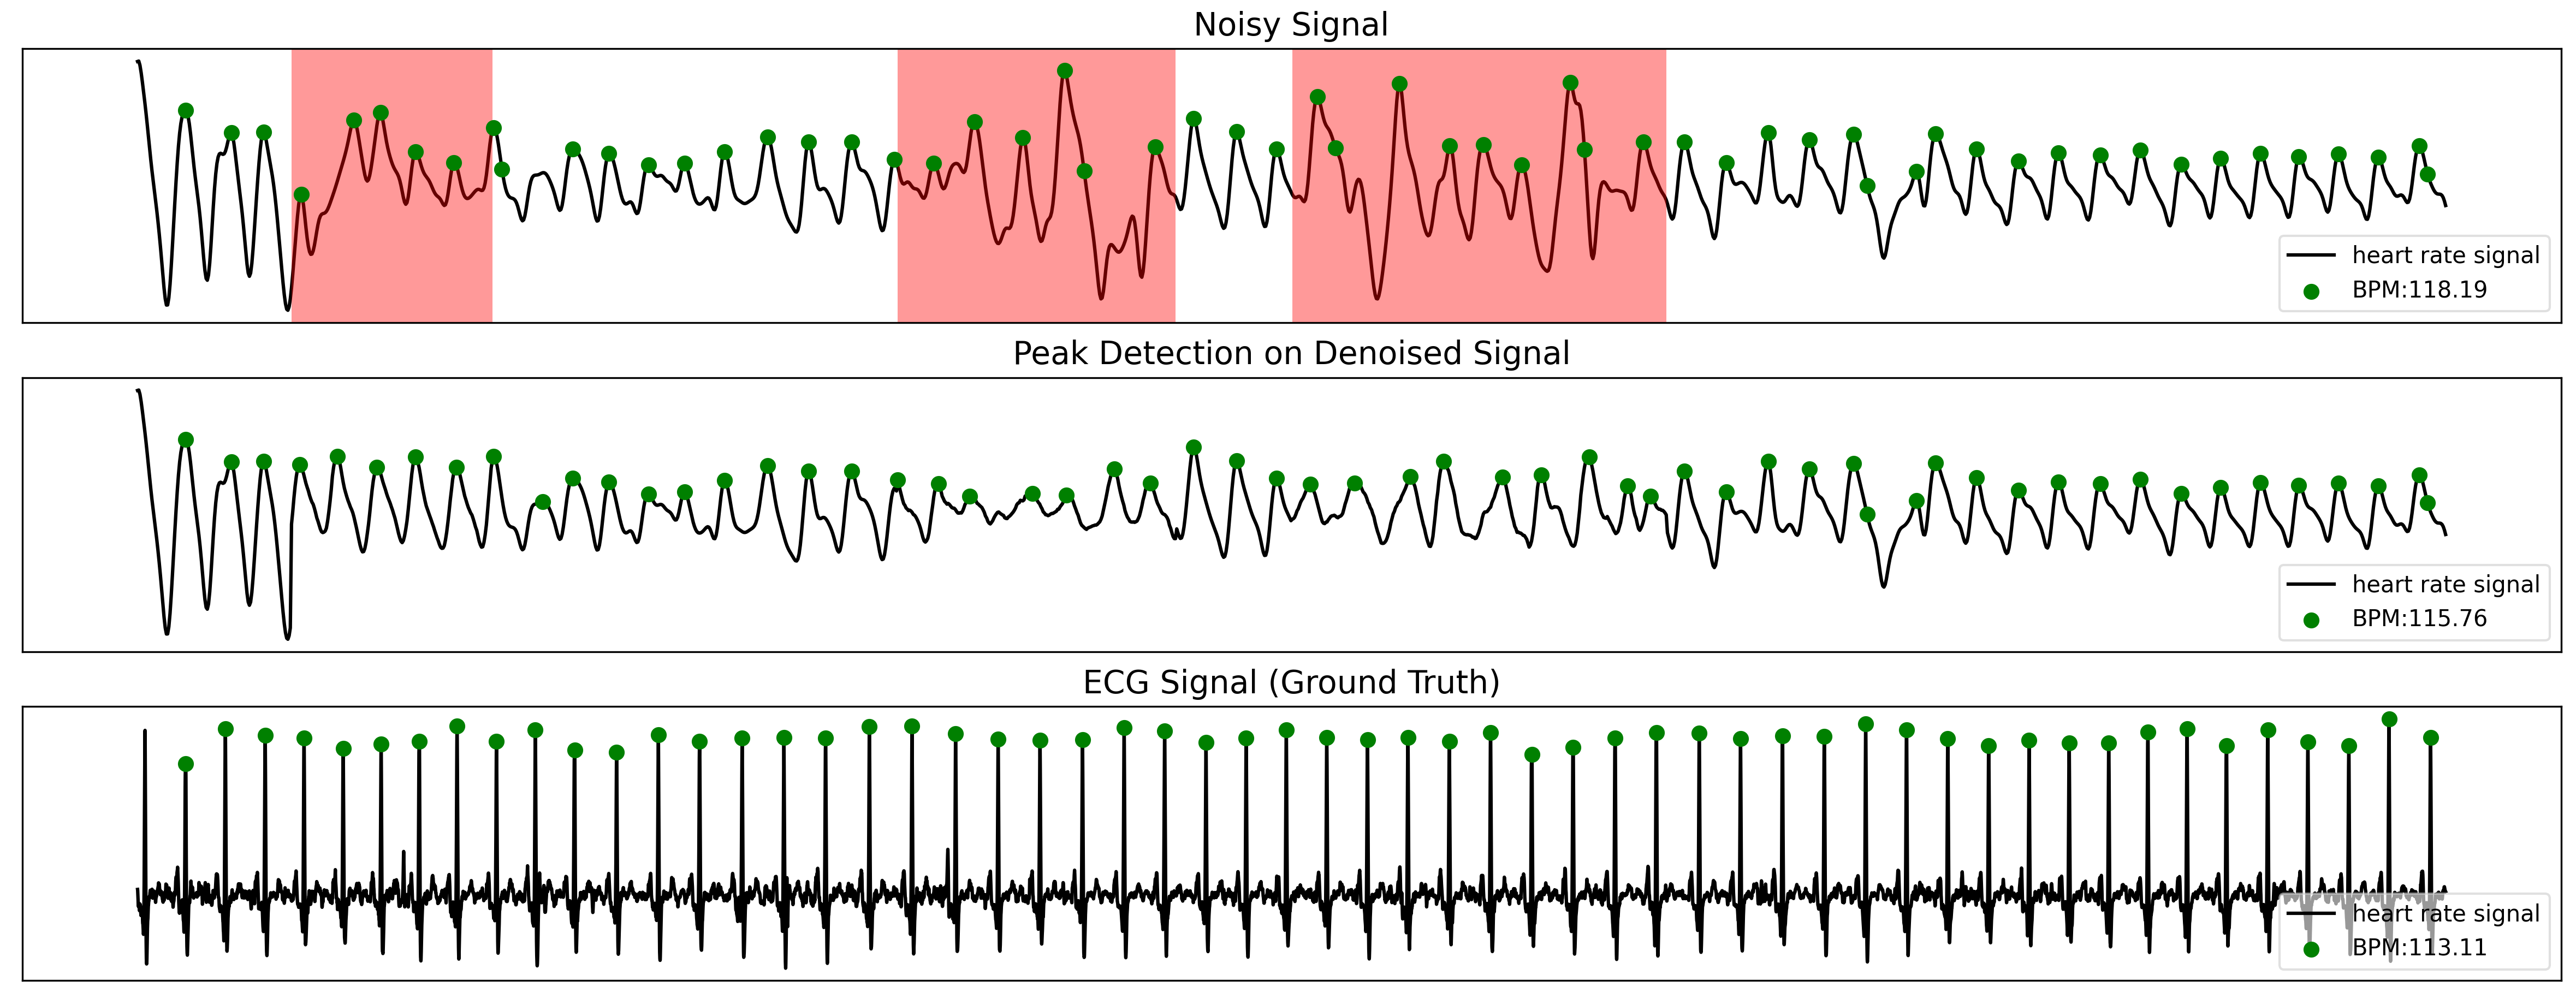
Figures 4 and 5 show examples of denoised signals produced by SPEAR. Figure 6 shows two examples from the PPG DaLiA dataset, along with a visualization of peak detection on the noisy and denoised signals. The figure demonstrates denoising under different conditions — in the first signal, the subject has a normal heart rate, but introduced some motion artifacts, while in the second, the subject has elevated heart rate.
5.2 HRV Estimation Results.
The main result from this experiment is that SPEAR’s denoised signals achieve significant improvements in Heart Rate Variability estimation tasks over existing techniques. Table 3 shows the mean absolute error in HRV estimation from PPG signals in our experiment. HRV is measured from the inter-beat time intervals in milliseconds; as a result, HRV is highly sensitive to noise because artifacts can cause missed or extra beats, which leads to large errors in the interval measurements. Our results confirm that existing techniques of estimating HRV from PPG signals [Bartels et al.(2017), Morelli et al.(2018)] produce large errors compared to the ground-truth. Denoising the signals achieves improved estimates over the original and bandpass filtered signals, as seen on both SPEAR and the baseline DAE_SimNoise. That being said, SPEAR achieves the lowest error in both HRV metrics out of all the comparison signals. For SDNN, SPEAR achieves an improvement of approximately 60% over the original signal and 20% over the denoised signal of DAE_SimNoise. For RMSSD, SPEAR achieves an improvement of approximately 63% over the original signal and 32% over the denoised signal of DAE_SimNoise. This demonstrates that SPEAR’s denoising algorithm yields significant improvements on the task of HRV estimation from PPG signals.
| HRV Metric | Original Signal | Filtered Signal | Denoised (SPEAR) |
|---|---|---|---|
| SDNN | 55.98 | 49.93 | 24.16 |
| RMSSD | 112.47 | 81.19 | 47.7 |
6 Discussion
Applications of SPEAR
PPG technology is becoming increasingly ubiquitous with the adoption of modern wearables such as smartwatches, wristbands and smart jewellery. These devices allow users to continuously monitor heart rate throughout daily life, made possible by their simplicity of operation, cost effectiveness and comfort of use. Most modern wearable devices now also provide continuous HRV measurement [Hinde et al.(2021)], which further enables many healthcare applications. PPG has several personal health applications, such as tracking blood pressure [Yoon et al.(2009)] and blood oxygen saturation [Almarshad et al.(2022)], monitoring sleep quality [Korkalainen et al.(2020)], and guiding exercise and recovery for athletes [Singh et al.(2018)]. Continuous long-term monitoring of PPG also has important clinical applications, such as diagnosing cardiovascular diseases [Allen et al.(2006)] and arrhythmia [Pereira et al.(2020)]. PPG is highly susceptible to noise and these applications are consequently limited in their accuracy and reliability due to the corruption of underlying metrics obtained from the signals. This is where a denoising algorithm, such as SPEAR, can improve the reliability of these applications. SPEAR can be integrated as a pre-processing step for any application that uses PPG signals for predictive or analytical tasks. The SPEAR algorithm receives a continuous PPG signal of arbitrary duration, splits it into segments, rejects the few segments that are too corrupted to recover and reconstructs the rest only in the noise-corrupted regions, while preserving the useful information in the rest of the signal. The reconstructed clean signal can then be rejoined and passed down to further tasks; since these signals are now clean, they result in more reliable performance in downstream tasks.
Deployment
SPEAR can be deployed in personal health applications as well as clinical settings. The algorithm can be implemented in a smartphone application that integrates with the user’s wearable. Such an integration only requires a device that provides access to PPG waveform data, such as the Empatica E4 or Actigraph wristwatches (see [Hinde et al.(2021)] for a review on the data afforded by various PPG enabled devices). For clinical applications, the SPEAR algorithm can be integrated into existing data processing pipelines as a pre-processing step to produce clean PPG signals to be used in various predictive or analytical tasks. SPEAR’s code is publicly available and open source; hence, it is free to integrate into any personal or clinical application without requiring FDA approval. This serves three purposes: (1) troubleshooting can be crowdsourced, (2) it can be used as a baseline for comparison with proprietary products, and (3) developers can combine SPEAR with off-the-shelf open source algorithms that work for clean PPG. That said, SPEAR can also be built into algorithms that can apply for FDA approval and have a greater degree of trust and reliability. Most importantly, our work will provide users the ability to glean metrics on their health, without being limited to the proprietary algorithms provided by device manufacturers. This can enable the development of a variety of PPG enabled applications available to the public.
Code Availability.
Code for SPEAR will be made publicly available at https://github.com/{redacted}.
7 Conclusion
We introduced a novel self-supervised learning paradigm for eliminating noise artifacts and estimating heart rate from PPG signals collected from wrist-worn wearable devices. An advantage of our approach is that it only requires clean PPG signals for training, which allows us to use larger datasets without ground-truth labels. SPEAR outperforms baselines at HR and HRV estimation and generalizes well across datasets. This illustrates how SPEAR enables more accurate downstream analysis of many aspects of heart monitoring from wearables.
References
- [1]
- [Allen et al.(2006)] John Allen, Klaus Overbeck, Gerard Stansby, and Alan Murray. 2006. Photoplethysmography Assessments in Cardiovascular Disease. Measurement and Control 39, 3 (2006), 80–83. https://doi.org/10.1177/002029400603900303 arXiv:https://doi.org/10.1177/002029400603900303
- [Almarshad et al.(2022)] Malak Abdullah Almarshad, Md Saiful Islam, Saad Al-Ahmadi, and Ahmed S. BaHammam. 2022. Diagnostic Features and Potential Applications of PPG Signal in Healthcare: A Systematic Review. Healthcare 10, 3 (March 2022), 547. https://doi.org/10.3390/healthcare10030547
- [Bartels et al.(2017)] Rhenan Bartels, Leonardo Neumamm, Tiago Peçanha, and Alysson Roncally Silva Carvalho. 2017. SinusCor: an advanced tool for heart rate variability analysis. Biomed. Eng. Online 16 (2017). https://doi.org/10.1186/s12938-017-0401-4
- [Biswas et al.(2019)] Dwaipayan Biswas, Luke Everson, Muqing Liu, Madhuri Panwar, Bram-Ernst Verhoef, Shrishail Patki, Chris H. Kim, Amit Acharyya, Chris Van Hoof, Mario Konijnenburg, and Nick Van Helleputte. 2019. CorNET: Deep Learning Framework for PPG-Based Heart Rate Estimation and Biometric Identification in Ambulant Environment. IEEE Transac. Biomed. Circuits & Sys. 13, 2 (2019), 282–291. https://doi.org/10.1109/TBCAS.2019.2892297
- [Castaneda et al.(2018)] Denisse Castaneda, Aibhlin Esparza, Mohammad Ghamari, Cinna Soltanpur, and Homer Nazeran. 2018. A review on wearable photoplethysmography sensors and their potential future applications in health care. Intl. journal of biosensors & bioelectronics 4, 4 (2018), 195. https://doi.org/10.15406/ijbsbe.2018.04.00125
- [Chang et al.(2021)] Xiangmao Chang, Gangkai Li, Guoliang Xing, Kun Zhu, and Linlin Tu. 2021. DeepHeart: A Deep Learning Approach for Accurate Heart Rate Estimation from PPG Signals. ACM Trans. Sen. Netw. 17, 2, Article 14 (jan 2021), 18 pages.
- [Charlton(2022)] Peter Charlton. 2022. RRest. https://github.com/peterhcharlton/RRest [Online; accessed 13. Sep. 2022].
- [Chong et al.(2014)] Jo Woon Chong, Duy K. Dao, S. M. A. Salehizadeh, David D. McManus, Chad E. Darling, Ki H. Chon, and Yitzhak Mendelson. 2014. Photoplethysmograph Signal Reconstruction Based on a Novel Hybrid Motion Artifact Detection–Reduction Approach. Part I: Motion and Noise Artifact Detection. Ann. Biomed. Eng. 42, 11 (Nov. 2014), 2238–2250. https://doi.org/10.1007/s10439-014-1080-y
- [Comtois et al.(2007)] Gary Comtois, Yitzhak Mendelson, and Piyush Ramuka. 2007. A Comparative Evaluation of Adaptive Noise Cancellation Algorithms for Minimizing Motion Artifacts in a Forehead-Mounted Wearable Pulse Oximeter. In IEEE Engg. in Med. and Biol. Soc. 1528–1531. https://doi.org/10.1109/IEMBS.2007.4352592
- [Elgendi et al.(2013)] M Elgendi, I Norton, M Brearley, D Abbott, and D Schuurmans. 2013. Systolic Peak Detection in Acceleration Photoplethysmograms Measured from Emergency Responders in Tropical Conditions. PLoS ONE 8(10): e76585 (2013).
- [Galli et al.(2018)] Alessandra Galli, Claudio Narduzzi, and Giada Giorgi. 2018. Measuring Heart Rate During Physical Exercise by Subspace Decomposition and Kalman Smoothing. IEEE Transactions on Instrumentation and Measurement 67, 5 (2018), 1102–1110. https://doi.org/10.1109/TIM.2017.2770818
- [Goh et al.(2020)] Choon-Hian Goh, Li Kuo Tan, Nigel H. Lovell, Siew-Cheok Ng, Maw Pin Tan, and Einly Lim. 2020. Robust PPG motion artifact detection using a 1-D convolution neural network. Comput. Methods Programs Biomed. 196 (Nov. 2020), 105596. https://doi.org/10.1016/j.cmpb.2020.105596
- [Guo et al.(2021)] Zhicheng Guo, Cheng Ding, Xiao Hu, and Cynthia Rudin. 2021. A supervised machine learning semantic segmentation approach for detecting artifacts in plethysmography signals from wearables. Physiological Measurement 42, 12 (dec 2021), 125003. https://doi.org/10.1088/1361-6579/ac3b3d
- [Hinde et al.(2021)] Katrina Hinde, Graham White, and Nicola Armstrong. 2021. Wearable Devices Suitable for Monitoring Twenty Four Hour Heart Rate Variability in Military Populations. Sensors (Basel, Switzerland) 21, 4 (Feb. 2021). https://doi.org/10.3390/s21041061
- [Kasambe and Rathod(2015)] P. V. Kasambe and S. S. Rathod. 2015. VLSI Wavelet Based Denoising of PPG Signal. Proceedings of ICAC3’15 49 (2015), 282–288. https://www.sciencedirect.com/science/article/pii/S1877050915007632
- [Kingma and Ba(2014)] Diederik P. Kingma and Jimmy Ba. 2014. Adam: A Method for Stochastic Optimization. arXiv (Dec. 2014). https://doi.org/10.48550/arXiv.1412.6980 arXiv:1412.6980
- [Korkalainen et al.(2020)] Henri Korkalainen, Juhani Aakko, Brett Duce, Samu Kainulainen, Akseli Leino, Sami Nikkonen, Isaac O Afara, Sami Myllymaa, Juha Töyräs, and Timo Leppänen. 2020. Deep learning enables sleep staging from photoplethysmogram for patients with suspected sleep apnea. Sleep 43, 11 (05 2020). https://doi.org/10.1093/sleep/zsaa098 arXiv:https://academic.oup.com/sleep/article-pdf/43/11/zsaa098/34499301/zsaa098_suppl_supplementary_material.pdf zsaa098.
- [Lam et al.(2020)] Emily Lam, Shahrose Aratia, Julian Wang, and James Tung. 2020. Measuring Heart Rate Variability in Free-Living Conditions Using Consumer-Grade Photoplethysmography: Validation Study. JMIR Biomed Eng 5, 1 (3 Nov 2020), e17355. https://doi.org/10.2196/17355
- [Lee et al.(2019)] Joonnyong Lee, Sukkyu Sun, Seung Man Yang, Jang Jay Sohn, Jonghyun Park, Saram Lee, and Hee Chan Kim. 2019. Bidirectional Recurrent Auto-Encoder for Photoplethysmogram Denoising. IEEE Journal of Biomedical and Health Informatics 23, 6 (2019), 2375–2385. https://doi.org/10.1109/JBHI.2018.2885139
- [Lu et al.(2008)] Sheng Lu, He Zhao, Kihwan Ju, Kunson Shin, Myoungho Lee, Kirk Shelley, and Ki H. Chon. 2008. Can Photoplethysmography Variability Serve as an Alternative Approach to Obtain Heart Rate Variability Information? J. Clin. Monit. Comput. 22, 1 (Jan. 2008), 23–29. https://doi.org/10.1007/s10877-007-9103-y
- [Mishra and Nirala(2020)] Bhanupriya Mishra and Neelam Sobha Nirala. 2020. A Survey on Denoising Techniques of PPG Signal. In IEEE INOCON Conference. 1–8.
- [Morelli et al.(2018)] Davide Morelli, Leonardo Bartoloni, Michele Colombo, David Plans, and David A. Clifton. 2018. Profiling the propagation of error from PPG to HRV features in a wearable physiological-monitoring device. Healthcare Technol. Lett. 5, 2 (April 2018), 59–64. https://doi.org/10.1049/htl.2017.0039
- [Pan et al.(2016)] Huijie Pan, Dogancan Temel, and Ghassan AlRegib. 2016. HeartBEAT: Heart beat estimation through adaptive tracking. In Conference of BHI. 587–590.
- [Panwar et al.(2020)] Madhuri Panwar, Arvind Gautam, Dwaipayan Biswas, and Amit Acharyya. 2020. PP-Net: A Deep Learning Framework for PPG-Based Blood Pressure and Heart Rate Estimation. IEEE Sensors Journal 20, 17 (2020), 10000–10011. https://doi.org/10.1109/JSEN.2020.2990864
- [Peng et al.(2014)] Fulai Peng, Zhengbo Zhang, Xiaoming Gou, Hongyun Liu, and Weidong Wang. 2014. Motion artifact removal from photoplethysmographic signals by combining temporally constrained independent component analysis and adaptive filter. BioMedical Engineering OnLine 13, 1 (2014), 50.
- [Pereira et al.(2020)] Tania Pereira, Nate Tran, Kais Gadhoumi, Michele M. Pelter, Duc H. Do, Randall J. Lee, Rene Colorado, Karl Meisel, and Xiao Hu. 2020. Photoplethysmography based atrial fibrillation detection: a review. npj Digital Med. 3, 3 (Jan. 2020), 1–12. https://doi.org/10.1038/s41746-019-0207-9
- [Reiss et al.(2019)] Attila Reiss, Ina Indlekofer, Philip Schmidt, and Kristof Van Laerhoven. 2019. Deep PPG: Large-Scale Heart Rate Estimation with Convolutional Neural Networks. Sensors 19, 14 (2019).
- [Salehizadeh et al.(2016)] Seyed M. A. Salehizadeh, Duy Dao, Jeffrey Bolkhovsky, Chae Cho, Yitzhak Mendelson, and Ki H. Chon. 2016. A Novel Time-Varying Spectral Filtering Algorithm for Reconstruction of Motion Artifact Corrupted Heart Rate Signals During Intense Physical Activities Using a Wearable Photoplethysmogram Sensor. Sensors 16, 1 (2016). https://doi.org/10.3390/s16010010
- [Sañudo et al.(2019)] Borja Sañudo, Moisés De Hoyo, Alejandro Muñoz-López, John Perry, and Grant Abt. 2019. Pilot Study Assessing the Influence of Skin Type on the Heart Rate Measurements Obtained by Photoplethysmography with the Apple Watch. J. Med. Syst. 43, 7 (July 2019), 1–8. https://doi.org/10.1007/s10916-019-1325-2
- [Schäck et al.(2015)] Tim Schäck, Christian Sledz, Michael Muma, and Abdelhak M. Zoubir. 2015. A new method for heart rate monitoring during physical exercise using photoplethysmographic signals. In EUSIPCO Conference. https://doi.org/10.1109/EUSIPCO.2015.7362868
- [Shaffer and Ginsberg(2017)] Fred Shaffer and J P Ginsberg. 2017. An Overview of Heart Rate Variability Metrics and Norms. Frontiers in public health 5 (09 2017), 258–258. https://doi.org/10.3389/fpubh.2017.00258
- [Shyam et al.(2019)] A. Shyam, Vignesh Ravichandran, S.P. Preejith, Jayaraj Joseph, and Mohanasankar Sivaprakasam. 2019. PPGnet: Deep Network for Device Independent Heart Rate Estimation from Photoplethysmogram. In Intl. Conference of IEEE EMBC. 1899–1902. https://doi.org/10.1109/EMBC.2019.8856989
- [Singh et al.(2018)] Nikhil Singh, Kegan James Moneghetti, Jeffrey Wilcox Christle, David Hadley, Victor Froelicher, and Daniel Plews. 2018. Heart Rate Variability: An Old Metric with New Meaning in the Era of Using mHealth technologies for Health and Exercise Training Guidance. Part Two: Prognosis and Training. Arrhythmia Electrophysiol. Rev. 7, 4 (Dec. 2018), 247. https://doi.org/10.15420/aer.2018.30.2
- [Temko(2017)] Andriy Temko. 2017. PPG-based heart rate estimation using Wiener filter, phase vocoder and Viterbi decoding. In IEEE ICASSP. 1013–1017. https://doi.org/10.1109/ICASSP.2017.7952309
- [Torres-Soto and Ashley(2020)] Jessica Torres-Soto and Euan A. Ashley. 2020. Multi-task deep learning for cardiac rhythm detection in wearable devices. npj Digital Med. 3, 116 (Sept. 2020), 1–8. https://doi.org/10.1038/s41746-020-00320-4
- [Tsipouras and Fotiadis(2004)] Markos G. Tsipouras and Dimitrios I. Fotiadis. 2004. Automatic arrhythmia detection based on time and time–frequency analysis of heart rate variability. Comput. Methods Programs Biomed. 74, 2 (May 2004), 95–108. https://doi.org/10.1016/S0169-2607(03)00079-8
- [Tsuji et al.(1996)] Hisako Tsuji, Martin G. Larson, Ferdinand J. Venditti, Emily S. Manders, Jane C. Evans, Charles L. Feldman, and Daniel Levy. 1996. Impact of Reduced Heart Rate Variability on Risk for Cardiac Events. Circulation (Dec. 1996). https://doi.org/10.1161/01.CIR.94.11.2850
- [van Gent et al.(2018)] Paul van Gent, Haneen Farah, Nicole Nes, and B. Arem. 2018. Heart Rate Analysis for Human Factors: Development and Validation of an Open Source Toolkit for Noisy Naturalistic Heart Rate Data.
- [Vincent et al.(2008)] Pascal Vincent, Hugo Larochelle, Yoshua Bengio, and Pierre-Antoine Manzagol. 2008. Extracting and Composing Robust Features with Denoising Autoencoders. In Proceedings of ICML. https://doi.org/10.1145/1390156.1390294
- [Wu et al.(2017)] Chih-Chin Wu, I-Wei Chen, and Wai-Chi Fang. 2017. An implementation of motion artifacts elimination for PPG signal processing based on recursive least squares adaptive filter. In IEEE BioCAS Conference. 1–4. https://doi.org/10.1109/BIOCAS.2017.8325141
- [Yoon et al.(2009)] Youngzoon Yoon, Jung H. Cho, and Gilwon Yoon. 2009. Non-constrained Blood Pressure Monitoring Using ECG and PPG for Personal Healthcare. J. Med. Syst. 33, 4 (Aug. 2009), 261–266. https://doi.org/10.1007/s10916-008-9186-0
- [Zhang et al.(2015)] Zhilin Zhang, Zhouyue Pi, and Benyuan Liu. 2015. TROIKA: A General Framework for Heart Rate Monitoring Using Wrist-Type Photoplethysmographic Signals During Intensive Physical Exercise. IEEE Transactions on Biomedical Engineering 62, 2 (2015), 522–531. https://doi.org/10.1109/TBME.2014.2359372