Stationary striations in plasma, created by a short microwave pulse in a waveguide filled with a neutral gas
Abstract
It was observed experimentally that after crossing a waveguide filled with a neutral gas, a short powerful microwave pulse leaves a periodic glow of plasma along the waveguide, persisting several tens of nanoseconds. A theoretical model is presented which in combination with numerical simulations proposes a possible explanation of this phenomenon.
I Introduction
Interaction of strong electromagnetic waves with plasma has always attracted considerable attention. Charged particles acceleration in the wake wave exited by a powerful laser pulse propagating in plasma [1] is at present of particular interest because of significant experimental and theoretical achievements and practical importance (see, e.g., [2, 3, 4]).
The non-linear interaction of electromagnetic pulses with plasma when the microwave and plasma frequencies are of the same order of magnitude, remains permanently in researchers’ field of view. Recent progress in generating extremely intense, hundreds of MW, sub-nanosecond microwave pulses [5, 6] allows one to observe experimentally and study such phenomena as ionization-induced self-channeling of a microwave beam,[7], frequency shift in the wake excitated in a plasma-filled waveguide[8], complete absorption of a microwave pulse in plasma,[10] frequency up-shift and pulse compression in a propagating self-generated ionization front [9].
In this paper a new phenomenon is described which accompanies a neutral gas ionization by intense sub-nanosecond microwave pulse propagating in a waveguide. It is suggested that a periodic stratification of the plasma forms near the waveguide wall and its glow is observed (see Fig. 1), for helium within a pressure range of 7-20 torr and for air within 1-3 torr. The plasma glow appears approximately 5 ns after the microwave pulse enters the gas tube and persists for 70 ns.
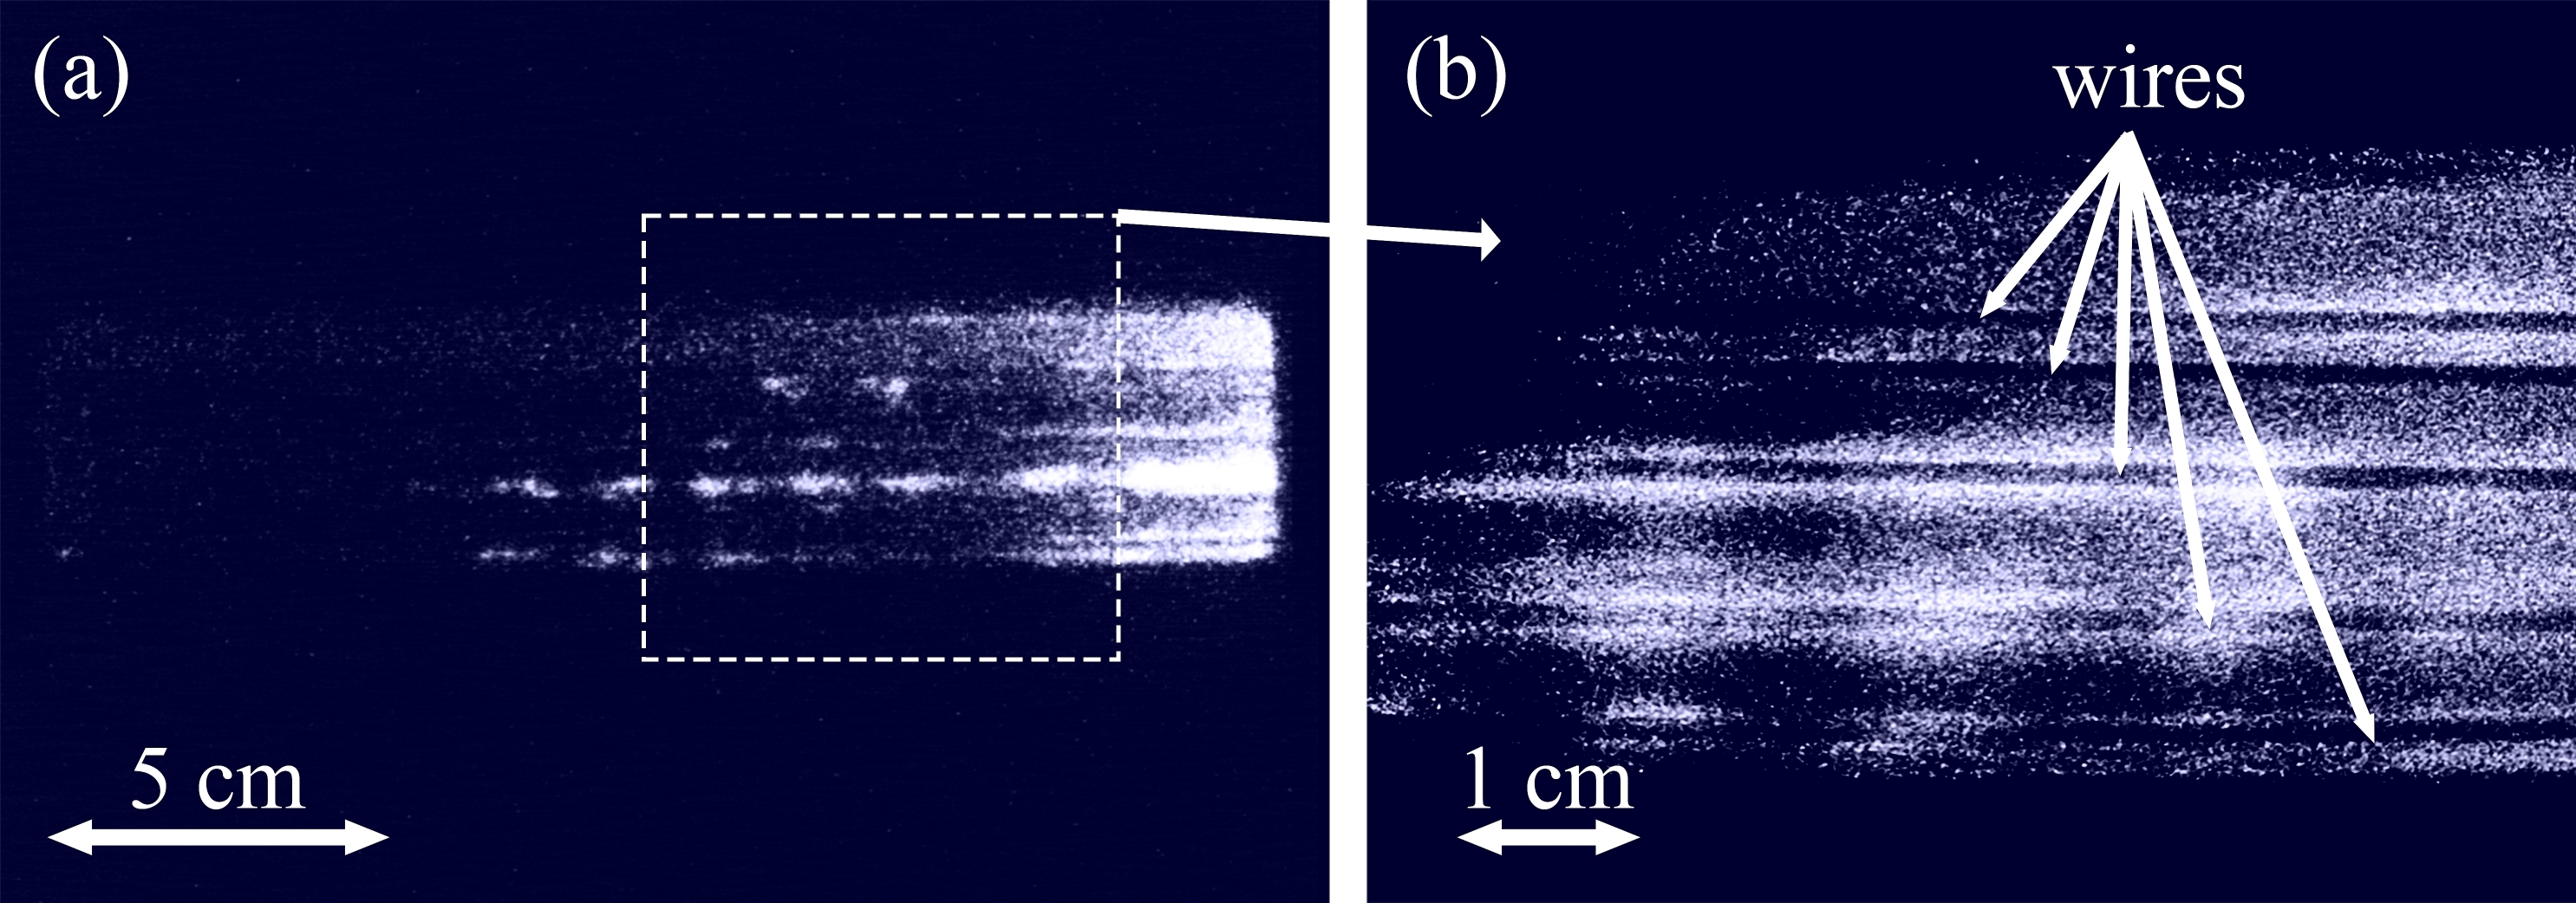
There is nothing unexpected in that perturbations remain in the plasma after the electromagnetic pulse’s passage. The wake excited by a short laser pulse is an example of such perturbation which has received most of the attention. This perturbation propagates together with the pulse and behind it, that is, in the pulse’s frame of reference, it does not move. The periodic stratification demonstrated in Fig. 1, is static in the laboratory frame of reference and appears in the same positions along the waveguide from shot to shot. The purpose of the present article is to propose a physical model which explains this phenomenon.
II Experimental setup
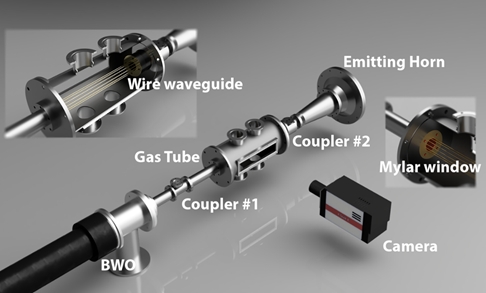
The high-power microwave (HPM) pulse ( MW, ns, GHz, mode) is generated by a super-radiant backward wave oscillator (SR-BWO) (see [5, 6] for details). The output of the SR-BWO is connected to a 2.8 cm diameter circular waveguide with a calibrated coupler (#1) at its center. This waveguide is followed by the gas tube, filled with helium or air at the desired pressure. Inside the gas tube, the HPM pulse propagates along a circular waveguide consisting of 12 parallel stainless steel cylindrical wires (1 mm diameter) distributed uniformly (5-mm apart) along its 2.8 cm perimeter. Electromagnetic simulations confirm that the wave propagating along this waveguide is practically indistinguishable from the wave propagating along a solid-wall cylindrical waveguide. A second calibrated coupler (#2) is connected at the exit from the gas tube followed by an impedance-matched horn antenna. Couplers #1 and #2 measure the incident, transmitted, and reflected wave forms acquired by an Agilent DSO81204B oscilloscope (12 GHz, 40 Gs/s). At the entrance and exit of the gas tube, 0.3 mm thick Mylar interface windows are installed to separate the vacuum/gas/vacuum media. A fast framing intensified 4QuikE ICCD camera (Stanford Computer Optics) operating with a frame duration of 1.5 ns was used to capture the light emission from the plasma formed by the HPM pulse.
The plasma light emission patterns are shown in Fig. 1. One can see periodic plasma glow (striations) near wires which appears approximately 5 ns after the HPM pulse has left the wire waveguide and this glow is present for 70 ns. Such striations were obtained in helium within the pressure range of 7-20 torr, and in air at pressures of 1 - 3 Torr, which corresponds to the transparency window of the HPM pulse in air. By capturing frames at different time delays between the HPM pulse registered by coupler #1 and the 4QuilE camera frame, it can be stated that the striations are stationary and do not move along the path of the HPM pulse propagation. A typical longitudinal period of these striations is 1.9 cm.
III Ionization
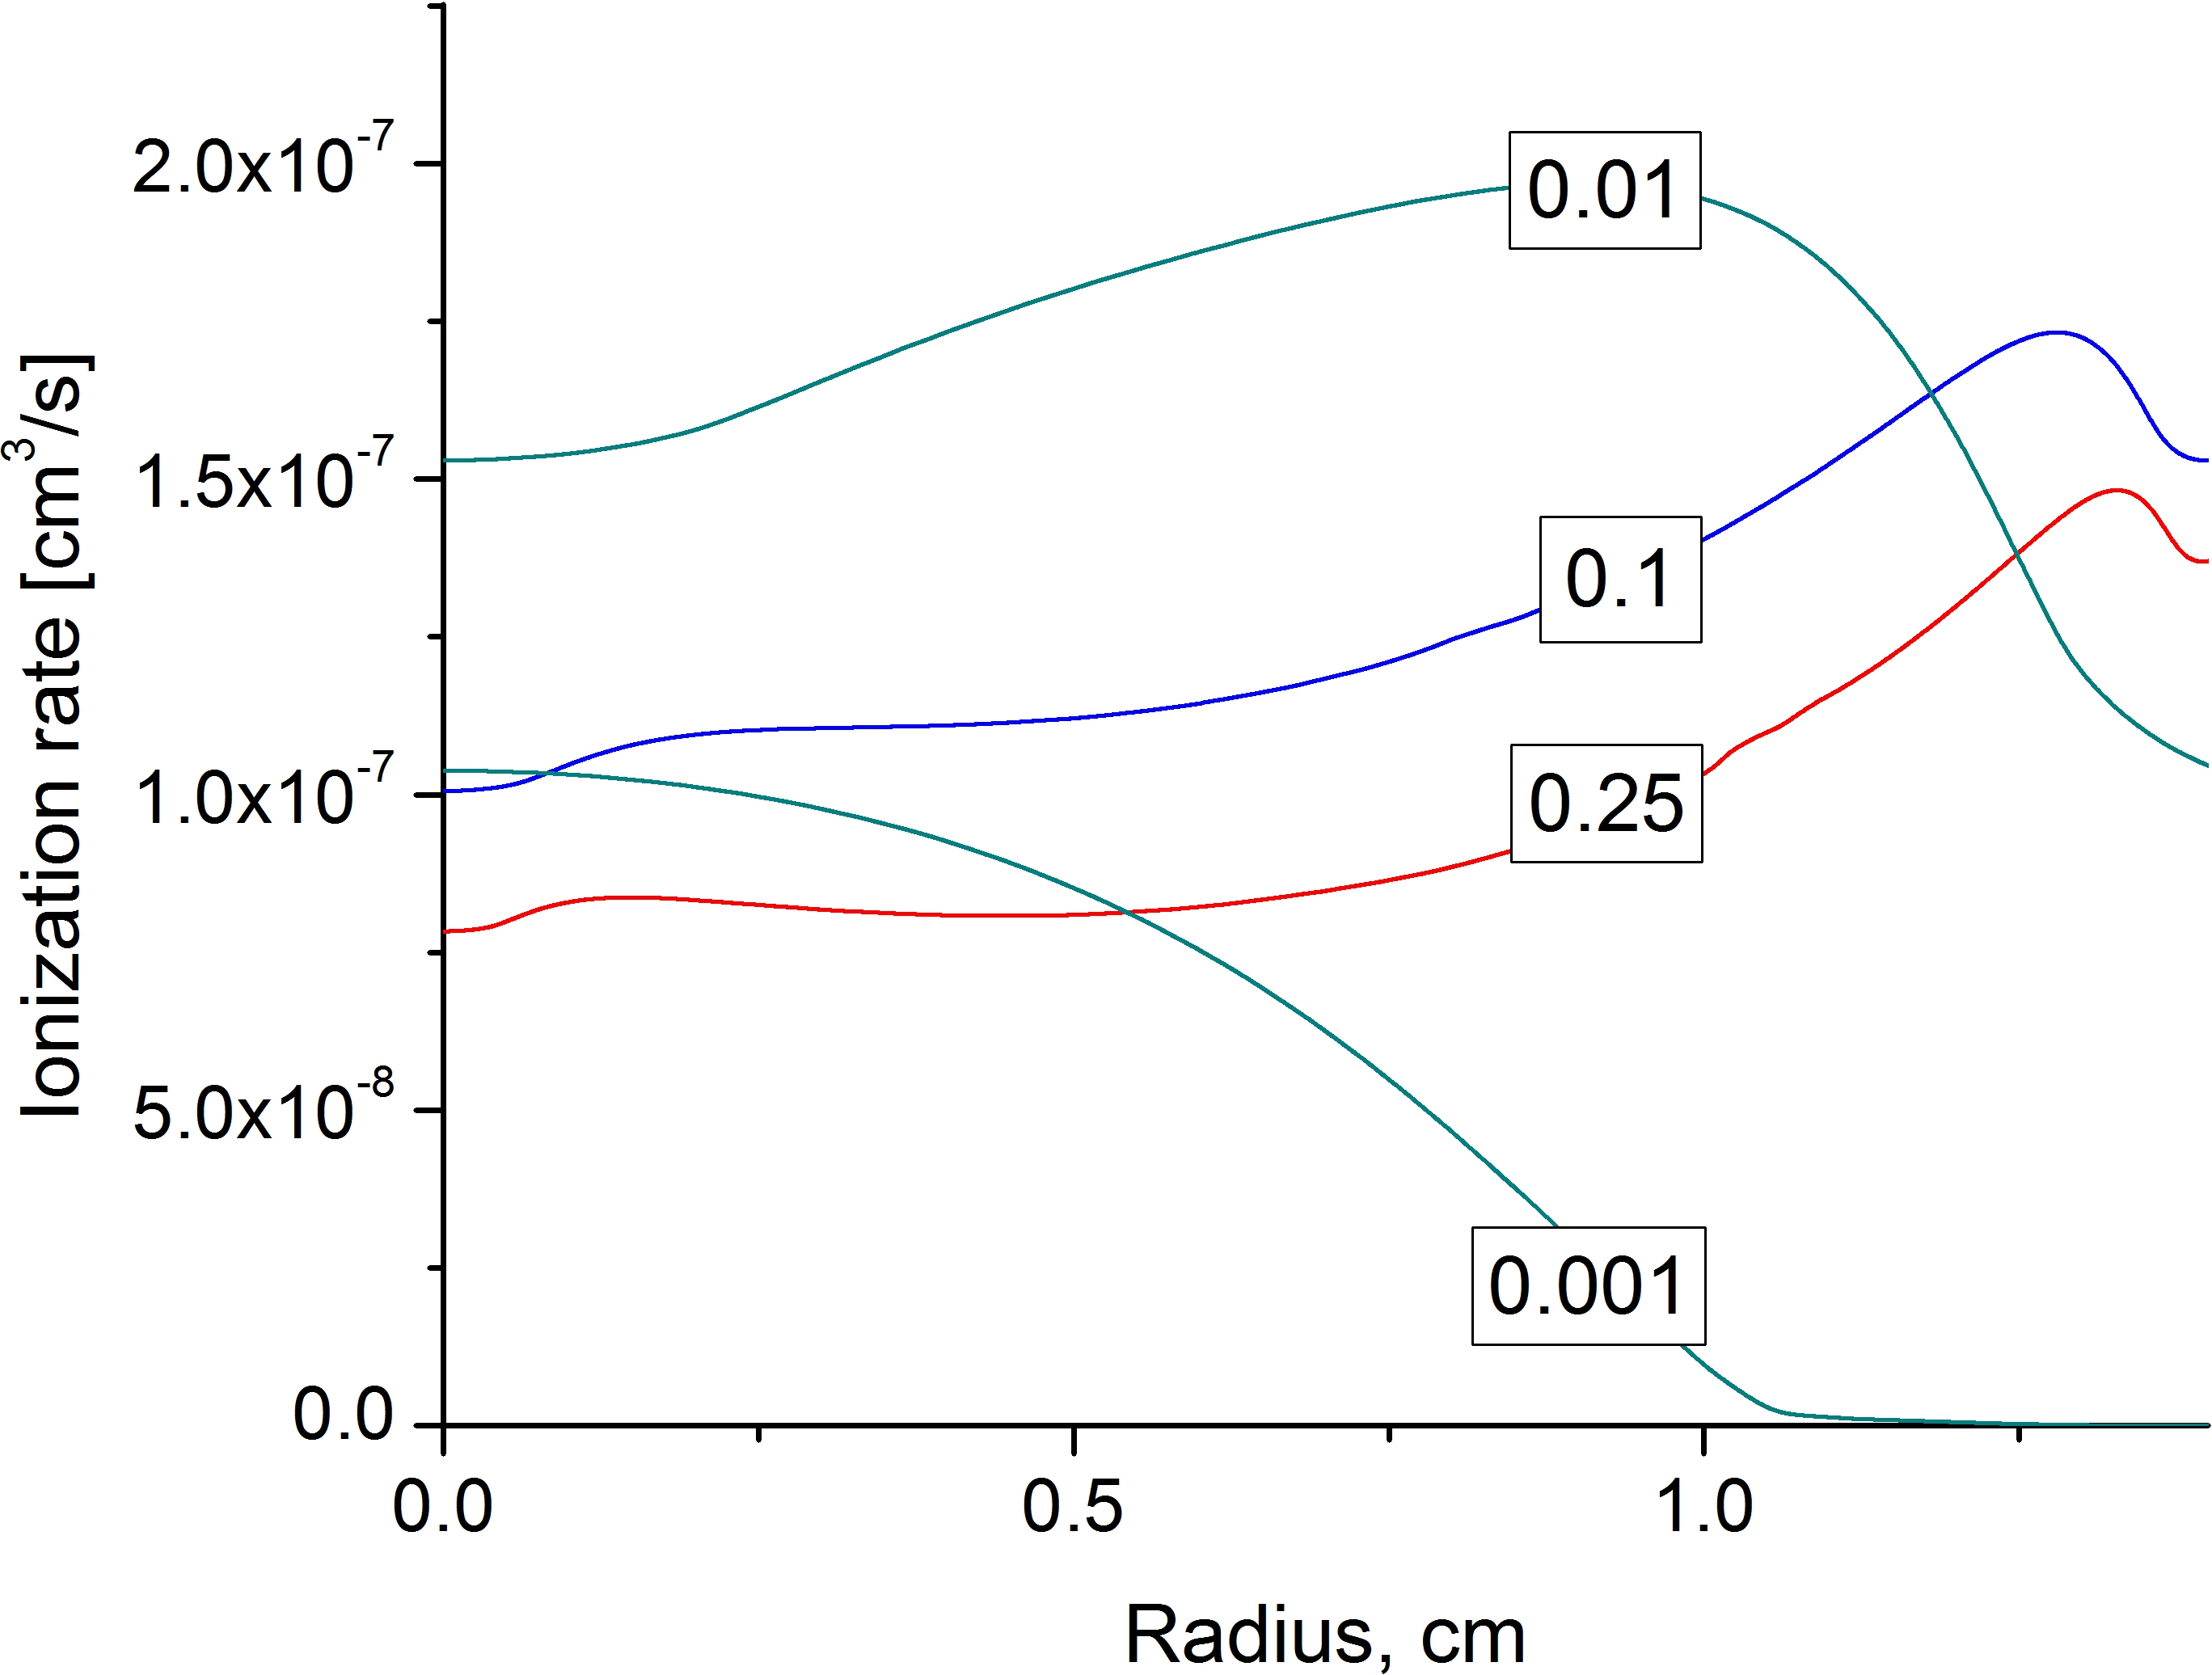
The electric field of a symmetric TM microwave mode propagating in a cylindrical waveguide and the energy of electrons, oscillating in the wave fields, are maximal near the axis. When the microwave power is moderate (a few MW) the plasma is created mostly near and its density is maximal on the axis. When the microwave power is sufficiently high, the region of maximal ionization rate shifts from the axis toward the waveguide wall. The reason is a non-monotonic dependence of the electron impact ionization cross section on the electron energy . The cross section is maximal when the electron energy is of the order of 100 eV and decreases with increasing electron energy. For microwave power of the order of tens of MW or higher, the electron oscillating energy near the axis is so large that the ionization cross sections is smaller than its maximal value. In contrast, near the waveguide wall, where the wave electric field is smaller than near the axis, the ionization cross section is close to its maximal value.
The time evolution of the electron density, , is described by the equation
| (1) |
where is the neutral gas density, is the electron velocity, and is the ionization cross section, which depends on the electron kinetic energy . If the duration of the electromagnetic pulse, , is large compared to the field oscillation period , (where is the wave frequency), it is convenient to use the ionization rate averaged over a period of the oscillations:
| (2) |
The dependence of the ionization rate on the radius for various values of the microwave power are shown in Fig. 3.
The radial profile of the plasma density, which remains in the waveguide behind the pulse, can be calculated as
| (3) |
where is the initial electron density, and is the pulse power’s temporal profile. An example of the electron density evolution is presented in Fig. 4. One can see that the electron density in a narrow layer near the waveguide wall is almost an order of magnitude larger than near the axis. This difference increases rapidly with the neutral gas density growth.
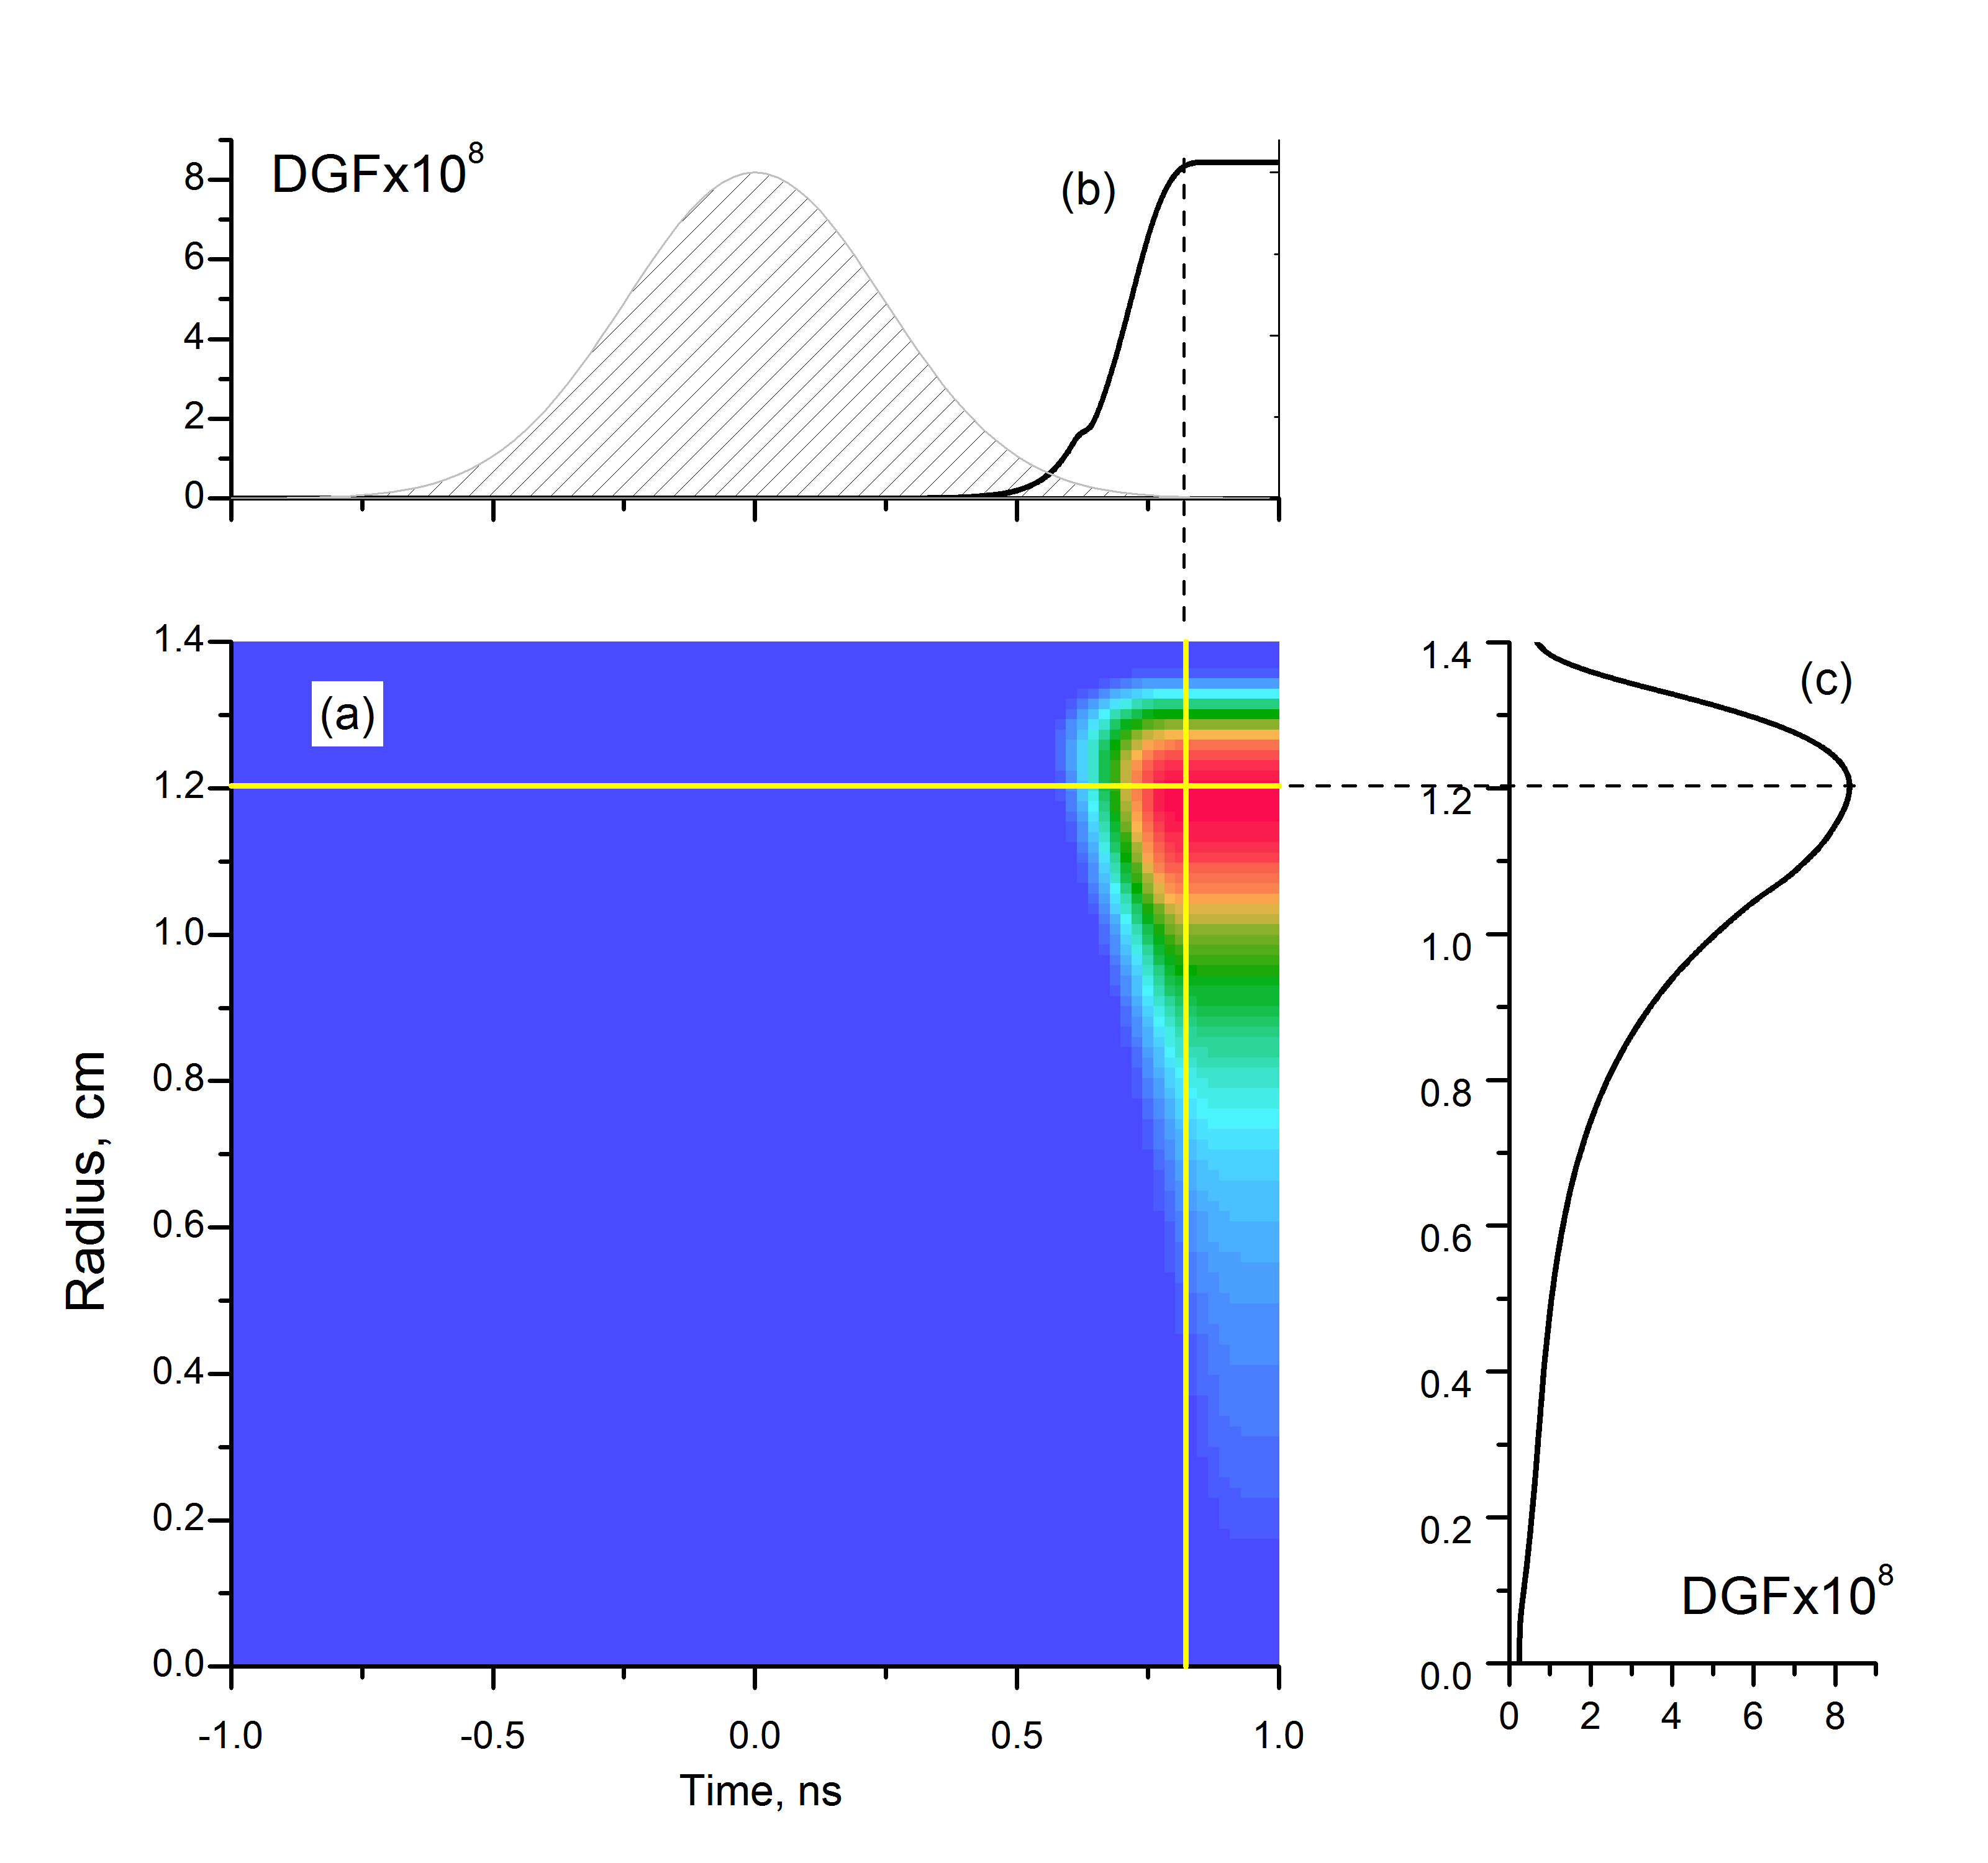
Note that the plasma density grows rapidly at the rear tail (late time) of the pulse, and the characteristic rise time of the plasma density is much smaller than the pulse duration. The importance of this will be discussed below.
IV Eigenmodes of a waveguide filled partially with plasma
The neutral gas ionization process induced by a powerful microwave pulse described in Sect. III assumes that the structure of the microwave fields remains unchanged by the presence of plasma, which is correct for plasma density smaller than critical . When the plasma density is close to critical, the structure of the wave’s fields vary considerably. In order to trace this variation, let us consider the simple model of assuming a step-wise three-layer density distribution:
| (4) |
where is the waveguide radius. This plasma density profile is a rough description of the expected density distribution described in Sect. III.
Matching tangential components of the electromagnetic fields at the interfaces between the different regions, one can find the spectrum of the layered waveguide eigenmodes as the solution of a boundary value problem.
Even such a simple form of the plasma density distribution contains many parameters. Below, only such values of the parameters will be considered which correspond to the experimental conditions. In particular, because the plasma density in region II can exceed the ones in regions I and III, the model can be further simplified, by assuming .
An example of the eigenmodes spectrum is shown in Fig. 5.
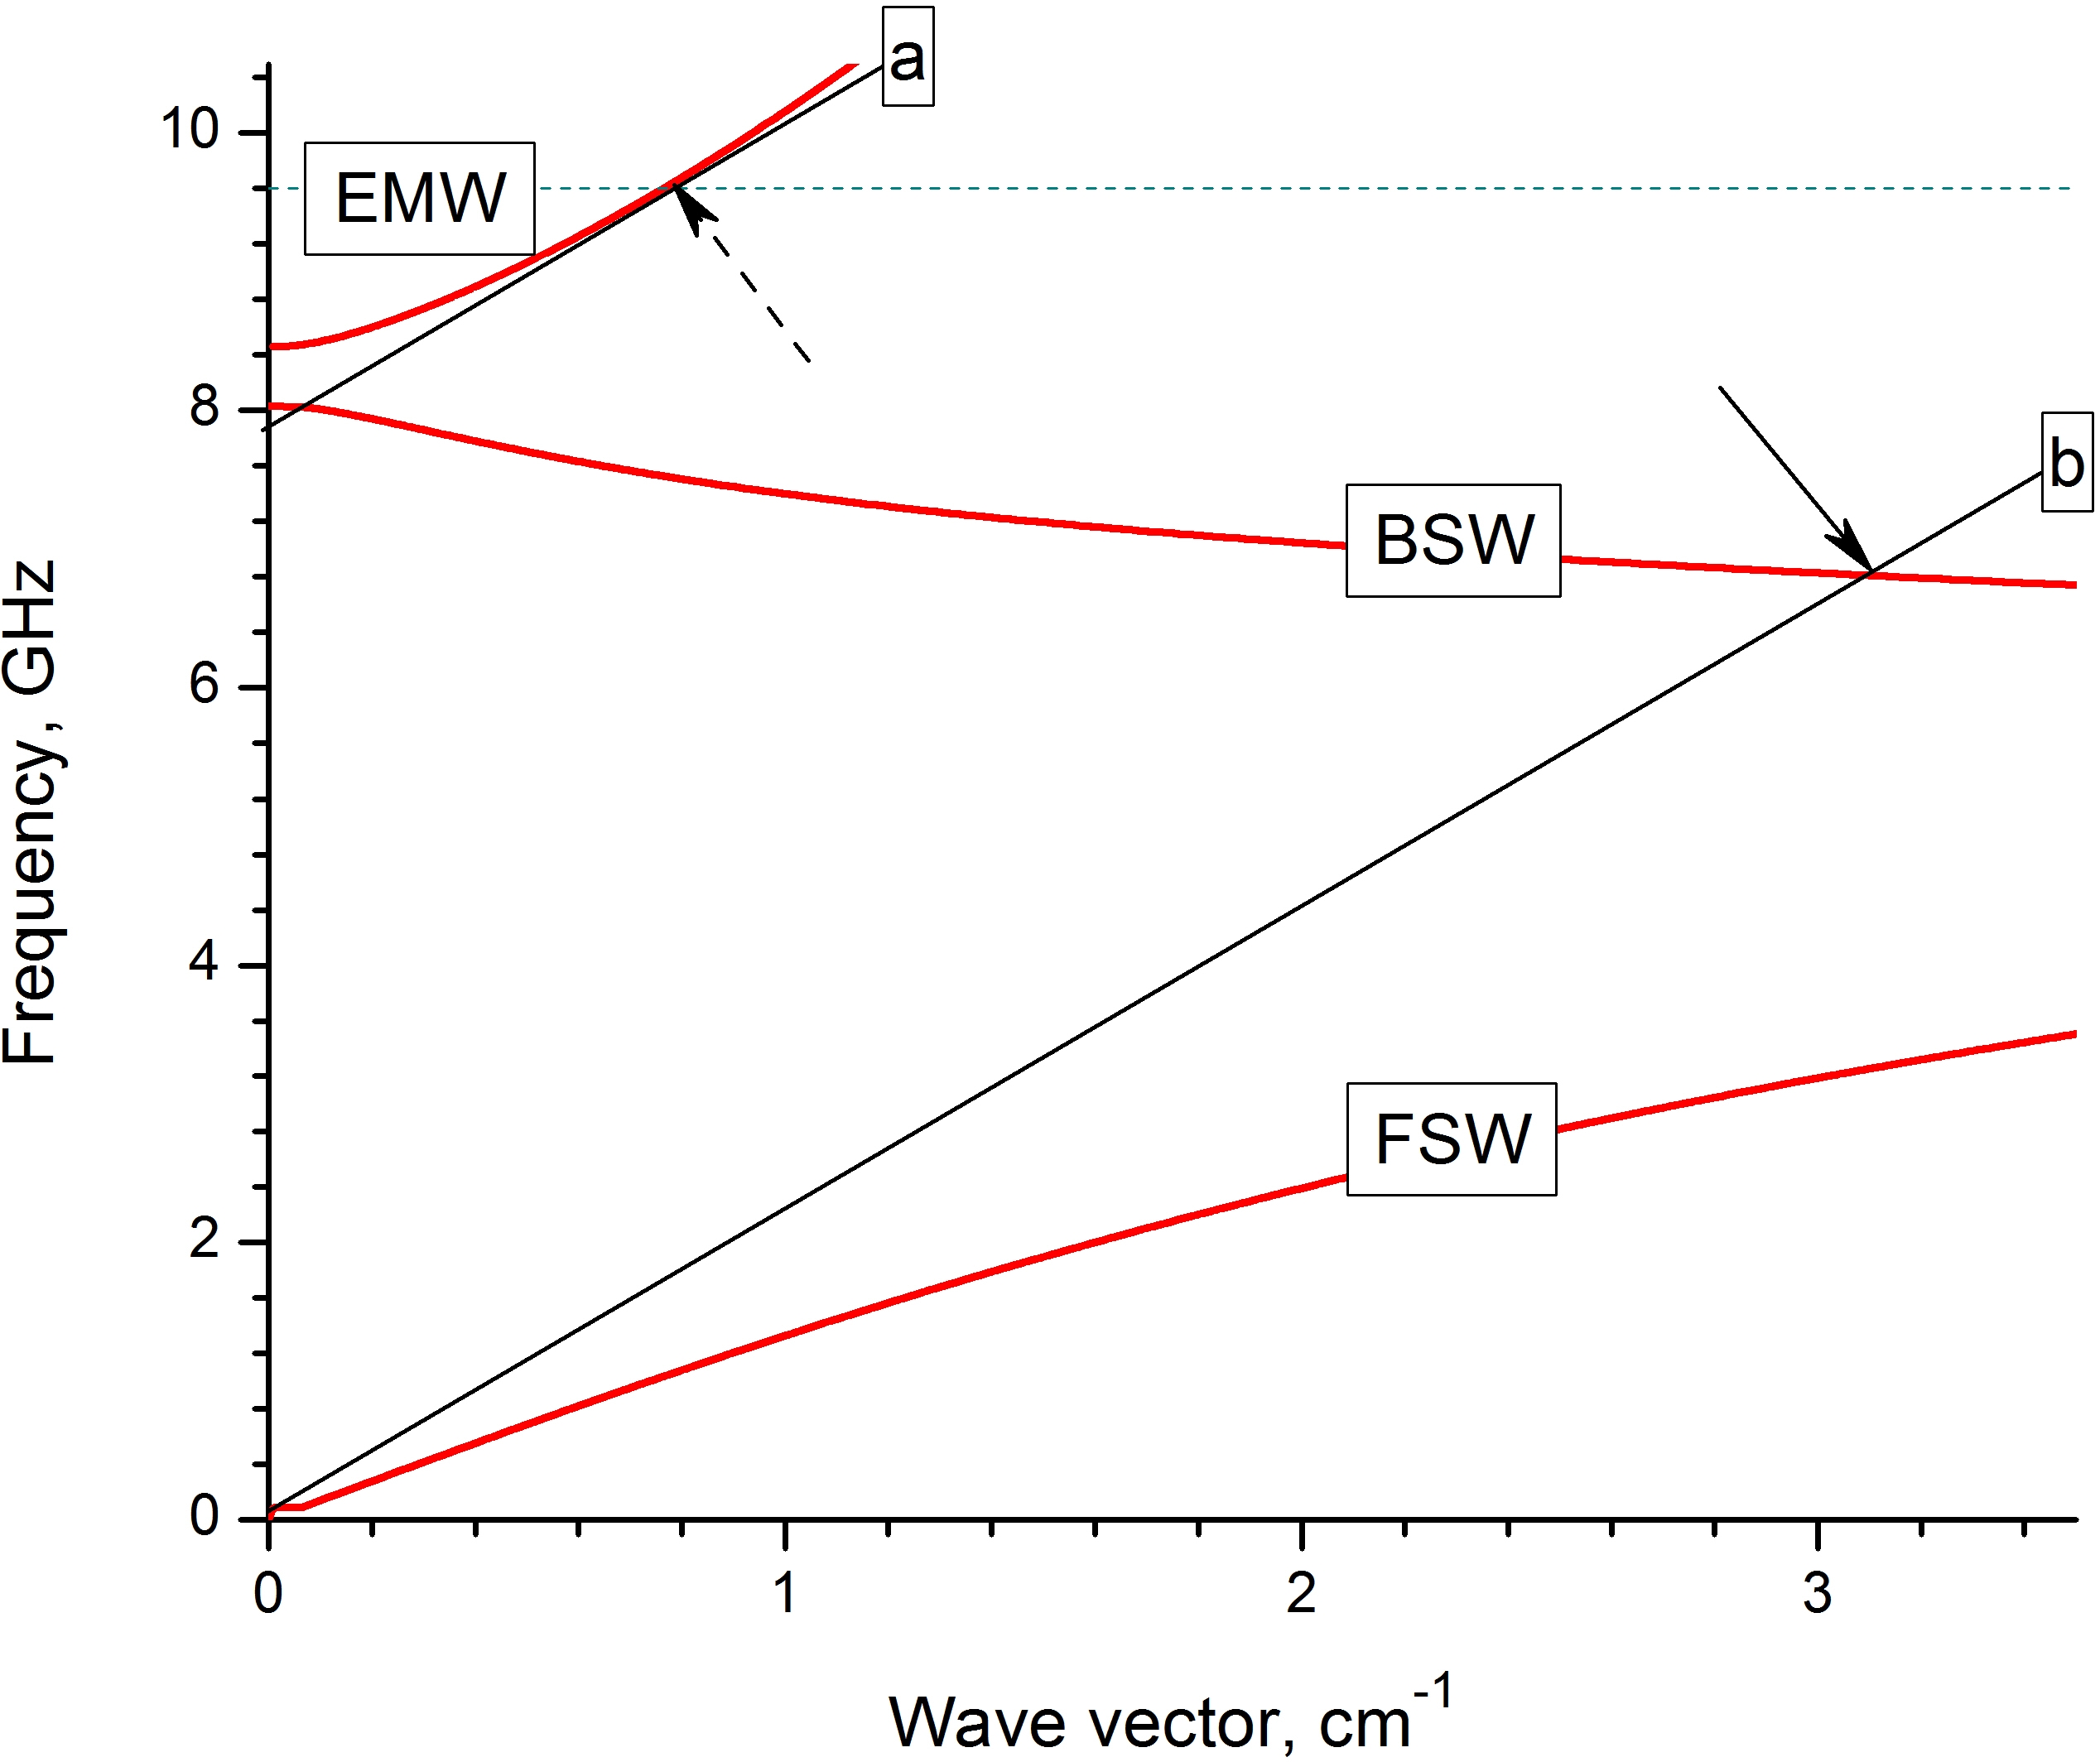
The presence of the plasma with a ring-shaped transversal profile enriches the spectrum by two surface waves: a backward- and a forward-propagating mode. The spectrum of the electromagnetic wave changes only little if the plasma layer’s thickness is small compared to the waveguide radius. On the contrary, the change in the structure of the wave’s fields are very strong in Fig. 6.
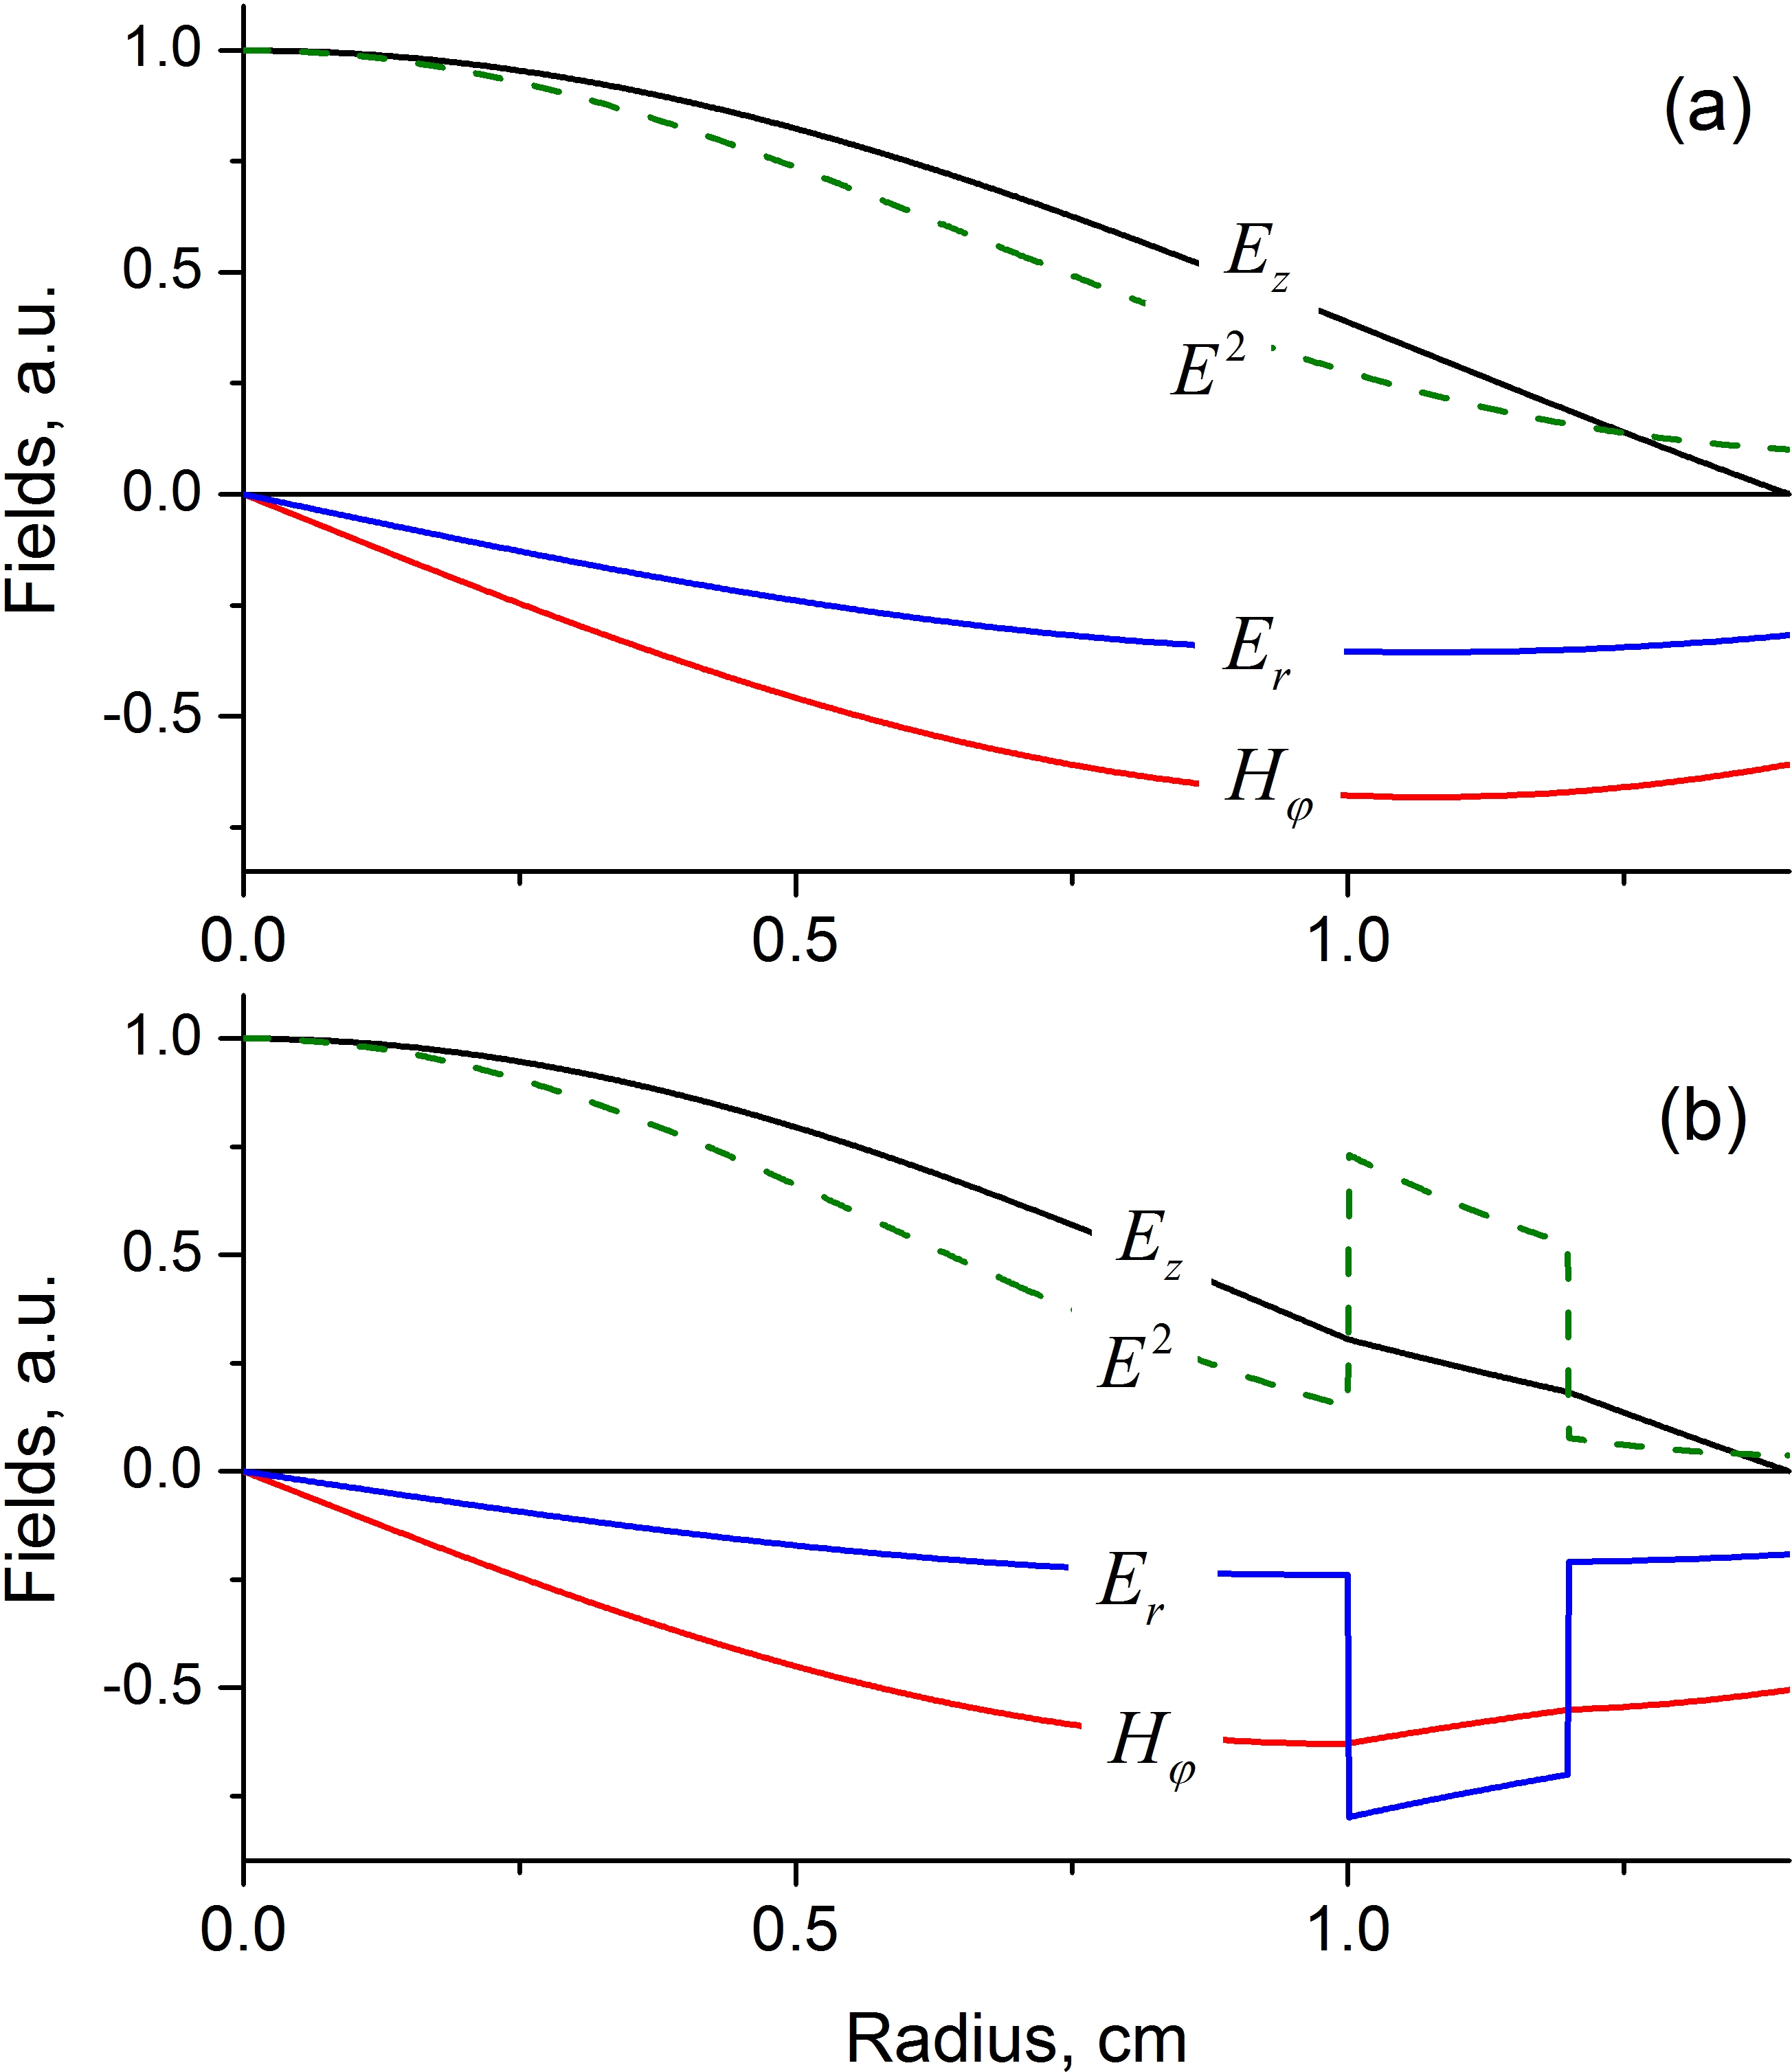
Compared to an empty waveguide, in the plasma-filled waveguide the amplitudes of the longitudinal component of the electric field, , and the azimuthal component of the magnetic field, , decrease over all cross sections, but not that much. In contrast, the variation in the radial electric field, , profile is considerably stronger. This component of the field increases strongly in region II, occupied by the plasma which means that the oscillatory energy of the plasma electrons exceeds the value calculated ignoring the change in the eigenmode fields. Because the ionization cross section is a decreasing function of the electron energy (in the energy range of interest), changes in the eigenmode fields structure suppresses ionization and the region with the most effective ionization is shifted closer to the waveguide axis, widening the plasma layer.
In the numerical example relevant to Fig. 5, the plasma density was chosen so that the Langmuir frequency is equal to the empty waveguide cut-off frequency . This is an arbitrary choice, but the analysis allows one to assume that the plasma density in the expanded layer is close to this value. Indeed, if the plasma density is small, so that , the deformation of the eigenmode fields is small, and also the ionization in this region continues. When the density is large enough, so that , the ionization slows down. The density cannot be so large that , because the waveguide becomes opaque for the incoming microwaves if the frequency is close to the cut-off frequency, , as is the case in the experiments.
Thus, a high-power microwave pulse, propagating in the waveguide filled with a neutral gas, can create a hollow, tubular plasma. Note that a similar hollow plasma column can be created in an unbounded system by a microwave pulse with a bell-shaped radial profile when the required power density can be achieved by focusing the microwave beam [7, 11], so that the hollow plasma is created in the vicinity of the focal plane only. A hollow plasma can also be created by a tubular electron beam, propagating in a neutral gas along a strong guiding magnetic field [12]. Ionization of a neutral gas by a powerful tubular laser beam can also create a plasma with specified density distribution [13].
V Backward surface wave excitation and plasma glow striations
Propagation of a powerful electromagnetic pulse in a preliminarily prepared plasma is accompanied by the excitation of a wake, which is a slow eigenmode of either an unbounded plasma or a plasma-filled waveguide. Phase velocity of this eigenmode coincides with the group velocity of the pulse. It seems reasonable to assume that a similar wake is excited and remains in the plasma behind the pulse even though the plasma was created by the pulse itself.
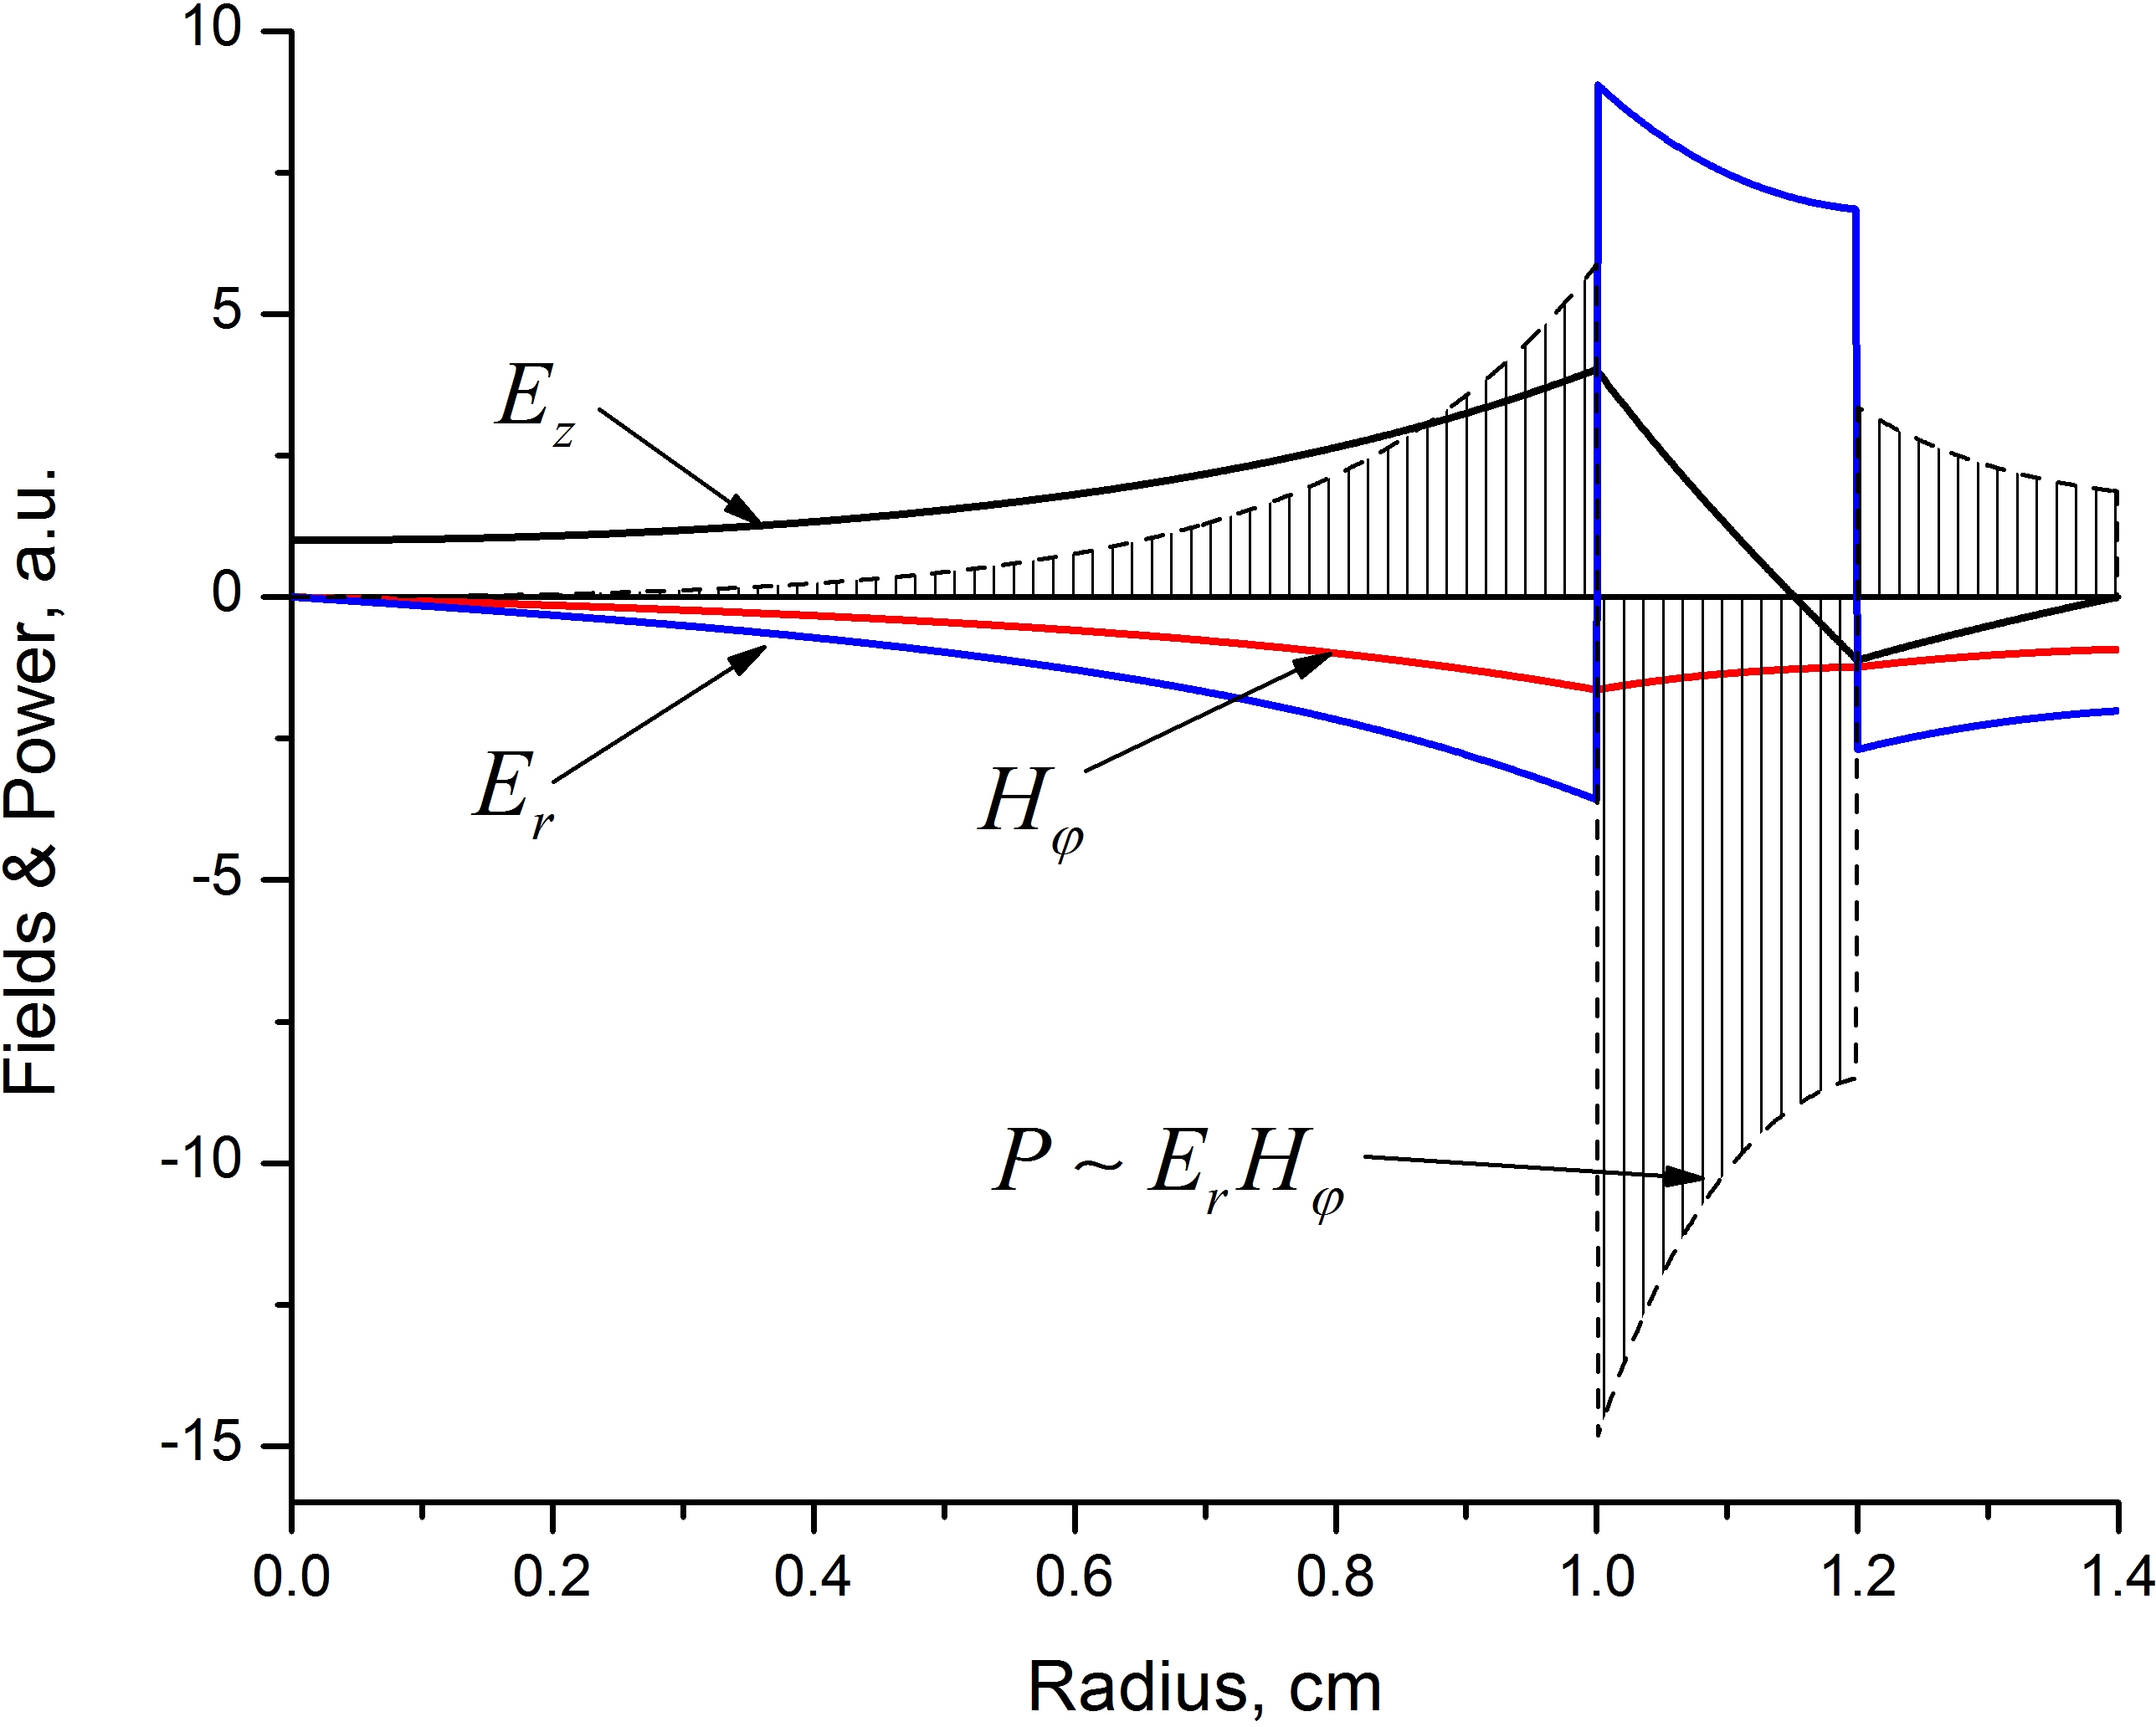
Indeed, for the case considered, the perturbation, produced by an electromagnetic pulse, remains in a tubular plasma in the form of a backward surface wave. The wave number and the frequency of the exited surface wave are defined by Čherenkov’s resonance condition , as shown in Fig. 5. Here and are assigned to the backward surface wave and is the group velocity of the electromagnetic pulse. This wave can persist in the plasma for a long time after the pulse passage. Radial distribution of the electric and magnetic fields of this backward propagating surface wave is shown in Fig 7.
Axially-symmetric surface waves with negative group velocity in waveguides containing a plasma column in a dielectric tube, separated from the conducting wall, were considered in [14]. Backward surface waves in a waveguide with a step-wise annular plasma column, similar to that considered in this article, were studied in [15]. It was shown here that the backward and forward propagating modes are associated with the inner and outer plasma surfaces, respectively. Surface waves in waveguides filled with smoothly distributed inhomogeneous plasma were studied in [16, 17]. It was shown that the absence of sharp boundaries between different layers leads to collision-less dissipation of the surface waves. The reason is the presence of resonant electrons in the smooth transition plasma layer.
Negative group velocity of the surface wave means that the wave, excited along the plasma-filled section of the waveguide, propagates in the opposite direction (upstream) towards the input window. Here the wave is reflected and propagates towards the downstream window. Because the phase velocity of the reflected wave is negative, these two incident and reflected waves form a standing wave near the input window. Electrons, oscillating in the electric field of the standing wave antinodes, can excite and/or ionize molecules of the neutral gas, producing a periodically distributed plasma glow.
It is worth noting that, under certain conditions, stationary striations in a glow discharge are the result of interference between two ionization waves [18, 19, 20]. Unlike backward-propagating surface waves, ionization waves are excited only in the discharge current and disappear immediately after current interruption.
As shown in the Sect. IV, the process of the plasma creation by the microwave pulse can be roughly divided into two phases. Initially, plasma is created in a narrow layer near the waveguide boundary. When the electron Langmuir frequency in this layer approaches the cut-off frequency , the plasma density growth slows down, and the second phase of the process begins. Now, ionization leads to widening of this layer with approximately constant plasma density. In the step-wise model, Eq. (4), it means that and decrease with time. Simultaneously, the cut-off frequency of the plasma-filled waveguide grows and, if the pulse duration is long enough, it reaches the incoming wave frequency (which, in the experiment, is close to the cut-off frequency of the empty waveguide, ) while the retained part of the pulse is reflected from the waveguide input window.
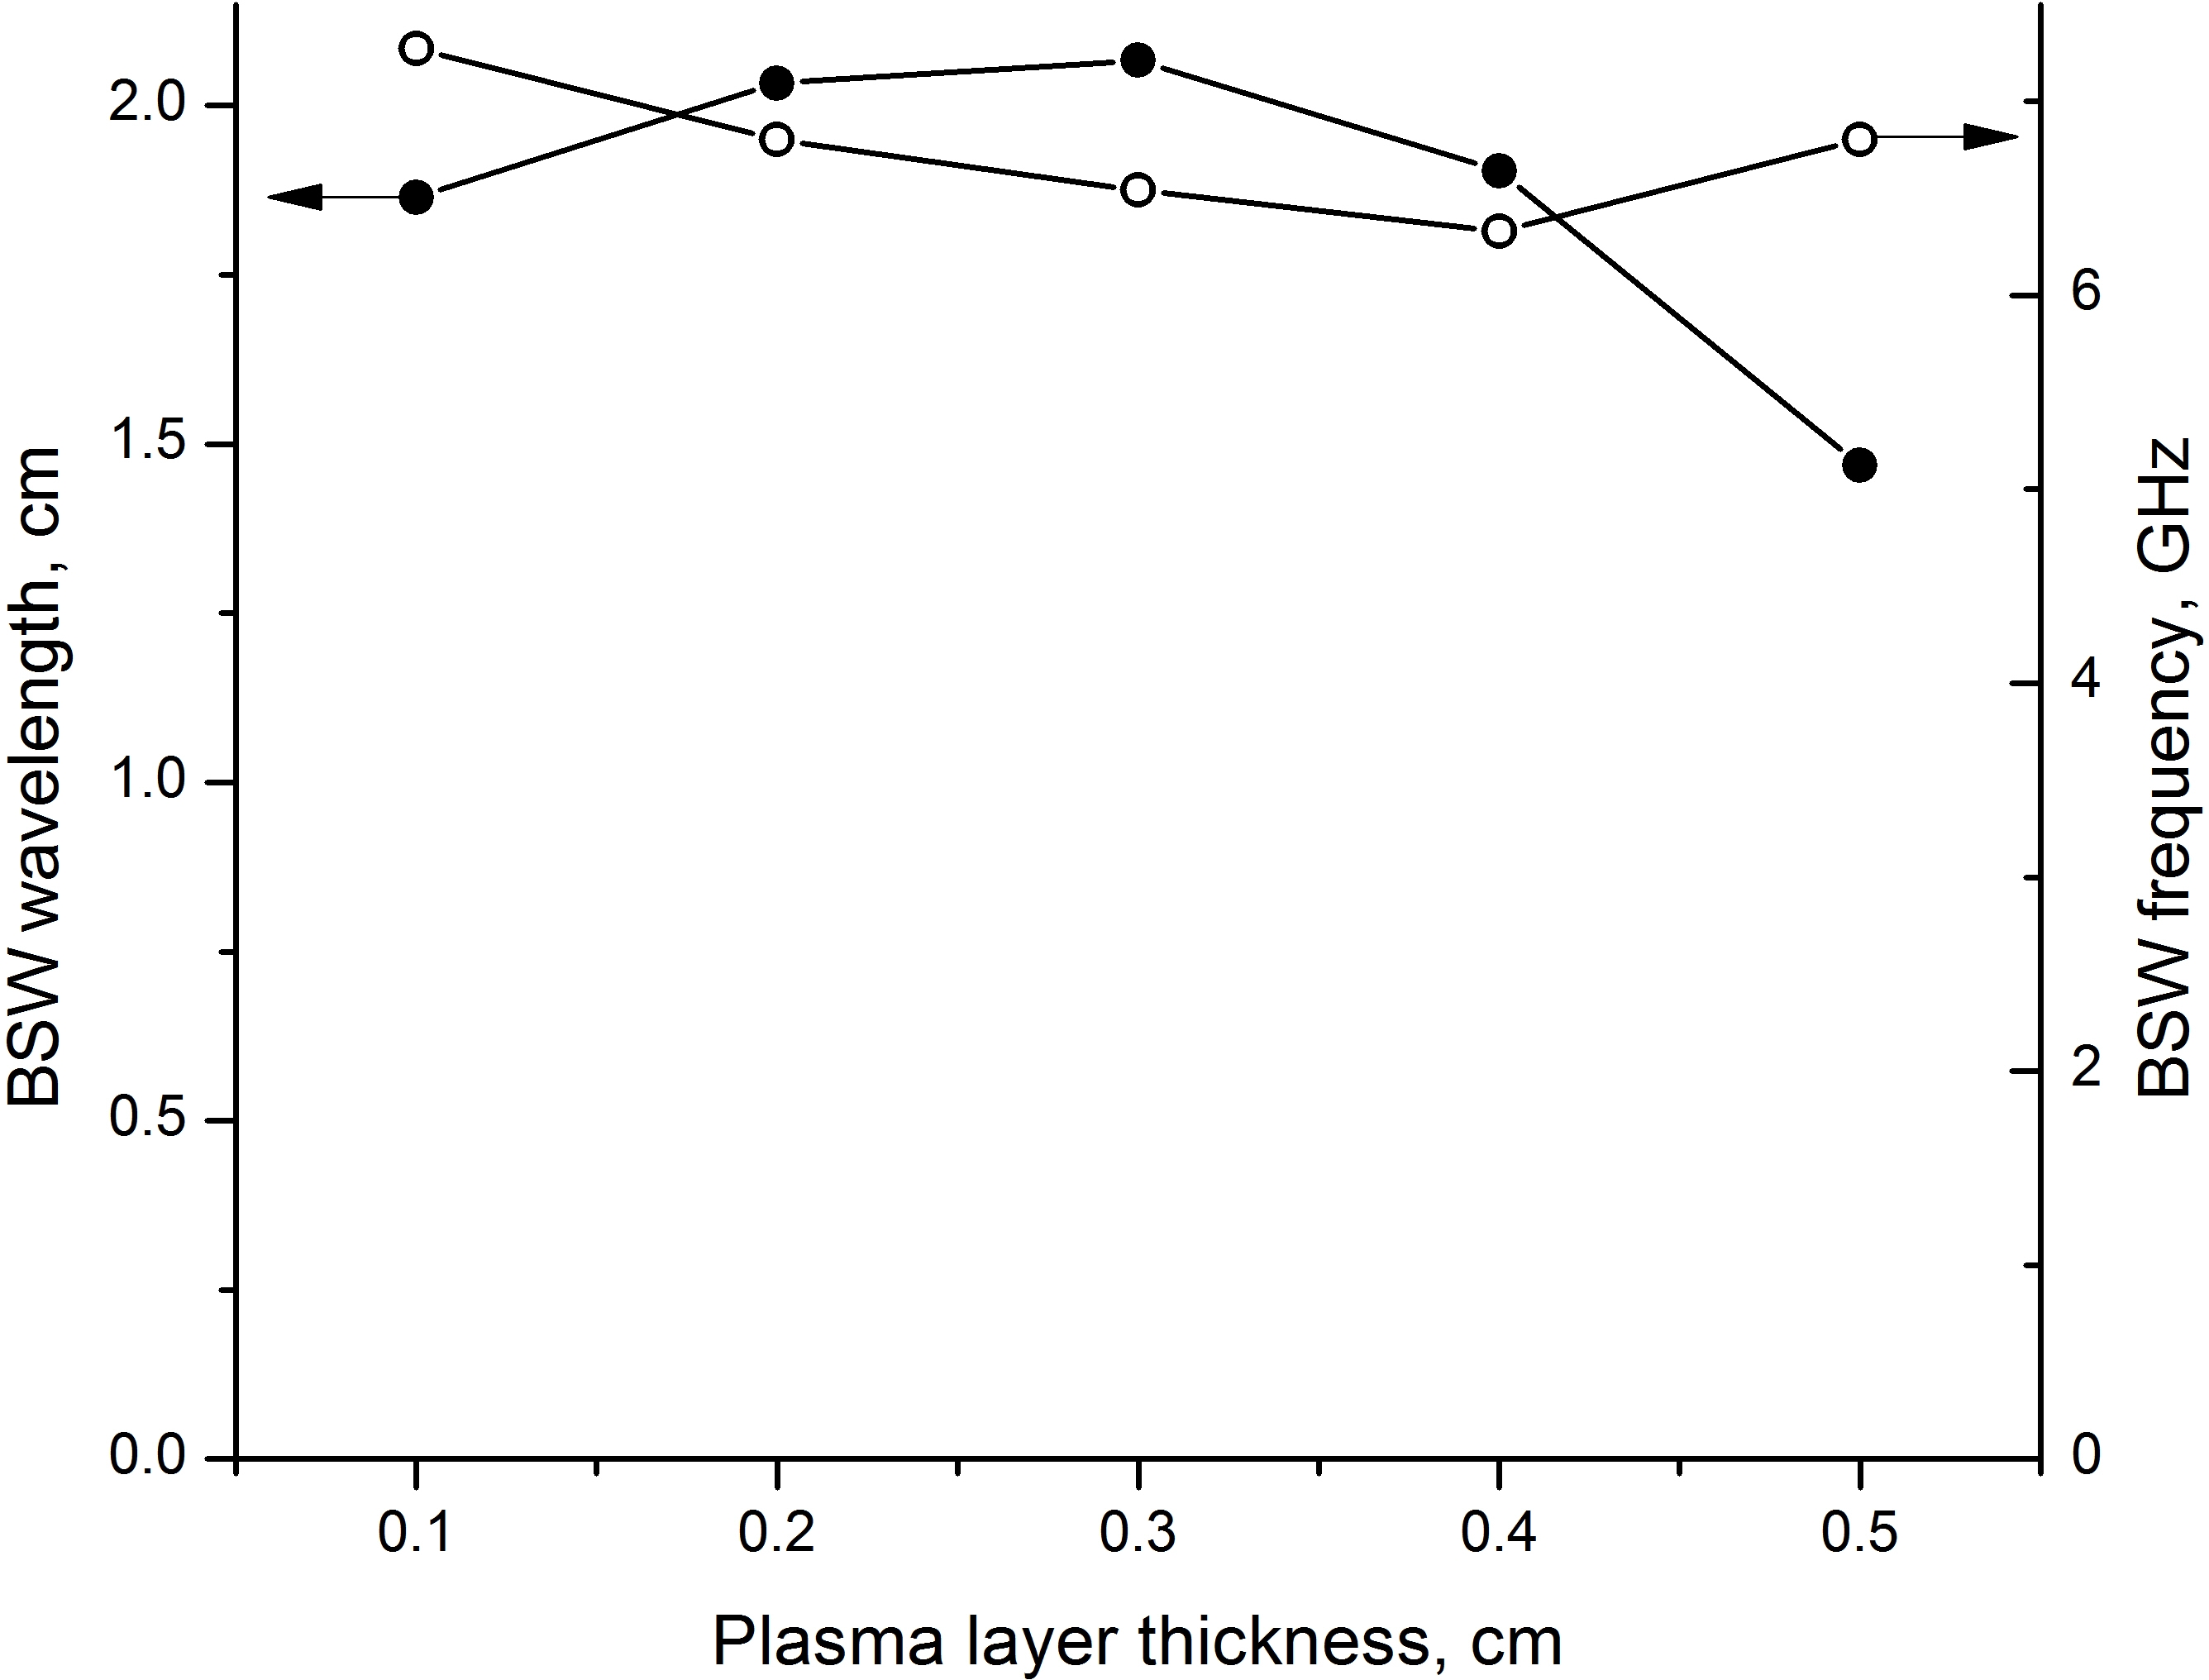
When the layer thickness varies with time, the pulse group velocity and the backward surface wave dispersion characteristics vary too. In this case, effective excitation of the surface wave is possible if the resonant frequency and wave number remain essentially unchanged during the pulse duration. In Fig. 8 the dependence of the resonant surface wave frequency and wavelength on the plasma layer thickness demonstrate relatively small dispersion. The characteristic wavelength is about 2 cm, so the distance between nodes of the standing wave is about 1 cm. Taking into account the roughness of the model, one can consider that this value agrees well with the experimentally observed period of the glow ( 1.8 cm).
VI Discussion
The resonant excitation of a wave of any nature by a moving perturbation is effective when the characteristic spatial scale of the perturbation is small compared with its wavelength, or otherwise, the amplitude of the wake behind the perturbation is small. As seen in Fig. 5, the expected wavelength of the backward surface wave is smaller than the electromagnetic pulse wavelength and much smaller than the longitudinal dimension of the pulse. Thus, the electromagnetic pulse with parameters corresponding to the experimental conditions, moving through a tubular plasma, can excite a surface wave of a small amplitude. Results of numerical simulation, presented in Fig. 9, confirm this conclusion.
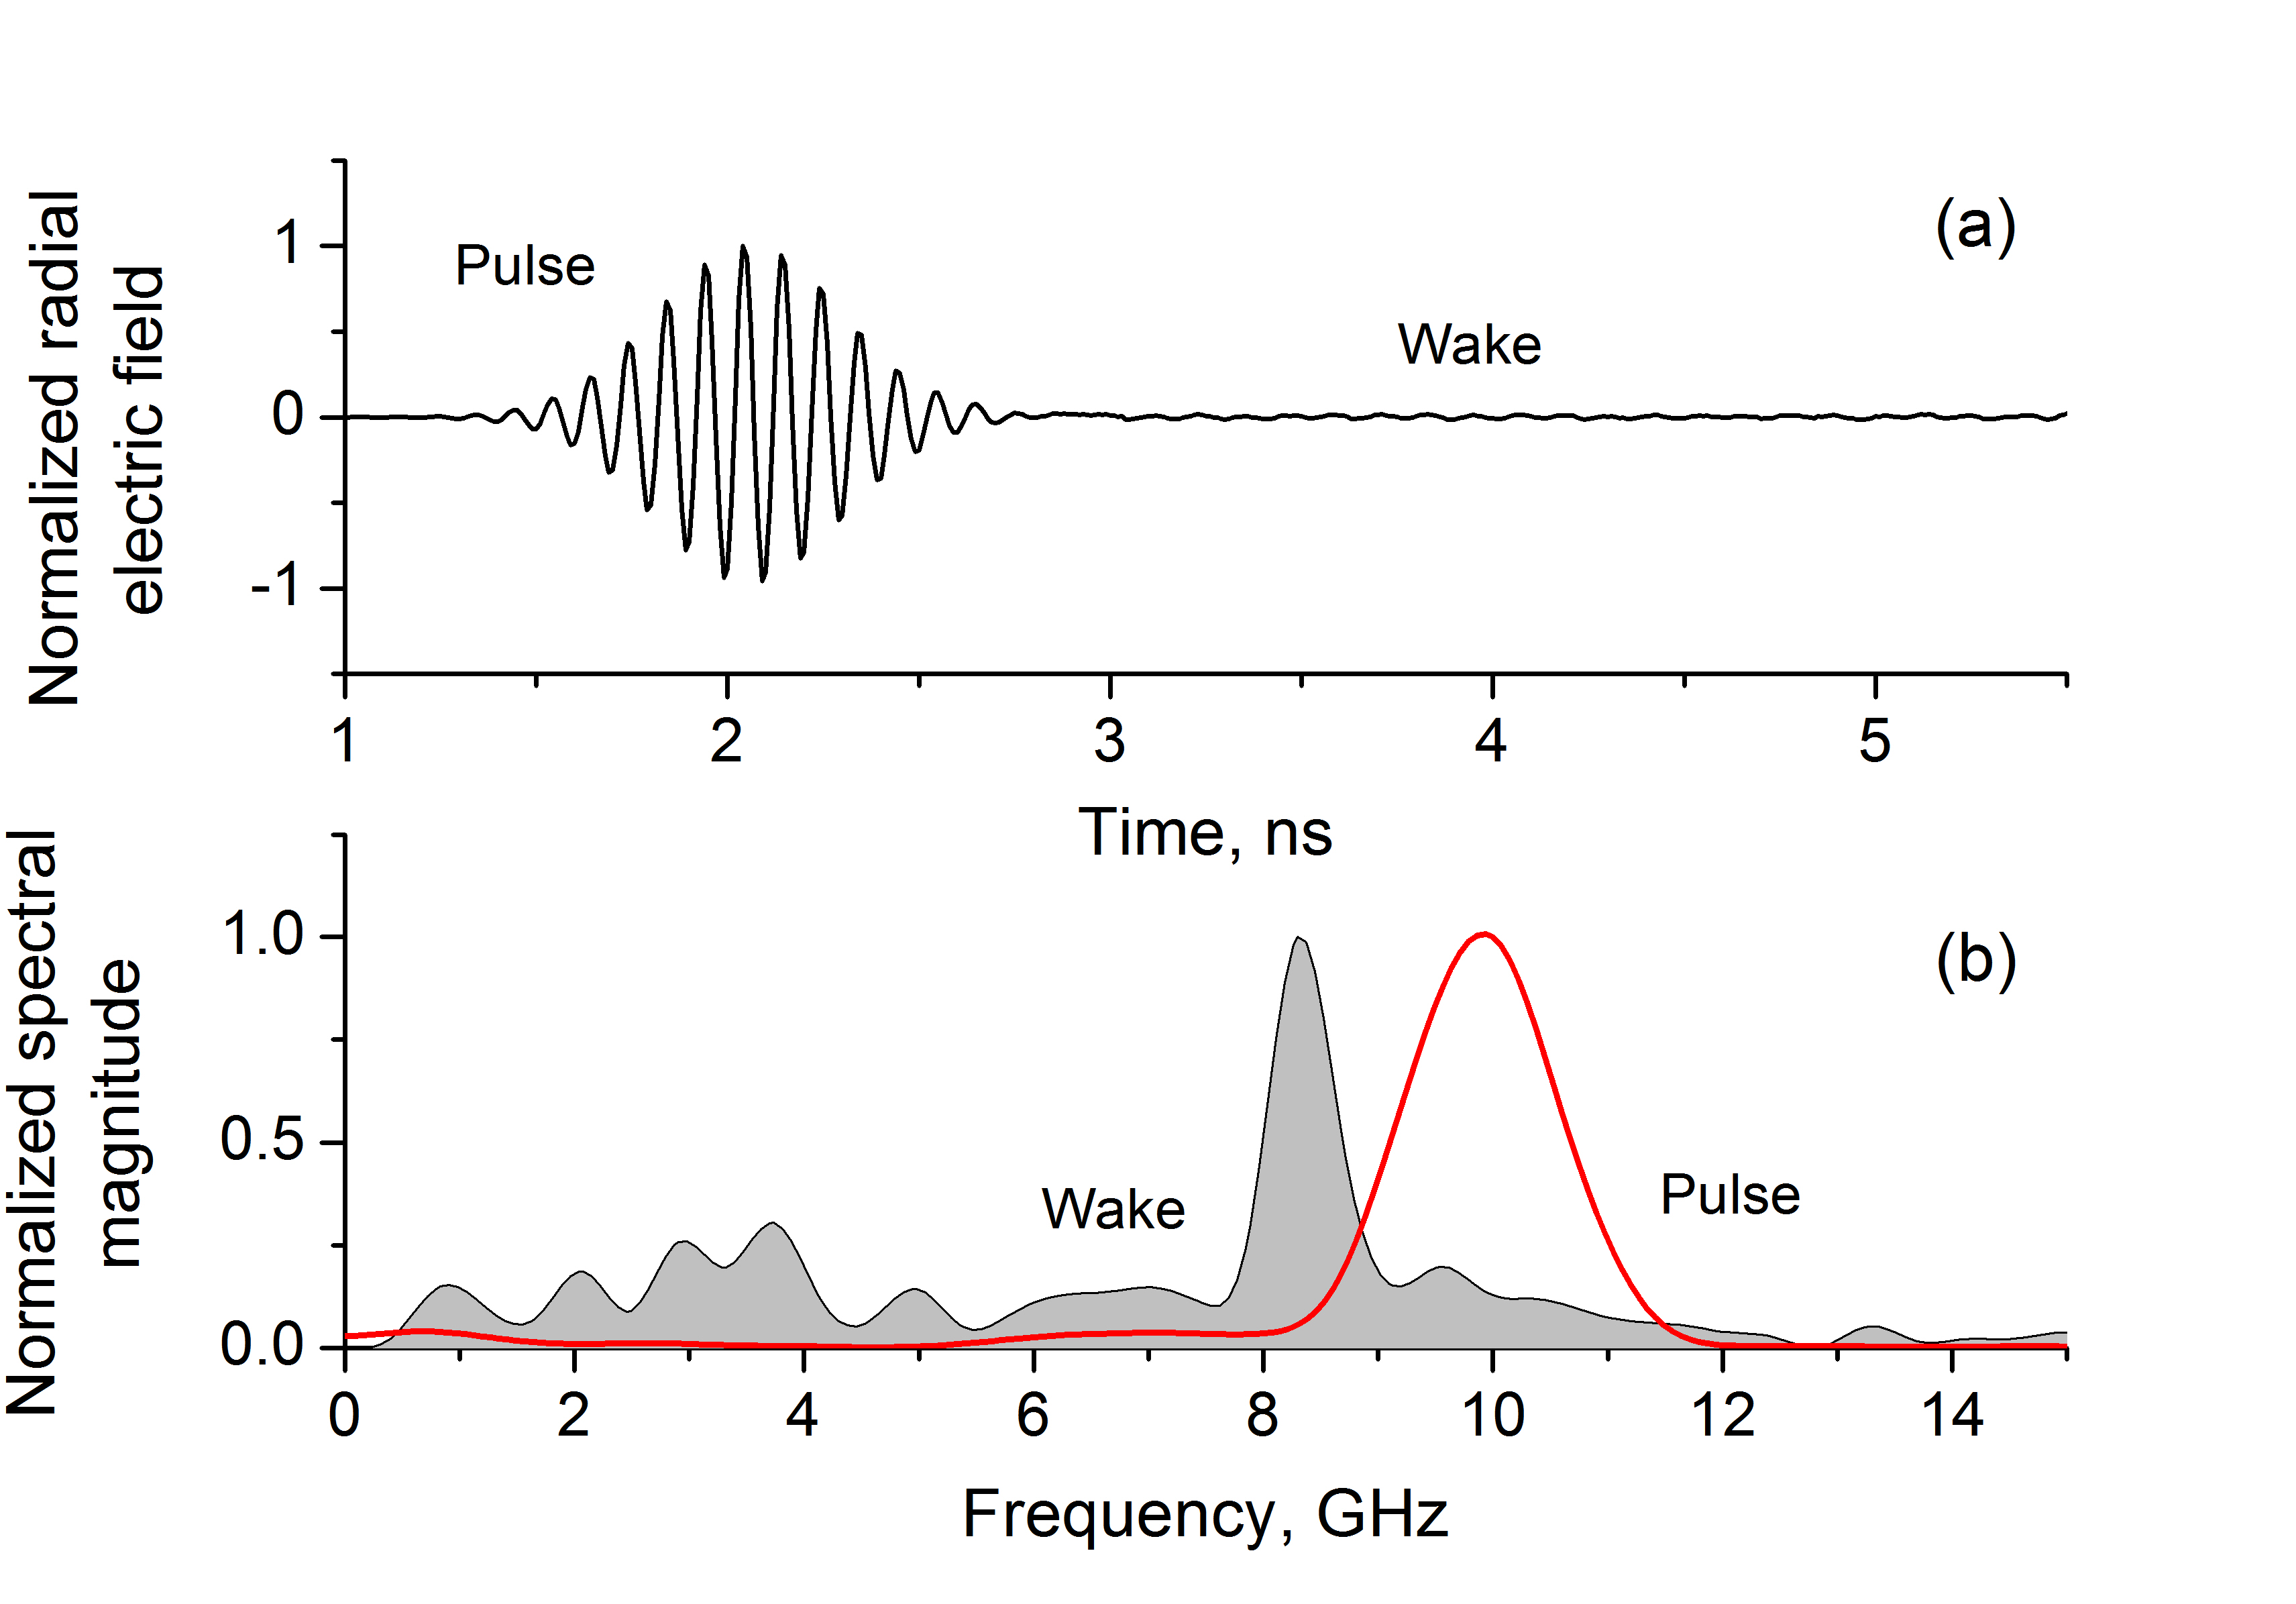
The main peak of the wake spectrum, depicted in Fig. 9, is located in the region of 8-9 GHz, that is in good agreement with Fig. 8. Note that the spectral width of the wake is smaller than that of the pulse because of the following reason. A short pulse (such as that considered) is characterized by a wide spread of group velocity values rather than a single velocity. Consequently, the resonant condition is satisfied for a set of surface waves, but, due to the weak dependence (see Fig. 5), the spectrum of the excited surface waves remains narrow. This property of the wake spectrum and its position strongly supports the backward flowing surface wave description.
Despite that the excitation of the backward flowing surface wave by the electromagnetic pulse is confirmed in numerical simulations, the assumption that this wave is responsible for the observed spatially-periodic plasma glow casts doubt, because of the small amplitude of the surface wave. This discrepancy can be resolved in the following way.
In the performed numerical simulation it was assumed that the plasma density is stationary and homogeneously distributed along the waveguide. However, in the experiment the plasma is created by the propagating electromagnetic pulse itself. Then, the temporal (and longitudinal) profile of plasma density, which is shown in Fig. 4, looks like shock wave and propagates along the waveguide together with the electromagnetic pulse. In other words, the surface wave propagates in the media with time-dependent, traveling parameters. The characteristic spatial scale of the plasma density variation is much smaller than the pulse length and can be of the order of the surface wave wavelength. The amplitude of the resonant wave, excited by such abrupt traveling variation of the medium parameters, is much larger compared to the case, when the medium parameters are varied smoothly [21, 22]. Due to this reason, one can assume that the stationary periodic plasma glow is indeed associated with the excitation of the backward surface wave.
VII Conclusions
To summarize, it was shown that a sub-nanosecond microwave pulse of hundreds MW power propagating in a neutral gas filled cylindrical waveguide produces a tubular plasma, with the density mainly concentrated in a thin layer near the waveguide wall. A surface wave with negative group velocity can be excited in such plasma-filled waveguide. The wake in the form of this backward propagating surface wave remains in the waveguide long after the pulse’s passage. A backward propagating surface wave is reflected from the input window and in combination with the incident wave forms a standing wave. Plasma electrons, oscillating in the electric field of this standing wave’s antinodes, excite and/or ionize molecules of the neutral gas, producing the experimentally observed periodically distributed plasma glow along the waveguide.
This scenario is based on a theoretical model supported by numerical simulations and analysis. We cannot present indisputable experimental facts that the observed spatially-periodic plasma glow appeared exactly in that way as it is described in the paper. Should this be the case then this phenomenon would be the first non-direct observation of the backward surface wave, propagating along a tubular plasma in the absence of magnetic field. In future experiments we will attempt to confirm the mechanism behind this interesting phenomenon.
Acknowledgements
The authors are grateful to E. Flyat for his technical support. This study was supported by Pazy Foundation Grant No. 2032056.
References
- [1] T. Tajima and J. M. Dawson, Phys. Rev. Lett. 43, 267 (1979).
- [2] E. Esarey, C. B. Schroeder, and W. P. Leemans, Rev.Mod. Phys. 81, 1229 (2009).
- [3] S. M. Hooker, Nature Photonics 7, 775 (2013).
- [4] T. Tajima and V. Malka, Plasma Phys. Control. Fusion 62, 034004 (2020).
- [5] A. A. Eltchaninov, S. D. Korovin, G. A. Mesyats, I. V. Pegel, V. V. Rostov, V. G. Shpak, and M. I. Yalandin, IEEE Trans. Plasma Sci. 32, 1093 (2004).
- [6] V. V. Rostov, I. V. Romanchenko, M. S. Pedos, S. N. Rukin, K. A. Sharypov, V. G. Shpak, S. A. Shunailov, M. R. Ul’Masculov, and M. I. Yalandin, Phys. Plasmas 23, 093103 (2016).
- [7] G. Shafir, Y. E. Krasik, Y. P. Bliokh, D. Levko, Y. Cao, J. G. Leopold, R. Gad, V. Bernshtam, and A. Fisher, Phys. Rev. Lett. 120, 135003 (2018).
- [8] Y. Cao, Y. P. Bliokh, J. G. Leopold, A. Li, G. Leibovitch, and Ya. E. Krasik, Phys. Plasmas 27, 053103 (2020).
- [9] Y. Cao, Y. P. Bliokh, V. Maksimov, J. G. Leopold, and Ya. E. Krasik, Phys. Rev. E 107, 045203 (2023).
- [10]
- [11] Y. Cao, J. G. Leopold, Y. P. Bliokh, and Ya. E. Krasik, Phys. Plasmas 25, 103101 (2018).
- [12] M. V. Kuzelev, F. Kh. Mukhametzyanov, M. S. Rabinovich, A. A. Rukhadze, P. S. Strelkov, and A. G. Shkvarunets, Sov. Phys. JETP 56, 780 (1982).
- [13] M. Châteauneuf, S. Payeur, J. Dubios, and J.-C. Kieffer, Appl. Phys. Lett. 92, 091104 (2008).
- [14] A. W. Trivelpiece, “Slow wave propagation in plasma waveguides,” Ph.D. Dissertation, California Institute of Technology, Pasadena-California, 1958; A. W . Trivelpiece, Slow Wave Propagation in Plasma Waveguides, San Francisco Press Inc. 1967.
- [15] S. F. Paik, Journal of Electronics and Control 13, 515 (1962).
- [16] M. V. Kuzelev, R. V. Romanov, and A. A. Rukhadze, Fiz. Plazmy 31, 172 (2005) [Plasma Phys. Rep. 31, 147 (2005)].
- [17] M. V. Kuzelev and N. G. Orlikovskaya, Fiz. Plazmy 40, 345 (2014) [Plasma Phys. Rep. 40, 276 (2014)].
- [18] A.W.M. Cooper, J.R.M. Coulter, and K.G. Emeléus, Nature 4619, 1327 (1958).
- [19] O. Štirand and Láska, Czech. J. Phys. B 17, 928 (1967).
- [20] T. Maruyama, S. Nishina, H. Kitamura, K. Itagaki, and H. Mizuochi, Contrib. Plasma Phys. 30, 497 (1990).
- [21] Yu.A. Kravtsov, Yu.I. Orlov, Geometric Optics of Inhomogeneous Media, Springer-Verlag, 1990.
- [22] N.S. Stepanov, Izv.VUZov Radiofizika, 36, 623 (1993) (in Russian).