Multimode resonance transition to collapsed snaking in normal dispersion Kerr resonators: Bright versus dark solitons
Abstract
We study the dynamics of Kerr cavity solitons in the normal dispersion regime, in the presence of an intracavity phase modulation. The associated parabolic potential introduces multimode resonances, which promote the formation of high-order bright solitons. By gradually reducing the potential strength, bright solitons undergo a transition into dark solitons. We describe this process as a shift from a multimode resonance to a collapsed snaking bifurcation structure. This work offers a comprehensive overview of cavity dynamics and may provide a potential pathway to access multi-stable states by effectively varying the phase modulation.
Temporal dissipative Kerr solitons (DKS) [1] have emerged as a significant research topic in the field of photonics over the past decade. In the frequency domain, DKS are associated with the generation and manipulation of coherent frequency combs [2, 3]. DKS have been effectively generated in passive ring Kerr resonators, by mainly using two platforms: microresonators [4] and macroscopic fiber rings [5]. The formation of DKS relies on a delicate equilibrium that encompasses both the counter-balance between dispersion and nonlinearity, as well as the balance between cavity loss and external driving field. The dynamics and stability of DKS have been the object of detailed analysis in a mean-field approximation. In this framework, the evolution of the field recirculating in a passive Kerr resonator is described by a driven and damped nonlinear Schrödinger equation (NLSE) [6, 7], also known as Lugiato-Lefever equation (LLE). With increasing pump intensity, the intracavity field exhibits a variety of instabilities, resulting in intricate spatiotemporal dynamics, that can manifest as periodic phenomena, such as breathers, and chaotic behaviors [5, 8, 9, 10, 11, 12, 13].
In Kerr resonators, it is well-known that in the anomalous dispersion regime, ”bright” DKS manifest as light pulses superimposed on a relatively low-intensity continuous wave (CW) background, maintaining their shape and energy throughout as they circulate within the cavity. In this context, single-peak DKS solutions can be computed by applying standard perturbation analysis to the conservative soliton solution of the NLSE [1]. In contrast, in a normal dispersion cavity, ”dark” DKS, characterized by localized intensity dips embedded within a relatively high-intensity background, can be formed [14]. Recent studies have shown that the presence of higher-order perturbations can bring about a fundamental change in the occurrence of bright and dark DKS, under various dispersion driving conditions. Notably, the effects of third- and fourth-order dispersion [15, 16, 17, 18], the influence of the stimulated Raman effect [19], and the interaction with frequency-dependent cavity losses [20] may result in the emergence of novel forms of localized states, or in the coexistence of bright and dark DKS. Furthermore, the occurrence of dark-bright DKS bound states have been observed by seeding two modes with dispersion of opposite signs [21].
In addition, intracavity phase modulation [e.g., via an electro-optical modulator (EOM)], offers an additional degree of control over DKS dynamics and serves as a valuable tool for investigating synthetic dimensions [22, 23]. Our recent studies in this framework have shown that the parabolic potential introduced by the EOM can lead to soliton stabilization in the anomalous regime [24], and the emergence of a host of new solutions, such as high-order DKS, chaoticons [25] and 3D DKS [26]. In anomalous dispersion, DKS will always drift along an increasing phase gradient[27]. Therefore, attractive localization for bright DKS occurs at the maximum position of parabolic potential.
In this letter, we remarkably show that bright DKS can be generated even in a normal dispersion cavity with the presence of local minimal phase modulation. Our theoretical investigation demonstrates the significant influence of the parabolic potential in the transition between bright and dark DKS, which occurs within a dissipative Kerr resonator operating under normal dispersion. The introduction of the parabolic potential facilitates the generation of multimode bright DKS. By reducing the potential strength, the temporal duration of high-order bright DKS grows larger, eventually transitioning towards dark DKS. This phenomenology is comprehensively analyzed by using a systematic bifurcation analysis, which permits to establish a clear connection between the multimodal bifurcation structure and the collapsed homoclinic snaking, that appears in the absence of external phase modulation [28].
In the mean-field approximation, the evolution of the light field in a coherently driven and phase-modulated passive cavity in the normal dispersion regime obeys the dimensionless equation [24, 25]
| (1) |
where is the slowly varying field envelope, and are fast and slow time, respectively. The term describes second-order normal dispersion, and represent linear loss and cavity phase detuning, is the Kerr nonlinear term, and is the driving pump field amplitude. The synchronous parabolic temporal potential from the EOM is introduced, where is the phase modulation curvature [25]. It is worth noting that the potential shape can be readily adjusted by designing the voltage profile incorporated into the EOM [29]. This flexibility allows for the implementation of various potential shapes, such as a parabola, linear, sinusoidal, or other desired profiles. By changing the coordinates meaning, Eq. (1) also describes spatial bottle resonators [30].
To perform the bifurcation analysis of steady-state soliton solutions (i.e., ) of Eq.(1), we apply a combination of numerical techniques, including direct numerical simulations (DNS), path-continuation techniques through pde2path, and numerical linear stability analysis [31].
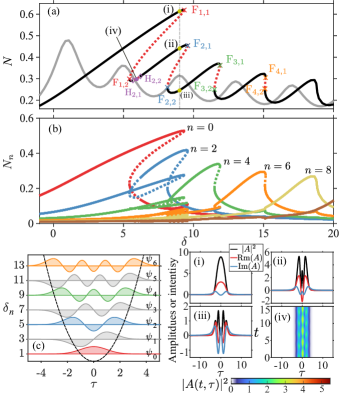
To illustrate the essential characteristics arising from the parabolic potential and Kerr nonlinearity, Fig. 1(a) compares the bifurcation structure of stationary solutions of Eq.(1) either in the absence or in the presence of the Kerr nonlinear term , as a function of detuning , for the fixed . Here, we plot the modification of the average field amplitude , with , as a function of for a time domain window . The gray curve in Fig. 1(a) shows the modification of in the absence of the Kerr nonlinearity. This curve consist of many peaks, equally spaced at , with a gap . This pattern already illustrates the presence of multimode resonances (MMR), indicating that the cavity can sustain higher energy levels at these specific resonance points.
These MMR find their precise determination in the eigenvalues and eigenmodes of the linear system operator . These quantities emerge as a result of the intricate interplay between second-order dispersion and the parabolic potential. The modes obey the linear eigenvalue equation , enabling us to obtain the eigenvalues and eigenmodes , which are characterized by Hermite-Gaussian (HG) functions, namely , where represents the Hermite polynomial, and is the scaling ratio. The relation among eigenmodes , eigenvalues , and their parabolic potential is illustrated in Fig. 1(c). Homogeneous pumping effectively suppresses resonances of asymmetric HG modes, resulting in a resonance gap of between consecutive resonances [25]. Note that in this work, we focus on scenarios where the field is located at the minimal phase modulation point () within the normal dispersion regime (). The signs of dispersion and potential in Eq.(1) are opposite, when compared with the model presented in Ref.[25]. As a consequence, the linear eigenvalues are positive, while the eigenfunctions exhibit the same profiles.
With the inclusion of the Kerr effect, noticeable changes occur in the resonance peaks [see the black curve in Fig. 1(a)]. This is because the Kerr effect introduces an intensity-dependent phase modulation, thus altering the effective detuning as . For resonance peaks with higher intensity , a larger detuning is preferred, in order to compensate for the phase modification caused by , resulting in the tilting of the resonance peaks. These tilts lead to overlapping portions of the solutions on the right side of the resonance peaks. Consequently, fold bifurcations (FB) arise (see and marked at resonance peak ), leading to the emergence of branches of multi-stable states. The solid (dashed) curves in the bifurcation diagram represent stable (unstable) solutions, which have been verified by a linear stability analysis.
Figures 1(i,ii,iii) show three stable solutions for the same value of detuning . Each solution exhibits a different number of peaks: 1, 3, and 5, respectively. These differences originate from the dominance of a Hermite-Gaussian (HG) mode with index . To verify this, we may project the field onto the HG mode basis [see Fig. 1(b)]. This allow for determining the mode amplitudes , which are represented in Fig. 1(b) in terms of the averaged mode amplitude . As increases, the component of mode exhibits a significant growth, particularly when approaches the corresponding resonance peak . This indicates that each resonance is predominantly associated with a given mode. Furthermore, we observe the existence of breather solutions within the two Hopf bifurcations (HB) and which occur at the second resonance peak [see Fig. 1(a)].
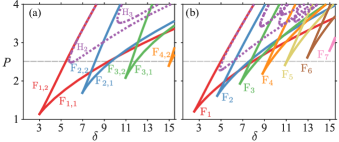
By increasing the pump strength, more energy gets coupled into the cavity, leading to potentially richer dynamics. To explore the impact of pump strength on the system behavior, we constructed phase diagrams as in Fig. 2, by varying both and the detuning . In Fig. 2(a), the FB-point-connected curves for each resonance peak are displayed, for . It is observed that increasing the pump results in larger tilts for all resonance peaks, and a higher number of occurrences of FB at higher-order resonances. Additionally, larger regions for breathers are observed as the pump is increased (see the dashed purple curves representing the HB-point-connected curves and at resonances ). On the other hand, decreasing the pump strength eliminates multiple stable and unstable states, leading the cavity system to gradually return to its linear state.
The strength of the potential has a significant impact on the cavity dynamics: not only the potential determines the eigenvalue , but it also dictates the scaling factor for the size of the HG modes. This implies that reducing the potential strength leads to a denser distribution of resonance points in , while resulting in a wider field distribution. To examine this effect, we have calculated the phase diagram with a potential strength of , corresponding to the linear resonance separation . As depicted in Fig. 2(b), the phase diagram exhibits similar dynamics to Fig. 2(a), but with a greater number of FB (solid curves) and HB (dashed purple curves), occurring at higher-order resonances within the same region.
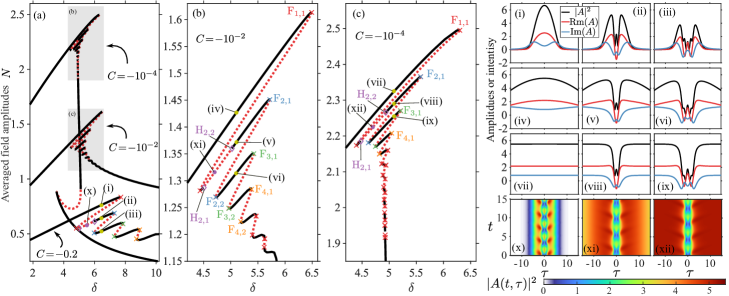
At this point, a natural question arises, regarding the bifurcation structures and DKS profiles when the potential strength is reduced: do these high-order resonances vanish, and how do high-order DKS modify? To address this question, in Fig. 3(a) we plot the bifurcation diagrams for progressively reduced potential strengths, namely , corresponding to the eigenvalue differences , respectively.
For , the bifurcation diagram exhibits a similar pattern to Fig. 1(a), but within a narrower detuning region. Three individual solutions with , marked (i-iii) in Fig. 3(a), are plotted in Fig. 3(i-iii). When compared with the solutions in Fig. 1(i-iii), it is evident that the solutions in Fig. 3(i-iii) have wider temporal extension. For the reduced strength , the close-up view of Fig. 3(a) shown in Fig. 3(b) exhibits a striking resemblance in the bifurcation structure to the previous scenarios. Now the linear eigenvalue separation becomes very small , while the mode scale is very large . As a result, the full width at half-maximum of the fundamental mode increases to , and the high-order modes become much wider. Figures 3(iv-vi) showcase examples of DKS states at various branches, specifically for . Note that, these states seem dark DKS emerging within a non-uniform domain, and may be similar to those arising in pulse-pumped cavities [32].
By further reducing , the bifurcation structure in Fig. 3(b) tends to rotate to the right leading, eventually, to the collapsed snaking shown in Fig. 3(a),(c) for to [28]. This structure consists of a sequence of DKS state branches that oscillate back and forth, in a damped fashion, around the Maxwell point of the system (). Around this point, dark DKS, like those depicted in Fig. 3(vii, viii, ix) for originate due to uniform front locking [28, 33].
Looking at it from another perspective, when increasing the potential strength, the uniform background field on the two sides of the dark DKS undergoes deformation, resulting in a smooth transition to bright DKS. Such potential-induced confinement also applies to breather solutions. Breathers, marked by (x, xi, xii) in Fig. 3(a, b, c), are plotted in Fig. 3 (x, xi, xii), showcasing the impact of the potential on their formation. In the bifurcation diagram, the potential effectively separates all multi-stable state branches in a collapse snaking structure towards the high detuning regime, leading to an MMR structure.
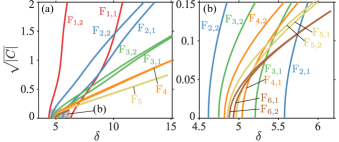
The transition dynamics between high and low potential strength can be effectively visualized through the vs. phase diagrams in Fig. 4. In Fig. 4(a), we plot the FB-point-connected curves for each resonance peak , while varying and . A zoomed region is shown in Fig. 4(b). Increasing potential strength weakens the influence of Kerr nonlinearity, reducing the resonance tilts and causing the gradual disappearance of the FB-point-connected curves [see in 4(a) and in 4(b)]. Conversely, reducing causes the resonances to converge towards the Maxwell point . Notably, lower potential strengths give rise to the appearance of additional FB points (only 6 FB curves are plotted here). Further decreasing , higher-order resonances undergo the evolution that ultimately leads to the emergence of a collapse-snaking structure.
In this study, we utilized bifurcation analysis to uncover the transition from bright to dark DKS in a driven passive nonlinear cavity in the normal dispersion regime with a parabolic potential. Our analytical study of the linear eigenmodes demonstrated how the parabolic potential localizes the field even in the presence of normal cavity dispersion, leading to the emergence of high-order modes and resonances in the system. These resonances, affected by Kerr nonlinearity, lead to the formation of high-order bright multimode DKS and breathers. Furthermore, by reducing the potential strength, the DKS bifurcation structure shows denser resonances and an increased temporal duration of bright DKS. Eventually, the former converges to the well-known collapse snaking structure, and the latter modify into dark DKS. Our study not only provides physical insight into the nonlinear dynamics modification from MMR to collapse snaking, but also offers a pathway to realize multi-stable states in such cavity systems.
Acknowledgements
This work was supported by EU under the NRRP of NextGenerationEU, partnership on “Telecommunications of the Future” (PE00000001 - “RESTART”), Marie Sklodowska-Curie Actions (101023717,101064614), Sapienza University of Rome Additional Activity for MSCA (EFFILOCKER).
References
- Wabnitz [1993] S. Wabnitz, Opt. Lett. 18, 601 (1993).
- Herr et al. [2014] T. Herr, V. Brasch, J. D. Jost, C. Y. Wang, N. M. Kondratiev, M. L. Gorodetsky, and T. J. Kippenberg, Nat. Photonics 8, 145 (2014).
- Pasquazi et al. [2018] A. Pasquazi, M. Peccianti, L. Razzari, D. J. Moss, S. Coen, M. Erkintalo, Y. K. Chembo, T. Hansson, S. Wabnitz, P. Del’Haye, X. Xue, A. M. Weiner, and R. Morandotti, Phys. Rep. 729, 1 (2018).
- Kippenberg et al. [2011] T. J. Kippenberg, R. Holzwarth, and S. A. Diddams, Science 332, 555 (2011).
- Leo et al. [2010] F. Leo, S. Coen, P. Kockaert, S.-P. Gorza, P. Emplit, and M. Haelterman, Nat. Photonics 4, 471 (2010).
- Haelterman et al. [1992] M. Haelterman, S. Trillo, and S. Wabnitz, Opt. Commun. 91, 401 (1992).
- Coen et al. [2013] S. Coen, H. G. Randle, T. Sylvestre, and M. Erkintalo, Opt. Lett. 38, 37 (2013).
- Coillet and Chembo [2014] A. Coillet and Y. K. Chembo, Chaos: An Interdisciplinary Journal of Nonlinear Science 24, 013113 (2014).
- Anderson et al. [2016] M. Anderson, F. Leo, S. Coen, M. Erkintalo, and S. G. Murdoch, Optica 3, 1071 (2016).
- Liu et al. [2017] Z. Liu, M. Ouali, S. Coulibaly, M. G. Clerc, M. Taki, and M. Tlidi, Opt. Lett. 42, 1063 (2017).
- Lucas et al. [2017] E. Lucas, M. Karpov, H. Guo, M. L. Gorodetsky, and T. J. Kippenberg, Nat. Commun. 8, 736 (2017).
- Chen et al. [2018] W. Chen, B. Garbin, A. U. Nielsen, S. Coen, S. G. Murdoch, and M. Erkintalo, Opt. Lett. 43, 3674 (2018).
- Bao et al. [2018] C. Bao, Y. Xuan, C. Wang, A. Fülöp, D. E. Leaird, V. Torres-Company, M. Qi, and A. M. Weiner, Phys. Rev. Lett. 121, 257401 (2018).
- Xue et al. [2015] X. Xue, Y. Xuan, Y. Liu, P.-H. Wang, S. Chen, J. Wang, D. E. Leaird, M. Qi, and A. M. Weiner, Nat. Photonics 9, 594 (2015).
- Tlidi and Gelens [2010] M. Tlidi and L. Gelens, Opt. Lett. 35, 306 (2010).
- Parra-Rivas et al. [2017] P. Parra-Rivas, D. Gomila, and L. Gelens, Phys. Rev. A 95, 053863 (2017).
- Talla Mbé et al. [2017] J. H. Talla Mbé, C. Milián, and Y. K. Chembo, Eur. Phys. J. D 71, 196 (2017).
- Li et al. [2020] Z. Li, Y. Xu, S. Coen, S. G. Murdoch, and M. Erkintalo, Optica 7, 1195 (2020).
- Parra-Rivas et al. [2021] P. Parra-Rivas, S. Coulibaly, M. G. Clerc, and M. Tlidi, Phys. Rev. A 103, 013507 (2021).
- Huang et al. [2015] S.-W. Huang, H. Zhou, J. Yang, J. McMillan, A. Matsko, M. Yu, D.-L. Kwong, L. Maleki, and C. Wong, Phys. Rev. Lett. 114, 053901 (2015).
- Zhang et al. [2022] S. Zhang, T. Bi, G. N. Ghalanos, N. P. Moroney, L. D. Bino, and P. Del’Haye, Phys. Rev. Lett. 128, 10.1103/PhysRevLett.128.033901 (2022).
- Tusnin et al. [2020] A. K. Tusnin, A. M. Tikan, and T. J. Kippenberg, Phys. Rev. A 102, 023518 (2020).
- Englebert et al. [2023] N. Englebert, N. Goldman, M. Erkintalo, N. Mostaan, S.-P. Gorza, F. Leo, and J. Fatome, Nat. Phys. 10.1038/s41567-023-02005-7 (2023).
- Sun et al. [2022a] Y. Sun, P. Parra-Rivas, M. Ferraro, F. Mangini, M. Zitelli, R. Jauberteau, F. R. Talenti, and S. Wabnitz, Opt. Lett. 47, 6353 (2022a).
- Sun et al. [2023] Y. Sun, P. Parra-Rivas, M. Ferraro, F. Mangini, and S. Wabnitz, arXiv:2305.00487 10.48550/arXiv.2305.00487 (2023).
- Sun et al. [2022b] Y. Sun, P. Parra-Rivas, C. Milian, Y. V. Kartashov, M. Ferraro, F. Mangini, M. Zitelli, R. Jauberteau, F. R. Talenti, and S. Wabnitz, arXiv:2212.13052 (2022b).
- Erkintalo et al. [2022] M. Erkintalo, S. G. Murdoch, and S. Coen, J. R. Soc. N. Z. 52, 149 (2022).
- Parra-Rivas et al. [2016] P. Parra-Rivas, D. Gomila, E. Knobloch, S. Coen, and L. Gelens, Opt. Lett. 41, 2402 (2016).
- Copie et al. [2023] F. Copie, P. Suret, and S. Randoux, Optics Communications 545, 129647 (2023).
- Oreshnikov and Skryabin [2017] I. Oreshnikov and D. V. Skryabin, Opt. Express 25, 10306 (2017).
- Uecker et al. [2014] H. Uecker, D. Wetzel, and J. D. Rademacher, Numerical Mathematics 7, 58 (2014).
- Garbin et al. [2017] B. Garbin, Y. Wang, S. G. Murdoch, G.-L. Oppo, S. Coen, and M. Erkintalo, The European Physical Journal D 71, 240 (2017).
- Schelte et al. [2019] C. Schelte, A. Pimenov, A. G. Vladimirov, J. Javaloyes, and S. V. Gurevich, Opt. Lett. 44, 4925 (2019).