Formulating A Strategic Plan Based On Statistical Analyses And Applications For Financial Companies Through A Real-World Use Case
The Institute of Electrical and Electronics Engineers
Senior Member IEEE
samansarraf@ieee.org
Abstract
Business statistics play a crucial role in implementing a data-driven strategic plan at the enterprise level to employ various analytics where the outcomes of such a plan enable an enterprise to enhance the decision-making process or to mitigate risks to the organization. In this work, a strategic plan informed by the statistical analysis is introduced for a financial company called LendingClub, where the plan is comprised of exploring the possibility of onboarding a big data platform along with advanced feature selection capacities. The main objectives of such a plan are to increase the company’s revenue while reducing the risks of granting loans to borrowers who cannot return their loans. In this study, different hypotheses formulated to address the company’s concerns are studied, where the results reveal that the amount of loans profoundly impacts the number of borrowers charging off their loans. Also, the proposed strategic plan includes onboarding advanced analytics such as machine learning technologies that allow the company to build better generalized data-driven predictive models.
Keywords Strategic Plan, Statistical Analysis, Financial Companies, Cloud Computing
1 Introduction
Formulating a strategic plan aligned with a company’s business scope allows the company to explore data-driven ways of business improvement and risk mitigation quantitively while utilizing collected data to perform statistical applications. The company’s business leadership generally organizes joint meetings with internal or external data analysis teams to design a plan for executing business-related statistical analysis. Such projects demonstrate that the company should invest in what areas and adjust the budget for business verticals with low revenue. Furthermore, statistical applications can determine the logic of how to improve staff performance in the workplace.
LendingClub, as a peer-to-peer lending company, offers loans and investment products in different sectors, including personal and business loans, automobile loans, and health-related financing loans. LendingClub’s business model comprises three primary players: borrowers, investors, and portfolios for issued loans.
LendingClub is about expanding the statistical analytics that consists of infrastructure and software algorithm applications to develop two meaningful solutions ultimately: a) estimating durations in which clients will pay off loans; and b) 30-minute loan approval decision-making. To implement these two capabilities, the company has collected data on loans that were granted or rejected over 12 years, including 145 attributes and more than 2 million observations, where 32 features have no missing values across the dataset.
To achieve its ultimate targets, LendingClub performs a statistical analysis of numerous steps to determine whether to accept or reject hypotheses, which enables data scientists and statisticians to select attributes for predictive modeling. LendingClub seeks patterns in the loan data to discover relationships between a loan amount and borrowers who have charged off and reported by LendingClub Emekter et al. (2015). The company assumes a potential correlation between the two features, which establishes specific loan criteria for the group loan applicants who might encounter such an issue. Discovering the correlation enables LendingClub to enhance its risk management portfolio and minimize the risk of losing financial resources, aiming to mitigate the negative impacts of issuing loans to borrowers of this category. Using business statistics, the company seeks proof of concept for the mentioned ideas before recruiting a third-party software developer to implement a standalone product; therefore, the internal data scientists explore various aspects of such data, not limited to the questions listed above Sarraf et al. (2016a); Grady et al. (2016).
In the first phase, demographic information is extracted from the datasets, and data preprocessing steps, such as data cleaning, are performed to remove any broken data from the database. Next, further investigation of specific data (e.g., type of loans issued, loans issued by region, and a more in-depth analysis of bad loans) is performed Sarraf and Tofighi (2016a, b, c). In the second phase, which oversees the business perspective, the company’s experts explore the operative side of the business (operational business aspects) and analyze applicants’ income category. The third phase refers to the risk assessment of issuing loans, which consists of four steps: a) identifying existing risks in the business; b) the importance and role of credit scores in the loan approval or denial; c) defining bad loans and risky borrowers; d) loans by default (pre-approved); and e) exploring risks by targeted criteria Sarraf (2019a). The ultimate goals of such extensive analysis are to lead LendingClub’s data scientists to explore the feasibility of answering the two questions above based on current data, provide recommendations for data collection, or modify the business scope Saverino et al. (2016); Sarraf and Ostadhashem (2016); Sarraf et al. (2016b).
2 Problem Statement and Hypothesis
The problem for this work points to statistical applications in LendingClub, which establishes three hypotheses regarding the relationship between the “Loan Amount” and “Charge OFF Flag” features, where various statistical analyses, including hypothesis testing Bunting (2019) and correlation analysis Mondal (2016), are employed. The hypotheses are as follows:
-
1.
Accepting or rejecting the hypothesis that any relationship exists between the loan amounts and charge-offs
-
2.
Accepting or rejecting the hypothesis that any relationship exists between the higher loan amounts and charge-offs
-
3.
Accepting or rejecting the hypothesis that any relationship exists between the lower loan amounts and charge-offs
3 Statistical Analysis Pipeline Design
The problem statement consists of three main components: a) data exploration, b) descriptive analysis of loan duration, and c) real-time (fast) loan approval (or denial). Data exploration includes preprocessing, data cleaning, feature engineering, and selection to result in a meaningful descriptive analysis to find an accurate loan during and prediction. In the real-time step, various statistical techniques are explored, including hypothesis testing, student T-Test, and ANOVA testing, and statistical models, such as linear regression, logistic regression, cluster analysis, ANOVA tests, and correlation analysis Anderson et al. (2017); Yang et al. (2018); Strother et al. (2014).
3.1 Data Exploration
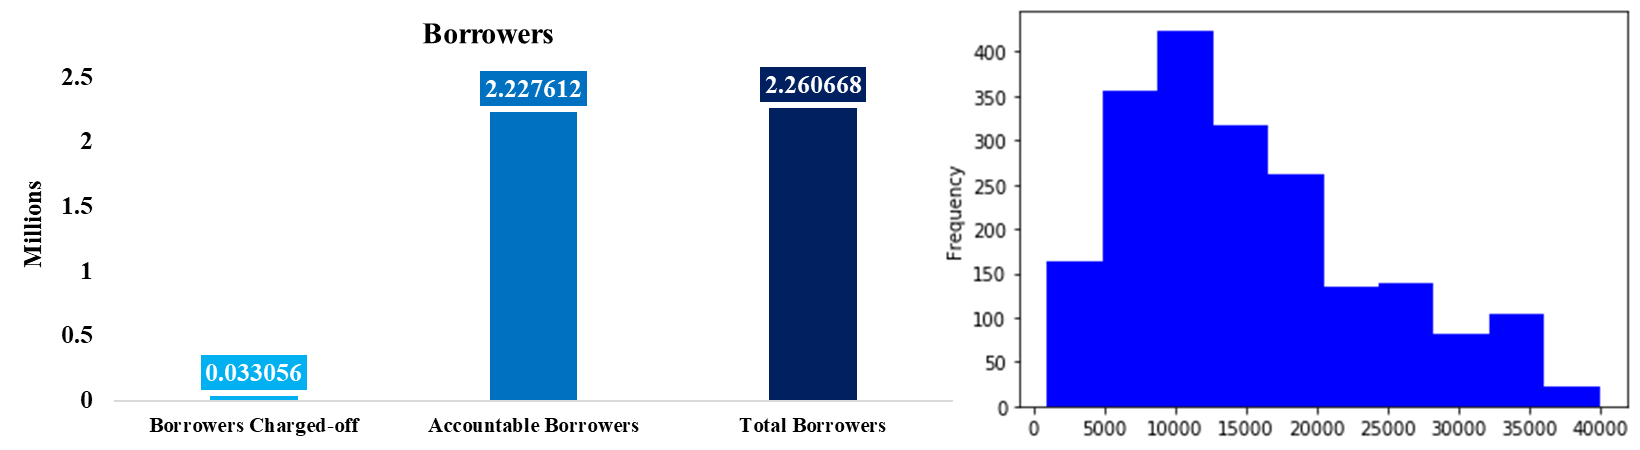
Missing values are removed from the loan data, and “loanAmnt” refers to “the listed amount of the loan applied for by the borrower if, at some point in time, the credit department reduces the loan amount, then it will be reflected in this value” and “debt_settlement_flag” indicating “flags whether or not the borrower, is charged-off, is working” are extracted from the preprocessed data shown in Figure 1. The “debt_settlement_flag” – a binary feature – is considered a categorical attribute requiring conversion to numerical equivalents for statistical analysis Vafaei et al. (2019); Sarraf (2020). Also, the histogram of loan amounts shows how borrowers are distributed regarding loan amounts.
3.2 Hypothesis Testing
In this experiment, T-Test is the primary method for whether to accept or reject the hypothesis. A T-Test is a hypothesis-testing method with broad applications in the industry due to its simplicity and convergence capability with a small sample of data Staniewski (2016); Sarraf et al. (2020). T-Test requires a relatively small subset of data so that the loan dataset is shuffled, and a subsample of 1000 observations is randomly selected from charged-off samples along with 1000 samples, which are randomly selected from the on-time borrowers’ observations for further analysisSarraf (2018). To explore the consistency of T-Test results, analysis of variance (ANOVA) tests are applied to the same subsets as those used in the previous method. ANOVA tests demonstrate whether such groups offer statistically significant differences Quirk (2016); Sarraf et al. (2021).
3.3 Correlation Analysis
Correlation analysis is applied to the subsets to show the dependency between two features Schober et al. (2018). This analysis can indicate whether the loan amount impacts the number of borrowers charged off. Correlation analysis provides additional exposure to the data, which might strengthen the acceptance or rejection of the three hypothesesSarraf et al. (2016c); Sarraf (2017).
3.4 Results Visualization and Interpretation
The results of statistical analysis methods are visualized and interpreted to verify whether the hypotheses are accepted. Also, the visualization of results allows the company’s data scientists to explore whether such outcomes from various techniques converge for decision-making and conclusion purposes.
4 Summary of Results
To perform an accurate T-Test, several data requirements must be met: a) test variables are continuous; b) test variables (observations) are independent; c) subsets are randomly selected; c) data distribution is approximately normal; d) variance scores of subsets and population are approximately consistent; and e) no outliers Sarraf et al. (2014, 2023); Sarraf and Noori (2021). In addition to these criteria, a balanced dataset design is required to conduct a meaningful ANOVA test, where the number of subjects in each group needs to be equal Harmancioglu et al. (1999). Also, an ideal correlation analysis requires data to be independently collected as paired samples, preferably continuous numeric values Nerenberg and Essex (1990).
4.1 Data Analysis
The first step of data analysis is exploring the distribution of observations regarding the number of on-time borrowers versus those who have charged off. The next step is to downsample the charged-off samples into subsets of 1000 observations. The same procedure was applied to on-time borrowers’ observations (non-charged-off), and 1000 samples were randomly selected; thus, each subset included 2000 samples of each class equally distributed Krishnan et al. (2016). The mean, standard deviation, and variance of each subset were calculated. The statistical measures of subsets are highly similar, which suggests the need for statistical testing to produce interpretable results. Figure 1 shows a histogram of each subset where the number of bins is automatically calculated from the data (bin=10). The histogram results indicate that most of the issued loan amounts are in the range of [$5000,$20000].
4.1.1 Hypothesis 1
G*Power statistical software application Faul et al. (2007) performed a T-Test against each subset, including 2000 samples of charged-off and on-time borrowers’ observations equally distributed. One-tailed T-Tests were conducted using an alpha error probability of 0.05 and a power of 0.95 (1 – beta error probability) to produce an actual power (decision-making criteria) for each subset. The results demonstrated that the actual power values were greater than 0.95, suggesting that the null hypothesis can be rejected, meaning that a “Loan Amount” affects whether a borrower can be charged-off. ANOVA test was conducted against each subset using G*Power, where the outcomes demonstrate that the actual power values are higher than 0.95, suggesting that the null hypothesis can be rejected, which means two groups offer variance differences so that a “Loan Amount” affects whether a borrower can be charged-off. The correlation analysis was performed against each subset and produced scores of -0.005255, 0.061228, and 0.007396 per subset, where the results indicate no strong correlation between the loan amount and the status of charged-off borrowers. The correlation results are not aligned with the T-Tests, suggesting that further analysis is needed.
4.1.2 Hypothesis 2
To explore the second hypothesis regarding a relationship between higher “Loan Amount” and “Charged-off,” each subset was sorted in descending order by loan amount, and the top 25% of observations were selected for analysis. The results revealed that all actual power values were higher than 0.95, suggesting that the null hypothesis should be rejected and indicating a strong relationship between the loan amount and charged-off borrowers.
4.1.3 Hypothesis 3
The third hypothesis is that the bottom 25% of loan amounts would also show a statistical relationship with the charged-off borrowers. Each subset was sorted in descending order regarding loan amount attributed, and the bottom 25% of observations were selected. The two-tailed T-Test (conducted by G*Power) revealed a strong relationship between the loan amount and charged-off accounts.
5 Discussion
The company formulated a hypothesis to explore the impact of “Loan Amount” as a dependent variable on an independent attribute referring to “Charge OFF Flag,” showing whether a borrower has repaid the loan or charged it off. To do so, LendingClub decided to conduct T-Test and ANOVA hypothesis testing and correlation analysis. The hypothesis testing revealed a statistically significant difference at p-values less than .05, which is interpreted as an indication of the impact of the loan amount on loan repayment. However, the correlation analysis produced a low score, which disagreed with the results of hypothesis testing, and the company decided to perform a more in-depth analysis to locate the source of such divergence.
5.1 Steps in Statistical Analysis
Statistical analysis includes various steps, such as data exploration, hypothesis testing, and visualization, where the interpretation of results is the last step that aims to explain the results of each step (or most steps) of the analysis De Vaus (2002); Sarraf (2022, 2019b). In general, an explanation of statistical results often covers four main areas: a) sample size, b) metrics of central tendency, c) distribution of data, and d) hypothesis testing Morgan et al. (2004).
5.1.1 Dataset or Sample Size
The number of observations available for statistical analysis plays a crucial role in interpreting results. This number demonstrates whether the samples (observations) can be considered representative of analyzed data Goodhue et al. (2006). A significant difference between statistics and machine learning exists in terms of the number of samples required for experiments, where, for example, 50 observations can represent a population for statistical analysis. A significantly larger dataset is often required for developing a machine learning model.
5.1.2 Measures of Central Tendency
The mean, median, and mode of observations used for statistical analysis, along with the variance and standard deviation (i.e., measures of central tendency), reveal the central gravity of observations Wilcox and Keselman (2003). Interpreting those metrics enables practitioners to discover outliers in the observations and explore the possibility of removing them from the analysis. Unlike machine learning model development, where outliers might not impact results significantly, outliers here can affect statistical results by biasing the results towards that extreme.
5.1.3 Data Distribution
Spreading data by calculating the observation variance can show how samples are distributed among a population Mardia (1975). Also, exploring data distribution by calculating the histogram of data can reveal the type of data distribution (i.e., normal distribution). It also indicates whether the data are skewed towards the left or right of the histogram Mardia (1975). Interpreting the data distribution also reveals whether the data are multimodal, where observations come from two or more distributions. Moreover, such interoperation can be used for accurate data normalization, removing outliers, and properly formulating hypotheses for future analyses or reiterations of the current analysis Silverman (1986).
5.1.4 Hypothesis Testing
Interpretation of hypothesis testing comprises two steps: a) exploring the logic of formulating such a hypothesis and b) exploring the results of hypothesis testing Mullins (2002). In the first step, statisticians review the reasons for forming such a hypothesis by studying documents related to the business aspects of an organization. For example, statisticians can only formulate a hypothesis for analysis because they have considered the types/amounts of loans granted as dependent variables (inputs) when predicting whether borrowers could repay Emekter et al. (2015); Mondal (2016). The logic behind such a hypothesis is explored and interpreted once the data are analyzed and the results produced. The second step is to interpret the hypothesis testing results, determine whether the hypothesis is accepted or rejected, and explore the confidence interval of such interpretations Berger and Mortera (1991). For example, the interpretation of hypothesis testing results for types of loans and successful repayment could potentially reveal a) whether types/amounts of loans are adequate metrics for predicting risks associated with a borrower; and b) how an organization can mitigate potential risks and update their criteria for granting loans Emekter et al. (2015).
5.2 Limitations in Statistical Analysis
Statistical analysis encounters various limitations that make the interpretation of results challenging. As discussed earlier, the primary challenge of statistical analysis, relative to machine learning techniques, is the number of observations required to perform analysis Young (2018). A standard practice in statistical analysis is to sample a population randomly and test hypotheses against the subset of data that can raise concerns about whether the generated subset is a true representative of data Inohara and Kusumi (2011). By contrast, training machine learning algorithms require a significant amount of data, so practitioners assume that the number of samples or observations used to train the algorithms would represent the entire population Inohara and Kusumi (2011). Another limitation in interpreting the analysis results is how to relate findings to business problems and interpret the outcomes of hypothesis testing to address business problem statements Young (2018).
5.2.1 Small Dataset
The size of the dataset or sample used for statistical analysis plays a crucial role in determining the extent to which the results can be generalized Pasini (2015). A small sample size imposes significant limitations on statistical analysis, where a small dataset serves as a somewhat unrepresentative sample of the entire population, causing different types of bias in the analysis results Fong et al. (2020). Also, a small dataset increases the risk that outliers in each population will negatively impact measures of central tendency that have been calculated based on samples out of distribution. In addition to the problem of outliers discussed earlier, a small dataset makes splitting data into training and testing highly challenging. Although statistical analysis methods employ all samples provided to implement models based on hypothesis testing, practitioners in the field often use unseen data to validate hypothesis testing results Fong et al. (2020); Pasini (2015). Another issue caused by a small sample size is an unpredicted increase in measurement errors where the error metrics used to evaluate the models produce highly varying results. To overcome the limitations imposed by a small dataset, the primary practice is to randomly shuffle the dataset and generate several subsets of data, repeating statistical analysis to ensure the results converge Kvesić and Dukić (2012).
5.2.2 Cause and Effect
One of the challenges in interpreting statistical results relates to inconsistency between the hypotheses formulated and the outcomes of testing methods. Practitioners interpreting the statistical results might notice that the results are misaligned with the logic of hypothesis tests Doggett (2004). In such ambiguous circumstances, discovering the cause and effect in statistical analysis results conducted on specific business use cases is challenging since the interpretation disagrees with the predefined scenario Doggett (2004). This issue can arise when the hypothesis testing design does not cover the useful parameters in testing or when less powerful features and attributes in data are used for hypothesis testing Laland et al. (2011). It sometimes happens that practitioners or business teams helping design such statistical analysis misinterpret the results or overlook some findings and/or implications Doggett (2004); Laland et al. (2011). Another source of issues includes a low confidence interval level and results lacking statistical significance Doggett (2004).
5.2.3 Divergence of Results Obtained from Various Methods
A common challenge in interpreting statistical analysis results occurs when the results obtained from various techniques diverge Read and Cressie (2012). It is a widespread practice that statisticians design a statistical analysis using multiple techniques, such as T-Test, ANOVA, or regression, to explore whether the results produced by these techniques align. An agreement between the results from different methods enables an organization to interpret analytical results clearly and make firm recommendations. However, the research shows that hypothesis testing and other methods, such as correlation analysis or machine learning, sometimes produce different results, contrasting with other methodsRead and Cressie (2012). Such an issue indicates that a systematic problem might exist in preparing samples or conducting hypothesis testing. The solution for this type of problem is offered case by case, where practitioners more familiar with the organization’s business scope can suggest methods that produce results closer to the problem statement.
5.3 Business Statistical Analysis and Interpretation
Business statistics, which include various types of analysis, focus on statistical methodologies aligned with an organization’s business scope to improve the decision-making process, mitigate risks to the organization, and increase revenue Sun and Wang (2022). Interpretation of such analysis is crucial to the organization, and the process is expected to go beyond that of a simple report or presentation. The areas covered by business statistics include a) customer behavior prediction and trend extraction; b) data exploration, hypothesis testing, and interpretation, such as extensive visualization; c) enhancing business performance from various angles; and d) improving decision-making processes Sun and Wang (2022). To achieve such targets, business data analysts understand their organization’s business objectives and explore data and results. Also, the root cause analysis is performed to extract in-depth technical insights regarding the organization’s vulnerabilities, enabling the organization to inform its decision-making process Sun and Wang (2022).
5.4 Reflection on the Statistical Analysis Process
The findings from the initial statistical application enable the company to redesign the statistical analysis processes to concentrate on those attributes that more substantially impact their business. Feature engineering—a systematic methodology—is necessary to reveal the relationships between dependent attributes and target variables Nargesian et al. (2017). Also, the company aims to explore other features highly correlated with potential target variables from the business perspective but uncorrelated with other dependent attributes Kotusev (2019).
5.4.1 Potential Improvement
The process of statistical analysis at LendingClub requires several changes to better serve the company’s business needs. The primary targets are to enhance the process of issuing loans, such as the duration of the loan approval process, and to mitigate financial risks to the company by offering borrowers a data-driven loan amount. LendingClub is to apply such changes to the statistical analysis and decision-making process by employing big data infrastructure for advanced multi-model data collection and analytics. In the first step, the company needs a plan demonstrating how to onboard new technology and its costs. The second step includes a broader statistical analysis, such as hypothesis testing, and uses the current data to assess whether specific statistical applications could broadly improve the company’s performance. In the third step, LendingClub conducts research and recruits a third party to develop the required infrastructure.
5.4.2 Required Infrastructure
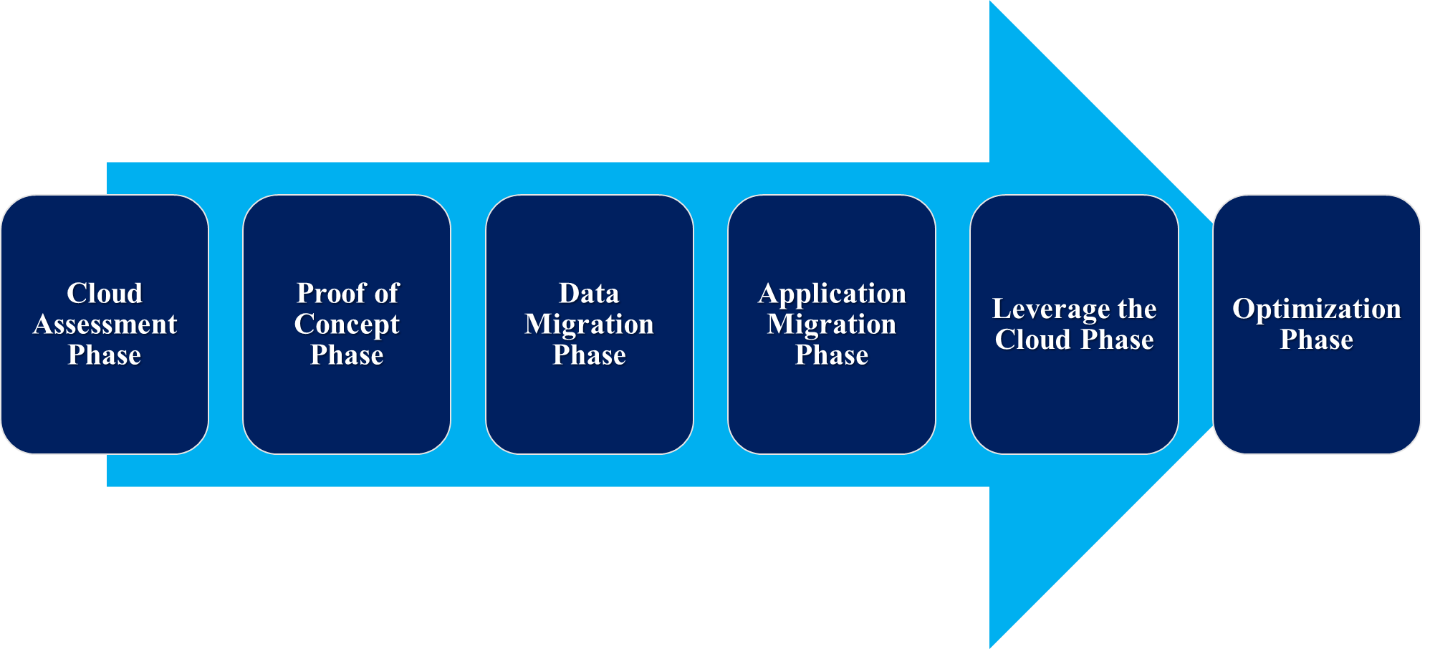
Onboarding a large-scale system, such as an enabled big data analytics platform, is a significant change to LendingClub, where modifications have been performed to everything from databases to reporting systems. The first stage is to decide whether LendingClub would adopt a big data platform to the current system or entirely migrate to the new model. This decision allows the stakeholder to estimate the cost of a big data platform and start planning. Although the cost of system adaptation or migration to the big data platform requires detailed information, the migration to a cloud environment, for example, offering various big data services, would be a potential expansion of LendingClub’s analytics in the future. Figure 2 illustrates the proposed steps for migrating the LendingClub data collection and analytics pipeline to a cloud-based environment that offers big data services such as Amazon Web Services (AWS) Al-Maawali et al. (2019); Mullins (2002). These steps consist of a) cloud assessment, b) proof of concept, c) data migration, d) application migration, e) leverage of the cloud, and f) optimization.
5.5 Proposed Large-Scale Plan
The large-scale plan to enhance the current statistical analysis pipeline consists of two primary phases: a) designing and implementing an end-to-end data collection and processing pipeline that offers big data analytics, and b) increasing the number and quality of features Lee and Wang (2019). The current data collection pipeline collects data from various sources, and no broadly systematic methodology is employed to acquire such data. Gathering data from different providers (in-house or third-party) involves an extensive preprocessing pipeline, which might remove many observations to prepare a consistent dataset.
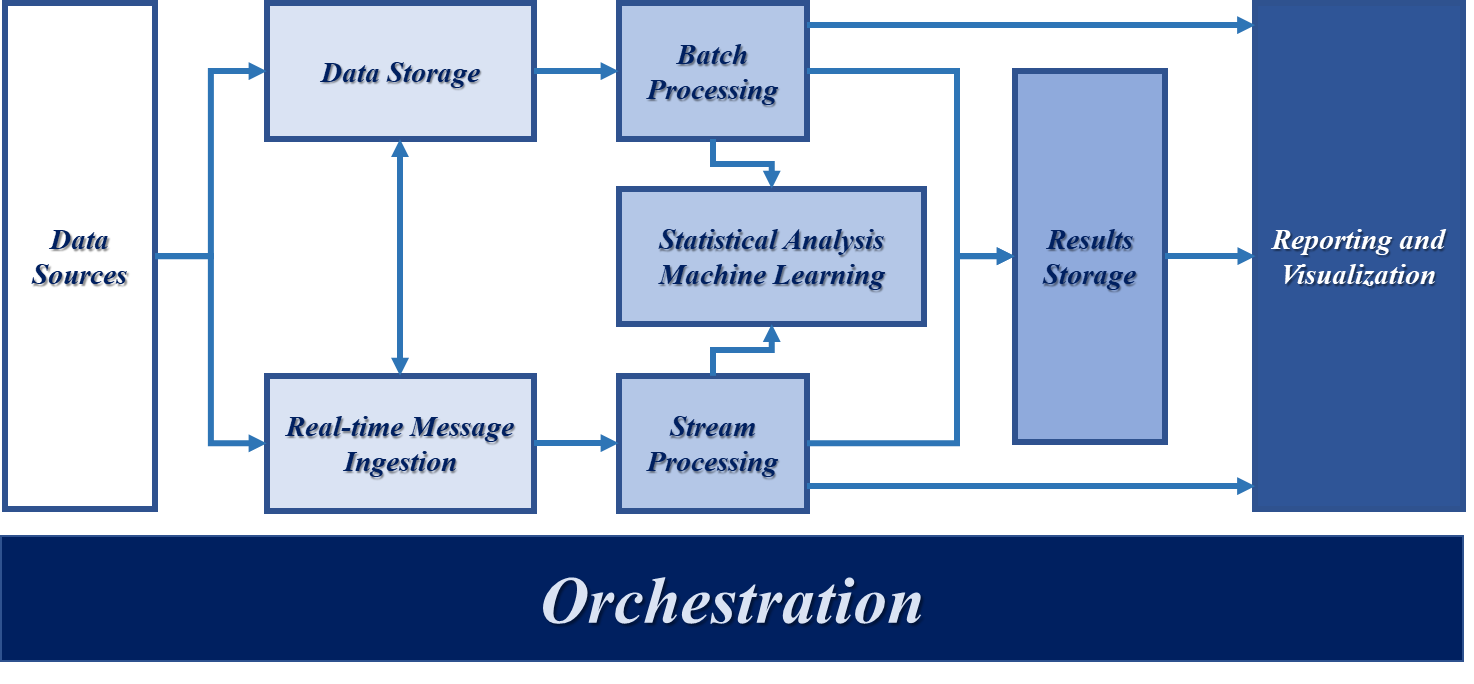
The proposed pipeline illustrated in Figure 3 offers various capabilities, including big data collection and data stream processing. The first component of the architecture is a user interface that enables it to receive data from external sources where the data could either be stored in a multi-model database or be in the form of real-time messaging input into an allocated database. The collected data can be transferred between data storage and real-time messaging place holders, which offers big data capabilities to host structured and unstructured data. The next architecture layer includes enabled big data processing components for batch processing, which oversees data preparation and preprocessing for further analysis Sarraf et al. (2019).
A similar component—the stream processing unit—prepares and preprocesses data streams for real-time analysis and applications. The preprocessed data are sent to the next component of the architecture, which encompasses the statistical analysis and machine learning methods, where such a block is considered the brain that orchestrates the data analytics. Statistical analysis or machine learning outcomes are stored in a “results database.” The last layer of this orchestration is the user interface block, which enables practitioners in the organization to generate reports with visualizations that can be provided to leadership for decision-making purposes. An extra capability in the new architecture is scheduling automatic training machine learning models or performing statistical analysis.
The second phase of the new data analytics platform aims to enhance the quality of feature selection, which concentrates on those attributes that contribute most to target variables. Quarter-based statistical analysis and feature engineering demonstrate what features should be collected with higher resolution. The advantage of using targeted data collection through particular data attributes is to reduce the cost of on-demand infrastructure by reducing the load on the architecture servers and analytical blocks. However, the main disadvantage of employing such a step is that it decreases the amount of data that can be collected, which might harm statistical analysis or predictive model development. Therefore, the organization must weigh the cost of massive data streaming and collection against the impact of selective data collection.
6 Conclusions
Statistical applications enable enterprises to establish a data-driven business plan that provides clear objectives to enhance the enterprise’s performance, revenue, and risk management. This work summarized a strategic plan informed by an already performed analysis for LendingClub – a financial company – that grants various forms. The statistical results showed that different logic could be extracted from currently collected data. Such results enabled LendingClub to improve its business scope and to encourage the company to onboard a big data platform. The plan recommended exploring employing enhanced feature engineering capabilities to acquire enormous data per year and develop predictive models to increase the company’s revenue and lessen potential risks. LendingClub’s plan also seeks to utilize artificial intelligence and machine learning technologies to implement robust models aligned with the company’s business scopes.
References
- Emekter et al. [2015] Riza Emekter, Yanbin Tu, Benjamas Jirasakuldech, and Min Lu. Evaluating credit risk and loan performance in online peer-to-peer (p2p) lending. Applied Economics, 47(1):54–70, 2015.
- Sarraf et al. [2016a] Saman Sarraf, Danielle D DeSouza, John Anderson, Ghassem Tofighi, and Alzheimer’s Disease Neuroimaging Initiativ. Deepad: Alzheimer’s disease classification via deep convolutional neural networks using mri and fmri. BioRxiv, page 070441, 2016a.
- Grady et al. [2016] Cheryl Grady, Saman Sarraf, Cristina Saverino, and Karen Campbell. Age differences in the functional interactions among the default, frontoparietal control, and dorsal attention networks. Neurobiology of aging, 41:159–172, 2016.
- Sarraf and Tofighi [2016a] Saman Sarraf and Ghassem Tofighi. Classification of alzheimer’s disease using fmri data and deep learning convolutional neural networks. arXiv preprint arXiv:1603.08631, 2016a.
- Sarraf and Tofighi [2016b] Saman Sarraf and Ghassem Tofighi. Classification of alzheimer’s disease structural mri data by deep learning convolutional neural networks. arXiv preprint arXiv:1607.06583, 2016b.
- Sarraf and Tofighi [2016c] Saman Sarraf and Ghassem Tofighi. Deep learning-based pipeline to recognize alzheimer’s disease using fmri data. In 2016 future technologies conference (FTC), pages 816–820. IEEE, 2016c.
- Sarraf [2019a] Saman Sarraf. 5g emerging technology and affected industries: Quick survey. American Scientific Research Journal for Engineering, Technology, and Sciences (ASRJETS), 55(1):75–82, 2019a.
- Saverino et al. [2016] Cristina Saverino, Zainab Fatima, Saman Sarraf, Anita Oder, Stephen C Strother, and Cheryl L Grady. The associative memory deficit in aging is related to reduced selectivity of brain activity during encoding. Journal of cognitive neuroscience, 28(9):1331–1344, 2016.
- Sarraf and Ostadhashem [2016] Saman Sarraf and Mehdi Ostadhashem. Big data application in functional magnetic resonance imaging using apache spark. In 2016 Future technologies conference (FTC), pages 281–284. IEEE, 2016.
- Sarraf et al. [2016b] Saman Sarraf, Cristina Saverino, and Ali Mohammad Golestani. A robust and adaptive decision-making algorithm for detecting brain networks using functional mri within the spatial and frequency domain. In 2016 IEEE-EMBS International Conference on Biomedical and Health Informatics (BHI), pages 53–56. IEEE, 2016b.
- Bunting [2019] WC Bunting. The impact of data mining on information disclosure by regulatory agencies: With an application to redlining. Harv. J. on Legis., 56:355, 2019.
- Mondal [2016] Tandra Mondal. Sensitivity of non-performing loan to macroeconomic variables: empirical evidence from banking industry of bangladesh. Global Journal of Management and Business Research, 16(4):21–28, 2016.
- Anderson et al. [2017] John AE Anderson, Saman Sarraf, Tarek Amer, Buddhika Bellana, Vincent Man, Karen L Campbell, Lynn Hasher, and Cheryl L Grady. Task-linked diurnal brain network reorganization in older adults: A graph theoretical approach. Journal of Cognitive Neuroscience, 29(3):560–572, 2017.
- Yang et al. [2018] Xin Yang, Saman Sarraf, and Ning Zhang. Deep learning-based framework for autism functional mri image classification. Journal of the Arkansas Academy of Science, 72(1):47–52, 2018.
- Strother et al. [2014] Stephen C Strother, Saman Sarraf, and Cheryl Grady. A hierarchy of cognitive brain networks revealed by multivariate performance metrics. In 2014 48th Asilomar Conference on Signals, Systems and Computers, pages 603–607. IEEE, 2014.
- Vafaei et al. [2019] Nazanin Vafaei, Rita A Ribeiro, Luis M Camarinha-Matos, and Leonilde Rocha Valera. Normalization techniques for collaborative networks. Kybernetes, 49(4):1285–1304, 2019.
- Sarraf [2020] Arman Sarraf. Binary image classification through an optimal topology for convolutional neural networks. American Scientific Research Journal for Engineering, Technology, and Sciences (ASRJETS), 68(1):181–192, 2020.
- Staniewski [2016] Marcin W Staniewski. The contribution of business experience and knowledge to successful entrepreneurship. Journal of Business Research, 69(11):5147–5152, 2016.
- Sarraf et al. [2020] Arman Sarraf, Ali Esmaeilnia Jalali, and Javad Ghaffari. Recent applications of deep learning algorithms in medical image analysis. American Scientific Research Journal for Engineering, Technology, and Sciences (ASRJETS), 72(1):58–66, 2020.
- Sarraf [2018] Saman Sarraf. French word recognition through a quick survey on recurrent neural networks using long-short term memory rnn-lstm. arXiv preprint arXiv:1804.03683, 2018.
- Quirk [2016] Thomas J Quirk. Excel 2016 for Business Statistics. Springer, 2016.
- Sarraf et al. [2021] Arman Sarraf, Mohammad Azhdari, Saman Sarraf, et al. A comprehensive review of deep learning architectures for computer vision applications. American Scientific Research Journal for Engineering, Technology, and Sciences (ASRJETS), 77(1):1–29, 2021.
- Schober et al. [2018] Patrick Schober, Christa Boer, and Lothar A Schwarte. Correlation coefficients: appropriate use and interpretation. Anesthesia & analgesia, 126(5):1763–1768, 2018.
- Sarraf et al. [2016c] Saman Sarraf et al. Hair color classification in face recognition using machine learning algorithms. American Scientific Research Journal for Engineering, Technology, and Sciences (ASRJETS), 26(3):317–334, 2016c.
- Sarraf [2017] Saman Sarraf. Eeg-based movement imagery classification using machine learning techniques and welch’s power spectral density estimation. American Scientific Research Journal for Engineering, Technology, and Sciences (ASRJETS), 33(1):124–145, 2017.
- Sarraf et al. [2014] Saman Sarraf, Ehsan Marzbanrad, and Hamid Mobedi. Mathematical modeling for predicting betamethasone profile and burst release from in situ forming systems based on plga. In 2014 IEEE 27th Canadian Conference on Electrical and Computer Engineering (CCECE), pages 1–6. IEEE, 2014.
- Sarraf et al. [2023] Saman Sarraf, Arman Sarraf, Danielle D DeSouza, John AE Anderson, Milton Kabia, and Alzheimer’s Disease Neuroimaging Initiative. Ovitad: Optimized vision transformer to predict various stages of alzheimer’s disease using resting-state fmri and structural mri data. Brain Sciences, 13(2):260, 2023.
- Sarraf and Noori [2021] Saman Sarraf and Mehdi Noori. Multimodal deep learning approach for event detection in sports using amazon sagemaker. AWS Machine Learning Blog, 2021.
- Harmancioglu et al. [1999] Nilgun B Harmancioglu, Okan Fistikoglu, Sevinc D Ozkul, Vijay P Singh, M Necdet Alpaslan, Nilgun B Harmancioglu, Okan Fistikoglu, Sevinc D Ozkul, Vijay P Singh, and M Necdet Alpaslan. Basic tools—statistics and modeling. Water Quality Monitoring Network Design, pages 81–94, 1999.
- Nerenberg and Essex [1990] MAH Nerenberg and Christopher Essex. Correlation dimension and systematic geometric effects. Physical Review A, 42(12):7065, 1990.
- Krishnan et al. [2016] Krishanth Krishnan, Taralyn Schwering, and Saman Sarraf. Cognitive dynamic systems: A technical review of cognitive radar. arXiv preprint arXiv:1605.08150, 2016.
- Faul et al. [2007] Franz Faul, Edgar Erdfelder, Albert-Georg Lang, and Axel Buchner. G* power 3: A flexible statistical power analysis program for the social, behavioral, and biomedical sciences. Behavior research methods, 39(2):175–191, 2007.
- De Vaus [2002] David De Vaus. Analyzing social science data: 50 key problems in data analysis. sage, 2002.
- Sarraf [2022] Saman Sarraf. An End-To-End Cloud-Based Solution for Optimal Attention Network Topology in Real-Time Applications. PhD thesis, Northcentral University, 2022.
- Sarraf [2019b] Saman Sarraf. Machine learning applications to recognize autism and alzheimer’s disease. In Neurological Disorders and Imaging Physics, Volume 3, 2053-2563, pages 1–1 to 1–23. IOP Publishing, 2019b. ISBN 978-0-7503-1793-1. doi:10.1088/978-0-7503-1793-1ch1. URL https://dx.doi.org/10.1088/978-0-7503-1793-1ch1.
- Morgan et al. [2004] George A Morgan, Nancy L Leech, Gene W Gloeckner, and Karen C Barrett. SPSS for introductory statistics: Use and interpretation. Psychology Press, 2004.
- Goodhue et al. [2006] Dale Goodhue, William Lewis, and Ron Thompson. Pls, small sample size, and statistical power in mis research. In Proceedings of the 39th Annual Hawaii International Conference on System Sciences (HICSS’06), volume 8, pages 202b–202b. IEEE, 2006.
- Wilcox and Keselman [2003] Rand R Wilcox and HJ Keselman. Modern robust data analysis methods: measures of central tendency. Psychological methods, 8(3):254, 2003.
- Mardia [1975] Kantilal Varichand Mardia. Statistics of directional data. Journal of the Royal Statistical Society Series B: Statistical Methodology, 37(3):349–371, 1975.
- Silverman [1986] Bernard W Silverman. Density estimation for statistics and data analysis, volume 26. CRC press, 1986.
- Mullins [2002] Craig Mullins. Database administration: the complete guide to practices and procedures. Addison-Wesley Professional, 2002.
- Berger and Mortera [1991] James O Berger and Julia Mortera. Interpreting the stars in precise hypothesis testing. International Statistical Review/Revue Internationale de Statistique, pages 337–353, 1991.
- Young [2018] Michael E Young. A place for statistics in behavior analysis. Behavior Analysis: Research and Practice, 18(2):193, 2018.
- Inohara and Kusumi [2011] K Inohara and T Kusumi. Psychological validity of conceptual similarities based on latent semantic analysis: Merits and limitations in statistical analysis of corpuses. Japanese Psychological Review, 54:101–122, 2011.
- Pasini [2015] Antonello Pasini. Artificial neural networks for small dataset analysis. Journal of thoracic disease, 7(5):953, 2015.
- Fong et al. [2020] Simon James Fong, Gloria Li, Nilanjan Dey, Rubén González Crespo, and Enrique Herrera-Viedma. Finding an accurate early forecasting model from small dataset: A case of 2019-ncov novel coronavirus outbreak. arXiv preprint arXiv:2003.10776, 2020.
- Kvesić and Dukić [2012] Ljiljanka Kvesić and Gordana Dukić. Risk management and business credit scoring. In Proceedings of the ITI 2012 34th International Conference on Information Technology Interfaces, pages 47–52. IEEE, 2012.
- Doggett [2004] Anthony Mark Doggett. A statistical comparison of three root analysis tools. Journal of Industrial Technology, 20(2), 2004.
- Laland et al. [2011] Kevin N Laland, Kim Sterelny, John Odling-Smee, William Hoppitt, and Tobias Uller. Cause and effect in biology revisited: is mayr’s proximate-ultimate dichotomy still useful? science, 334(6062):1512–1516, 2011.
- Read and Cressie [2012] Timothy RC Read and Noel AC Cressie. Goodness-of-fit statistics for discrete multivariate data. Springer Science & Business Media, 2012.
- Sun and Wang [2022] Lu Sun and Yanwen Wang. Improving and evaluating business management in the digital economy based on data analysis. Security and Communication Networks, 2022, 2022.
- Nargesian et al. [2017] Fatemeh Nargesian, Horst Samulowitz, Udayan Khurana, Elias B Khalil, and Deepak S Turaga. Learning feature engineering for classification. In Ijcai, volume 17, pages 2529–2535, 2017.
- Kotusev [2019] Svyatoslav Kotusev. Enterprise architecture and enterprise architecture artifacts: Questioning the old concept in light of new findings. Journal of Information technology, 34(2):102–128, 2019.
- Al-Maawali et al. [2019] Zeyana Ahmed Al-Maawali, Herald Noronha, et al. Big data acquisition, preprocessing and analysis to develop and implement effective database system with high security standards. In 2019 4th MEC International Conference on Big Data and Smart City (ICBDSC), pages 1–4. IEEE, 2019.
- Lee and Wang [2019] Hsien-Yu Lee and Nai-Jian Wang. Cloud-based enterprise resource planning with elastic model–view–controller architecture for internet realization. Computer Standards & Interfaces, 64:11–23, 2019.
- Sarraf et al. [2019] Saman Sarraf, Danielle D Desouza, John AE Anderson, and Cristina Saverino. Mcadnnet: Recognizing stages of cognitive impairment through efficient convolutional fmri and mri neural network topology models. IEEE Access, 7:155584–155600, 2019.