July 2023
Open Access: Who are the Ghost Readers?
Michael E. Peskin
SLAC, Stanford University, Menlo Park, CA 94025, USA
ABSTRACT
To develop a funding model for Open Access journal publication, it is necessary first to understand who benefits. This is a difficult task,because, in Open Access, no credentials are needed to read a journal article, and, thus, those people who access journal articles through Open Access leave no self-identification. We might call these readers “ghost readers”. In this paper, I propose a method to learn the reading habits of the ghost readers. I explore this method using a database of downloads from the Open Access volumes of the Annual Reviews journals. I find that the habits of the ghost readers are very similar to those of academic readers from known institutions.
1 Introduction
Open Access (OA), the opening of articles in the scientific literature to anyone who would like to read them, is obviously a benefit. It makes journal articles easier to obtain and offers them to a wider audience. But, still, OA is controversial because of the burden its puts on publishers to find a funding model other than the traditional one of selling their products. The key to a successful funding model is that those who benefit should pay the costs. But who benefits?
The original vision of OA publishing was to make the scientific literature accessible to new readers, readers outside well-supported academic institutions and outside academia altogether. For example, the 2002 “Budapest Open Access Initiative Declaration” [1] begins with the philosophical statement: “The public good they make possible is the world-wide electronic distribution of the peer-reviewed journal literature and completely free and unrestricted access to it by all scientists, scholars, teachers, students, and other curious minds. Removing access barriers to this literature will accelerate research, enrich education, share the learning of the rich with the poor and the poor with the rich, make this literature as useful as it can be, and lay the foundation for uniting humanity in a common intellectual conversation and quest for knowledge.” To put this more bluntly, the main benefit comes to those who are not motivated to pay, or cannot afford to. There is much to admire in this idealistic vision, but it has not been helpful in making OA a common practice. Libraries are supported to benefit the institutions of which they are a part. The authors of journal articles write for their peers. These stakeholders have little motivation to pay to bring their technical papers to readers outside their own institutions or networks.
But, is this perspective on the benefits of OA correct? There is very little evidence that has been brought to bear on this problem. A well-documented feature of OA is that the number of downloads of OA journal articles increases noticeably and, sometimes, dramatically [2, 3]. However, this fact is often not considered to be important in and of itself. It depends on who is making these extra downloads. In OA publication, readers meet no paywall and so have no need to identify themselves. We might call these readers “ghost readers”. To understand who benefits from OA, we need to learn who the ghost readers are.
One positive merit of OA might be that it makes OA papers more prominent by increasing their citation count. However, it is controversial whether publishing a paper OA increases its number of citations [3, 4]. Easily obtained samples of OA articles are biased toward more highly cited papers, and correcting for these biases leaves a small effect, less than 20% or even zero in some studies. On the other hand, most scientific papers, and, therefore, most citations, come from authors at leading institutions with well-supported libraries. These authors can learn about and access any papers that they wish to see, whatever the access restrictions for others. So it is not clear how large this advantage could be, even in the best case.
This makes it an important problem to understand the value or lack of value in the increase in downloads. To do this, we must try to identify the readers who are downloading papers using OA. This can be done by analyzing their reading habits. But, often, the data needed for such an analysis is closely held by publishers who want to protect the details of their business models. For whatever reason, this data is very poorly studied.
I was fortunate to be given access to three years of data on downloads from the journals of Annual Reviews, Inc., a nonprofit publisher, and I was given permission to share my analysis of it publicly. In this paper, I will show that, even though the new OA readers are anonymous, it is possible to compare their reading habits to those of well-characterized institutional readers and thus to gain evidence on who they are.
The structure of this paper is as follows: In Section 2, I will explain what data on OA readership is available from the Annual Reviews (AR) records. I will also point out some ways in which the AR journals are not typical scientific journals. In Section 3, I will present the data on the increase in downloads for OA journals. For AR, this has been a pronounced effect, increasing the number of downloads by a factor of 3 or more. I will compare this to results on downloads given in the literature.
In Section 4, I will show that the usage pattern of a body of readers can be represented as a “Zipf curve”. Zipf’s Law claims that this curve is a pure power law [5, 6]. Howver, we will see that, when applied to journal readership, the curve has structure and provides a fingerprint of the habits of a group of readers. In Section 5, I will present curves of this types that compare the reading habits of “ghost readers” to those of readers accessing AR journals through their subscribing institutions. It turns out that the Zipf curves for the two types of readers are very similar. In Section 6, I will sharpen this conclusion by modelling the residual differences between the two samples. Section 7, I will show an exception that tests the interpretation of Zipf curves. Section 8 will present some conclusions.
I should disclose my affliations: I am a member of the Board of Directors of AR. AR is a nonprofit corporation, and the members of the Board are not compensated for their service. I am also co-Editor of the Annual Review of Nuclear and Particle Science, one of the journals considered in this study, and I receive an annual honorarium from AR for my work on that journal.
2 The Annual Reviews downloads database
| Annual Review of … | acronym | OA open date |
|---|---|---|
| Biomedical Engineering | BE | 7/13/2021 |
| Cancer Biology | CB | 3/9/2020 |
| Environment and Resources | ER | 10/19/2020 |
| Genomics and Human Genetics | GG | 9/1/2021 |
| Nuclear and Particle Science | NS | 10/19/2020 |
| Political Science | PS | 5/12/2020 |
| Public Health | PH | 4/6/2017 |
| Virology | VI | 9/29/2021 |
Annual Reviews is a nonprofit publisher that produces 51 journal volumes each year in various areas of physical, biological, and social science. Over the past few years, AR has conducted an experiment in OA, making a subset of its journals open under a plan called “Subscribe to Open” (S2O) [7]. In this model, if total subscription revenue reaches a prescribed level necessary to fund the journal, the journal is made OA for all readers. Using this plan, 8 of the AR journals were converted to OA. These journals are listed in Table 1 for easy reference. AR rolls out its journals throughout the year, one issue per year, so for each of the OA journals, the starting date for OA was different. The data set that I will discuss includes all pdf downloads of articles in these OA volumes over the three years 2020-2022. The main results of this paper are based on a comparison of download records between institutional and OA readers during the OA period. The eight journals include journals in the physical sciences, the social sciences, and the biological sciences. The orientation of these journals is in all cases quite academic, although the volumes on Cancer Biology (CB), Genomics and Human Genetics (GG), and Virology (VR) have some medical relevance. Beginning in 2023, all AR journals are being made OA through S2O.
In addition, all 51 journals were made OA during a brief period from mid-March to mid-June 2020, at the beginning of the COVID-19 pandemic. I will discuss some results from this period in Section 7.
The AR records refer to downloads of articles from the AR web site. The records contain only a minimum of information: the DOI of the article downloaded, the date and time, the country of the reader, the reader’s institution (if the institution is a subscriber), the format (pdf or html), and additional administrative details associated with the download permissions. An important property of the S2O arrangement is that scientists at subscribing institutes see no difference in access between OA and non-OA periods. Thus, the record of downloads is populated with downloads from identified subscribers, which can be used as a control group, along with downloads from unidentified OA readers.

A typical usage curve is shown in Fig. 1. The blue, red, and gold curves show the downloads per week from from AR Biomedical Engineering (BE) for three different classes of readers, which I will refer to as “Inst”, “Ghost”, and “Free”:
-
•
Inst readers (blue): Readers from subscribing institutions.
-
•
Ghost readers (red): OA readers, identified only by country of origin.
-
•
Free readers (gold): Readers of “Free Access” papers.
The black curve gives the sum of the downloads per week from Inst and Ghost readers. This association of these three types of readers with colors is used consistently in the figures below. Inst readers are those whose downloads are registered with a subscribing institution. Ghost readers are those who are granted access but are not identified with an institution; these are the Open Access readers. Free readers are those who download papers declared “Free Access” by AR. This designation is used by the AR marketing department to highlight especially topical papers in a given journal in advance of the annual journal release, and to make available articles that are discussed in widely read sources such as the New York Times. In some developing countries, entire volumes are made Free Access. In general, though, these Free Access papers are mainly articles that are expected to be especially interesting to the general public.
AR Public Heath, the first journal that AR made OA, was actually made free to access in 2017, before the start of S2O. Unfortunately, even after it became an S2O journal, all of its articles were classified as “Free Access”, making its download record unusable for the analysis in this paper.
The data in Fig. 1 shows the increase in journal usage during the pandemic OA period, from March to June 2020 (weeks 11 to 24), and the steady increase in journal usage during the period of OA under S2O (week 81 onward). The usage of the other journals shows a similar pattern, as I will discuss in the next section. The data set used for analysis in subsequent sections is the list of all downloads from the beginning of the S2O period to the end of December 2022. For two of the journals (CB and PS), the S2O period began before or during the pandemic OA period.
3 The OA Effect on Downloads
A remarkable feature of Fig. 1 is the tremendous increase in the number of downloads from the addition of Ghost readers. Their usage increases the total usage by about a factor of 2.5. Notice that the blue curve representing the subscribers is approximately constant through OA and paywalled periods. Thus, OA access does not cannibalize the institutional usage but simply adds to it.
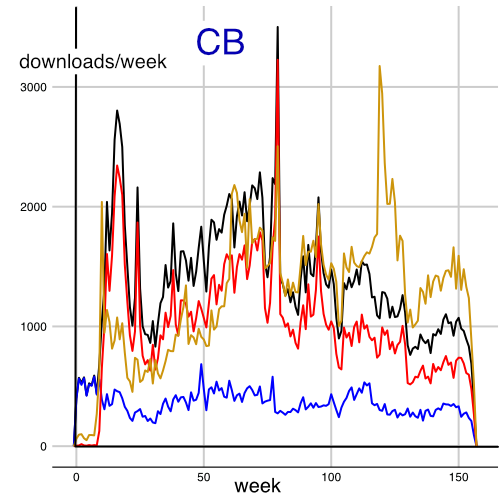
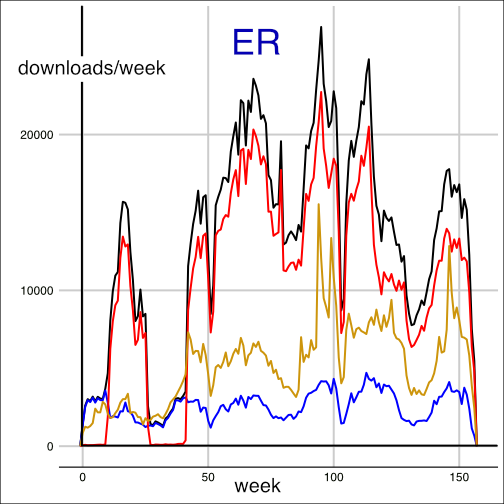
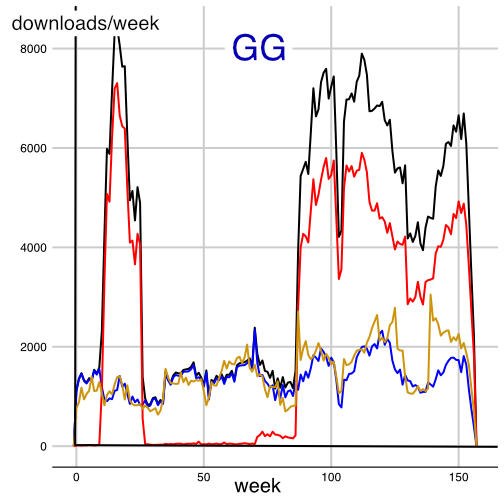
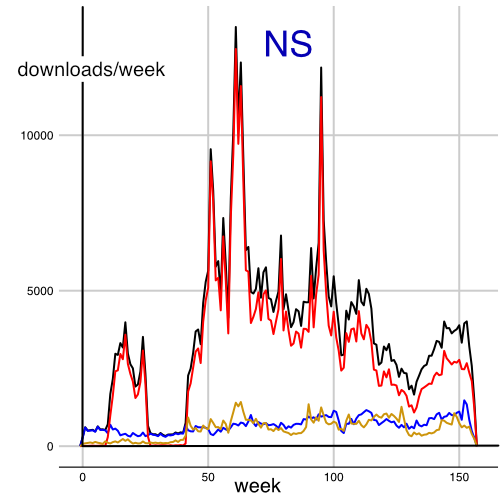
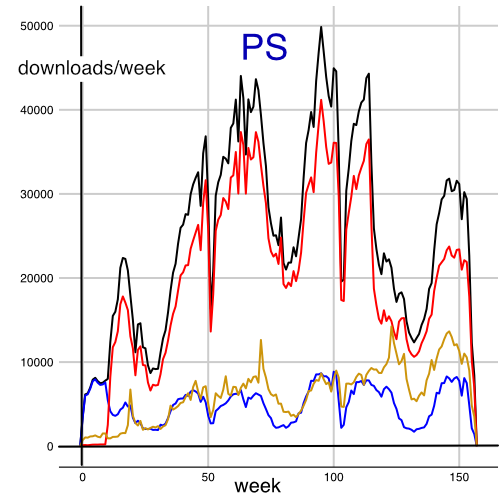
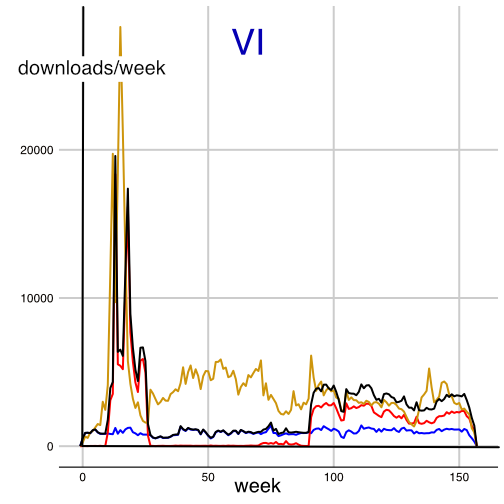
This general behavior is typical for the OA journals. In Fig. 2 I show the corresponding figures for the other six S2O journals. For each, there is a different start date for the OA period, but, after than date, the increase in the level of downloads proceeds in a consistent way.
| AR journal | Total/Inst - global | Total/Inst - US/Canada | Total/Inst - India |
|---|---|---|---|
| BE | 2.47 | 2.30 | 4.89 |
| CB | 3.78 | 3.34 | 7.57 |
| ER | 5.13 | 4.37 | 17.74 |
| GG | 2.80 | 2.66 | 7.23 |
| NS | 5.44 | 4.69 | 6.24 |
| PS | 4.99 | 4.35 | 37.28 |
| VI | 2.72 | 2.43 | 13.05 |
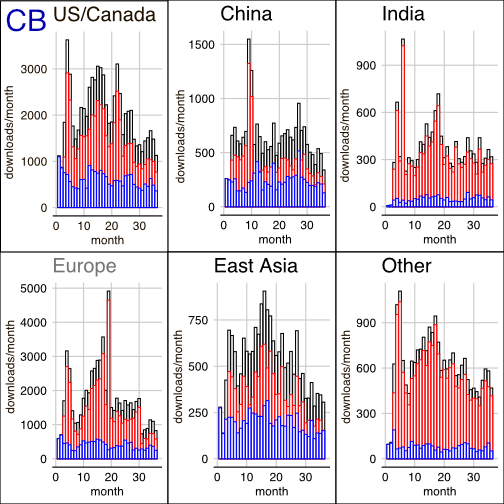
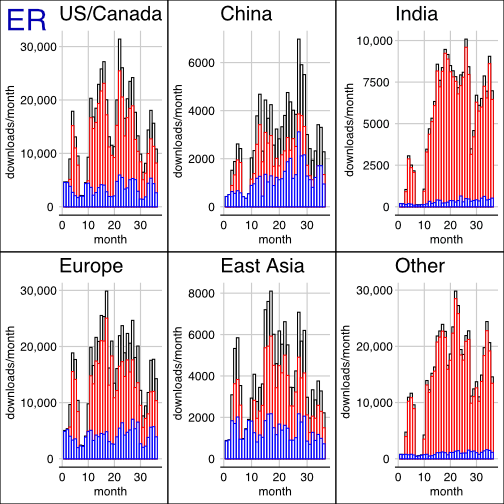
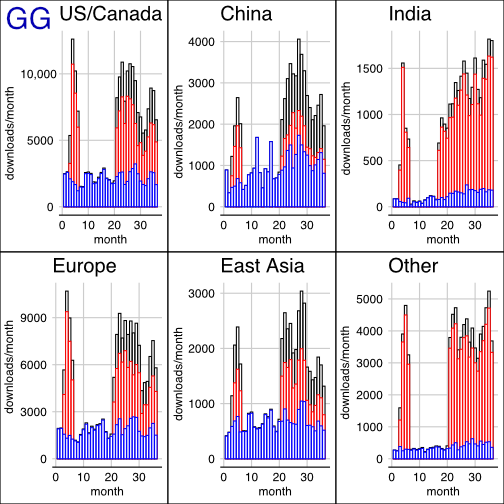
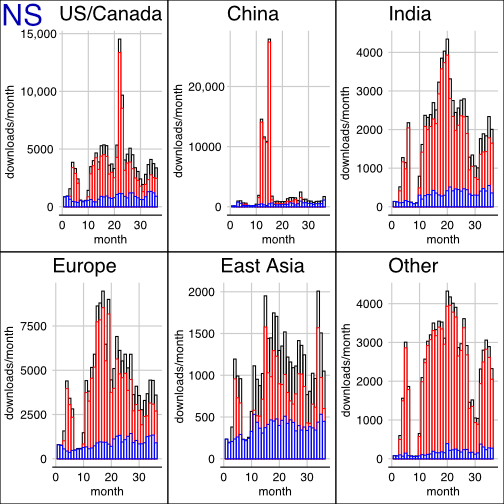
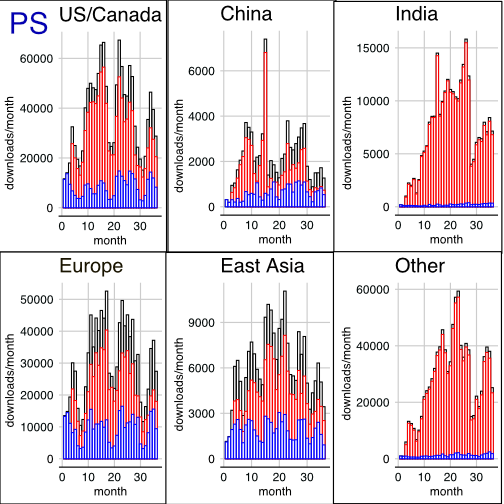
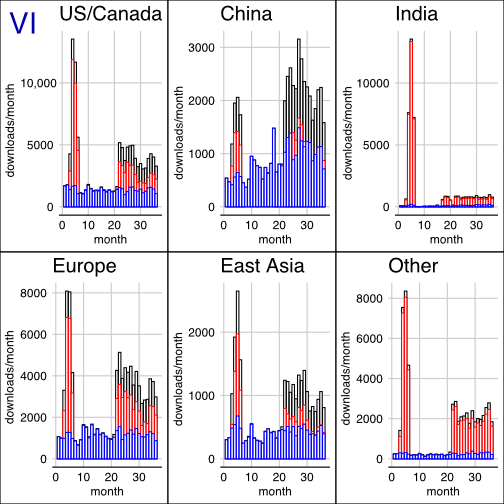
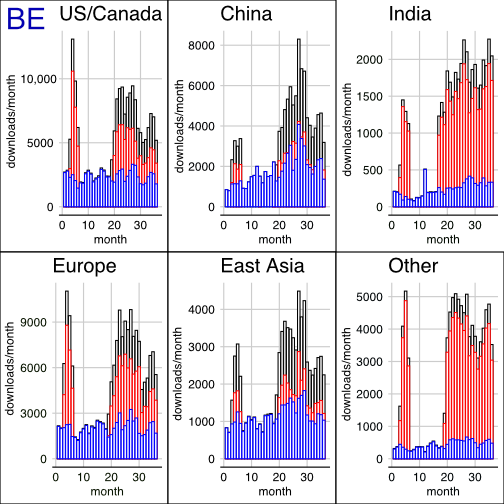
The readership of the AR journals is global, so it is interesting to see the global distribution of downloads. Fig. 3 shows the breakdown of the timeline (by month) for BE for six groupings of countries: US and Canada, Europe, China, India, East Asia (excluding China), and all others. The figure compares the usage from Inst and Ghost readers for each grouping. The largest relative increase occurs in India and in the Other category that includes most of the developing world. There, the increase in downloads is close to a factor of 5. This accords with the idealistic mission of OA. However, the increase in readership in the US and Canada and in Europe is very substantial and actually dominates in terms of absolute numbers of downloads. The increase here of a factor of more than 2 is of direct relevance to libraries at North American academic institutions.
In Appendix A, I present the corresponding comparisons for the other six OA journals. The ratios of total to Inst downloads is recorded in Table 2. Though the ratio of Ghost to Inst readers varies among these journals, the general pattern holds in all cases. In particular, the global ratio is close to the North American ratio, indicating the numerical dominance of downloads from developed regions.
I note that the increase in readership due to OA shown here is larger than that reported in other studies. The studies [8, 9, 10] report increases in downloads of about a factor 2. In [2], Davis and Walters are concerned about the effect of robots on the download counts. In their study [9], they remove downloads from identified robots, and this decreases the effect by a factor of 2 (though it is still an 80% increase). They write about [8] that “most of this increase was attributed to Internet robots (automated applications that index web pages) rather than human intention”. However, in the paper itself, Nicholas and colleagues conclude “There has been a substantial shift in the make-up of users by referrer link - most notably there has been an increase in the share of accesses via a search engine…. This represents a dramatic and major shift in scholarly information seeking behaviour.” This is a very different statement. Today, journal web sites can prohibit indiscriminate downloads by robots. I will show in Section 6 that robots have at most a very small influence on the AR data.
The situation of AR is special in some respects. AR does not publish primary literature but rather presents reviews covering areas of science. The study [9] found a positive correlation between review articles vs. primary articles and the number of downloads. Reviews are often the starting point for students or established researchers who seek to learn about or enter a new specialty. They are a source of references to primary research articles, so some of the usage might be simply scanning for a pointer to a reference. The AR journals are individualy well-known, typically among the top 5 journals in their respective areas in terms of impact factor; see [11]. It would be very interesting to analyze data of the sort that I discuss here over a wider range of journals.
Still, I hope that those who view this data will think more seriously about the simple fact of the increase in usage. If someone offered you, as a librarian, a magic trick that, at minimal cost, would double or triple the usage of a journal that you are supporting, wouldn’t you grab for it?
4 Zipf curve analysis
To understand better the identities of the Ghost readers and their relevance for journal usage, we can look into their behavior. Despite the fact that we know nothing about the Ghost readers except which articles they download, we can still make use of this minimal information to learn about them.
Zipf’s law [5, 6] is the statement that, in a list of words in a text or other items of relevance in a corpus of data, the frequency of appearance decreases as a power of the rank. This is, of course, an idealization. In a real data set, the frequency vs. rank distribution can have structure. In that case, the distribution of frequency vs. rank, on a log-log plot, can give information on what partitions exist in the dataset according to the usage it describes. In the rest of this paper, I will refer to the log-log plot of frequency vs. rank as the “Zipf curve”.

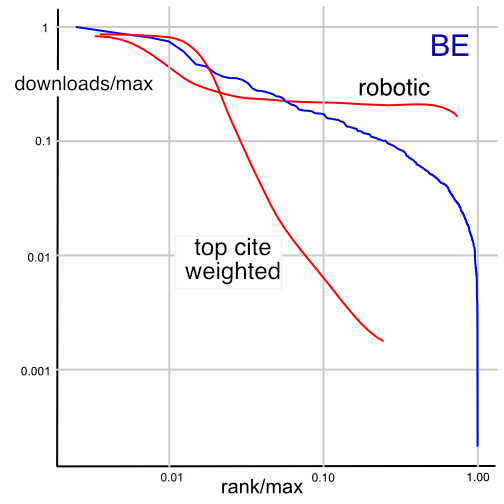
It is interesting to make this plot for the downloads data. In Fig. 4, I show a plot of the number of copies of each paper in the BE journal selected by Inst readers. The download numbers and ranks are normalized so that the largest number of downloads and the largest rank are rescaled to 1. Fig. 5 adds some conjectured curves for the Ghost readers. If the OA readers are mainly interested in the most highly used or cited papers, their curve would fall off more sharply. If the OA readers are blindly searching for information (or are bots rather than humans), their curve would be more flat.
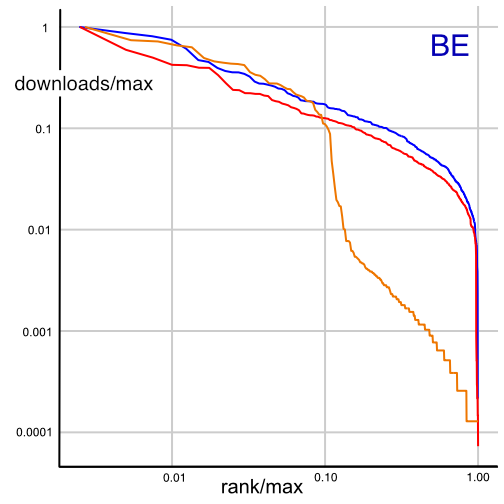
The actual curves for BE for the three types of readers are shown in Fig. 6. Notice that the gold curve, for Free Access readers, does show the expected behavior of falling off rapidly with rank. However, the curve for Ghost readers closely follows the curve for Institutional readers. The individual data sets for this and other journals contain hundreds of thousands of of downloads, millions in some cases, so the statistical errors on the curves are small compared to the differences between the Inst and Ghost lines.
5 Results from the Zipf curves
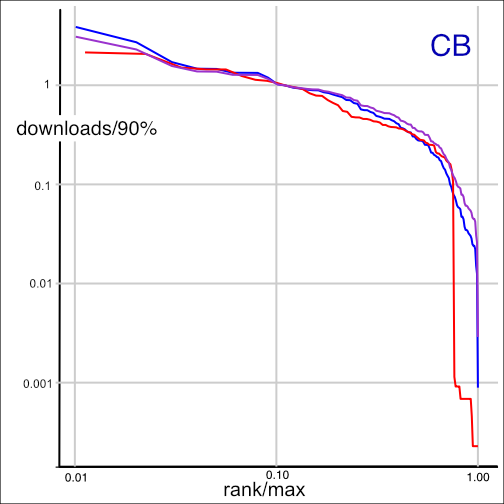
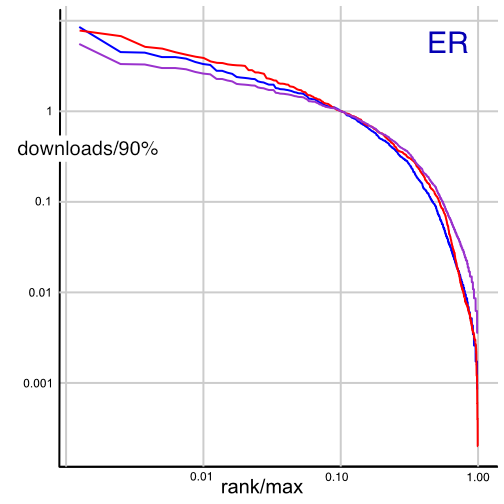
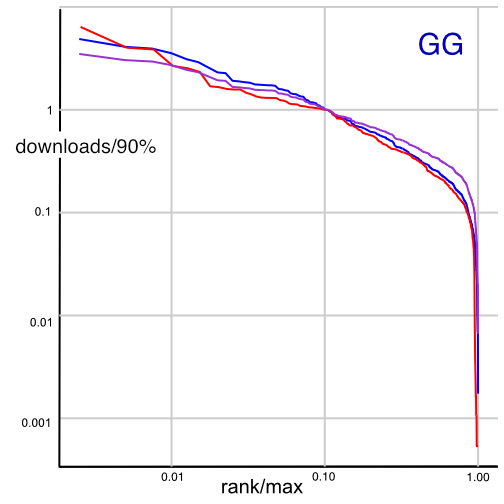
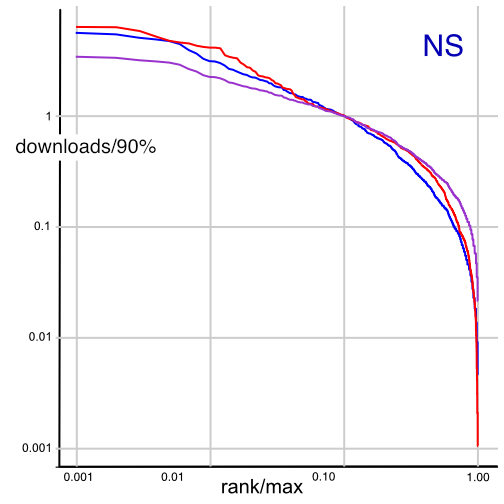
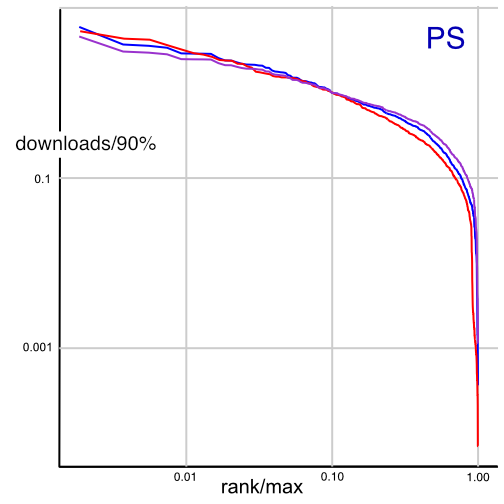
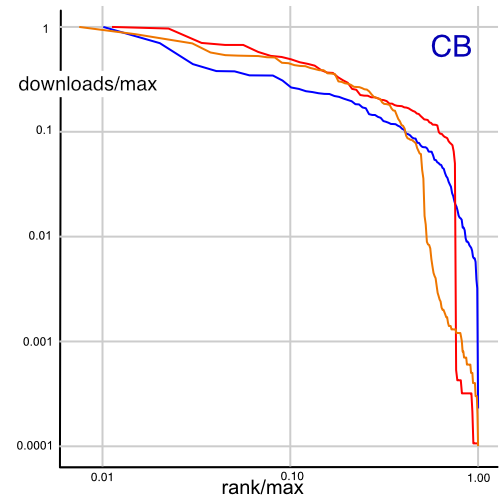
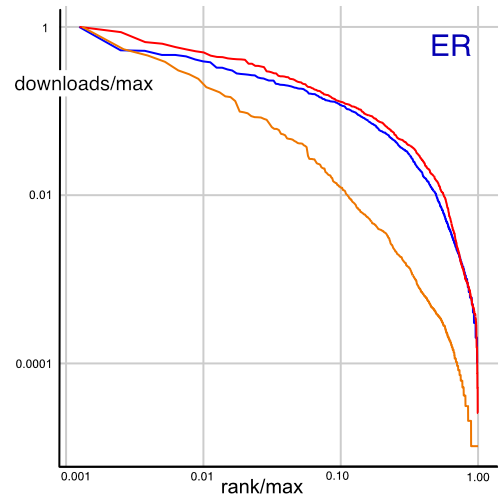
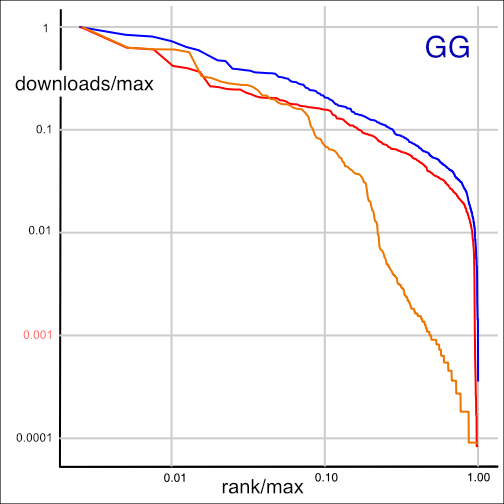
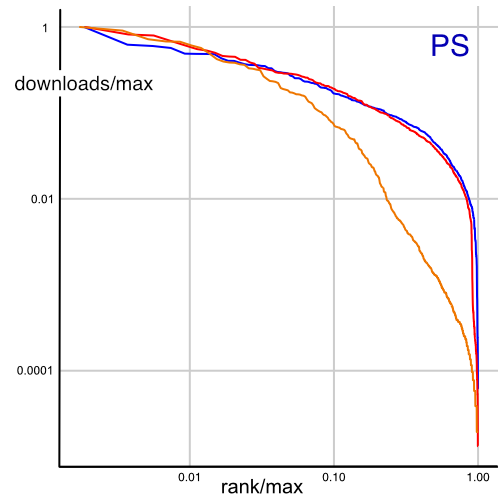
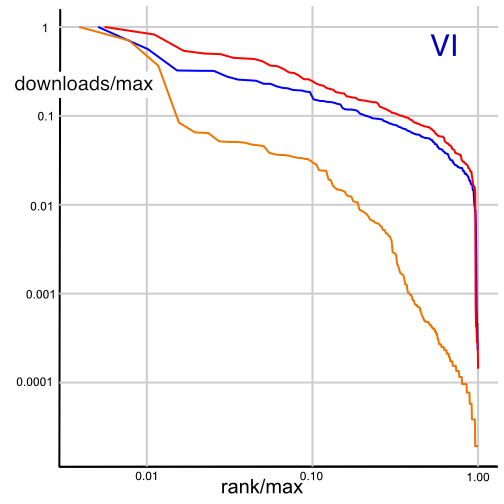
In Fig. 7, I show the comparisons of the Zipf curves against total downloads for the other six OA journals. In all of the plots, the curves for Ghost readers are very similar to the curves for Inst readers. For ER, NS and PS, the curves are practically indistinguishable. The rank for each paper is the rank within that class, so the same paper might have a different rank for each of the three types of readers. However, we will see in Section 7 that the ranks for Inst and Ghost readers are highly correlated.
While there is a tendency for the Ghost curves for the medically relevant journals CB and VI to have a lower slope and thus lie above the Inst curves, the effect is not pronounced, and the distribution is still far from random selection. I will investigate in Section 7 to what extent this is a meaningful effect.

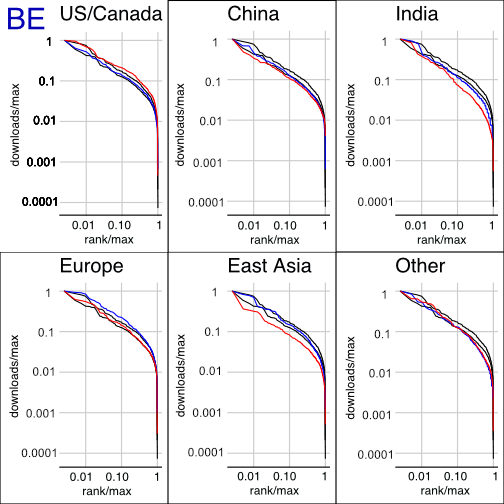
It is possible to get a better feeling for the variation in these plots by comparing the results for different regions. Fig. 8 shows the separate usage plots for the six regions defined in Fig. 3. In these plots, the black curves are the Zipf curves for the total sample, from Fig. 6, while the blue and red curves show the curves for the Inst and Ghost readers in that region. Note that the ordering of the red and blue curves is different in the US/Canada data than in other regions. The variation among the six regions in these plots is as large as the difference between the Inst and Ghost curves for the full sample. This feature is also seen for the other five journals. The plots for the other 6 journals are given in Appendix A.
6 Modelling of the Zipf curves
Now that we have seen that the Zipf curves for the Ghost and Inst readers are quite similar, it is interesting to probe further for the cause of their small differences. The journals of medical interest, CB and VI, show Ghost reader curves that deviate in the positive direction from the Inst reader curves. Is this a reflection of new readers interested in the results of medical relevance, or is this a spurious effect that does not reflect the nature of the field? We can investigate this by trying to make a model of the relation between the Inst and Ghost curves.
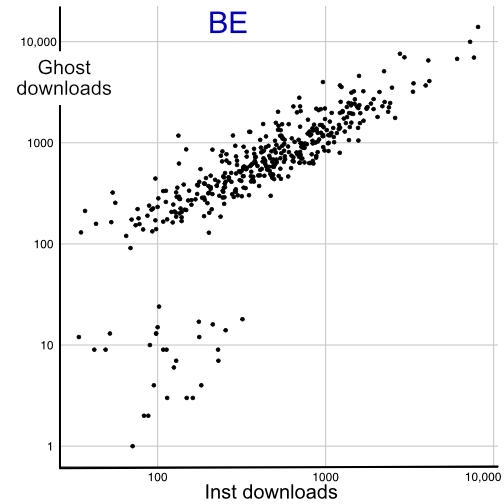
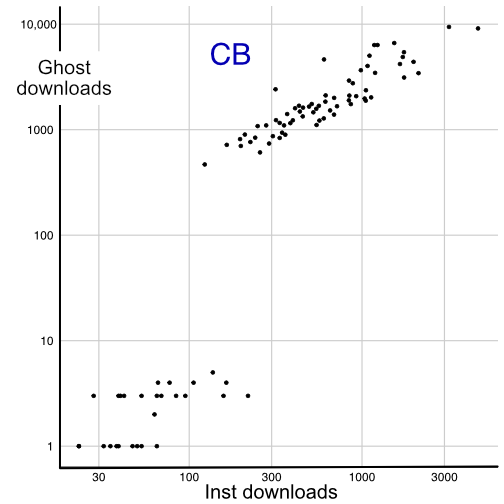
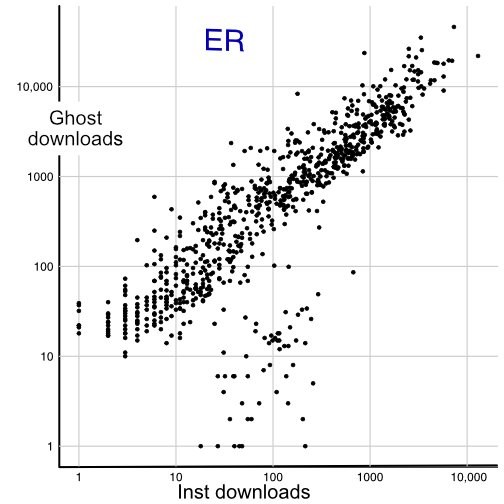
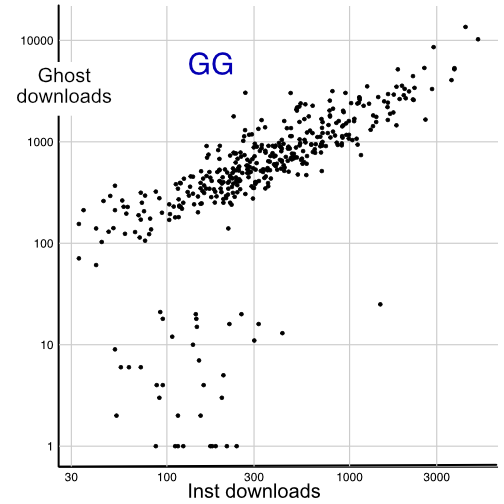
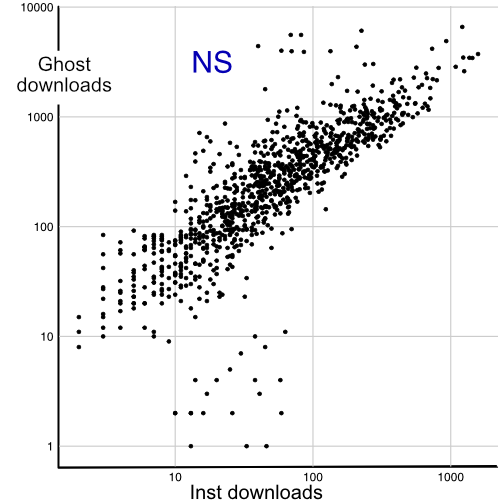
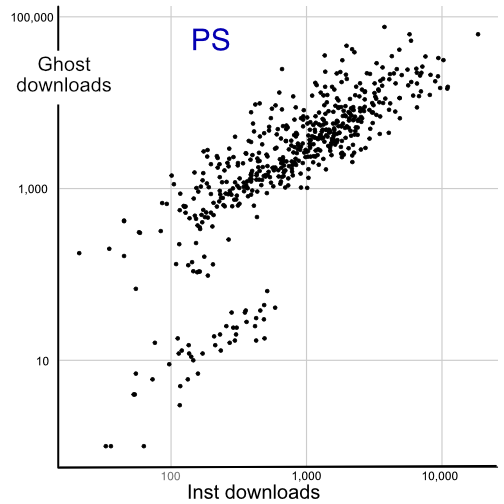
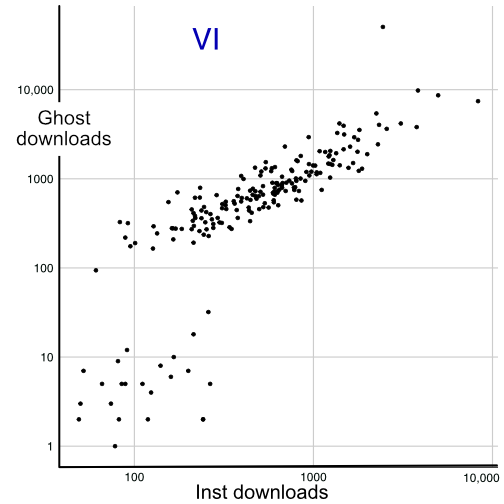
A useful first step is to examine the scatter plot of Inst downloads vs. Ghost downloads paper by paper. Do the Inst readers and Ghost readers prefer the same papers? For BE, the comparison is shown in Fig. 9. For this and the other journals, only a handful of papers are downloaded only by one group; these are omitted from the analysis. The plot shows a strong correlation between the papers chosen by the two sets of readers. The cluster of papers at very small download numbers turns out to be the set of papers in the most recent two annual volumes. Articles from the 2022 volume obviously could not be downloaded in 2020-21. More generally, it takes some time for the search engines to catch up to the existence of the most recent articles. In performing fits to this and similar distributions, I disregard these low-download points and use the data in the top cluster only.
Looking more closely, the ratio of the number of downloads between the highest- and lowest-cited papers in the major group is larger for the Inst readers than for the Ghost readers, a factor of about for the Ghost downloads and about for the Inst downloads. The effect is well described by a simple linear fit of the logarithms of the downloads, corresponding to
| (1) |
where and are the downloads of a given paper from the Inst and Ghost readers, respectively. The same pattern is seen in the other 6 journals. Table 3 gives the fitted values of the exponent for the 7 S2O journals. All fits here and below are done using the lm package in R [12]. Fitting to a higher-order polynomial gives a minor improvement of the fit, not enough to overcome the clarity of the interpretation in (1). The ranks of downloaded papers are also highly correlated. The last column of the table gives the Spearman rank correlation coefficient [13] for each data set. By this measure, the Inst and Ghost readers rank the downloaded papers in almost the same way.
In all cases, is smaller than but close to 1. It is remarkable that the values of do not depend on the nature of the field in any systematic way. The scatter plots for the other 6 journals are given in Appendix A.
| AR journal | ||
|---|---|---|
| BE | ||
| CB | ||
| ER | ||
| GG | ||
| NS | ||
| PS | ||
| VI |

Notice that there is no evidence for robotic downloads in the Ghost reader data. A robot that downloads indiscriminately from a subset of the journal issues would leave an imprint as a horizontal band on the scatter plot, with many articles at roughly the same number of Ghost downloads independent of the number of downloads from the presumably better informed Inst readers. An important feature that checks this is that the Ghost readers disfavor the same papers as the Inst readers. An indiscriminate robot would randomly pick up some of these disfavored papers. My attempts to fit the Zipf curves with a fraction of the Ghost downloads from robotic downloads from a subset of the volumes give results of the form shown in Fig. 10. This is not the right way to obtain a good fit to the Zipf curve data.
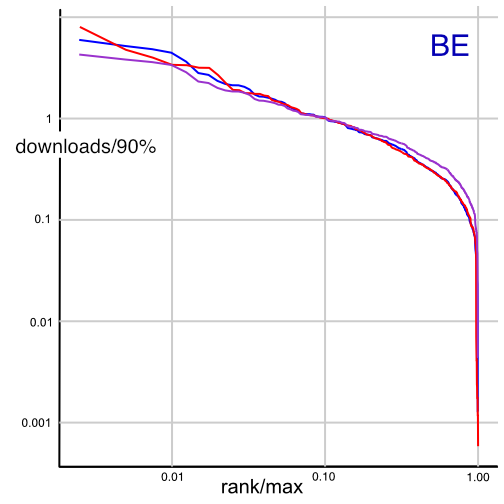
Because the Ghost readers have a smaller variation in downloads than the Inst readers, one might expect that the Zipf curves for the Ghost readers to remain higher for most of the range in (rank), so that the Ghost curves (red) would typically lie above the Inst curves (blue). Looking over the results in Figs. 6 and 7, it is clear that this is not always the case. I have tried quite hard to find a causal mechanism for the differences without finding a compelling answer. However, there is an important source of random variation among the curves. A difficulty with using the ratio rank/maximu rank as a variable is that the number of downloads for a given rank can depend strongly on the number of downloads for the few most-downloaded papers. It can be seen from the scatter plots that the ratio of Ghost to Inst downloads of the most downloaded papers often vary substantially from the fit to eq. (1), and sometimes these leading papers are not even the same in the two samples. This suggests that the overall relative normalization of the Inst and Ghost curves can fluctuate in a random way.
A way to test this is to normalize the number of downloads to a paper that is deeper in the downloads distributions. To avoid picking a paper from the very large number with few downloads, I have chosen to normalize to the number of downloads at 90th percentile in each distribution. This number is typically about 20% of the maximum value. (Normalizing at the 75th percentile gives similar curves.) I show the results for BE in Fig. 11. The change in reference value essentially removes the discrepancy between the Inst and Ghost curves. In the figure, the blue line is the original Inst curve simply rescaled. The purple curve is the tranformation of the Inst curve using the formula (1) to convert Inst downloads to Ghost downloads. This gives a small improvement in the description of the Ghost curve (red) over part of its range. The similar curves for the other 6 journals are given in Appendix A. In general, it is not clear whether the blue or purple curve is a better model for the red curve. The two hypothesis are quite similar due to the closeness of to 1. Also, the slope of the relation between Inst and Ghost downloads does depend on the rank in a way that is not captured by the simple relation (1). Whichever model is chosen, the similarity of the fitted curves to the true Ghost download data shows that the differences seen in Section 5 come almost entirely from the fluctuations in downloads of the very top-cited papers. They are not a real effect rather just reflect the luck of the draw.
There are differences in behavior between the Inst and Ghost readers. One indication of this is the narrower range of download values characterized by . Also, as noted already in [9], the Ghost downloads contain a significantly higher fraction of html vs. pdf than the Inst downloads, possibly indicating a tendency for immediate reading or checking references. These tendencies might indicate different readers, but they might also indicate the same readers carrying out different tasks at different times of the day. Even with these small differences, one cannot escape the striking similarities of the Inst and Ghost samples.
7 Pandemic-period results
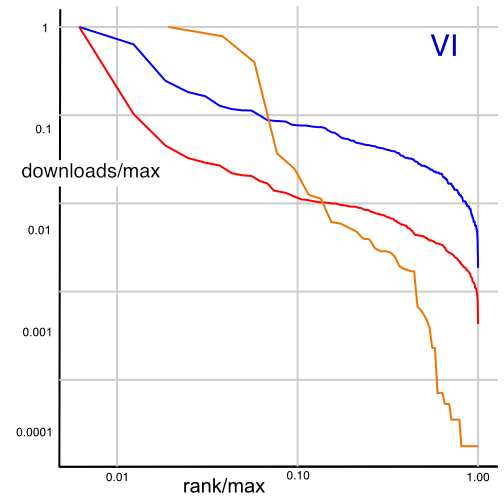

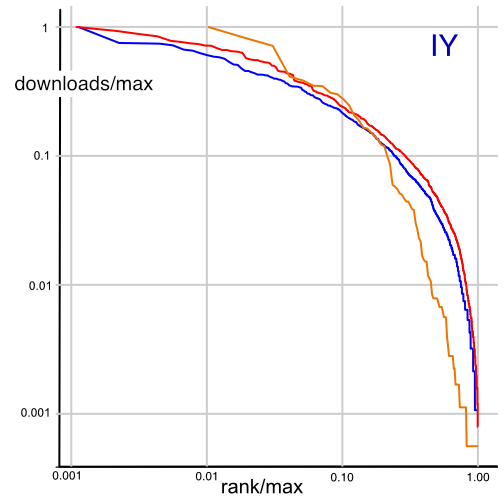
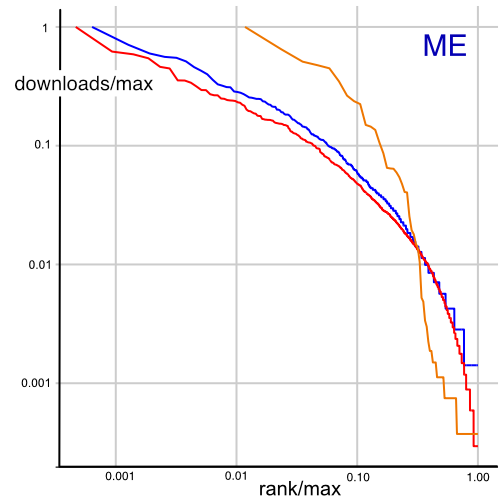
It should be asked whether the qualitative similarity of the Inst and Ghost Zipf curves is ever broken in the AR data. There is one interesting example of this. During the early months of the pandemic, AR made many of its articles on coronaviruses free to read (Free Access). This may have driven readers to explore other articles in AR Virology. As I noted in Section 2, all of the AR journals were made OA for a period of 3 months from mid-March to mid-June 2020. One might then expect that the Ghost curve for VI in this period would be highly skewed toward papers on viral diseases. Fig 12 compares the Zipf curves for VI in the pandemic OA period and the period of S2O access beginning in November 2021. The difference is striking, with the pandemic downloads clearly showing concentration on the most highly downloaded articles. Oddly, this effect is not seen in the usage of AR Immunology (IY) and AR Medicine (ME) during the pandemic period, as shown in Fig. 13. Both journals do show a high usage of Free Access articles.
8 Conclusions
In this paper, I have examined the reading habits of the Open Acess “Ghost readers”, readers who access OA papers without leaving identifiable signals of their identity. I find that, for usage of the AR journals Open Access under the S2O policy in 2020-2022, the behavior of the Ghost readers is very similar to that of readers from identified academic institutions. This is true over the 7 journals from diverse fields for which data is available. The same pattern is seen for readers from all regions of the world, both in developed and emerging nations.
The simplest explanation for the evidence presented here is that the “Ghost readers” are not ghosts at all. They are educated scientists, our colleagues and students. Open Access simply makes it easier to access the articles that the scientists in this group need to do their research.
There are other indications that working scientists will access papers more frequently when paywalls are absent. The most striking example of this is the large usage from North America of the illegal pirate site Sci-Hub, as reported by John Bohannon in Science [14]. In this article, Bohannon points out not only that a large fraction of Sci-Hub usage comes from the US, but also that this usage is concentrated near US academic centers. I do not find these results surprising. As a working scientist, I know that when I am hot on the trail of an idea and I see a reference to a paper that has relevant information, I need to have it. If I am not in my office and the paper is blocked by a paywall, I am quick to seek a publicly available version. In my field of high-energy physics, almost all journal articles are available in preprint form on the Cornell arXiv [15]. Other scientists are not so fortunate. It would be a great benefit to publishers, libraries, and researchers if the easiest way to access any journal article would be from the journal website itself.
If indeed the “Ghost readers” are us and our colleagues, we must take seriously the increase in usage that is a well-documented feature of Open Access publication. If Open Access increases the utility of journal articles, it is a positive benefit to all readers, but, in particular, to university scientists whose libraries are responsible for the support of their journals. I have shown that, for the case of the AR journals, this benefit is strongly felt not only for those readers who cannot afford access but also for scientists in regions where their work is strongly supported by government and by universities. It would be very illuminating to carry out studies of the sort that I have presented here for other types of journals and, in particular, for journals that present primary research articles.
The S2O model of Open Access favored by Annual Reviews continues to put the burden of paying for journals on university librarians. But, it does not increase these costs, and it offers increased local usage as a benefit. It also gives librarians agency to decide which journals they will support to keep in business with their limited funding.
To the extent that the conclusions of this paper hold broadly for scientific journals, they make a strong case for Open Access publication that is independent of the idealistic case described at the beginning of this paper. If Open Access benefits all of us in the academic community, and if it can come as a benefit with no increase in expense, we academics should make it our standard practice.
ACKNOWLEDGEMENTS
I am grateful to Paul Calvi, Oren Bergman, Roy Marucut and Richard Gallagher at Annual Reviews for making the database described in this paper available to me and for assistance with its use. I thank Paul Ginsparg, Kamran Naim, and Laura Peskin for advice and comments on the manuscript. The data analysis in this paper was done using Hadley Wickham’s “tidyverse” [16].
References
- [1] https://www.budapestopenaccessinitiative.org/read/ .
- [2] P. M. Davis and W. H. Walters, “The impact of free access to the scientific literature: a review of recent research”, J. Med. Libr. Assoc. 99, 208 (2011).
- [3] A. Langham-Putrow, C. Bakker, and A. Riegelman, “Is the open access citation advantage real? A systematic review of the citation of open access and subscription-based articles”, PLoS ONE 0253129 (2021).
- [4] H. Piwowar et al., “The state of OA: a large-scale analysis of the prevalence and impact of Open Access articles”, PeerJ 6:e4375 (2018).
- [5] G. K. Zipf, Selected studies of the principle of relative frequency in language. (Harvard Univ. Press, 1932).
- [6] D. M. W. Powers. “Applications and Explanations of Zipf’s Law”, in New Methods in Language Processing and Computational Natural Language Learning , ACL Anthology https://aclanthology.org/W98-1218.pdf .
- [7] https://subscribetoopencommunity.org/ .
- [8] D. Nicholas, P. Huntington, and H. R. Jamali, “Open access in context: a user study”, J. Documentation, 63, 853 (2007).
- [9] P. M. Davis, B. V. Lewenstein, D. H. Simon, J. G. Booth, and M. J. L. Connolly, “Open access publishing, article downloads, and citations: randomised controlled trial”, BMJ 337:a568 (2008).
- [10] P. M. Davis, “Open access, readership, citations: a randomized controlled trial of scientific journal publishing”, FASEB Journal, 25, 2129 (2011).
- [11] https://www.annualreviews.org/about/impact-factors .
- [12] R Foundation for Statistical Computing, https://www.r-project.org/ .
- [13] C. Spearman, “The proof and measurement of association between two things”, Amer. J. of Psychology. 15, 72 (1904).
- [14] J. Bohannon, Science, 352, 508 (2016).
- [15] https://arxiv.org/ .
- [16] H. Wickham et al., “Welcome to the Tidyverse”, J. Open Source Computing 4, 1686 (2019).
Appendix A Additional figures
Here are the supplementary figures referred to in the text.
