The strength and weakness of disease-induced herd immunity
Abstract
When a fraction of a population becomes immune to an infectious disease, the risk of widespread outbreaks decreases non-linearly as a result of the collective protection known as herd immunity. Typically, immunity to a disease can be acquired through natural infection or vaccination. It has been argued that natural infection in a heterogeneous population may induce a stronger herd immunity effect than homogeneous vaccination, because the early stages of transmission would primarily affect highly interactive individuals, leading to more efficient suppression of subsequent infections. In this study, we provide a comprehensive assessment of the herd immunity effect by analyzing the behavior of the susceptible-infected-recovered (SIR) model on static contact networks. We find that the effectiveness of disease-induced herd immunity is shaped by two competing mechanisms: While it exploits degree heterogeneity in the contact network to efficiently target highly connected individuals for immunity, it also introduces mixing heterogeneity between immune and susceptible individuals, weakening herd immunity. By controlling the degree of spatial embeddedness of the contact network structure, we find that spatial structure generally makes herd immunity stronger and also enhances the advantage of the herd immunity effect induced by random immunization over the disease-induced one in networks with low degree heterogeneity. These findings provide valuable insights into the complexity of herd immunity and have implications for designing effective disease control strategies.
I Introduction
When an infectious disease is transmitted directly through contact between individuals, conferring immunity on individuals has a non-linear impact on the level of protection of the population as a whole. Even if the disease is transmissible enough to spread through an immunologically naive population, it may stop circulating when a fraction of the population is immune due to either previous infection or vaccination. This phenomenon is called “herd immunity”, as it represents a collective effect where the immune individuals convey protection to the entire population. There are parallels between herd immunity and percolation phenomena, where a continuous phase transition separates the two phases in which the disease dies out and in which it spreads through a finite fraction of the population [1, 2, 3, 4, 5].
Historically, the threshold for herd immunity has been calculated assuming a population that is homogeneous in terms of mixing and consequently in terms of the number of contacts per individual (degree): everyone can randomly interact with everyone else, giving rise to Poisson degree distribution. Importantly, it has also been assumed that there is no structure in how immunity is distributed in the population. However, these assumptions are overly simplistic when applied to real-world populations—in reality, contact patterns are not uniform and random, mixing within the population is typically heterogeneous [6, 7, 8, 9], and immunity may not be uniformly distributed [10, 11].
Many of such heterogeneities are readily captured by the complex networks of contacts through which the disease spreads. Network epidemiology has revealed the significant impact of heterogeneity on epidemic spread, challenging simplistic assumptions of homogeneity [12, 13, 2, 14]. For instance, in scale-free networks, the threshold can be as low as one, implying that containment is impossible unless the entire population acquires immunity. On the other hand, population heterogeneity can be leveraged to design targeted and efficient immunization strategies. Furthermore, a recent study by Britton et al. [15] demonstrated that, when immunity is induced by natural infection, population heterogeneity may lead to a lower herd immunity threshold than expected under homogeneous mixing because the disease spreads among highly interactive individuals at the early stage of the epidemic, resulting in more efficient immunization of these influential hubs.
However, in addition to degree heterogeneity, the structural aspects of the contact network need to be addressed. Random immunization through vaccination that is agnostic to individual attributes distributes immunity uniformly throughout the population; in contrast, natural immunity is inherently localized in the contact network. This is because those who get infected in an outbreak that originates from a single source are connected to each other in a chain of transmission, necessarily forming a connected subgraph in the contact network. This gives rise to mixing heterogeneities between immune and susceptible individuals, akin to those discussed in the context of vaccination and other interventions [16, 17, 10, 11, 18]. The consequences of such localization for herd immunity have not yet been explored in a systematic way [19, 20, 21].
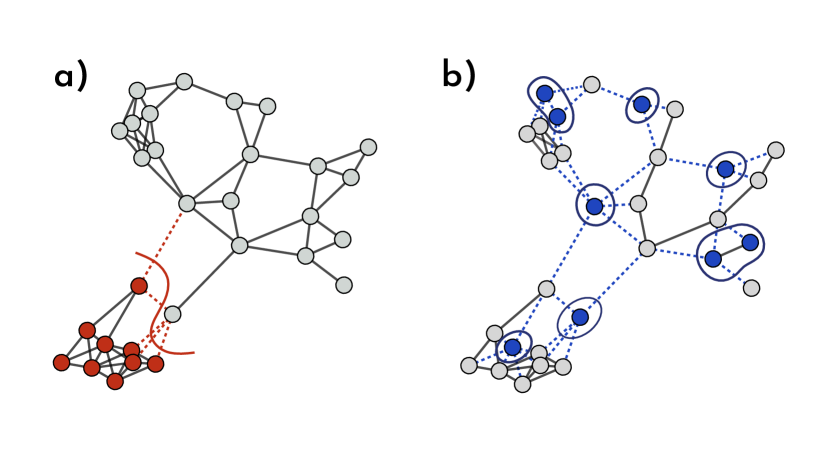
Our aim in this paper is to conduct a comprehensive analysis of herd immunity induced by natural infection on contact networks by comparing it to the benchmark of herd immunity induced by random immunization. Building on the framework introduced by Newman [22], we employ the susceptible-infected-recovered (SIR) dynamics as the epidemic model and measure the largest possible epidemic size after removing the recovered nodes. We show that the net effectiveness of disease-induced herd immunity is determined by the interplay of two competing mechanisms: the preferential immunization of highly connected nodes by the epidemic and the localization of immune nodes within the contact network. The former makes the herd immunity effect stronger, while the latter makes it weaker. Refer to Fig. 1 for visualization.
We illustrate the presence of the two mechanisms by inspecting the mean degree in the residual subgraph and the cut size between the removed and residual subgraphs. We analytically show that within the configuration model family of networks, the natural infection and random immunization yield herd immunity of equal effectiveness, specifically in Erdős-Rényi (ER) contact networks, even though they result in different mean residual degrees and cut sizes. Natural infection has an advantage over random immunization in networks with higher degree heterogeneity, while the opposite is true for networks with a more homogeneous degree distribution.
We further extend the comparison between natural infection and random immunization across various network geometries. Namely, we explore a wide spectrum of networks by systematically varying the levels of degree heterogeneity and spatial embeddedness of the network. Interestingly, when the spatially constrained network structure is gradually perturbed through random rewiring of edges, we find a non-monotonous behavior in both the strength of disease-induced herd immunity and its relative advantage over random immunization.
II Model
II.1 Epidemic dynamics and immunity
The susceptible-infected-recovered (SIR) model is a canonical compartmental model for non-recurrent epidemics. The individuals and the contacts between them are represented as nodes and edges in a static, undirected contact network of size . Each node can be in one of three states: susceptible, infected, or recovered. The dynamics run in continuous time. Transmission occurs between each connected pair of an infected node and a susceptible node independently at rate , after which the susceptible node becomes infected. An infected node recovers at rate , losing the ability to infect its neighbors. After recovery, nodes gain immunity and never become infected again, meaning that they are effectively removed from the system. The probability that transmission occurs on an edge between an infected node and a susceptible node is given by [2]. In the following, we set without loss of generality.
We consider two scenarios for introducing immunity into a fully susceptible population. In the first scenario, individuals gain immunity through infection and subsequent recovery. We randomly select a seed node to be initially infected. After the disease spreads from this primary source of infection and eventually dies out, we remove the recovered nodes (i.e., those who experienced infection) from the contact network. The second scenario is random immunization, where we randomly select individuals to be immunized and removed from the contact network.
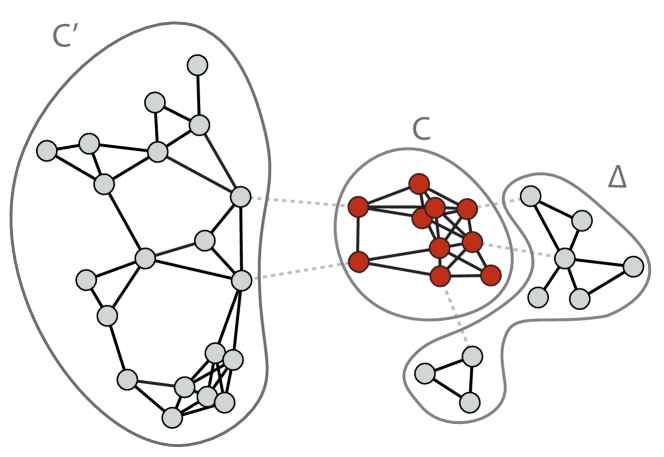
Regardless of how immunity is induced, its effectiveness at the population level is defined by its ability to prevent future occurrences of diseases from invading the population and to reduce the size of epidemics. Specifically, consider a disease that spreads among susceptible individuals with a transmission rate that is potentially larger than but cannot infect the immune (and removed) individuals. If immunity is conferred on a fraction of the population, either by natural infection or immunization, the subsequent epidemic cannot be larger than as a result of individual protection. In fact, is the size of the subgraph induced by the nodes that remained susceptible, which we call residual subgraph. The actual size of the epidemic depends on the contagiousness of the disease, but it is further upper bounded by the size of the giant component of the residual subgraph, or residual giant component for short. Since the removed nodes, which account for a fraction , are protected by individual immunity, the difference between the sizes of the residual subgraph and its giant component quantifies the herd immunity effect in the case where the transmission rate is infinitely large. See Fig. 2 for a schematic illustration.
II.2 Network structure
For analytical tractability, networks are often assumed to be locally tree-like, meaning that the likelihood of a node being part of a finite-length cycle diminishes as the network size increases. This simplifies analysis, especially for configuration model networks where the network structure is solely determined by the distribution of node degrees.
However, the real-world contact networks through which infectious diseases spread are hardly tree-like. Rather, they are characterized by the abundance of short cycles, which stems from the fact that contacts are heavily influenced by physical space; transmission only occurs when individuals are in physical proximity to each other, resulting in network structures that deviate from the locally tree-like assumption and exhibit a higher prevalence of triangles and other short cycles.
In this study, we aim to explore a wide range of network geometries, focusing on two key characteristics: degree heterogeneity (variations in node connectivity) and spatial embeddedness. Figure 3 illustrates these features. Spatial embeddedness refers to the geometric arrangement of the network within a specific metric space. The least spatial networks belong to the configuration model family, representing maximum randomness under the given degree distribution. This includes random regular graphs (RRGs) and Erdős-Rényi (ER) networks. On the other end of the spectrum, lattices and random geometric graphs (RGGs) exhibit the highest spatiality.
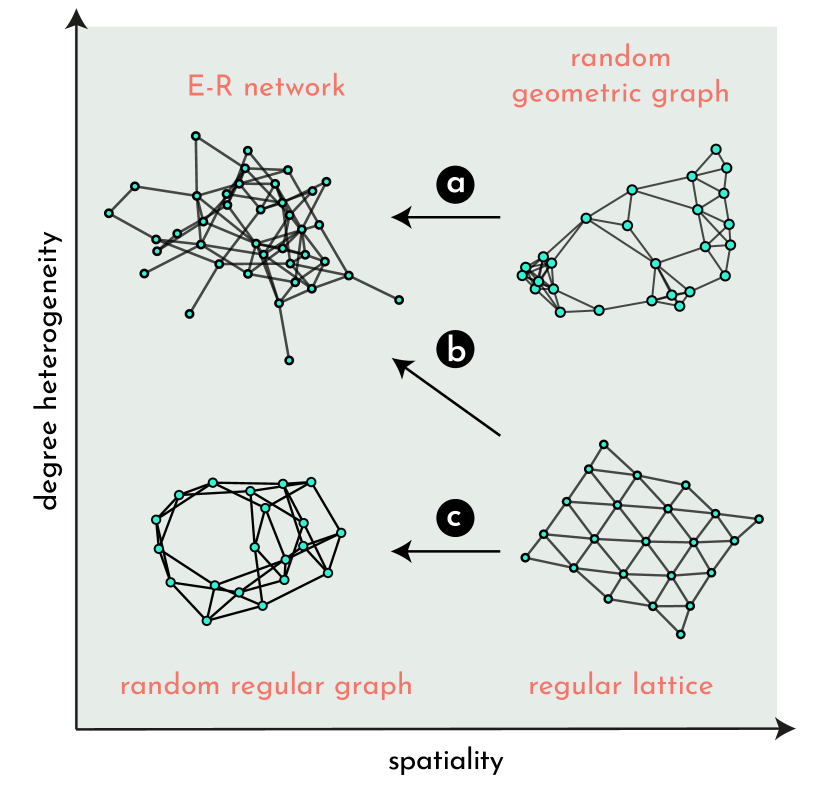
To continuously connect the two extremes of the spatiality spectrum, we employ edge randomization procedures. We start with an instance of a network model with the highest spatiality, namely a lattice or an RGG, and rewire fraction of the edges. The rewiring process is carried out either by exchanging the endpoints of two randomly selected edges (double edge swap) [23], or by removing a random edge and adding an edge between a randomly selected unconnected pair of nodes (random rewiring). The former preserves the degree of each node, while the latter only preserves the total number of edges in the network but not the individual node degrees. By completely shuffling edges (i.e., ), the double edge swap operation transforms a lattice into an RRG and an RGG into an ER network. On the other hand, random rewiring effectively generates an ER network at , irrespective of the initial structure.
III Preferential but localized immunity
Let us first focus on the herd immunity effect in configuration model networks, where the degree distribution is the only determinant of the network structure. Because of the locally tree-like property of configuration model networks, we can use the analytical framework to map epidemic spreading to bond percolation process and solve self-consistent equations to derive and calculate relevant quantities, such as the expected sizes of an outbreak and the giant component in the residual subgraph [2, 22]. We begin with defining the probability generating functions (PGFs) of the degree distribution and the excess degree distribution :
When the immunity of nodes is induced by natural infection with transmission probability , probability that a random edge does not transmit the disease during the first outbreak satisfies a self-consistency equation [2]: A node is susceptible after the first outbreak (and thus in the residual subgraph) if each of its neighbors either (i) does not become infected (in which case the edge between them remains S-S), which happens with probability , or (ii) becomes infected but fails to infect the node (in which case the edge between them is S-R), which happens with probability . Since the probability of being in the residual subgraph is , the degree distribution of the residual graph is given by [22]
The PGFs of the degree and excess degree of the residual graph are given by
respectively. We obtain the size of the giant component in the residual graph as where is the solution of self-consistent equation .
This framework allows us to calculate not only the fraction of nodes in each state but also the fraction of edges between nodes in each state. For instance, a random edge will have a removed node on one end and a susceptible node on the other end with probability . Therefore, the fraction of edges between susceptible and removed nodes is
| (1) |
where factor accounts for the arbitrariness in choosing the ends of the edge.
If the immunity is instead induced by random immunization of coverage , the immunity of neighbors are independent, so the residual degree is distributed as
Following the same recipe, the PGFs of the degree and excess degree of the residual graph are given by
The size of the giant component in the residual graph is given by The fraction of edges between susceptible and removed edges is simply
| (2) |
To see the impact of localization of the disease-induced immunity on herd immunity, we first look at regular random graphs in which every node has the same degree . The PGFs of the contact network are given by
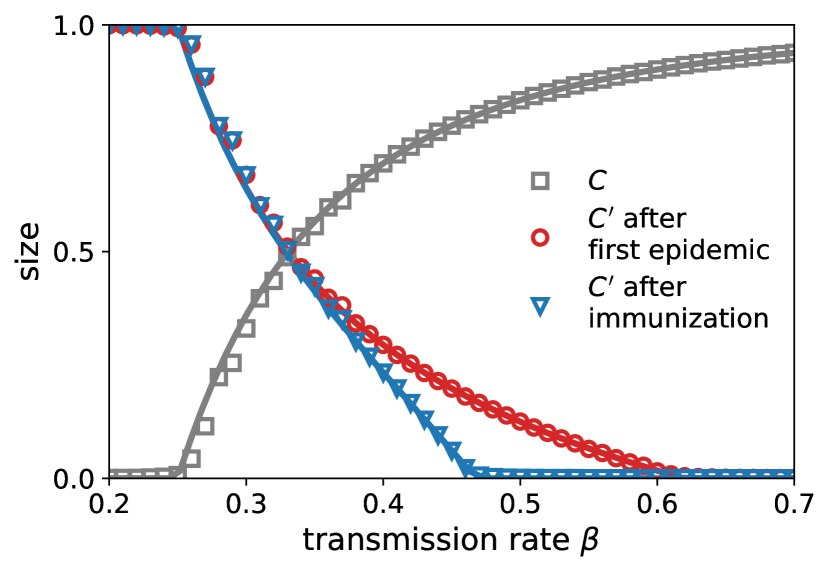
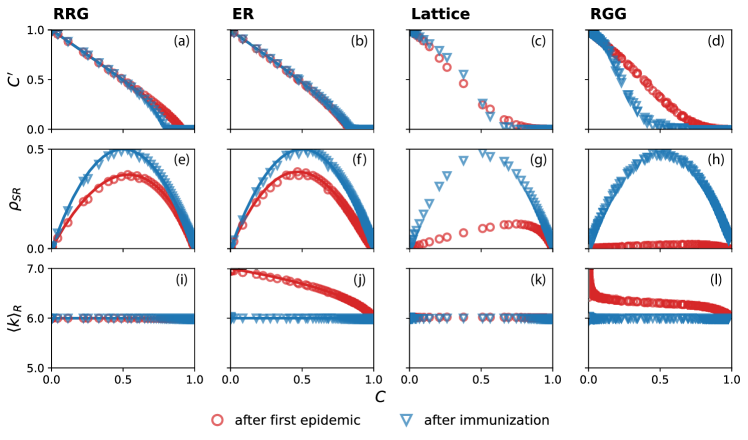
By numerically solving the self-consistent equations, we obtain a theoretical prediction for , which is corroborated by numerical results as shown in Fig. 4. The numerical results are obtained by averaging over 50 different realizations. Our results clearly show that the giant component of the residual graph is smaller after random immunization compared to the case where immunity is induced by natural infection. This means that, in the absence of degree heterogeneity, random immunization provides a significant advantage in building herd immunity compared to relying on natural infection.
Next, let us discuss the case where the contact network is an instance of the Erdős-Rényi (ER) network. In a large ER network, the degree distribution is a Poisson distribution, i.e., the degree and excess degree are generated by the same PGF:
where is the mean degree. In this case, the PGF of the residual degree is the same for disease-induced immunity and random immunization:
In other words, the residual graphs in the two scenarios have the same degree distribution, and therefore, the effect of herd immunity is equal. This is again supported by the results from numerical simulation (see Fig. 5(b)). Interestingly, even in this case, the fraction of edges between susceptible and removed nodes, , is smaller in the case of disease-induced immunity, indicating localization of the first epidemic (Fig. 5(f)). However, the impact of localization is canceled out by the effect of preferential infection and immunization of high-degree nodes, which is represented by the larger average degree of removed nodes (Fig. 5(j)).
IV Effect of spatiality on herd immunity
In the previous section, we limited ourselves to the family of configuration model networks, which are characterized by the locally tree-like property and thus provide analytical insights into the impact of the degree distribution on the strength of herd immunity. In this section, we explore a wider range of network structures by introducing spatiality. In particular, we investigate the effect of spatial structure on herd immunity by studying canonical spatial graphs, namely lattices and random geometric graphs, and by systematically interpolating the spatial-to-tree-like spectrum of network structures via random rewiring of edges.
First, we consider contact networks modeled by triangular lattices and random geometric graphs (RGGs) with an average degree of . Figure. 5(c) compares the size of the giant component in the residual graph in lattices. We see mixed results when comparing the two strategies: Natural infection results in smaller than random immunization when the fraction of removed nodes is small, while the trend is reversed as becomes closer to the transition point, although the difference between the two strategies is small over the entire range of . The strong localization of the removed nodes for the disease-induced immunity is manifested in the fraction of boundary edges, shown in Fig. 5(g). For RGGs, we find that random immunization is much more effective in dismantling the residual giant component compared to disease-induced immunity, as shown in Fig. 5(d). Although the disease-induced immunity can exploit the degree heterogeneity of RGGs, the localization of disease-induced immunity is even more emphasized (Fig. 5(h)), overtaking the effect of preferential removal of high-degree nodes (Fig. 5(l)).
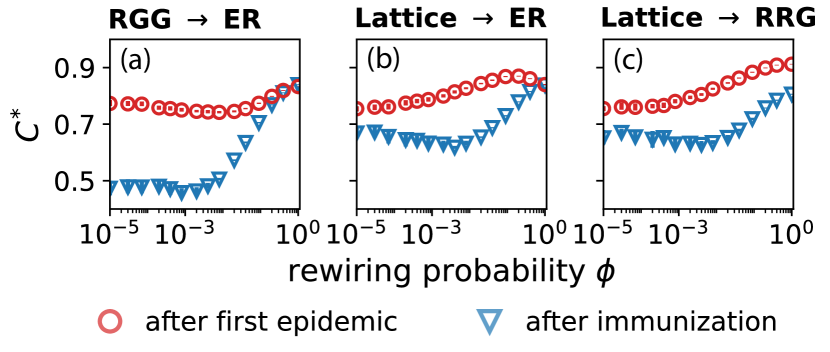
Next, we investigate how different levels of spatiality affect the herd immunity effect. To this end, we use the edge rewiring method described in the Model section. Specifically, we apply the degree-preserving process (double edge swaps) to transform the contact network structure from a lattice to an RRG and from an RGG to an ER network; in addition, we use the non-degree-preserving process (random rewiring) for transformation from a lattice to an ER network. To summarize the effectiveness of herd immunity for each value of , we introduce , the minimum fraction of nodes that need to be removed to dismantle the residual giant component, i.e., . In other words, even a disease with an infinitely large transmission rate cannot invade the population if ; thus, represents the herd immunity threshold in the worst case. Here, we numerically identify by observing the value of when is the largest.
Figure 6 shows as a function of rewiring probability for each rewiring path. Each data point represents 50 independent realizations of the contact network structure at a given . We see that for each path, random immunization leads to smaller than disease-induced immunity over the entire range of except for the case of the ER network, for which is equal in both scenarios. This confirms our previous findings for the configuration networks that random immunization provides a greater benefit to herd immunity when the degree distribution is more homogeneous than the Poisson distribution. We also find that the is generally smaller for spatial networks (on the left end) compared to configuration networks (on the right end). The difference between and is most pronounced for the case of random immunization in the RGG and ER network, but the same trend is seen for all of the scenarios and rewiring paths.
By inspecting threshold as a function of rewiring probability , we find that it is not linear and, in many cases, not even monotonic. This is especially true for random immunization, where is minimized at the intermediate values of . Compared to random immunization, changes more modestly in the case of disease-induced immunity. As a result, the difference in the transition points under the two scenarios is greatest in the region where takes intermediate values. This can be explained as follows: When a small number of edges are rewired (), the network is locally full of short cycles, and these local neighborhoods are bridged by a few long-range edges. When natural infection induces immunity in such a network, large pockets of susceptibles will remain in the network after the first outbreak if the infection fails to spread across the bridging edges. On the other hand, random immunization will have an equal ability to block infection in every local neighborhood, so the effect of low-dimensionality that makes percolation more difficult becomes predominant, leading to smaller values of .
V Conclusion
In this paper, we investigated the effectiveness of disease-induced immunity as compared to random immunization. First, we analytically compared the herd immunity effect, quantified by the size of the giant component in the residual graph, under the two scenarios in configuration model networks. We found that disease-induced immunity leads to a weaker effect than random immunization in the absence of degree heterogeneity, while both of them lead to an equivalent amount of herd immunity for Erdős-Rényi networks. This is a consequence of the competition between the two mechanisms that shape disease-induced herd immunity: while an epidemic preferentially infects and removes high-degree nodes, making the herd immunity effect stronger, it is contiguous and localized in the contact network, making herd immunity weaker. The presence of these two mechanisms is captured by the fraction of edges between susceptible and removed nodes and the average degree of removed nodes, respectively. Our results show that the impact of localization outweighs that of preferential removal of high-degree nodes in weakly heterogeneous networks.
We further examined the role of the spatiality of the contact network structure on herd immunity. By scanning through the spectrum of spatiality by rewiring edges of lattices and random geometric graphs, we find that spatial network structure generally makes herd immunity stronger. The influence of space is particularly pronounced in the case of random immunization, giving it an additional advantage over disease-induced immunity. Furthermore, we found a non-monotonic behavior in the effectiveness of herd immunity as a function of edge rewiring probability. Throughout the rewiring process, the small-world property emerges as long-range connections form within the network [24, 25]. The connection between the small-world property and herd immunity would be an interesting direction for further investigation.
We note that a similar line of research has been explored in the pioneering work by Ferrari et al. [19]. However, their work is based on observation of numerical simulations and rather ad hoc quantification. Furthermore, the network structures considered are limited to a few representative ones corresponding to discrete points in the space of network geometries we study here. Our contribution in this work is to elucidate the origins of the variation in herd immunity strength, to provide theoretical support for evaluating the effectiveness of disease-induced herd immunity, and to cover the full range of network geometries in order to provide a fuller picture of the strength and weakness of disease-induced herd immunity.
In order to further advance our understanding of disease-induced herd immunity, future research should explore the implications of our findings for networks with stronger degree heterogeneity, such as scale-free networks. Although this line of research is particularly relevant for real-world applications since most empirical contact networks are known to be degree heterogeneous, the challenge would be to develop a network model that allows for both tunable degrees of degree heterogeneity and spatiality. In addition, investigating the herd immunity effect in real-world social networks, which often exhibit various structural features, such as communities, core-periphery structures, and households, would provide valuable insights into the epidemic dynamics in a more realistic setting. Such studies would help bridge the gap between theoretical models and practical applications, contributing to the development of effective strategies for disease control and prevention.
Acknowledgements.
VI Acknowledgments
MK acknowledges support from the project 105572 NordicMathCovid as part of the Nordic Programme on Health and Welfare funded by NordForsk. The authors wish to acknowledge Aalto University “Science-IT” project for generous computational resources.
References
- Hethcote [2000] H. W. Hethcote, The mathematics of infectious diseases, SIAM Review 42, 599 (2000).
- Newman [2002] M. E. J. Newman, Spread of epidemic disease on networks, Physical Review E 66, 016128 (2002).
- Pastor-Satorras et al. [2015] R. Pastor-Satorras, C. Castellano, P. Van Mieghem, and A. Vespignani, Epidemic processes in complex networks, Reviews of Modern Physics 87, 925 (2015).
- Badie-Modiri et al. [2022a] A. Badie-Modiri, A. K. Rizi, M. Karsai, and M. Kivelä, Directed percolation in temporal networks, Physical Review Research 4, L022047 (2022a).
- Badie-Modiri et al. [2022b] A. Badie-Modiri, A. K. Rizi, M. Karsai, and M. Kivelä, Directed percolation in random temporal network models with heterogeneities, Physical Review E 105, 054313 (2022b).
- Newman [2003] M. E. J. Newman, Mixing patterns in networks, Physical Review E 67, 026126 (2003).
- Lloyd-Smith et al. [2005] J. O. Lloyd-Smith, S. J. Schreiber, P. E. Kopp, and W. M. Getz, Superspreading and the effect of individual variation on disease emergence, Nature 438, 355 (2005).
- Mossong et al. [2008] J. Mossong, N. Hens, M. Jit, P. Beutels, K. Auranen, R. Mikolajczyk, M. Massari, S. Salmaso, G. S. Tomba, J. Wallinga, J. Heijne, M. Sadkowska-Todys, M. Rosinska, and W. J. Edmunds, Social Contacts and Mixing Patterns Relevant to the Spread of Infectious Diseases, PLoS Medicine 5, e74 (2008).
- Hébert-Dufresne et al. [2020] L. Hébert-Dufresne, B. M. Althouse, S. V. Scarpino, and A. Allard, Beyond R0 : heterogeneity in secondary infections and probabilistic epidemic forecasting, Journal of The Royal Society Interface 17, 20200393 (2020).
- Burgio et al. [2022] G. Burgio, B. Steinegger, and A. Arenas, Homophily impacts the success of vaccine roll-outs, Communications Physics 5, 70 (2022).
- Hiraoka et al. [2022] T. Hiraoka, A. K. Rizi, M. Kivelä, and J. Saramäki, Herd immunity and epidemic size in networks with vaccination homophily, Physical Review E 105, L052301 (2022).
- Pastor-Satorras and Vespignani [2001] R. Pastor-Satorras and A. Vespignani, Epidemic Spreading in Scale-Free Networks, Physical Review Letters 86, 3200 (2001).
- Pastor-Satorras and Vespignani [2002] R. Pastor-Satorras and A. Vespignani, Immunization of complex networks, Physical Review E 65, 036104 (2002).
- Keeling and Eames [2005] M. J. Keeling and K. T. Eames, Networks and epidemic models, Journal of The Royal Society Interface 2, 295 (2005).
- Britton et al. [2020] T. Britton, F. Ball, and P. Trapman, A mathematical model reveals the influence of population heterogeneity on herd immunity to SARS-CoV-2, Science 369, 846 (2020).
- Burgio et al. [2021] G. Burgio, B. Steinegger, G. Rapisardi, and A. Arenas, Homophily in the adoption of digital proximity tracing apps shapes the evolution of epidemics, Physical Review Research 3, 033128 (2021).
- Rizi et al. [2022] A. K. Rizi, A. Faqeeh, A. Badie-Modiri, and M. Kivelä, Epidemic spreading and digital contact tracing: Effects of heterogeneous mixing and quarantine failures, Physical Review E 105, 044313 (2022).
- Watanabe and Hasegawa [2022] H. Watanabe and T. Hasegawa, Impact of assortative mixing by mask-wearing on the propagation of epidemics in networks, Physica A: Statistical Mechanics and its Applications 603, 127760 (2022).
- Ferrari et al. [2006] M. J. Ferrari, S. Bansal, L. A. Meyers, and O. N. Bjørnstad, Network frailty and the geometry of herd immunity, Proceedings of the Royal Society B: Biological Sciences 273, 2743 (2006).
- Hasegawa and Masuda [2011] T. Hasegawa and N. Masuda, Robustness of networks against propagating attacks under vaccination strategies, Journal of Statistical Mechanics: Theory and Experiment 2011, P09014 (2011).
- Bansal and Meyers [2012] S. Bansal and L. A. Meyers, The impact of past epidemics on future disease dynamics, Journal of Theoretical Biology 309, 176 (2012).
- Newman [2005] M. E. J. Newman, Threshold Effects for Two Pathogens Spreading on a Network, Physical Review Letters 95, 108701 (2005).
- Fosdick et al. [2018] B. K. Fosdick, D. B. Larremore, J. Nishimura, and J. Ugander, Configuring Random Graph Models with Fixed Degree Sequences, SIAM Review 60, 315 (2018).
- Watts and Strogatz [1998] D. J. Watts and S. H. Strogatz, Collective dynamics of ‘small-world’ networks, Nature 393, 440 (1998).
- Newman et al. [2002] M. E. J. Newman, I. Jensen, and R. M. Ziff, Percolation and epidemics in a two-dimensional small world, Physical Review E 65, 021904 (2002).