Characterization of Long AC-LGAD Strip developed by IHEP
Abstract
AC-coupled LGAD Strip (AC-LGAD Strip) is a new design of LGAD that allows high-precision detection of particle spatiotemporal information whereas reducing the density of readout electronics by using strip electrodes. Increasing the length of the electrodes is beneficial for reducing the electronic readout density. The Institute of High Energy Physics has designed a long AC-LGAD Strip prototype with a strip electrode length of 5.7 mm and pitches of 150 , 200 , and 250 . Timing and spatial resolutions of the long AC-LGAD Strip are studied by TCT laser scan test and Beta test. The TCT laser scan test demonstrates that spatial resolution improves as the pitch size decreases, with an optimal resolution achieved at 8.3 m. Conversely, the jitter remains relatively stable at 14.7 ps, regardless of pitch size. Additionally, the Beta test yields a timing resolution of 37.6 ps. Enhancing the Signal-to-Noise Ratio (SNR) and mitigating signal attenuation can further bolster spatial resolution, either by reducing the pitch size or optimizing the readout electronics. The outstanding performance exhibited by the Long AC-LGAD Strip positions it as a highly promising choice for 4D tracking applications in future particle physics experiments.
Index Terms:
AC-LGAD,Silicon Detector,Spatial resolution,Timing resolutionI Introduction
Low Gain Avalanche Diode (LGAD) have demonstrated excellent timing performance, making them essential for precise timing measurements in particle physics experiments[1, 2]. However, LGAD’s ability to achieve high-precision spatial resolution is limited due to the limitation of pixel size caused by dead zones (Junction Termination Extension (JTE) and P-stop)[3]. To overcome this limitation, AC-Coupled LGADs (AC-LGADs) have been developed as an extension of LGAD technology[4, 5]. AC-LGADs offer the capability to simultaneously measure time and space information with high precision and provide 100% filling factor and reduced electronic channel density compared to traditional LGADs[6, 7]. Building upon this progress, AC-LGAD Strips have emerged as a new variant of AC-LGADs[8, 9]. BNL and HPK have produced an AC-LGAD Strip with a length of 2.2 mm and studied its performance with proton beam[10]. AC-LGAD Strips have garnered significant interest and have been considered to be used in Electron-Ion Collider (EIC) as trackers and Time-of-Flight detectors simultaneously and has the potential to be used in future colliders[11, 12, 13, 14].
The Institute of High Energy Physics(IHEP) has designed a Long AC-LGAD Strip prototype, which utilizes strip electrodes of a 5.7 mm length. In this study, we investigate the timing resolution and spatial resolution of long AC-LGAD Strips. To perform this analysis, the Transient Current Technique (TCT) and Beta test were employed[15, 16]. This study will help to optimize the design of AC-LGAD detectors in the future.
II Introduction to Long AC-LGAD Strip
II-A Design of Long AC-LGAD Strip
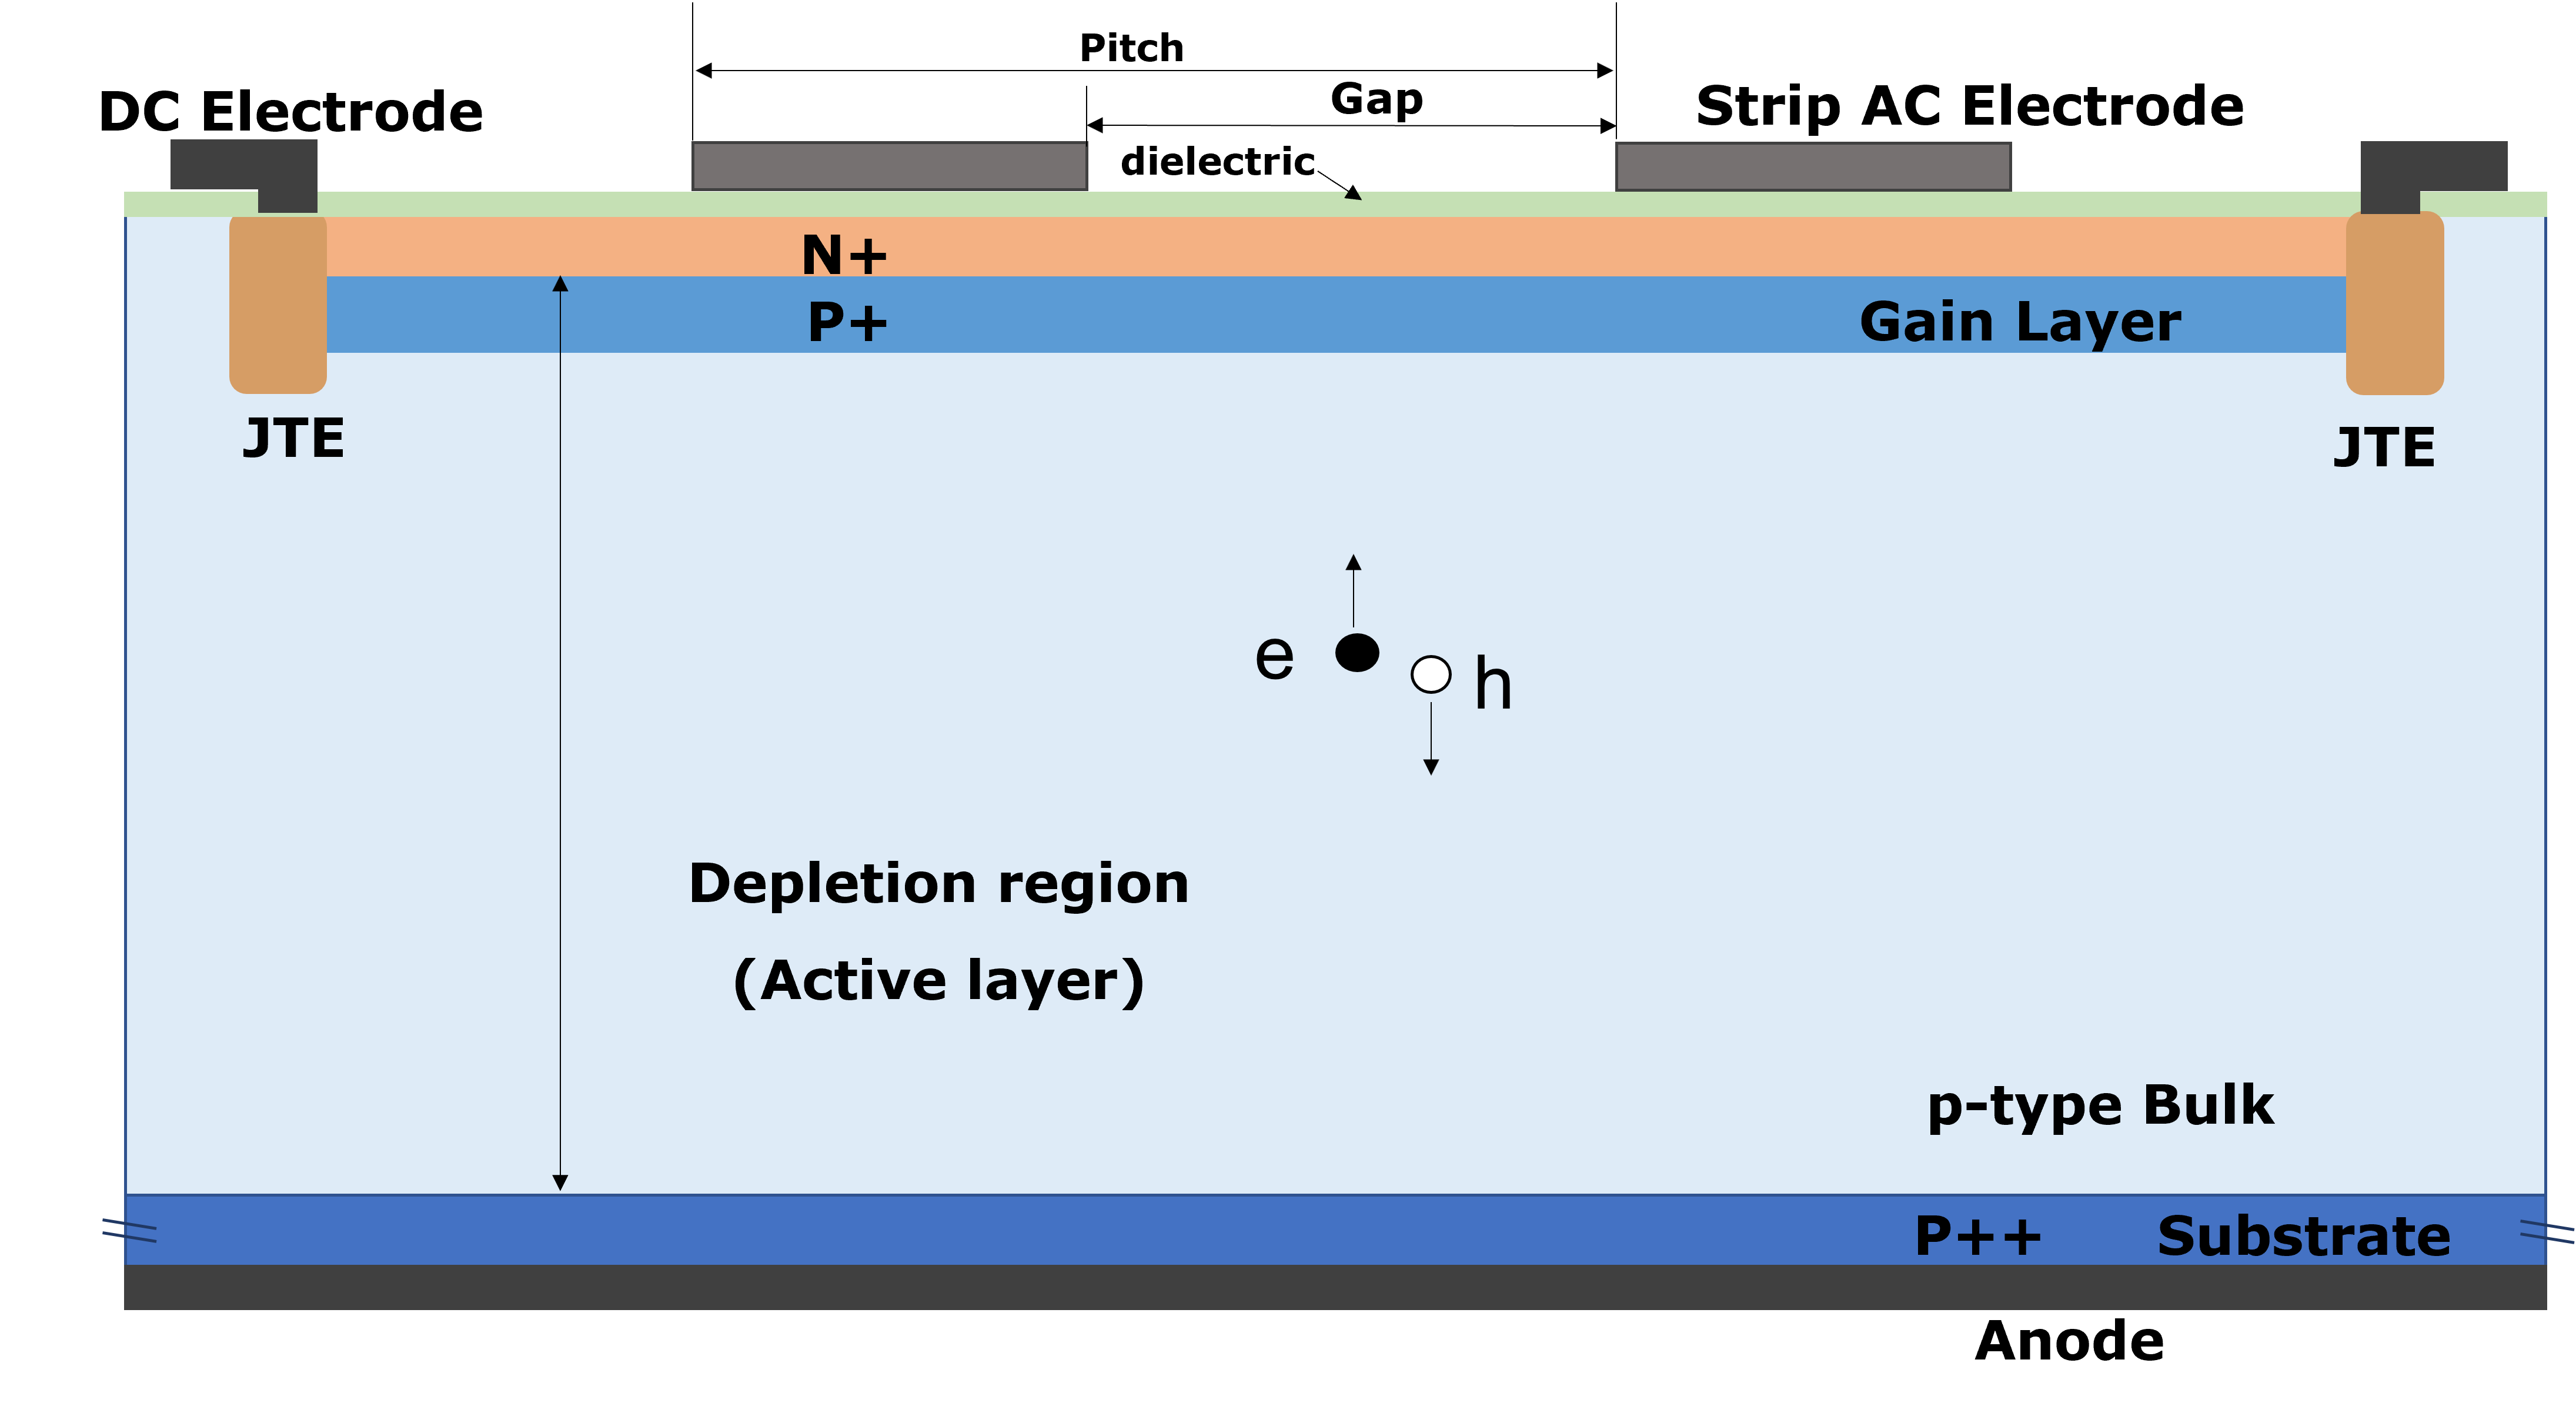
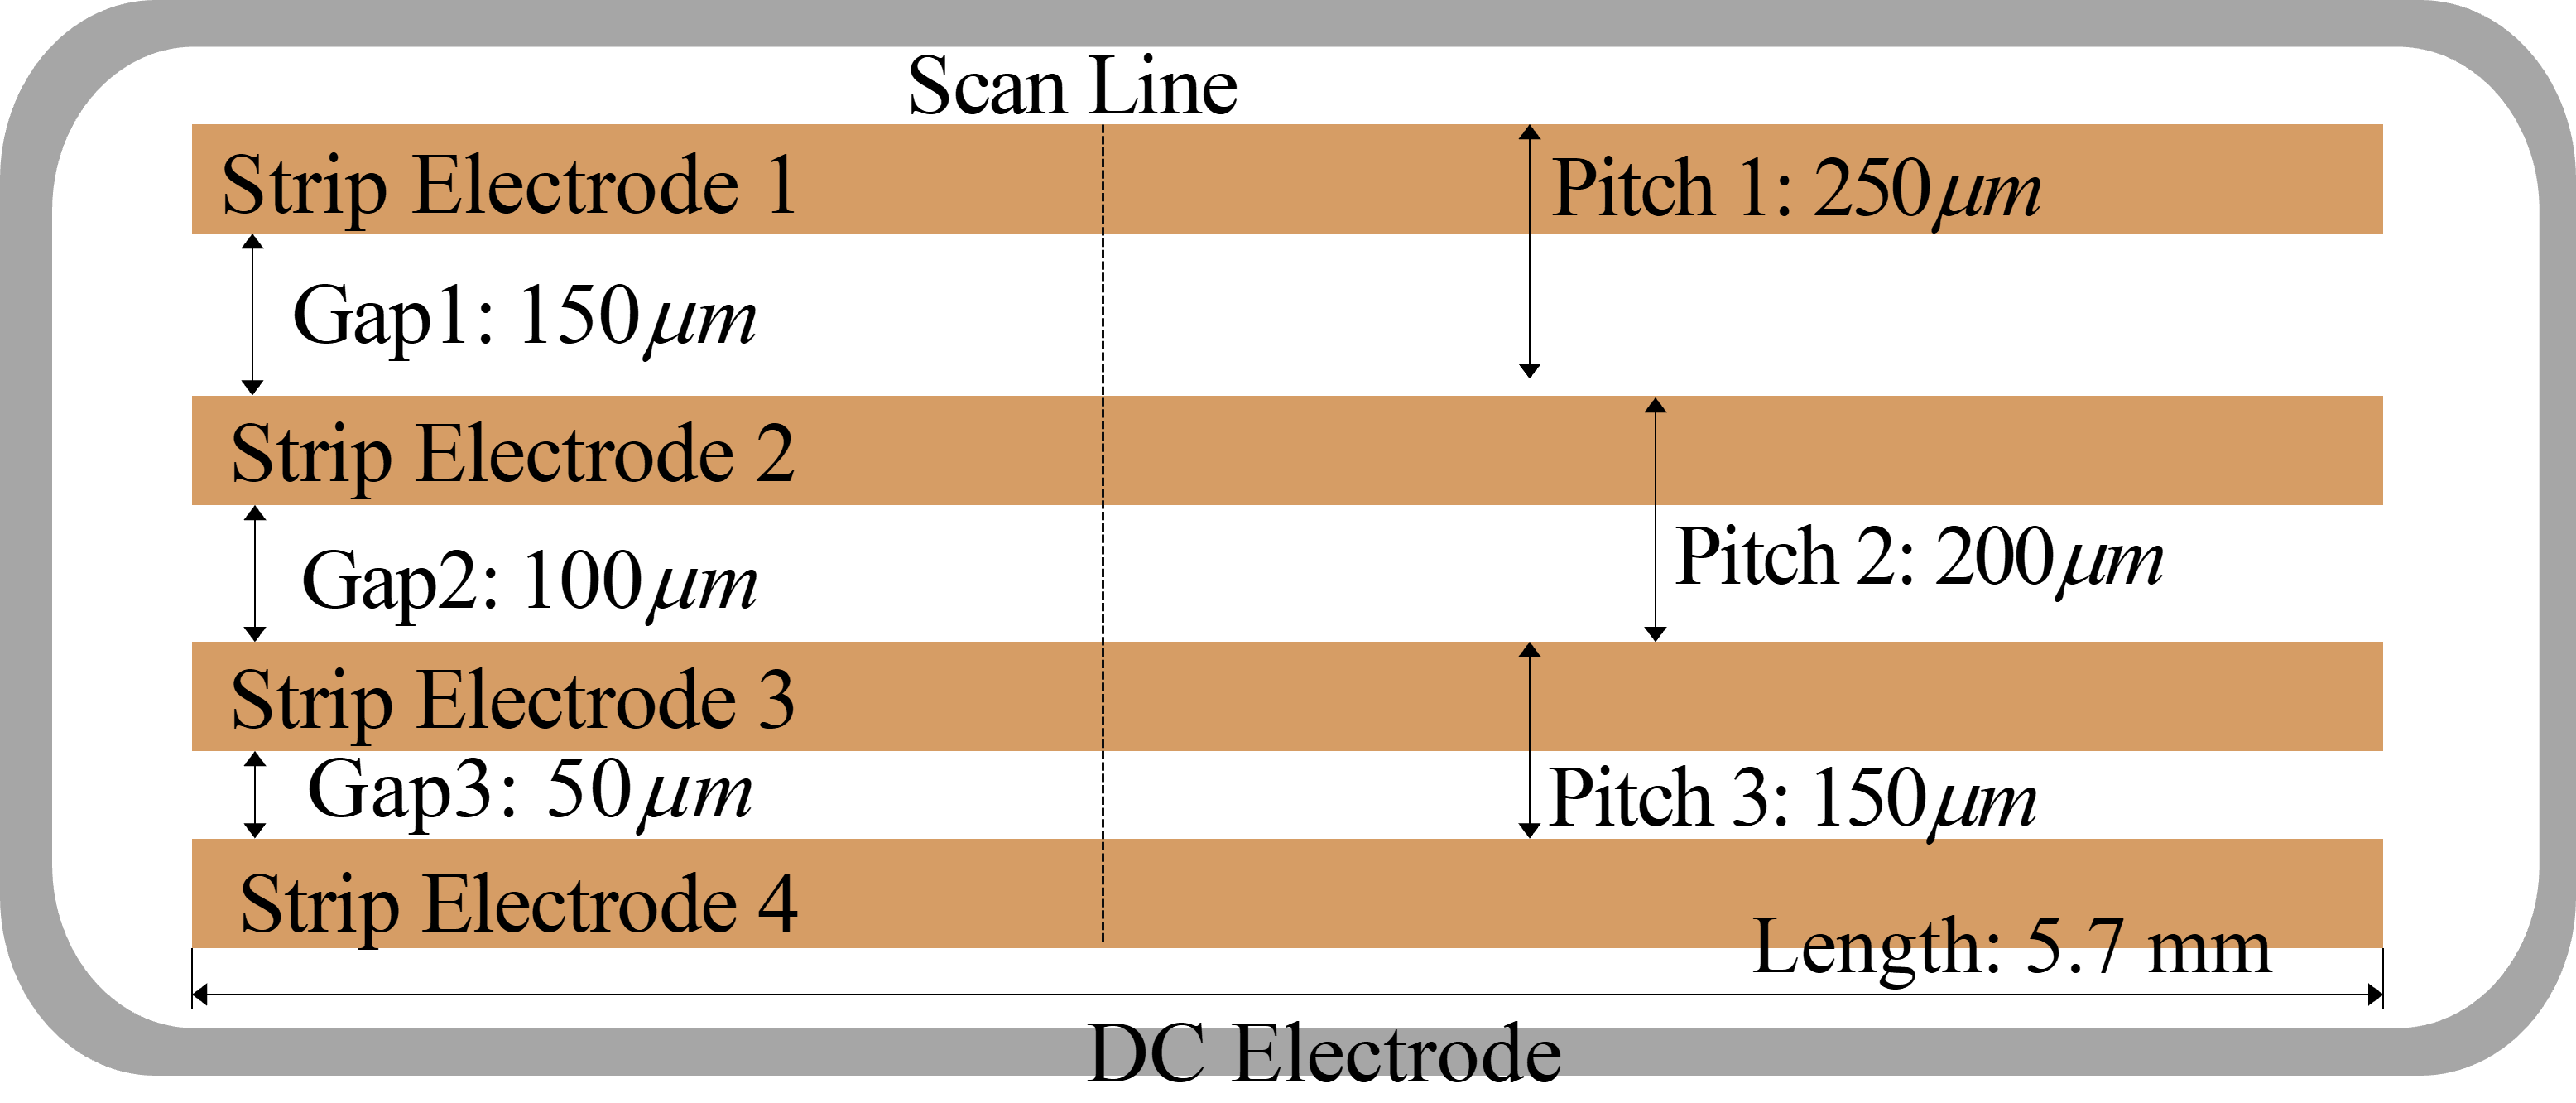
The Long AC-LGAD Strip sensor used in this experiment is designed by IHEP and fabricated by the Institute of Microelectronics (IME). The device contains strip electrodes, dielectric, DC electrode, N+ layer, P+ layer, P-type bulk, P++ layer, and aluminum anode as illustrated in Figure 1(a). The length of the strip electrodes is 5.7 mm. The presence of the dielectric layer eliminates the dead zone, which is the main feature that distinguishes AC-LGAD from DC-Coupled LGAD (DC-LGAD). The JTE is designed to uniform edge electric field, avoiding an early breakdown. The schematic of AC-LGAD Strip is shown in Figure 1(b). Three pitch sizes of 250 , 200 , and 150 are designed with the widths of the strip electrodes being 100. The gaps between two adjacent strip electrodes are 150 , 100 , and 50 .
II-B Electrical properties of Long AC-LGAD Strip
The break-down voltage, C-V, gain layer depletion voltage , and bulk depletion voltage characteristics are studied in this section.
The break-down voltage of the device is 385 V with a leakage current of 10 nA order.
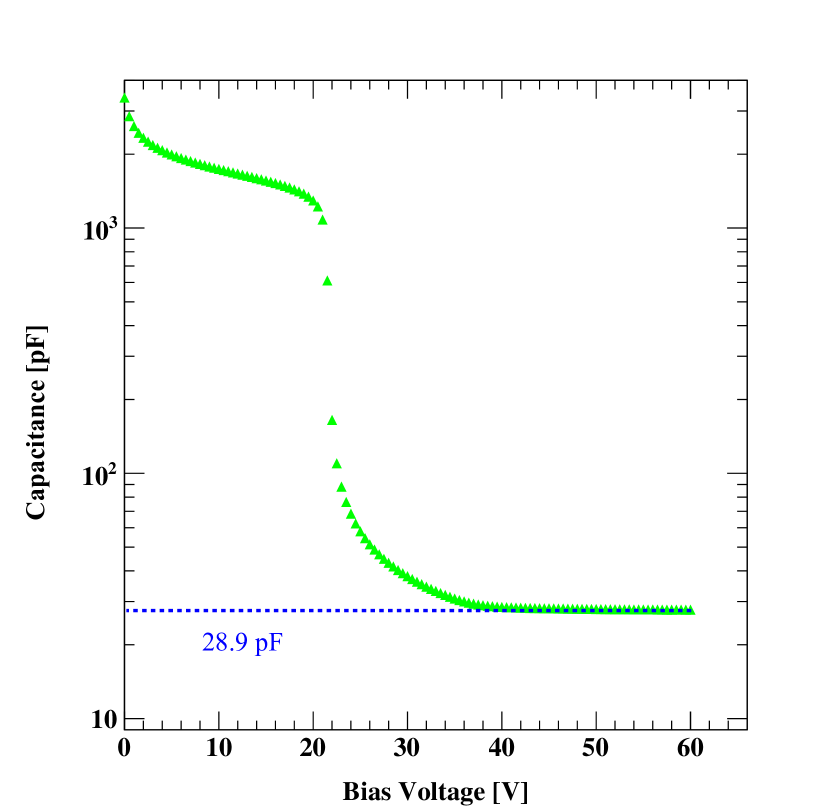
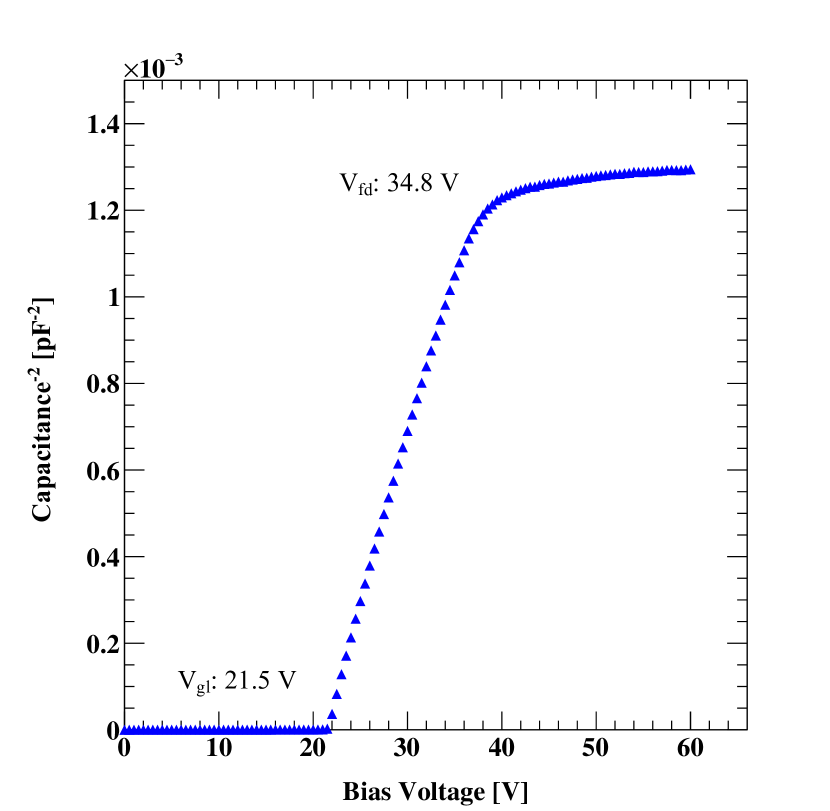
The capacitance between the DC electrode and anode bias voltage is shown in Figure 2(a). The capacitance value is greater than 2000 pF when no bias is applied and 28.9 pF when fully depleted. The capacitance-2 bias voltage is shown in Figure 2(b). of AC-LGAD Strip is 21.5 V, and is 34.8 V.
The capacitance between strip electrodes and DC electrode/N+ layer is measured to be pF.
III Experimental Setups
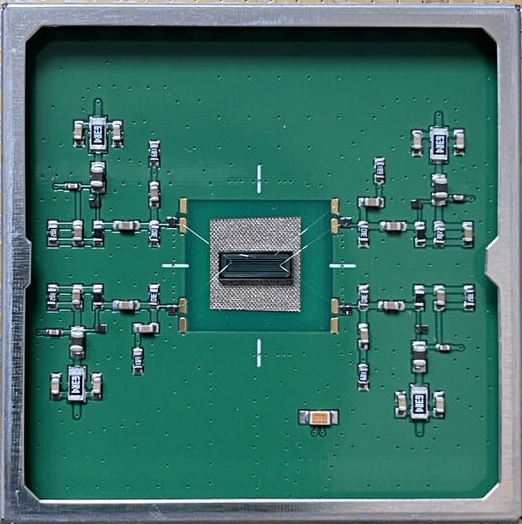
TCT laser scan and Beta tests are used to investigate timing and spatial resolutions. The TCT and Beta platforms contain read-out boards, amplifiers, oscilloscopes, a laser source, and a Beta source, respectively. The Long AC-LGAD Strip electrodes are bonded to the four-channel readout board, as shown in Figure 3. The electrodes’ signals are recorded by the oscilloscope (Teledyne LeCroy HDO9204) after the pre-amplifier and second amplifier. The oscilloscope’s bandwidth is 2 GHz, and the sampling rate is 20 G/s for four channels.
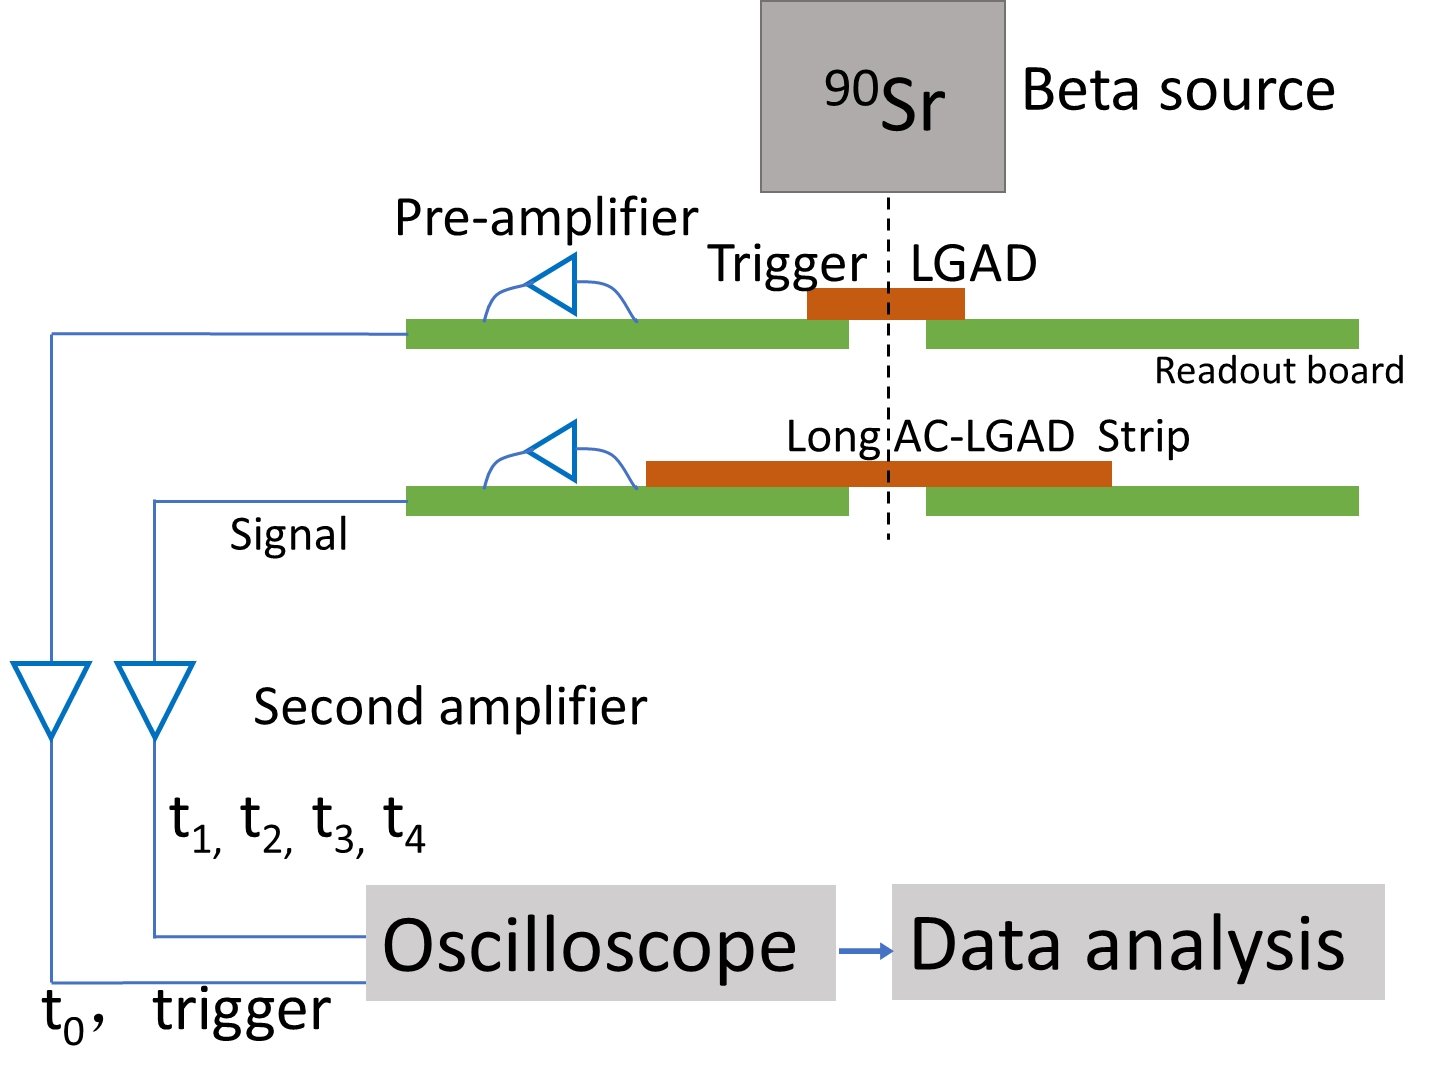
The read-out board is fixed to the Beta and TCT platforms, as shown in Figure 4.
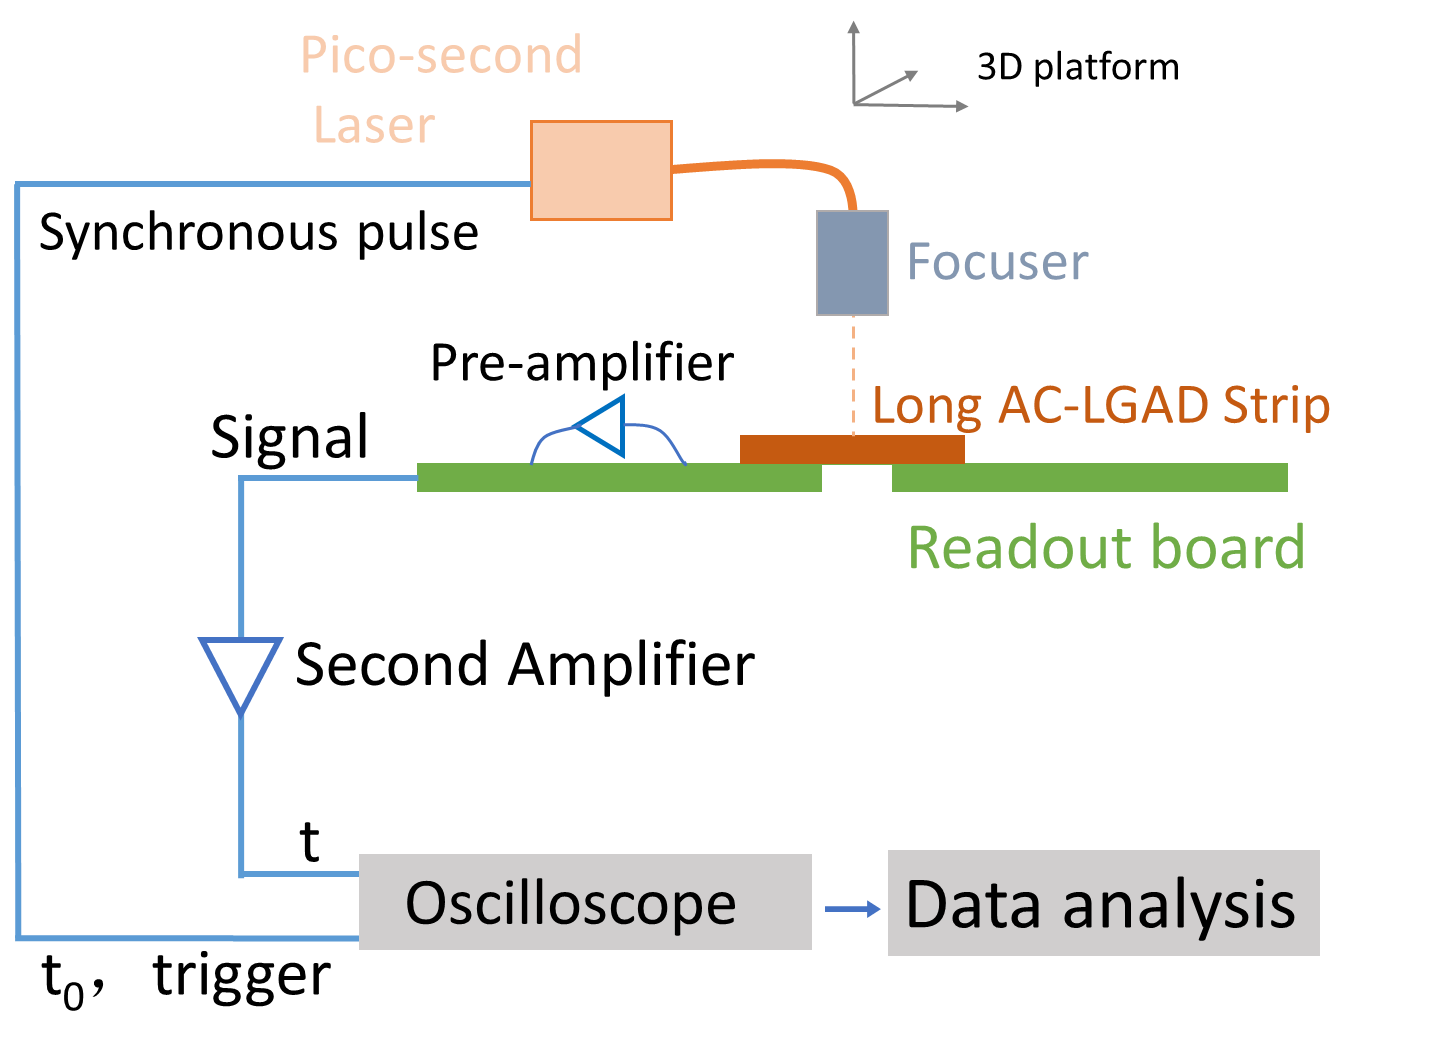
For the TCT laser scan, a picosecond laser pulse with a wavelength of 1064 nm hit the AC-LGAD Strip at a frequency of 20 MHz through a focuser. The focuser is fixed on the pinning table to achieve high-precision movement better than 1 . The laser scan tests start from the upper edge of strip electrode 1 and end at the lower edge of strip electrode 4 with a step of 2 , as shown in Figure 1(b). 1000 waveforms are recorded at each point before moving to the next point. Furthermore, the laser spot size remains within . Since the signal is not generated at the strip electrodes, gaps will be used to characterize pitch in the following.
For the Beta test, a calibrated LGAD (trigger LGAD) is placed above the AC-LGAD Strip as a trigger, and a 90Sr beta source is placed above the trigger LGAD.
IV Results of TCT laser scan test
IV-A Signal Property
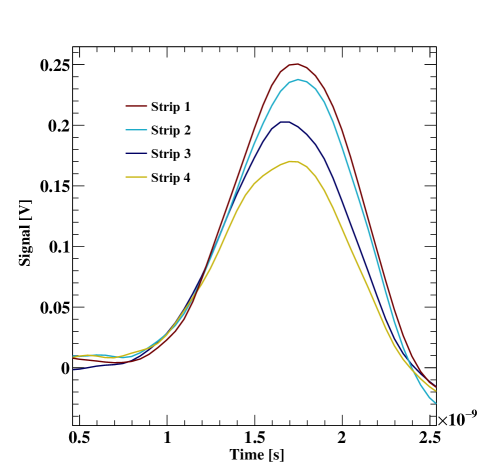
The amplitude of the signal induced by the laser decays with distance to the electrode, which leads to variations in the signal amplitudes of four electrodes. For instance, when a hit occurs in gap 1 and close to strip electrode 1, the signals exhibit different amplitudes in the four channels, as illustrated in Figure 5. Since the hit is closer to strip electrode 1, the maximum amplitude is observed in strip electrode 1, whereas the minimum amplitude is detected in strip electrode 4.
IV-B Position reconstruction
The position reconstruction method relies on the variation in signal amplitudes between the two strip electrodes closest to the hit position. When laser or particles hit gap 1, the signal amplitudes of electrodes 1 and 2 change with the hit position. The hit positions are characterized by the ratio , defined as:
| (1) |
Here, and represent the signal amplitudes of strip electrodes 1 and 2, respectively.
and signal amplitudes of strip electrodes 1 and 2 at different positions are shown in Figure 6.
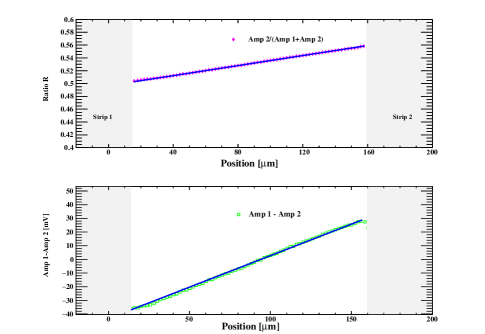
The relationship between and the hit position is approximately linear and can be fitted with . Therefore, the laser hit position can be calculated by the following equation:
| (2) |
Here, is the ratio, and are the fitted slope of and fitted constant, respectively. of the three gaps are 8.08, 8.83 8.83, 9.34.
IV-C Spatial and timing resolutions
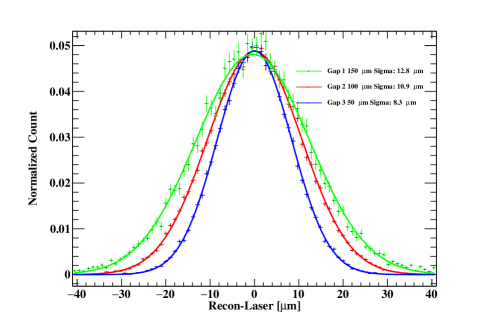
To obtain the spatial resolution, 1000 waveforms per laser hit position are recorded, resulting in 1000 reconstructed positions per laser hit position. The difference between the reconstructed and laser hit positions of all hits in the gap is plotted as one histogram. The sigma of the fit corresponds to the spatial resolution of the gap. Figure 7 shows the histogram of the differences between the reconstructed and true positions. The spatial resolutions of gap 1, gap 2, and gap 3 are determined to be 12.8 , 10.9 , and 8.3 , respectively.
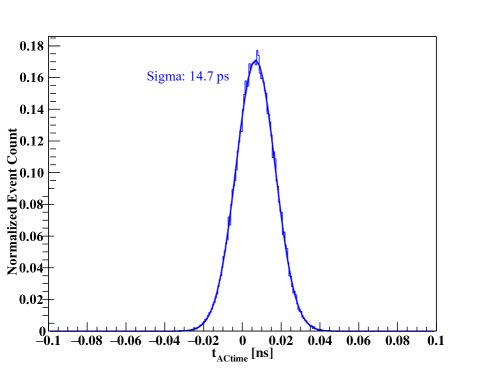
The timing resolution of the AC-LGAD Strip can be calculated from the histogram of (3) of 1000 waveforms [17]:
| (3) |
Here and are the cross-threshold times of strip electrodes 1 and 2, obtained using the constant fraction discriminator (CFD) method. The timing resolution is defined as the sigma of the distribution of . The distribution of is shown in Figure 8. Timing resolutions of the three gaps are 14.8 ps, 14.7 ps, and 14.8 ps. Since laser hit does not involve ionization energy deposition, timing resolution measured here is actually jitter time.
To investigate the factors affecting the , the difference between the signal amplitude of strips 1 and 2 in gap 1 is plotted in Figure 6(b). Since the signal amplitude diminishes as the distance from the strip electrode increases, the difference in signal amplitude between two strip electrodes is used to characterize the signal attenuation rate . is the amount of change in the signal amplitude per unit distance.
Figure 6(b) illustrates an approximately linear relationship between the difference in signal amplitude of strips 1 and 2 and the hit position. A linear fit is applied to its slope, which is the signal attenuation rate . of three gap are mV/, mV/ mV/.
The signal-to-noise ratio (SNR) of the three gaps is calculated. The noise and the signal of a gap is the average value of each hit in the gap, and the calculation of the noise and signal only involves the strip electrodes used for position reconstruction. SNR of the three gaps are 26.33, 26.30, 26.31.
The quantities associated with spatial and timing resolution are summarized in Table I
| Gap Width (m) | 150 | 100 | 50 |
|---|---|---|---|
| Spatial resolution (m) | 12.8 | 10.9 | 8.3 |
| Timing resolution (ps) | 14.8 | 14.7 | 14.7 |
| (m-1) | 8.1 | 8.8 | 9.3 |
| SNR | 26.33 | 26.30 | 26.31 |
| Signal attenuation rate (mV/m) | 0.41 | 0.45 | 0.52 |
Consequently, it can be concluded that the signal attenuation rate and increase as the gap width decreases. Smaller gap widths correspond to larger signal attenuation rate , and finally result in a larger . From equation (2), a larger results in a smaller difference between the hit and reconstructed positions caused by the same noise intensity. Therefore, increasing the signal attenuation rate through reduced gap width can enlarge the value of , leading to improved spatial resolution. Furthermore, reducing noise and increasing SNR can also enhance spatial resolution under similar signal amplitudes.
V Results of beta test
The timing resolution of the whole AC-LGAD strip consists of the following terms:
| (4) |
TCT scan can only investigate the Jitter term, and the contribution of the Landau term can be analyzed by a Beta test. Signal amplitudes of different hits vary, which leads to time walk effect contribution () and can be eliminated by the constant fraction discriminator (CFD) method. Landau fluctuations in the energy deposition non-uniformities bring the Landau contribution () along the path of a particle passing through the detector. Noise exists in every part of signal propagation and collection, and their contribution is characterized by ().
The CFD method is used to calculate timing resolution through the following equation:
| (5) |
Here is the timing resolution of trigger LGAD, which is 28.5 ps. is the variation of flight time of a MIP between the trigger LGAD and the AC-LGAD Strip and is defined as the sigma of the following distribution:
| (6) |
and are hit times measured on strip electrodes 1, 2, 3, and trigger LGAD. are signal amplitudes of strip electrodes 1, 2, and 3, and this weighting is to increase the contribution of the strip electrode with the largest signal amplitude to reduce the effect of noise on the timing resolution.
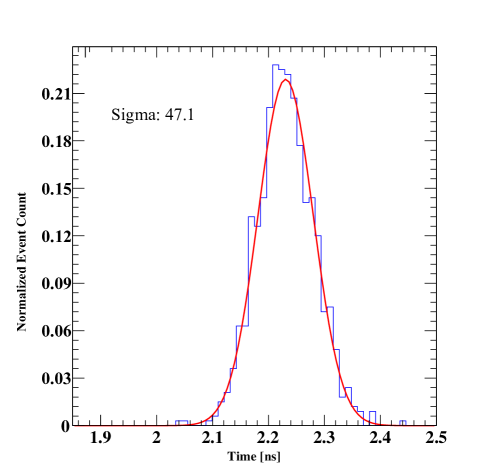
The distribution of is shown in Figure 9. The Sigma of the distribution is 47.1 ps, and the timing resolution of the AC-LGAD Strip is 37.6 ps.
VI Conclusion
The AC-LGAD Strip detectors, characterized by their lower readout electronic density, exhibit significant potential for application in future colliders. IHEP has designed a Long AC-LGAD Strip prototype with a 5.7 mm length and three pitches and conducted a laser TCT scanning test and Beta test to investigate the variations in spatial and timing resolutions of different gaps.
The break-down voltage of the Long AC-LGAD Strip is 385V, and are 21.5 V and 34.8 V. Experimental results show that the spatial resolutions of Long AC-LGAD Strip with pitch sizes of 150 , 200 , and 250 are 12.8 , 10.9 , 8.3 , respectively. A smaller pitch size has a larger signal attenuation rate and , and better spatial resolution. The time resolution is about 37.6 ps, and the pitch size has no effect on the jitter part in timing resolution, which is about 14.7 ps. The performance of the Long AC-LGAD Strip shows that it is a good choice for 4D-tracker in future particle physics experiments.
References
- [1] G. Pellegrini et al. “Technology developments and first measurements of Low Gain Avalanche Detectors (LGAD) for high energy physics applications” In Nuclear Instruments and Methods in Physics Research Section A: Accelerators, Spectrometers, Detectors and Associated Equipment 765 Elsevier BV, 2014, pp. 12–16 DOI: 10.1016/j.nima.2014.06.008
- [2] N. Moffat et al. “Low Gain Avalanche Detectors (LGAD) for particle physics and synchrotron applications” In J. Instrum. 13.03, 2018, pp. C03014 DOI: 10.1088/1748-0221/13/03/C03014
- [3] Gabriele Giacomini “Fabrication of Silicon Sensors Based on Low-Gain Avalanche Diodes” In Frontiers in Physics 9 Frontiers Media SA, 2021 DOI: 10.3389/fphy.2021.618621
- [4] G. Giacomini, W. Chen, G. D’Amen and A. Tricoli “Fabrication and performance of AC-coupled LGADs” In Journal of Instrumentation 14.09 IOP Publishing, 2019, pp. P09004–P09004 DOI: 10.1088/1748-0221/14/09/p09004
- [5] Koji Nakamura et al. “First Prototype of Finely Segmented HPK AC-LGAD Detectors” In Proceedings of the 29th International Workshop on Vertex Detectors (VERTEX2020) Journal of the Physical Society of Japan, 2021 DOI: 10.7566/jpscp.34.010016
- [6] H. Kim et al. “A silicon photo-multiplier signal readout using strip-line and waveform sampling for Positron Emission Tomography” In Nuclear Instruments and Methods in Physics Research Section A: Accelerators, Spectrometers, Detectors and Associated Equipment 830 Elsevier BV, 2016, pp. 119–129 DOI: 10.1016/j.nima.2016.05.085
- [7] G. Giacomini, W. Chen, G. D’Amen and A. Tricoli “Fabrication and performance of AC-coupled LGADs” In Journal of Instrumentation 14.09, 2019, pp. P09004 DOI: 10.1088/1748-0221/14/09/P09004
- [8] G. Paternoster et al. “Developments and first measurements of Ultra-Fast Silicon Detectors produced at FBK” In Journal of Instrumentation 12.02 IOP Publishing, 2017, pp. C02077–C02077 DOI: 10.1088/1748-0221/12/02/c02077
- [9] Kyoji Onaru et al. “Study of time resolution of low-gain avalanche detectors” In Nuclear Instruments and Methods in Physics Research Section A: Accelerators, Spectrometers, Detectors and Associated Equipment 985, 2021, pp. 164664 DOI: https://doi.org/10.1016/j.nima.2020.164664
- [10] R. Heller et al. “Characterization of BNL and HPK AC-LGAD sensors with a 120 GeV proton beam” In Journal of Instrumentation 17.05 IOP Publishing, 2022, pp. P05001 DOI: 10.1088/1748-0221/17/05/p05001
- [11] Jaroslav Adam “EIC Yellow Report”, 2021 DOI: 10.2172/1764596
- [12] A. Apresyan et al. “Measurements of an AC-LGAD strip sensor with a 120 GeV proton beam” In Journal of Instrumentation 15.09 IOP Publishing, 2020, pp. P09038–P09038 DOI: 10.1088/1748-0221/15/09/p09038
- [13] Sayaka Wada et al. “Evaluation of characteristics of Hamamatsu low-gain avalanche detectors” In Nuclear Instruments and Methods in Physics Research Section A: Accelerators, Spectrometers, Detectors and Associated Equipment 924 Elsevier BV, 2019, pp. 380–386 DOI: 10.1016/j.nima.2018.09.143
- [14] G. D’Amen et al. “First Characterization of AC-LGAD Sensors using a Readout ASIC” In 2021 IEEE Nuclear Science Symposium and Medical Imaging Conference (NSS/MIC) IEEE, 2021 DOI: 10.1109/nss/mic44867.2021.9875914
- [15] V. Eremin, N. Strokan, E. Verbitskaya and Z. Li “Development of transient current and charge techniques for the measurement of effective net concentration of ionized charges (Neff) in the space charge region of p-n junction detectors” In Nuclear Instruments and Methods in Physics Research Section A: Accelerators, Spectrometers, Detectors and Associated Equipment 372.3 Elsevier BV, 1996, pp. 388–398 DOI: 10.1016/0168-9002(95)01295-8
- [16] Moritz Wiehe et al. “Development of a Tabletop Setup for the Transient Current Technique Using Two-Photon Absorption in Silicon Particle Detectors” In IEEE Transactions on Nuclear Science 68.2, 2021, pp. 220–228 DOI: 10.1109/TNS.2020.3044489
- [17] Mengzhao Li et al. “The performance of large-pitch AC-LGAD with different N+ dose” In IEEE Transactions on Nuclear Science, 2023, pp. 1–1 DOI: 10.1109/TNS.2023.3289032