Polycyclic Aromatic Hydrocarbon Size Tracers
Abstract
We examine the dependence of polycyclic aromatic hydrocarbon (PAH) band intensity ratios as a function of the average number of carbon atoms and assess their effectiveness as tracers for PAH size, utilising the data, models, and tools provided by the NASA Ames PAH Infrared Spectroscopic Database. To achieve this, we used spectra from mixtures of PAHs of different ionisation fractions, following a size distribution. Our work, congruent with earlier findings, shows that band ratios that include the 3.3 µm PAH band provide the best PAH size tracers for small-to-intermediate sized PAHs. In addition, we find that band ratios that include the sum of the 15-20 µm PAH features (I) and the 6.2 or 7.7 µm bands also serve as good tracers for PAH size in the case of small-to-intermediate sized PAHs, for objects under a similar PAH size distribution as with the presented models. For different PAH size distributions, the application of a scaling factor to the I6.2/I ratio can provide estimates for the size of the small-to-intermediate PAH population within sources. Employment of the I6.2/I and I7.7/I ratios can be of particular interest for JWST observations limited only to 5-28 µm MIRI(-MRS) coverage.
keywords:
ISM: molecules – ISM: lines and bands – infrared: ISM – galaxies: ISM1 Introduction
Prominent emission features attributed to a family of organic aromatic molecules known as polycyclic aromatic hydrocarbons (PAHs; Leger & Puget, 1984; Allamandola et al., 1985) are observed in the 3-20 µm spectra of a wide variety of astrophysical sources, including planetary and reflection nebulae, disks around young stars, the general interstellar medium, star-forming regions, and galaxies. PAHs are an energetically important component of interstellar dust, responsible for of the total infrared (IR) emission in galaxies (Smith et al., 2007). The emission is produced when PAHs become vibrationally excited after the absorption of UV/Vis photons and subsequently relax through radiating in the IR, producing distinct and prominent bands at 3.3, 6.2, 7.7, 8.6, 11.2, and 12.7 µm, as well as weaker (satellite) features (e.g., Tielens, 2008).
PAH emission has been broadly utilised to characterise the local and larger-scale environments they inhabit (e.g., Hony et al., 2001; Peeters et al., 2002; Smith et al., 2007; Galliano et al., 2008b; Gordon et al., 2008; Sandstrom et al., 2012; Pilleri et al., 2012; Peeters et al., 2017; Boersma et al., 2018; Maragkoudakis et al., 2018; Zang et al., 2022). This is possible because PAHs are highly susceptible to changing physical conditions in the regions they inhabit, such as metallicity, radiation field, gas temperature, and electron density. All these factors have a direct impact on their abundance, charge state, and size distribution. Consequently, determining the make-up of the astronomical PAH population and its spectral response to changing conditions has become an essential part for characterising astronomical environments.
Empirical calibrations of PAH band strength ratios are frequently used to estimate the PAH ionisation fraction and size distribution. These calibrations rely on assumptions, for example, regarding the PAH size distribution, the stochastic heating of PAHs, the absorption efficiencies, etc. (Schutte et al., 1993; Bregman & Temi, 2005; Draine & Li, 2007; Galliano et al., 2008b; Mori et al., 2012; Stock et al., 2016; Draine et al., 2021).
Alternatively, the PAH charge state and size distribution in astrophysical sources can be inferred by employing a database-fitting approach (e.g., Cami et al., 2010; Andrews et al., 2015; Boersma et al., 2018; Maragkoudakis et al., 2022), and empirical calibrations of PAH properties can be obtained via construction of PAH populations from the ground up (Ricca et al., 2012; Croiset et al., 2016; Maragkoudakis et al., 2020; Knight et al., 2022; Maragkoudakis et al., 2023). The NASA Ames PAH Infrared Spectroscopic Database111www.astrochemistry.org/pahdb/ (PAHdb hereafter; Bauschlicher et al., 2010; Boersma et al., 2014; Bauschlicher et al., 2018; Mattioda et al., 2020) is well-suited for this purpose, as it holds the world’s foremost collection of laboratory-measured and quantum-chemically computed PAH spectra and offer a suite of modelling and (software) analysis tools. Its library of computed spectra, holds spectra of PAHs with various structures, charge states, sizes, and compositions.
In this work, we utilise PAHdb data, models, and tools to examine a range of PAH band intensity ratios to assess their prospective use as tracers for PAH size, offering optimal and alternative PAH size proxies. The importance of alternative tracers is especially relevant for observations with limited wavelength coverage. The James Webb Space Telescope (JWST), for example, is currently delivering a wealth of spectro-photometric observations of PAH-rich sources (e.g., Evans et al., 2022; U et al., 2022; Lai et al., 2022; Chastenet et al., 2022, 2023; Egorov et al., 2023; Dale et al., 2023; Sandstrom et al., 2023), enabling the characterisation of the PAH population even in spatially resolved regions of extra-galactic sources, and requires two separate instruments and observing modes to cover the entire near-to-mid IR wavelength range. JWST observations constrained to the 5-28 µm region (MIRI-MRS) are missing one of the key features for PAH size characterisation, i.e., the 3.3 µm PAH band. For cases where JWST NIRSpec observations are not feasible, alternative PAH size tracers are needed.
2 Methodology And Analysis
The overall methodology and analysis in this work is that followed in Maragkoudakis, Peeters & Ricca (2023, MPR23 hereafter). Specifically, we use the set of PAH spectra defined in MPR23, which in turn is based on the sample of individual PAH molecules defined by Maragkoudakis, Peeters & Ricca (2020, MPR20 hereafter). These spectra were selected from version 3.20 of PAHdb’s library of density functional theory (DFT) computed spectra. The MPR20 set include pairwise neutral and singly charged PAH cations and were selected to meet astronomically relevant criteria. That is, (i) have more than 20 carbon atoms (NC), which is assumed to be the minimum to be able to survive typical interstellar radiation fields (e.g., Allamandola et al., 1989; Puget & Leger, 1989; Allain et al., 1996); (ii) contain no nitrogen, oxygen, magnesium, or iron atoms, in order to examine only “pure” PAH populations; and (iii) have solo C-H bonds to ensure the inclusion of PAHs able to produce the strong astronomical 11.2 µm emission feature, which is frequently employed to quantify PAH charge and size through PAH intensity ratios. The range of NC of the individual PAHs is between 22-216 carbon atoms. For the generation of the emission spectra we consider PAHs exposed to the interstellar radiation field from Mathis, Mezger & Panagia (1983), where the entire emission cascade is taken into account, and the emission bands are convolved using Lorentzian line profiles with a full-width-at-half-maximum of 15 cm-1.
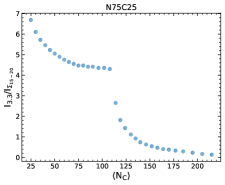
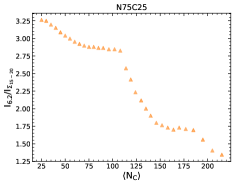
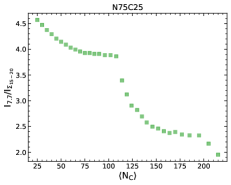
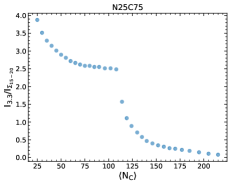
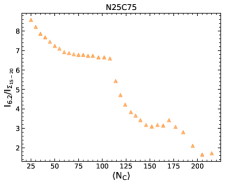
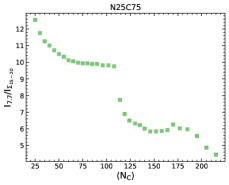
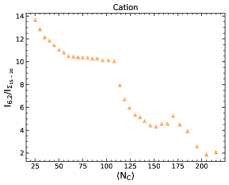
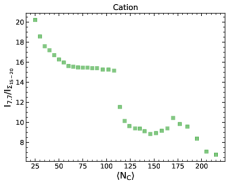
The methodology used to synthesise PAH spectra of varying NC and ionisation fractions is that described in MPR23, and is briefly summarised here. The individual PAH spectra from MPR20 are first separated into bins based on their size, in terms of NC. Subsequently, for each bin the average spectrum is calculated from the combination of the individual spectra within that bin, further weighted with the power-law size distribution from Schutte et al. (1993). The average NC () is also determined for each bin. Then, the total spectrum is calculated by summing the weighted averaged spectrum of each bin. In total, two data sets are created by successively subtracting the averaged weighted spectrum of each bin from the total spectrum by: (i) starting from the smallest size bin and one-by-one subtracting the adjacent bin when moving to larger bins, and (ii) starting from the largest size bin and one-by-one subtracting the adjacent bin when moving to smaller bins. These data sets represent two scenarios for PAH evolution, namely: (1) small PAHs are being removed (or equivalently large PAHs are being formed), and (2) large PAHs are being removed (or equivalently small PAHs are being formed). A drop in the intensity among the two scenarios at 110 is evident due to the removal of the first bin of small PAHs which has the highest weight (see MPR23). In addition to the purely neutral or cationic PAHs, spectra are synthesised from combining a neutral spectrum with that of its cation counterpart with relative neutral–cation contributions of: (i) 75-25 percent (N75C25), (ii) 50-50 percent (N50C50), and (iii) 25-75 percent (N25C75). As a result, PAH spectra of different and ionisation fractions are generated. Here we present results for the N50C50 case. The remainder of ionisation fractions are presented in Appendix A.
The intensities of the prominent computed PAH emission bands at 3.3, 6.2, 7.7, 8.6, and 11.2 µm are measured following MPR20, i.e., as the sum of fluxes in predefined wavebands at a fixed wavelength interval (see MPR20, their Table 1, for details). In addition, the 15-20 µm intensity (I) is measured, which encompasses prominent astronomical features at 16.4 and 17.4 µm, weaker bands at 15.8 and 18.9 µm, and a broad component centred at µm (Van Kerckhoven et al., 2000; Smith et al., 2007; Boersma et al., 2010; Peeters et al., 2012; Shannon et al., 2015).
3 Results And Discussion
Here, we examine and discuss the PAH band intensity ratios that are considered optimal PAH size tracers, i.e., that have the strongest and most well-defined dependence on , as well as alternative PAH size tracers that can be employed instead of the optimal tracers, depending on the observational wavelength coverage.
3.1 Optimal PAH size tracers
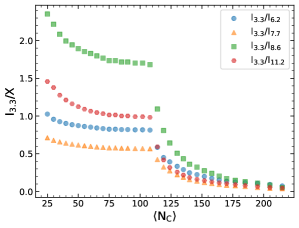
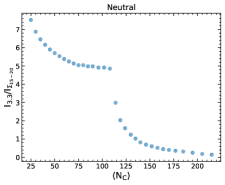
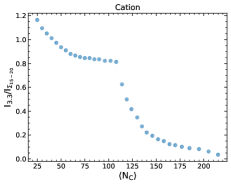
The / PAH band intensity ratio is widely considered the most robust PAH size tracer due to the large difference in attained energy between the 3.3 and 11.2 µm bands, and because both bands are affected similarly by charge, and their emission originates from C-H modes (e.g., Allamandola et al., 1989; Jourdain de Muizon et al., 1990; Schutte et al., 1993; Mori et al., 2012; Ricca et al., 2012; Croiset et al., 2016; Maragkoudakis et al., 2020; Knight et al., 2021; Maragkoudakis et al., 2022). In addition, MPR20 showed that, in the case of single PAH molecules, the correlation between the /, /, /, and / PAH band intensity ratios scale with NC across two orders of magnitude for both neutral and cationic PAHs, with the / ratio having the strongest correlation. In this work we show that these correlations hold for PAH mixtures following a size distribution as well, thus providing a more accurate representation of the PAH population size in astronomical sources. Figure 1 presents these intensity ratios as a function of .
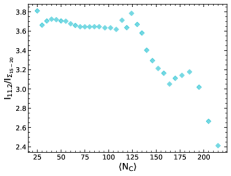
The presence of the correlations is attributed to the 3.3 µm PAH band intensity, which has the strongest dependence on NC among the different bands, as demonstrated by MPR20. The 3.3 µm band involves the stretching vibration of the C-H bonds and has the least dependence on molecular structure, making it the main driver behind the correlations of the intensity ratio of the solo CH out-of-plane to CH stretching mode with NC for neutral, cationic and anionic PAHs. The strong dependence of the 3.3 µm PAH band on is also presented in MPR23 for spectra of PAH mixtures following a size distribution, with the / ratio presenting a monotonic decline and fully separated values across the range. Although the / ratio shows a strong correlation with , in astronomical spectra the 8.6 µm PAH feature can be much more severely impacted by the presence of silicate absorption at 9.7 µm, and in combination with the band’s proximity to the 7.7 µm PAH complex, the decomposition and recovery of the feature can become challenging. In addition, the 6.2, 7.7, and 8.6 µm PAH bands are produced from the contribution of both neutral and cationic PAHs, thus have a dependence on charge state, whereas the 3.3 and 11.2 µm PAH bands are predominantly due to neutral PAHs. Therefore, the similar dependence of and on charge state, as well as the straightforward recovery and measurement of the respective intensities, makes the / PAH band ratio an optimal PAH size tracer for the small-to-intermediate PAH population which contributes significantly to the 3-12 µm PAH spectrum.
3.2 Alternative and qualitative PAH size tracers
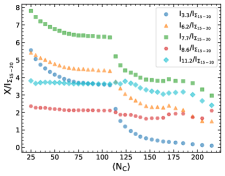
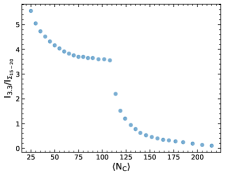
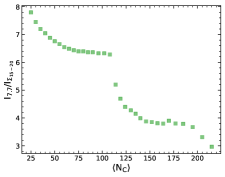
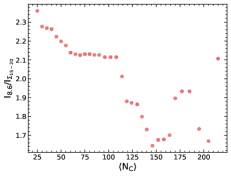
In cases where observations cover a wavelength range without the 3.3 µm PAH band, alternative PAH size tracers are needed. Ideally, these tracers should have considerable wavelength separation to be most sensitive to the size. Smaller PAHs will attain a higher temperature, and thus emit stronger at shorter wavelengths, than larger PAHs upon the absorption of the same photon energy, because they have to redistribute the absorbed energy over a smaller number of available vibrational modes. The 15-20 µm astronomical PAH emission complex is attributed to PAHs significantly larger in size than those held responsible for the emission between 3–12 µm (e.g., Van Kerckhoven et al., 2000; Bauschlicher et al., 2009; Boersma et al., 2010) and thus is a useful candidate for an alternative to the 3.3 µm PAH band. With the 15-20 µm PAH complex being beyond the 10-15 µm region implies that small PAHs contribute even less here to the emission (Allamandola et al., 1989; Schutte et al., 1993; Bauschlicher et al., 2009).
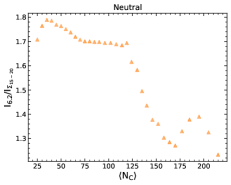
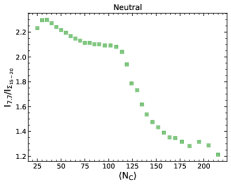
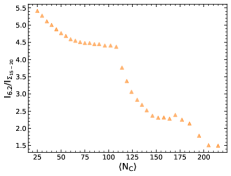
Figure 2 presents the dependency of of /, /, /, /, and / on . As expected, the / ratio shows the most well-defined behaviour, spanning a large dynamic range. The / and / ratios show a weak and non-monotonic dependence on , due to the dependence of and on the number of adjacent solo hydrogens, which has a non-monotonic dependence on (Ricca et al., 2018). Furthermore, for PAHs with straight edges (i.e. with adjacent solo hydrogens) that have 8.6 and 11.2 µm bands, the introduction (or removal) of bay regions on the periphery, which decreases (or increases) the number of solo hydrogens, will have a higher impact on these bands than on the and bands. The / and / intensity ratios are relatively well defined, mostly decreasing monotonically up to 164-170, which flatten, and then continue decreasing. Such fluctuations in the intensity ratios are due to the chemical diversity within a bin, i.e., the relative number of PAHs with straight edges, non-compact PAHs with eroded edges, and elongated PAHs. In addition, Ricca et al. (2012) note that for PAHs larger than 150 carbons the profiles of the 6.2, 7.7, and 8.6 µm bands show significant spectral variations compared to those in astronomical observations, indicating an upper limit to the size of astronomical PAHs.
The nearly monotonic dependence of / and / on can be of value for observations that do not cover the 3.3 µm region, such as JWST MIRI(-MRS)-only observations, assuming sources with comparable PAH size distributions with the described models, i.e., for small-to-intermediate sized PAH populations or for the lower-to-intermediate part of their size distribution (see Section 3.3). For both optimal and alternative PAH size proxies, determination of the PAH ionisation fraction is required, typically estimated using proxies such as the / (e.g., Allamandola et al. 1999; Galliano et al. 2008a; MPR20; MPR23).
3.3 Application to observations
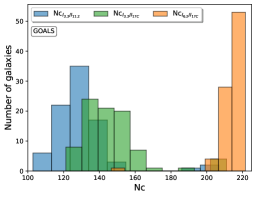
We applied the current models to literature work that combines AKARI and Spitzer/IRS observations, thus includes the 3.3 µm PAH feature from AKARI spectra along with the PAH bands in the 5-20 µm region from Spitzer/IRS. Two independent data sets were employed: (i) 133 galaxies from the GOALS sample (Armus et al., 2009; Stierwalt et al., 2014; Inami et al., 2018), and (ii) 113 galaxies from Lai et al. (2020). The GOALS sample is comprised of LIRGs and ULIRGs spanning a range in merger stage and morphology, while the Lai et al. (2020) sample consists mostly of star-forming galaxies. For the GOALS sample, fixed aperture widths were used to extract AKARI 1D spectra, comparable to the SL Spitzer/IRS aperture size. The extinction corrected 3.3 µm PAH bands were collected from Inami et al. (2018), which were fitted with a Gaussian and a linear function for the local continuum. For the 3.3 µm PAH intensities we further applied the scaling factor described in McKinney et al. (2021) to allow comparison with the Spitzer/IRS PAH features from Stierwalt et al. (2014), which were modelled using the CAFE spectral decomposition code (Marshall et al., 2007). Lai et al. (2020) scaled the AKARI and Spitzer/IRS spectra to match the WISE photometry in order to stitch the separate spectral segments, and modelled the PAH band features using the PAHFIT spectral decomposition code (Smith et al., 2007).
Accurate determination of PAH size requires information on the PAH ionisation fraction within a source, as the different PAH bands have a varying response to ionisation. For the GOALS sample, McKinney et al. (2021) employed the PAH charge-size grid of MPR20 for a 10 eV photon energy, and demonstrated that the galaxies allocate the region between the N25C75 and purely cationic PAHs. Lai et al. (2020) provide information only for the 6.2 µm PAH band, and thus direct application of the MPR20 grid, which uses the / PAH band intensity ratio for the PAH ionisation fraction, could not be done. Instead, we used the parameters defining the correlation between / and / from Maragkoudakis et al. (2018) to estimate /, and assuming an ISRF model grid we found that the galaxies also allocate the region between the N25C75 and purely cationic PAHs, similar to the GOALS sample.
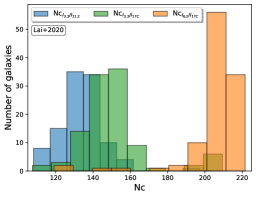
Figure 3 presents the distributions in the two samples, recovered when employing the /, /, and / vs correlations for the N25C75 case (Figures 4 and 5), where each PAH band intensity ratio vs correlation was modelled with a 3rd-degree polynomial. For both samples, the PAH band intensity of the 17 µm complex was provided and used instead of the . The offset between the respective distributions, in both samples, indicates variation between the PAH size distribution among the models and the galaxies. Thus, in this case the / PAH band ratio provides a good description on the small-to-intermediate PAH population, while the / ratio provides insight into the higher end of the PAH size distribution within these sources, as expected (e.g., Schutte et al., 1993). Such a comparison, between the distributions recovered using the current models which are sensitive to the small-to-intermediate PAH populations, can be used to assess the presence (or absence) of a large PAH population in a source.
Interestingly, the offset between the respective distributions is similar for both samples, which opens the possibility for cross-calibration between the size tracers. Specifically, the - offset is on average , and the - offset is on average . Despite differences among the physical properties of the 246 galaxies in both samples combined, observations covering the and PAH features can provide information on the size of the small-to-intermediate PAH population employing the presented model, and offset by . We note that this average offset appears to be insensitive to the applied decomposition method.
In addition, although the X vs correlations may predict higher absolute NC values when applied to observations222Due to lack of proper treatment of anharmonicity effects, affecting mostly the calculation of the intrinsic strength of the C-H modes in neutral PAHs (Mackie et al., 2022), both the X and X correlations can provide insights into the relative difference and variance of between e.g., different regions within a source, or between similar type of sources, independently of delivering an absolute value.
Finally, a detailed cross-calibration between the different PAH size proxies requires homogeneous and high quality observations, such as those delivered by the JWST, covering all the key PAH features, and for consistency, following a uniform reduction and spectral decomposition method. In addition, the ongoing expansion of PAHdb’s library to include larger PAH species as well as PAH clusters, will aid to the expansion and refinement of the current models and the related PAH size proxies.
4 Summary and Conclusions
We examined the dependency of PAH band intensity ratios on using spectra synthesised from mixtures of PAHs that follow a size distribution and at different ionisation fractions, and assessed their effectiveness as tracers for PAH size. Our results and conclusions are:
-
i).
PAH band intensity ratios that include the 3.3 µm PAH band are optimal PAH size tracers, following the efficiency of the / ratio as demonstrated in MPR23, and show a monotonic dependence on consistent with the single-PAH molecule behaviour presented in MPR20. These ratios traces the small-to-intermediate sized PAHs, with the / ratio considered the better choice given the similar dependence of the and PAH bands on charge state.
-
ii).
Band intensity ratios that include features between 15-20 µm and those with large wavelength separation, compared to 15-20 µm, i.e., the 3.3, 6.2, and 7.7 µm bands, trace PAH size and can serve as alternative tracers for the small-to-intermediate sized PAHs, either directly assuming sources with a PAH size distribution on par with the given models, or through application of a cross-calibration factor.
-
iii).
Using PAH band measurements of 246 galaxies from two separate samples, we derived a cross-calibration between the / and / PAH size tracers, for the estimation of of small-to-intermediate PAH populations, for sources with a different PAH size distribution compared to the presented model.
-
iv).
The dependence of the / and / intensity ratios on allows characterisation of the PAH size and the PAH size distribution for small-to-intermediate sized PAHs, without the need for 3.3 µm coverage, for example, with JWST MIRI(-MRS)-only observations, for sources with comparable PAH size distributions with the described models, i.e., for small-to–intermediate PAH populations, or for the lower-to-intermediate part of their size distribution.
Acknowledgements
We thank the anonymous referee for the constructive comments that have improved the clarity of the paper. A.M.’s research was supported by an appointment at NASA Ames Research Center, administered by the Bay Area Environmental Research Institute, and an appointment to the NASA Postdoctoral Program at NASA Ames Research Center, administered by the Oak Ridge Associated Universities through a contract with NASA. E.P. acknowledges support from an NSERC Discovery Grant and a Western Science and Engineering Research Board (SERB) Accelerator Award. C.B. is grateful for an appointment at NASA Ames Research Center through the San José State University Research Foundation (80NSSC22M0107). A.M., A.R. and C.B. gratefully acknowledge support from the “NASA Ames Laboratory Astrophysics Directed Work Package (LADWP) Round 2 ISFM”.
Data Availability
The analysis products of this work will be shared on a reasonable request to the corresponding author.
References
- Allain et al. (1996) Allain T., Leach S., Sedlmayr E., 1996, A&A, 305, 602
- Allamandola et al. (1985) Allamandola L. J., Tielens A. G. G. M., Barker J. R., 1985, ApJ, 290, L25
- Allamandola et al. (1989) Allamandola L. J., Tielens A. G. G. M., Barker J. R., 1989, ApJS, 71, 733
- Allamandola et al. (1999) Allamandola L. J., Hudgins D. M., Sandford S. A., 1999, ApJ, 511, L115
- Andrews et al. (2015) Andrews H., Boersma C., Werner M. W., Livingston J., Allamandola L. J., Tielens A. G. G. M., 2015, ApJ, 807, 99
- Armus et al. (2009) Armus L., et al., 2009, PASP, 121, 559
- Bauschlicher et al. (2009) Bauschlicher Charles W. J., Peeters E., Allamandola L. J., 2009, ApJ, 697, 311
- Bauschlicher et al. (2010) Bauschlicher Jr. C. W., et al., 2010, ApJS, 189, 341
- Bauschlicher et al. (2018) Bauschlicher Charles W. J., Ricca A., Boersma C., Allamandola L. J., 2018, ApJS, 234, 32
- Boersma et al. (2010) Boersma C., Bauschlicher C. W., Allamandola L. J., Ricca A., Peeters E., Tielens A. G. G. M., 2010, A&A, 511, A32
- Boersma et al. (2014) Boersma C., Bregman J., Allamandola L. J., 2014, ApJ, 795, 110
- Boersma et al. (2018) Boersma C., Bregman J., Allamandola L. J., 2018, ApJ, 858, 67
- Bregman & Temi (2005) Bregman J., Temi P., 2005, ApJ, 621, 831
- Cami et al. (2010) Cami J., Bernard-Salas J., Peeters E., Malek S. E., 2010, Science, 329, 1180
- Chastenet et al. (2022) Chastenet J., et al., 2022, arXiv e-prints, p. arXiv:2212.10512
- Chastenet et al. (2023) Chastenet J., et al., 2023, arXiv e-prints, p. arXiv:2301.00578
- Croiset et al. (2016) Croiset B. A., Candian A., Berné O., Tielens A. G. G. M., 2016, A&A, 590, A26
- Dale et al. (2023) Dale D. A., et al., 2023, ApJ, 944, L23
- Draine & Li (2007) Draine B. T., Li A., 2007, ApJ, 657, 810
- Draine et al. (2021) Draine B. T., Li A., Hensley B. S., Hunt L. K., Sandstrom K., Smith J. D. T., 2021, ApJ, 917, 3
- Egorov et al. (2023) Egorov O. V., et al., 2023, ApJ, 944, L16
- Evans et al. (2022) Evans A. S., et al., 2022, ApJ, 940, L8
- Galliano et al. (2008a) Galliano F., Dwek E., Chanial P., 2008a, ApJ, 672, 214
- Galliano et al. (2008b) Galliano F., Madden S. C., Tielens A. G. G. M., Peeters E., Jones A. P., 2008b, ApJ, 679, 310
- Gordon et al. (2008) Gordon K. D., Engelbracht C. W., Rieke G. H., Misselt K. A., Smith J.-D. T., Kennicutt Jr. R. C., 2008, ApJ, 682, 336
- Hony et al. (2001) Hony S., Van Kerckhoven C., Peeters E., Tielens A. G. G. M., Hudgins D. M., Allamandola L. J., 2001, A&A, 370, 1030
- Inami et al. (2018) Inami H., et al., 2018, A&A, 617, A130
- Jourdain de Muizon et al. (1990) Jourdain de Muizon M., Cox P., Lequeux J., 1990, A&A, 83, 337
- Knight et al. (2021) Knight C., Peeters E., Stock D. J., Vacca W. D., Tielens A. G. G. M., 2021, ApJ, 918, 8
- Knight et al. (2022) Knight C., Peeters E., Tielens A. G. G. M., Vacca W. D., 2022, MNRAS, 509, 3523
- Lai et al. (2020) Lai T. S. Y., Smith J. D. T., Baba S., Spoon H. W. W., Imanishi M., 2020, ApJ, 905, 55
- Lai et al. (2022) Lai T. S. Y., et al., 2022, ApJ, 941, L36
- Leger & Puget (1984) Leger A., Puget J. L., 1984, A&A, 137, L5
- Mackie et al. (2022) Mackie C. J., Candian A., Lee T. J., Tielens A. G. G. M., 2022, Journal of Physical Chemistry A, 126, 3198
- Maragkoudakis et al. (2018) Maragkoudakis A., Ivkovich N., Peeters E., Stock D. J., Hemachandra D., Tielens A. G. G. M., 2018, MNRAS, 481, 5370
- Maragkoudakis et al. (2020) Maragkoudakis A., Peeters E., Ricca A., 2020, MNRAS, 494, 642
- Maragkoudakis et al. (2022) Maragkoudakis A., Boersma C., Temi P., Bregman J. D., Allamandola L. J., 2022, ApJ, 931, 38
- Maragkoudakis et al. (2023) Maragkoudakis A., Peeters E., Ricca A., 2023, MNRAS, 520, 5354
- Marshall et al. (2007) Marshall J. A., Herter T. L., Armus L., Charmandaris V., Spoon H. W. W., Bernard-Salas J., Houck J. R., 2007, ApJ, 670, 129
- Mathis et al. (1983) Mathis J. S., Mezger P. G., Panagia N., 1983, A&A, 500, 259
- Mattioda et al. (2020) Mattioda A. L., et al., 2020, ApJS, 251, 22
- McKinney et al. (2021) McKinney J., Armus L., Pope A., Díaz-Santos T., Charmandaris V., Inami H., Song Y., Evans A. S., 2021, ApJ, 908, 238
- Mori et al. (2012) Mori T. I., Sakon I., Onaka T., Kaneda H., Umehata H., Ohsawa R., 2012, ApJ, 744, 68
- Peeters et al. (2002) Peeters E., Hony S., Van Kerckhoven C., Tielens A. G. G. M., Allamandola L. J., Hudgins D. M., Bauschlicher C. W., 2002, A&A, 390, 1089
- Peeters et al. (2012) Peeters E., Tielens A. G. G. M., Allamandola L. J., Wolfire M. G., 2012, ApJ, 747, 44
- Peeters et al. (2017) Peeters E., Bauschlicher Jr. C. W., Allamandola L. J., Tielens A. G. G. M., Ricca A., Wolfire M. G., 2017, ApJ, 836, 198
- Pilleri et al. (2012) Pilleri P., Montillaud J., Berné O., Joblin C., 2012, A&A, 542, A69
- Puget & Leger (1989) Puget J. L., Leger A., 1989, ARA&A, 27, 161
- Ricca et al. (2012) Ricca A., Bauschlicher Charles W. J., Boersma C., Tielens A. G. G. M., Allamandola L. J., 2012, ApJ, 754, 75
- Ricca et al. (2018) Ricca A., Bauschlicher Charles W. J., Roser J. E., Peeters E., 2018, ApJ, 854, 115
- Sandstrom et al. (2012) Sandstrom K. M., et al., 2012, ApJ, 744, 20
- Sandstrom et al. (2023) Sandstrom K. M., et al., 2023, ApJ, 944, L7
- Schutte et al. (1993) Schutte W. A., Tielens A. G. G. M., Allamandola L. J., 1993, ApJ, 415, 397
- Shannon et al. (2015) Shannon M. J., Stock D. J., Peeters E., 2015, ApJ, 811, 153
- Smith et al. (2007) Smith J. D. T., et al., 2007, ApJ, 656, 770
- Stierwalt et al. (2014) Stierwalt S., et al., 2014, ApJ, 790, 124
- Stock et al. (2016) Stock D. J., Choi W. D.-Y., Moya L. G. V., Otaguro J. N., Sorkhou S., Allamandola L. J., Tielens A. G. G. M., Peeters E., 2016, ApJ, 819, 65
- Tielens (2008) Tielens A. G. G. M., 2008, ARA&A, 46, 289
- U et al. (2022) U V., et al., 2022, ApJ, 940, L5
- Van Kerckhoven et al. (2000) Van Kerckhoven C., et al., 2000, A&A, 357, 1013
- Zang et al. (2022) Zang R. X., Maragkoudakis A., Peeters E., 2022, MNRAS, 511, 5142
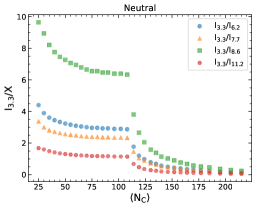
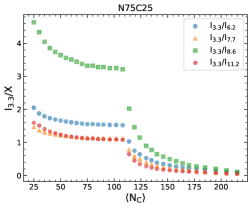
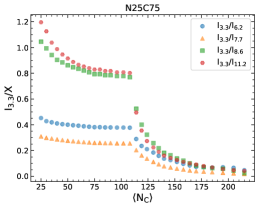
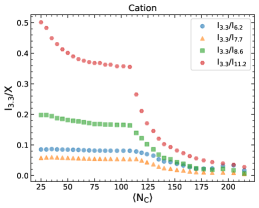
Appendix A PAH Size Tracers for Different Ionisation Fractions
The dependence of the various PAH intensity ratios involving the and intensities, as described in Sections 3.1 and 3.2, are presented in Figures 4 and 5, respectively, for different ionisation fractions, i.e., purely neutral, 75-25 percent neutral-cation (N75C25), 25-75 percent neutral-cation (N25C75), and purely cationic PAHs. The ratios have the most uniform and monotonic dependence on , similar to the N50C50 case. The and intensity ratios are mostly monotonic, with fluctuations present in the 160-200 range that become more apparent when moving progressively to fully cationic PAH populations. For the pure neutral PAHs the ratio is unreliable and the ratio offers a better description among the two ratios.