Contiguous Patches of Translational Hydration Dynamics on the Surface of K-Ras
Abstract
Proteins involved in signaling pathways represent an interesting target for experimental analysis by Overhauser Dynamic Nuclear Polarization (ODNP) (Overhauser Dynamic Nuclear Polarization), which determines the translational mobility at the surface of proteins. They also represent a challenge, since the hydration dynamics at all sites remains relatively rapid, requiring sensitive measurements capable of drawing finer distinctions. Targeting the protein K-Ras, we find ODNP cross-relaxivity values that appear consistent within similar regions of 3D space, regardless of the specific residue where the spin probe used to select the location has been attached. The similar dynamics observed from nearby residues indicate a persistence/uniformity of the translational dynamics of water on the nanometer scale. This results makes sense, since it essentially means that the dynamics of water remains consistent over a lengthscale (a nanometer) over which liquid water exhibits structural persistence (i.e. its correlation length). This opens up the possibility of strategically and comprehensively mapping out the hydration layer in aqueous solution and identifying regions that contribute significantly to the free energy of binding interactions – for example, slow water that might contribute significant entropy, or regions with strongly temperature-dependent water mobility that might contribute significant enthalpy.
I Introduction
This publication presents the experimental characterization of a significant fraction of the surface hydration water that coats the K-Ras signaling protein. Hydration water, present inside and on the surface of proteins, displays significantly different characteristics from bulk water, and these differences in properties likely contribute both to the thermodynamics that drive interactions, as well as to kinetic barriers [Barnes2017, Chong2017, FranckMethEnz2018, Laage2017, Schiro2015]. Ultimately, by better characterizing this water one can better understand – and therefore control – the reactions and interactions of biological macromolecules.
In this context, it is important to distinguish between different categories of macromolecule-associated water molecules. “Bound water” remains hydrogen-bonded (or otherwise trapped) in position even in crystal or powder form [Ball2008]. Previous research has directly demonstrated how some key binding interactions displace such structural bound water molecules [Lam1994RatDesPot, Young2007]. Internal water resides in the cavities of most globular proteins, and evolution conserves some of these much as it does the amino acids [Halle2004ProHydDyna].
Although structural/bound/buried water molecules are clearly of import, the layer of hydration water that envelops protein surfaces, typically 2-3 molecules deep and known as surface or interfacial hydration water (or simply the “hydration layer”), also demonstrates fascinating differences from bulk water [ContiNibali2014_JACS]. Furthermore, despite the fact that water molecules in the interfacial layer constantly exchange positions with bulk water on a relatively fast timescale, they nonetheless exhibit a distinct pattern of varying properties. This unique structure, or “fingerprint,” remains consistent within the protein’s reference frame, even amid the constant flux of water molecules from hydration layer to bulk and vice versa [FranckMethEnz2018, Dahanayake2019]. The hydration layer affects the structure, dynamics, and function of the protein, and is involved as a mediator of protein-protein, and protein-ligand interactions [Ball2008].
Interfacial water is a vital and active constituent of biomolecules, at least to the extent that it helps to determine protein structure [Tanford1962], while some would go as far as to claim that it actively drives a host of motions [Fenimore2002, Frauenfelder2009]. As with structural water, displacement of interfacial water has been shown to be an important factor for stronger ligand binding. Among the different protein surface characteristics, solvation/desolvation characteristics stand out as strong predictors of protein binding interfaces [Burgoyne2006PreProInt, Fiorucci2010PreProInt]. When the surface area of a protein is buried by interaction with another protein, the solvent accessible surface is lost and this loss (desolvation) has been shown to be a driving force for strong protein-ligand binding. Partial desolvation is required for binding as well as providing stability of macromolecular intermediate complexes [Camacho1999FreEneLan]. Compelling evidence from simulations demonstrated that the hydrogen-bonding rearrangements of the interfacial waters are extraordinarily slow at protein surfaces that engage in strong protein-protein binding interactions [Chong2017]. Desolvation forms one of two high energy barriers in the molecular dynamics (MD) simulations of drugs targeting G-protein coupled receptors (GPCRs) [Dror2011PatMecDru]. Besides the expected barrier that is due to the receptor geometry that the ligand traverses before it reaches the binding pocket, an unexpected earlier energy barrier was found located at the surface of the receptor which was suggested to be due to the process of dehydration of both ligand and receptor. The dehydration leads to greater hydrophobic contacts which ascertains the entry of the ligand into the vestibule of the receptor thus preventing its escape back into the bulk water. It has been proposed that during the drug-design process water should be included at the interface as it can mediate hydrogen bonds that lead to higher specificity and affinity [Ladbury1996]. A rational drug design method followed on this proposition where the ligands were structurally modified to enable it to form hydrogen bonds with the interfacial water which lead to enhancement of scores that predict ligand binding affinity [Huang2008ExpOrdWat].
We hypothesize that Ras proteins represent an extreme case with respect to the importance of the hydration layer in guiding and determining interactions. Paradoxically, on the one hand, researchers have traditionally struggled to find small molecule binding sites on the surface of Ras proteins [Cox2014_Ras, Spiegel2014, Moore2020RASTheUnd], while on the other hand, these proteins bind extensively to other proteins as part of their role in signaling pathways [Vetter2001, Moore2020RASTheUnd]. But, the specific role of the interfacial hydration layer of K-Ras in binding interactions remains unclear: Does desolvation actively contribute entropy to the free energy to offset other costs? Or is the interfacial water layer of Ras more bulk-like, simply offering a penalty-free situation in which ligands can form fruitful hydrogen bonds to the K-Ras surface?
Since the hydration water constitutes the first site of contact between the protein and its binding-partner or a ligand, it plays a role in relaying information about the protein to the incoming interactant. By serving as a carrier of protein information, hydration water must therefore exhibit different kinetic and thermodynamic properties at different locations along the protein surface. Additionally, to establish a stable binding, the two interactants must undergo displacement of hydration water. Therefore, understanding the hydration map of the protein will provide us insight into not only the structure and function of a macromolecule but more importantly, the thermodynamic properties of the hydration water will reveal the thermodynamics of binding of ligands and interactants. Slow moving water molecules likely serve as an entropic reservoir, and can be identified by their slow rotational correlation times [Denisov_DNA]. However, translational mobility/diffusivity is an experimentally measurable property that proves particularly intriguing for understanding important motions of proteins. The translational motion likely correlates with changes to larger-scale motions, such as conformational changes and binding interactions [Schiro2015]; it potentially reflects on the energy required to slow down the diffusing water and break the hydrogen bonds at the interface in order to bind to an incoming ligand or interactant.
Overhauser Dynamic Nuclear Polarization (Overhauser Dynamic Nuclear Polarization (ODNP)) offers the unique capability of isolating the contribution of translational dynamics in the presence of bulk water, and with site-specificity. It is a dual-resonance technique that uses nuclear magnetic resonance (Nuclear Magnetic Resonance (NMR)) to study the motion of hydrogen nuclei of water while also employing the sensitivity of electron spin resonance (Electron Spin Resonance (ESR)) to enhance the NMR signal in the presence of bulk water. ODNP provides information on relaxation processes that are measured as 2 types of relaxivities: and lays out slower hydration water dynamics near the magnetic field of the electron present on the spin label which is on 10-100s of nanosecond time-scale whereas gives us information on faster hydration dynamics that are on 10-100s picosecond or faster. is modulated by the waters that are bound and rotating with the protein while ksigma reflects on the hydration waters that move around in the hydration layer due to diffusion or translation. [FranckMethEnz2018]
Therefore, we have employed ODNP to study the hydration dynamics of the N-terminal portion of a globular protein K-Ras. The guanine nucleotide-binding KRas proteins belong to a class of proteins known as small GTPase that function as binary switches in cellular signal transduction pathways that include regulation of cell growth, differentiation, and proliferation [Bourne1990GTPSupCon]. Ras cycles between active guanosine-triphosphate (GTP)-bound and inactive guanosine-diphosphate (GDP)-bound states [Bos2007GEFGAPCri]. GDP-bound form exists as a stable form in the resting cell. Upon growth-factor related stimulation, it is converted to GTP-form with the help of guanine nucleotide exchange-factors (GEFs) (Bos et al 2007). The activated GTP-bound form transmits the signal to the downstream effector proteins such as Raf, Ral-GDS, and PI3K, via direct binding to their Ras-binding domains [Simanshu2017RASProThe]. These effector proteins carry out the sequence of events necessary for the purpose such as cell growth or proliferation. Inactivation of the GTP-form is achieved by GTPase-activating proteins (GAPs) which assist in the hydrolysis of GTP to GDP ([Scheffzek1998GTPProHel] Bos et al 2007). Mutated RAS remains constitutively activated in the GTP-Ras form, losing control of regulation of signal transduction and thereby resulting in uncontrolled growth [Bos1989RasOncHum, Wittinghofer2000RasMolSwi, Prior2012ComSurRas]). About 20-30% of all human cancers are caused due to mutations in RAS genes [Bos1989RasOncHum, Prior2012ComSurRas]. K-Ras is the most frequently mutated gene in most cancers, and K-Ras-4B is found to be the most dominant isoform that is mutated in approximately 90% pancreatic cancers [Biankin2012PanCanGen], 30% to 40% of colon cancers [Neumann2009FreTypKRA], and 15% to 20% lung cancers [Liu2019TarUntKRA]. We therefore employed K-Ras-4B, eliminating the hypervariable region for simplicity, and built a nanometer-specific map of the dynamics of the interfacial water coating K-Ras by generating single cysteine mutants at 13 locations by site-directed mutagenesis.
II Experimental
II.1 Quantitative ESR
Following accepted procedure [E500Manual], a in a 0.8 i.d. capillary tube () exceeds the volume of the ESR cavity with any amount of sensitivity. As the data acquired during ESR spectroscopy is a derivative of the absorption spectrum, integrating twice (the double integral) yields a quantity proportional to the number of spins in the sample. By comparing to a control measurement of a known quantity of nitroxide label in aqueous solution (typically hydroxy-tempo), one can quantify the concentration of solution containing an unknown amount of spin label. Quantitative ESR depends on accurate knowledge of the -factor of the resonator. As we have found the XEPR determination of the Q factor to be imprecise and unreliable, we employ a code snippet based on customxepr [customxepr] to capture the tuning curve (reflection profile) of the resonator, and ensure that it matches that of the hydroxytempo control.
II.2 ODNP
ODNP was performed following standard protocols.
II.3 K-Ras expression and purification
K-Ras plasmid was secured from addgene, and expression and purification followed existing protocols. The expression was specifically optimized to target an ODNP and ESR culture size, which is smaller than that of e.g. NMR analysis and allows for parallel in-house (i.e. without a biochemical core facility) expression of up to 4 mutants at a time.
III Results
III.1 S-(1-oxyl-2,2,5,5-tetramethyl-2,5-dihydro-1H-pyrrol-3-yl)methyl methanesulfonothioate) (MTSL) covalently binds to Ras at targeted sites
K-Ras contains an N-terminal G domain that consists of 1-169 residues and includes several conserved functional features known as switch regions [Pantsar2020CurUndKRA]. The C-terminal region known as hypervariable region (HVR) helps anchor Ras to the cell membrane by undergoing post-translational modifications at a cysteine. For simplicity, we expressed only the G-domain, without the hypervariable region, and substituted the 3 remaining native cysteines following existing protocols [Wind1999Ras] before expressing targeted cyteine mutants that could accept precise placement of a stable nitroxide radical-based spin-label S-(1-oxyl-2,2,5,5-tetramethyl-2,5-dihydro-1H-pyrrol- 3-yl)methylmethanesulfonothioate (MTSL).
In particular, the binding site of a macromolecular drug cyclic peptide (cyclorasin 9A5) was mapped by 1H-15N Heteronuclear Single Quantum Correlation (HSQC) NMR spectroscopy [Upadhyaya2015] and found to be an extended area between switch I and switch II loops, within the Ras-Raf interaction site, same site as small molecule ligands such as DCAI [Maurer2012SmaLigBin] that was identified by a fragment-based screening [Sun2012DisSmaMol, Maurer2012SmaLigBin]. The locations for Site-Directed Spin-Labeling (SDSL) (site-directed spin-labeling) were chosen near the cyclic peptide binding site.

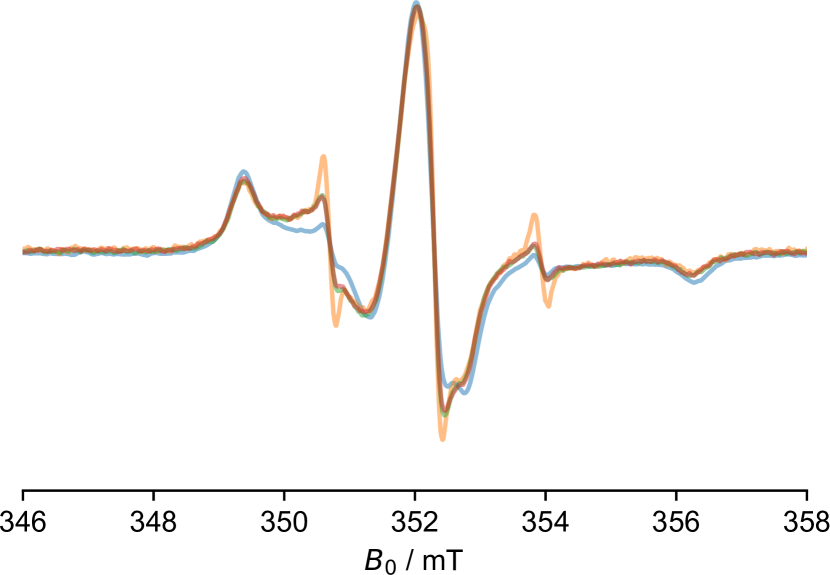
SDSL identifies the sites of interest on the protein’s surface, forming the basis for implementing ODNP. We first verify the success of SDSL by inspecting the ESR spectra of all the mutants. While ESR spectra of free (not covalently attached) spin label typically yield three peaks whose derivatives have equal height, spin labels covalently attached to proteins yield spectra of distinctly different shapes.
It is worth noting that L118R1a in fig. 1 represents a spin label with qualitatively more dynamic behavior of the spin label vs. the other mutants; this may indicate that the mutagenesis and spin labeling has disrupted the dynamics at this site, but may also simply be reporting on significant flexibility at the labeling site. Regardless, even in this case, the spectral data differs significantly from the three equal derivative peaks expected from a free spin label, clearly indicating covalent attachment of the MTSL to the cysteine.
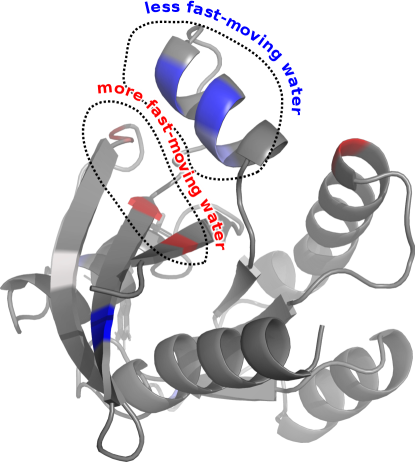
N-terminal portion of K-Ras, known as G-domain, that contains 169 residues. K-Ras serves as a model for a fairly large sized soluble protein that also has a significance as an oncogene. N-terminus of K-Ras contains 3 native cysteines that were mutated to either serine or leucine as these substitutions do not render the protein inactive [Sondermann2005]. On the cysteine-less K-Ras background 12 single cysteine mutations were generated to attach the spin-label, MTSL, in order to study hydration dynamics around a single site at a time. The residues measured are shown in fig. 3 in red and blue.
A specific region of K-Ras participates in its function, specifically, the residues located in the conserved switch regions are involved in binding to the regulators GEFs and GAPs as well as its effector proteins that are involved in the downstream signaling. The same region is involved in drug binding. Small molecule drug ligand DCAI (Maurer et al., 2012) and a macromolecular drug cyclic peptide, cyclorasin 9A5, [Upadhyaya2015] have been shown to bind to an extended area between switches 1 and II. Cyclic peptide contact sites are shown in Fig. 2. The residues selected for cysteine mutations for this study are located in the cyclic peptide binding region.
CW X-band ESR spectrum of purified and spin-labeled K-Ras mutants were collected to determine if K-Ras is spin-labeled with MTSL in which case it exhibits a broad line shape. Fig. 3 shows ESR spectra of K-Ras mutants. The broad line shape of these spectra compared to the free spin label confirms the spin-labeling of K-Ras mutants. Mutants exhibit differences in the ESR spectra that can be broadly divided into 2 classes based on the presence or absence of the immobile component. The size of immobile component can be used as the basis for further distinguishing them into 3 categories: small immobile component, big immobile component, and broad peak where the immobile component does not show a clear distinct bump but continues to rise into the mobile component. The presence of mobile and immobile component suggests a distribution of rotamers that fall into two groupings with two different order parameters (e.g., a spin label that spends more time at one particular site, but occasionally escapes on wider trajectories).
The differences in ESR spectra relate to the orientation of the amino acid residue (Fig. 2); if the residue faces outward then it displays more mobility whereas a residue facing inward into the core of the protein experiences reduction in its mobility giving rise to an immobile component on the ESR.
III.2 ESR provides concentration to enable relaxivity calculations
As noted in the theory section, ODNP in the presence of a fully saturated ESR transition yields a quantity proportional to , where is the concentration of the spin label while the cross-relaxation rate () is the primary quantity of interest for understanding the molecular dynamics of water. Therefore, normalization by the concentration of the spin-label forms an essential element of the experimental strategy here. As noted in the Experimental section, the double integral of the ESR data provides the concentration of spin label. However, we observe that 5-10% variation in the concentration reported by Quantitative Electron Spin Resonance (QESR) for the same sample is not uncommon. relatively insignificant variations in the baseline of the ESR spectra can lead to even for samples This is even true with the controls mentioned in the experimental section and with customized code that allows detailed control over the process of baseline correction and double integration. Inspecting controlled cases of such variation reveals very similar spectra with nearly identical amplitudes, and reveals that relatively insignificant variations in the baseline of the ESR spectra lead to the 5-10% variation reported by QESR.
As part of this study, we repeat the acquisition of ESR and ODNP data for each SDSL mutant several times, in order to average out any small experimental discrepancies or small discrepancies in sample preparation. This repetition also affords the opportunity to more accurately quantify the QESR concentration.
We find that many such issues can be rectified with a simple program that determines the relative scaling of the different repeated datasets needed to minimize the least-squares difference between the spectra as shown in fig. 2. First, this presentation notably highlights small differences in the spectra – whether arising from small free spin label contaminant (acceptable) or protein-protein interactions at higher concentration (not acceptable). Returning to the problem of accurate spin label quantification, the average of the double integral for all valid samples averages discrepancies due to small baseline differences, while the scalings needed to determine the rms difference provide the precise relative concentrations of the different samples (avoiding issues with small baseline variations).
III.3 Surface-Exposed Sites Yield Significant Hyperpolarization
Even very raw data exhibits noticeable differences from transmembrane protein samples or lipid bilayer samples that have been studied by ODNP previously. Noticeably, even though the spin-labeled protein concentrations in play are hundreds of micromolar, the samples here routinely yield a signal enhancement of the water signal ranging between to the Boltzmann polarization that an aqueous sample yields in the absence of ODNP. Not surprisingly, the resulting cross-relaxation values , tend to be a significant fraction of the 95 s-1M-1, the relaxivity of a small molecule spin label dissolved in bulk water [FranckPNMRS].
| Mutant | / s-1M-1 |
|---|---|
| I21R1a | 49 |
| I36R1a | 73 |
| E37R1a | 65 |
| K42R1a | 56 |
| S51R1a | 38 |
| L56R1a | 70 |
| M67R1a | 41 |
| Q70R1a | 41 |
| Y71R1a | 49 |
| V103R1a | 73 |
| L118R1a | 46 |
NMR signal enhancement depends on the concentration of the spin-labeled sample. Such enhancements show that we have a significant concentration of spin-labeled sample that is suitable to obtain ODNP data.
III.4 Cross-Relaxivity Measurements Demonstrate Consistency in 3D Space
Beginning this study, we were interested in observing the dynamics of interfacial hydration water near the binding sites of the cyclic polypeptide cyclorasin 9A5. As the location of the R1a sidechains determines which portion of the hydration water is observed with each measurement, the location of the R1a sidechains were chosen primarily as outward-facing sidechains (i.e. mutants where the native amino-acid sidechain facing the solvent) near the binding site of cyclorasin 9A5 [Upadhyaya2015]. The chosen residues served as probes looking into the water dynamics near the region that interact with the cyclic peptide. As a result, the R1a sidechains of the resulting samples were both surface-exposed and clustered in a similar region of space.
For example, one might assume that the interfacial hydration water in this region moved particularly slowly, and that the desolvation of the surface offered up an entropic contribution to aid in the binding of the cyclic polypeptide. However, as noted in tbl. 1, much of the cross-relaxation contributions represent a significant fraction of the 95 s-1M-1 cross-relaxation rate of a small spin label in water. The cross-relaxation rate, , is specifically sensitive to the fast motion on 100s of ps timescale. It depends on the motion of the water molecules that diffuse fast near the spin label within 5-10 Å sphere around the nitroxide spin label. If the residue is exposed to the water, we expected to see a faster diffusion of water near the spin and therefore a higher value of , whereas a buried residue would give yield a lower . Therefore, the present result means that there are nearly as many water molecules moving nearly as fast as in bulk. We do not see the 5-fold slow-downs observed e.g. with previous studies of CheY and certainly not the more dramatic slowdowns seen with Annexin XII [Barnes2017, FranckMethEnz2018]. With this data in hand, we are reminded that many Ras binding events are predicted to be primarily enthalpically driven, so that a very large contribution to the entropy of binding from desolvation might not be required or expected. In other words, this might represent an intriguing experimental case where – perhaps because of the relative smoothness of its surface – K-Ras does not offer the opportunity to release free energy in the form of entropy through desolvation of its surface.
As noted in the introduction, a key motivation behind these measurements is to understand how desolvation (removal of the interfacial hydration water to make way for binding partners or ligands) contributes to the free energies of binding of binding partners or lead molecules. As already noted, the measurements support the conclusion that in the case of K-Ras, this desolvation doesn’t encourage binding through very large entropic contributions. That said, they nonetheless point out that some limited contribution could
More broadly, however, fig. 3 indicates how spin labels exposed to the surface at nearby sites observe similar dynamics. Patches of residues adjacent to each other in space report values that are similar, and indicate the persistence of similar dynamics on the nanometer scale. This results makes sense, since it essentially means that the dynamics of water remains consistent over a lengthscale (a nanometer) over which liquid water exhibits structural persistence (i.e. its correlation length). This encourages a strategy where dense labeling, as in the present case or with even denser or more extensive SDSL, can map out these continuous patches of water, while future measurements can then interrogate how the different discrete patches respond to – e.g. changes in temperature, binding or ligands, or deliberate manipulation of the hydration properties through limited engineering of surface-displayed side-chains.
IV Conclusions
While several transmembrane and membrane associated proteins have been studied with ODNP, relatively few studies have focused on the dynamics of the hydration water coating the surface of globular signaling proteins. Because of its importance, and the long-standing challenges it has posed to drug design, we were motivated to scrutinize K-Ras through a new lens, focusing on the behavior of hydration water on its surface. In particular, we were motivated to perform measurements on several mutants that were designed to display R1a (i.e. spin label) sidechains on the surface where various drug candidates (lead compounds) or binding partners are known to bind.
The fact that we observe similar dynamics at nearby residues on the surface of K-Ras indicates a persistence/uniformity of the 10-100 ps water dynamics on the nanometer scale. By strategically choosing just one or two labeling sites in order to observe a particular patch, and then combining results from such nanometer patches, one can now comprehensively map out the hydration layer in aqueous solution and identify regions that contribute significantly to the free energy of binding interactions – for example, slow water that might contribute significant entropy, or regions with strongly temperature-dependent water mobility that might contribute significant enthalpy.